Embed Size (px)
Citation preview

Page 1 of 12
Mortality Monitoring Bulletin Infant mortality, inequalities Update to include data for 2010 Published 8 December 2011 Key findings:
• In 2008-10, the infant mortality rate in England and Wales (based on infant deaths successfully linked to their birth records) fell to 4.4 deaths per 1,000 live births - the lowest three-year average infant mortality rate ever recorded for England and Wales.
• In 2008-10, infant mortality rates remain higher than average for babies with fathers in routine and manual occupations (at 4.7 deaths per 1,000 live births), and for births registered by the mother alone (at 5.9 deaths per 1,000 live births).
• Infant mortality rates remained lowest for babies whose fathers were in managerial and professional occupations, at 3.1 deaths per 1,000 live births.
• Since 2002-04, infant mortality rates have fallen across all socio-economic groups with a larger decrease in the Routine and Manual group, resulting in a narrowing of the social gradient. Between 2002-04 and 2008-10, rates fell by 20% in the Routine and Manual group, compared with 8% in the Managerial and Professional group.
• The absolute gap in infant mortality rates between the Routine and Manual group and the average for all births with socio-economic group assigned has narrowed by 53% since 2002-04. The relative gap also narrowed by 46% over the same period.
Contact details:
Public Enquiries: 020 7210 4850 Press Office: 020 7210 5221
Responsible Statistician: Sue Graves
Technical query: 020 7972 3225 / [email protected]
Page 2 of 12
Contents Section Page
Introduction 3
Mortality Monitoring:
Infant mortality 4
Annex A: Technical Notes 8
Annex B: Former government target on inequalities in infant mortality 11
References 12
List of Tables and Charts Table Title Page 1a Infant mortality by NS-SEC and type of registration 6 1b Infant mortality – Routine and Manual group and All groups 6
Chart Title Page
1a Infant mortality by NS-SEC and for sole registrations 7
1b Infant mortality – Routine and Manual group and All groups 7

Page 3 of 12
Introduction This statistical release presents data on infant mortality rates for England and Wales by socio-economic group, based on the National Statistics Socio-Economic Classification (NS-SEC). It updates previously published figures to include the latest available three-year average figures (for 2008-10). It updates the data reported in 2010 in the bulletin:
• ‘Mortality Monitoring Bulletin: (Infant mortality, inequalities): Update to include data for 2009.’1
Trend data are shown starting from 2002-04 (the first period following the introduction of NS-SEC in 2001*), alongside the overall change since the start of this period. Figures for 1997-99† are also included to show changes over a longer period. This document follows the release by the Office for National Statistics (ONS) of infant mortality data by social and biological factors for the single year 2010 (these figures are provisional)2.
This document is the latest in a series of mortality monitoring bulletins published since 2007, initially to present data relating to a former government target on inequalities in infant mortality (see Annex B). We plan to review the format and content of this bulletin before the next annual update in the light of the indicators in the Transparency section of the Department of Health Business Plan 2011-154, and the forthcoming Public Health Outcomes Framework5. We would welcome feedback on this bulletin – please send any comments to [email protected].
* Data for 2001 are also available for some, but not all, the NS-SEC groups presented in this document (see, for example, data presented in previous editions of this bulletin) † 1997-99 was the baseline period for the former government target on inequalities in infant
mortality associated with the data presented in this bulletin (see Annex B for further details)

Page 4 of 12
Infant mortality The tables and charts below show recent trends in infant mortality rates in England and Wales by socio-economic group based on father’s occupational status, using the three-class version of the National Statistics Socio-Economic Classification (NS-SEC). Infant mortality rates are also shown for sole registered births (i.e. births registered by the mother alone), for which NS-SEC cannot be assigned. Figures are shown for rolling three-year periods from 2002-04 (the first period following the introduction of NS-SEC in 2001*) to the most recent period for which data are available. Figures for 1997-99 are also presented to show changes over a longer period†. All figures in this bulletin are based on infant deaths that have been successfully linked to their corresponding birth records (covering 98 per cent of infant deaths in 2008-10). Figures for 2008-10 are provisional. Overall infant mortality In 2008-10, there were 9,367 linked infant deaths in England and Wales, corresponding to a rate of 4.4 deaths per 1,000 live births. This is the lowest three-year average infant mortality rate ever recorded for England and Wales. For births registered jointly by both parents (i.e. excluding sole registered births, for which NS-SEC cannot be assigned), there were 8,588 infant deaths in 2008-10. The corresponding infant mortality rate was 4.3 deaths per 1,000 live births, a decrease of 14% since 2002-04 (when the rate was 5.0 deaths per 1,000 live births). By NS-SEC There is a social gradient in infant mortality by NS-SEC (three-class version), with the lowest rates continuing to occur among babies with fathers in managerial and professional occupations. In 2008-10, the rate for the Routine and Manual group was 4.7 deaths per 1,000 live births, compared with 3.1 deaths per 1,000 live births for the Managerial and Professional group. Infant mortality rates are highest for the ‘Other’ group (5.4 deaths per 1,000 live births in 2008-10). This covers babies with fathers who have never worked, are long term unemployed or students, or whose occupational details could not be classified. Rates may vary between these different sub-groups, so figures for the ‘Other’ group should be interpreted with caution. Since 2002-04, infant mortality rates have fallen across all socio-economic groups. The largest decrease has been in the Routine and Manual and ‘Other’ groups, resulting in a narrowing of the social gradient. Between 2002-04 and 2008-10, rates fell by 42% in the Other group (with the largest falls occurring in the three time periods since 2005-07). Rates fell by 20% in the Routine and Manual group over the same period, compared with 8% in the Managerial and Professional group.
* Data for 2001 are also available for some, but not all, the NS-SEC groups presented in this document (see, for example, data presented in previous editions of this bulletin). † The 1997-99 figures are based on an approximation to NS-SEC categories (called NS-SEC
90) available for use with data prior to 2001
Page 5 of 12
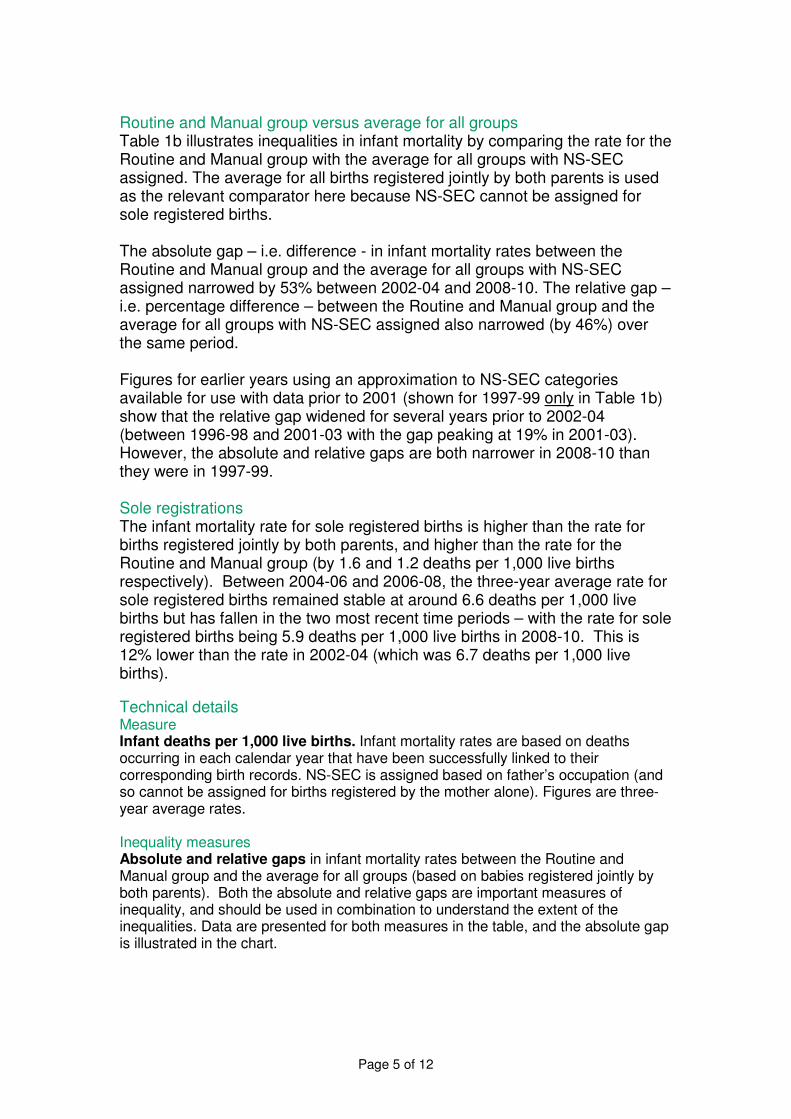
Routine and Manual group versus average for all groups Table 1b illustrates inequalities in infant mortality by comparing the rate for the Routine and Manual group with the average for all groups with NS-SEC assigned. The average for all births registered jointly by both parents is used as the relevant comparator here because NS-SEC cannot be assigned for sole registered births. The absolute gap – i.e. difference - in infant mortality rates between the Routine and Manual group and the average for all groups with NS-SEC assigned narrowed by 53% between 2002-04 and 2008-10. The relative gap – i.e. percentage difference – between the Routine and Manual group and the average for all groups with NS-SEC assigned also narrowed (by 46%) over the same period. Figures for earlier years using an approximation to NS-SEC categories available for use with data prior to 2001 (shown for 1997-99 only in Table 1b) show that the relative gap widened for several years prior to 2002-04 (between 1996-98 and 2001-03 with the gap peaking at 19% in 2001-03). However, the absolute and relative gaps are both narrower in 2008-10 than they were in 1997-99. Sole registrations The infant mortality rate for sole registered births is higher than the rate for births registered jointly by both parents, and higher than the rate for the Routine and Manual group (by 1.6 and 1.2 deaths per 1,000 live births respectively). Between 2004-06 and 2006-08, the three-year average rate for sole registered births remained stable at around 6.6 deaths per 1,000 live births but has fallen in the two most recent time periods – with the rate for sole registered births being 5.9 deaths per 1,000 live births in 2008-10. This is 12% lower than the rate in 2002-04 (which was 6.7 deaths per 1,000 live births).
Technical details Measure Infant deaths per 1,000 live births. Infant mortality rates are based on deaths occurring in each calendar year that have been successfully linked to their corresponding birth records. NS-SEC is assigned based on father’s occupation (and so cannot be assigned for births registered by the mother alone). Figures are three-year average rates. Inequality measures Absolute and relative gaps in infant mortality rates between the Routine and Manual group and the average for all groups (based on babies registered jointly by both parents). Both the absolute and relative gaps are important measures of inequality, and should be used in combination to understand the extent of the inequalities. Data are presented for both measures in the table, and the absolute gap is illustrated in the chart.
Page 6 of 12
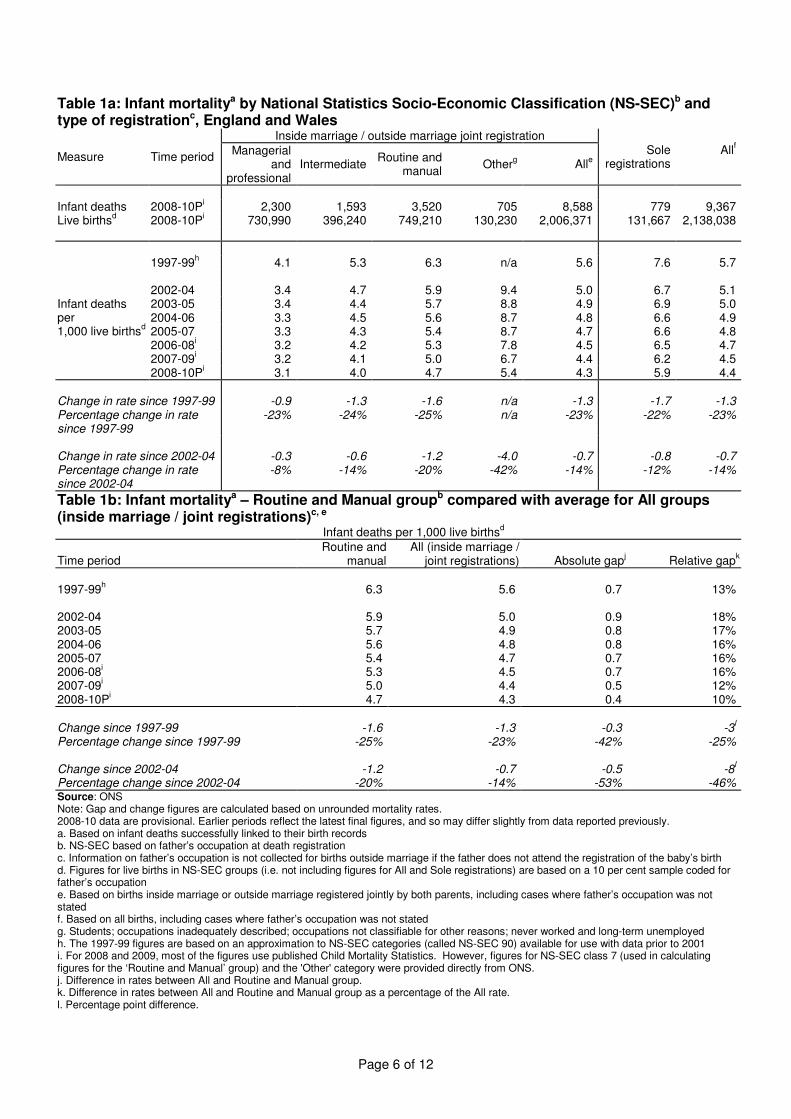
Table 1a: Infant mortalitya by National Statistics Socio-Economic Classification (NS-SEC)b and type of registrationc, England and Wales
Measure Time period
Inside marriage / outside marriage joint registration Sole
registrations
fAll
Managerial
and professional
Intermediate Routine and
manual g
Othere
All
nfantI deaths
i2008-10P 2,300 1,593 3,520 705 8,588 779 9,367
d iveL births
i2008-10P 730,990 396,240 749,210 130,230 2,006,371 131,667 2,138,038
h
1997-99 4.1 5.3 6.3 n/a 5.6 7.6 5.7 2002-04 3.4 4.7 5.9 9.4 5.0 6.7 5.1
nfantI deaths 2003-05 3.4 4.4 5.7 8.8 4.9 6.9 5.0 erp 2004-06 3.3 4.5 5.6 8.7 4.8 6.6 4.9 ,0001
dlive births 2005-07 3.3 4.3 5.4 8.7 4.7 6.6 4.8
i2006-08 3.2 4.2 5.3 7.8 4.5 6.5 4.7
i2007-09 3.2 4.1 5.0 6.7 4.4 6.2 4.5
i2008-10P 3.1 4.0 4.7 5.4 4.3 5.9 4.4
hangeC in rate since 1997-99 ercentageP change in rate inces 1997-99
hangeC in rate since 2002-04 ercentageP change in rate inces 2002-04
-0.9
-23%
-0.3 -8%
-1.3
-24%
-0.6
-14%
-1.6
-25%
-1.2
-20%
n/a n/a
-4.0
-42%
-1.3 -23%
-0.7
-14%
-1.7
-22%
-0.8
-12%
-1.3 -23%
-0.7
-14%
Table 1b: Infant mortalitya – Routine and Manual groupb compared with average for All groups (inside marriage / joint registrations)c, e
d
Infant deaths per 1,000 live births
Time period Routine and
manual All (inside marriage /
joint registrations) Absolute j
gap Relative k
gap
h1997-99
2002-04 2003-05 2004-06 2005-07
i2006-08
i2007-09
i2008-10P
6.3
5.9 5.7 5.6 5.4 5.3 5.0 4.7
5.6
5.0 4.9 4.8 4.7 4.5 4.4 4.3
0.7
0.9 0.8 0.8 0.7 0.7 0.5 0.4
13%
18% 17% 16% 16% 16% 12% 10%
Change since 1997-99 Percentage change since
Change since 2002-04 Percentage change since
1997-99
2002-04
-1.6
-25%
-1.2 -20%
-1.3
-23%
-0.7 -14%
-0.3
-42%
-0.5 -53%
l
-3-25%
l
-8 -46%
Source: ONS Note: Gap and change figures are calculated based on unrounded mortality rates. 2008-10 data are provisional. Earlier periods reflect the latest final figures, and so may differ slightly from data reported previously. a. Based on infant deaths successfully linked to their birth records b. NS-SEC based on father’s occupation at death registration c. Information on father’s occupation is not collected for births outside marriage if the father does not attend the registration of the baby’s birth d. Figures for live births in NS-SEC groups (i.e. not including figures for All and Sole registrations) are based on a 10 per cent sample coded for father’s occupation e. Based on births inside marriage or outside marriage registered jointly by both parents, including cases where father’s occupation was not stated f. Based on all births, including cases where father’s occupation was not stated g. Students; occupations inadequately described; occupations not classifiable for other reasons; never worked and long-term unemployed h. The 1997-99 figures are based on an approximation to NS-SEC categories (called NS-SEC 90) available for use with data prior to 2001 i. For 2008 and 2009, most of the figures use published Child Mortality Statistics. However, figures for NS-SEC class 7 (used in calculating figures for the ‘Routine and Manual’ group) and the 'Other' category were provided directly from ONS. j. Difference in rates between All and Routine and Manual group. k. Difference in rates between All and Routine and Manual group as a percentage of the All rate. l. Percentage point difference.
Page 7 of 12
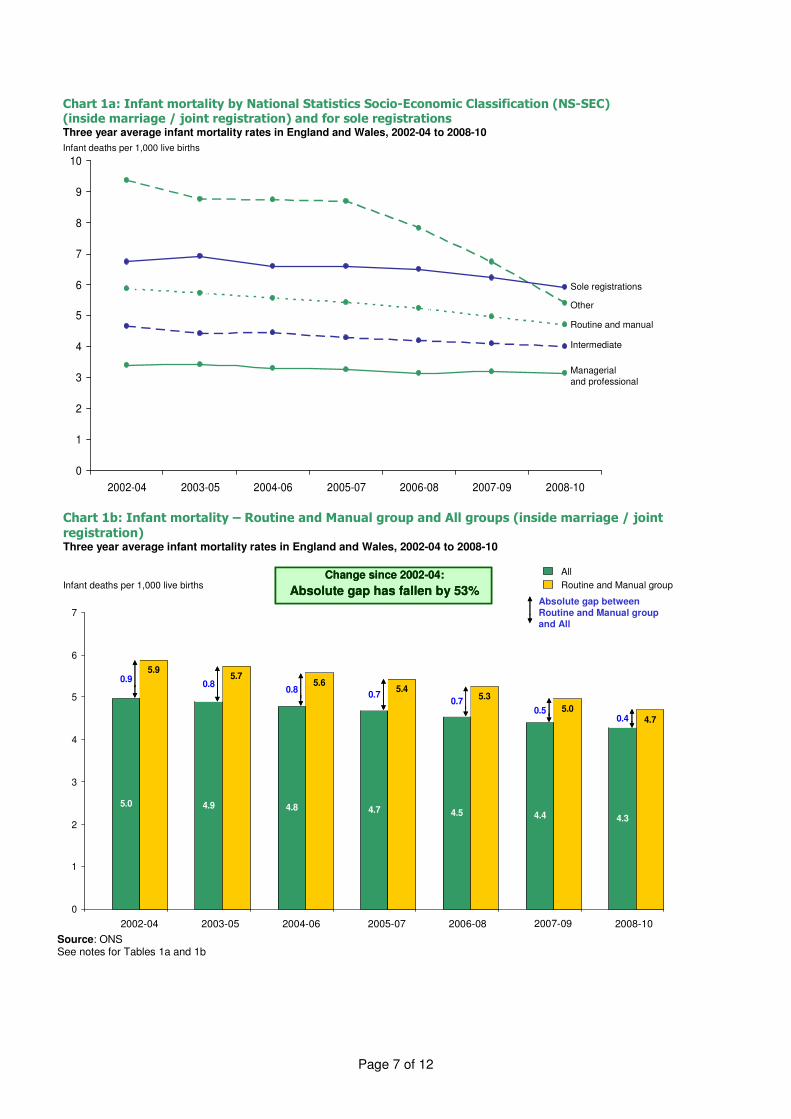
Chart 1a: Infant mortality by National Statistics Socio-Economic Classification (NS-SEC) (inside marriage / joint registration) and for sole registrations
AllChange Change since since 2002-04:2002-04:nfantI deaths per 1,000 live births Routine and Manual group
Absolute Absolute gap gap has has fallenfallen by by 53%53%Absolute gap between
7 Routine and Manual group and All
6
5.95.70.9
0.8 5.60.8 5.4
5 0.7 5.30.7
0.5 5.00.4 4.7
4
3
5.0 4.9 4.8 4.7 4.5 4.4 4.32
1
0
2002-04 2003-05 2004-06 2005-07 2006-08 2007-09 2008-10
Chart 1b: Infant mortality – Routine and Manual group and All groups (inside marriage / joint registration)Three year average infant mortality rates in England and Wales, 2002-04 to 2008-10
Source: ONS See n
otes for Tables 1a and 1b
6 6 6 55
55
0
1
2
3
4
5
6
7
8
9
10
2002-04 2003-05 2004-06 2005-07 2006-08 2007-09 2008-10
Three year average infant mortality rates in England and Wales, 2002-04 to 2008-10
Infant deaths per 1,000 live births
Sole registrations
Other
Routine and manual
Intermediate
Managerial
and professional
Page 8 of 12
Annex A: Technical Notes These technical notes cover the following topics:
•
•
•
•
Monitoring methodology
Infant deaths and live births
National Statistics Socio-Economic Classification (NS-SEC)
Explanation of absolute and relative inequality gaps
Monitoring methodology This statistical bulletin shows time-series for infant mortality rates by socio-economic group. The information presented has been derived from statistical products produced outside the Department of Health by the Office for National Statistics (ONS). ONS publish data on infant mortality in England and Wales by social and biological factors, including NS-SEC and type of registration, on an annual basis. In this bulletin: • Figures for single years between 2002 and 2007 are taken from annual
child mortality statistics volumes3. • For 2008 and 2009, most of the figures use the annual child mortality
statistics volumes3. However, figures for NS-SEC class 7 (used in calculating figures for the ‘Routine and Manual’ group) and the 'Other' category were provided directly from ONS.
• Provisional 2010 figures are taken from the latest report on Infant and perinatal mortality in England and Wales by social and biological factors2.
In this bulletin, three-year rolling averages are used for monitoring purposes in preference to single year figures. This is in order to produce a smoothed trend from the data and to ensure the underlying trend is captured rather than year-on-year fluctuations.
Infant deaths and live births The figures in this report are based on infant deaths and live births occurring in England and Wales in each calendar year. Infant deaths are deaths at ages under one year. The figures in this report are based on infant deaths that have been linked to their birth records, so the overall infant mortality rate presented in this bulletin may differ slightly from figures quoted elsewhere based on all infant deaths. In 2008-10 the linked infant deaths covered 98 per cent of all infant deaths (a comparable linkage rate to previous time periods). The linkage enables analysis of infant deaths by birth registration status (i.e. whether the birth was registered jointly by both parents or was registered by the mother alone) - this is important for the analysis by NS-SEC category presented in this report because NS-SEC cannot be assigned for births registered by the mother alone, as explained below. NS-SEC category is assigned based on the father’s occupation and employment status. This information is collected at birth registration for babies born within marriage or outside marriage when registered jointly by both parents. Thus, NS-SEC based on father’s occupation cannot be assigned for
Page 9 of 12
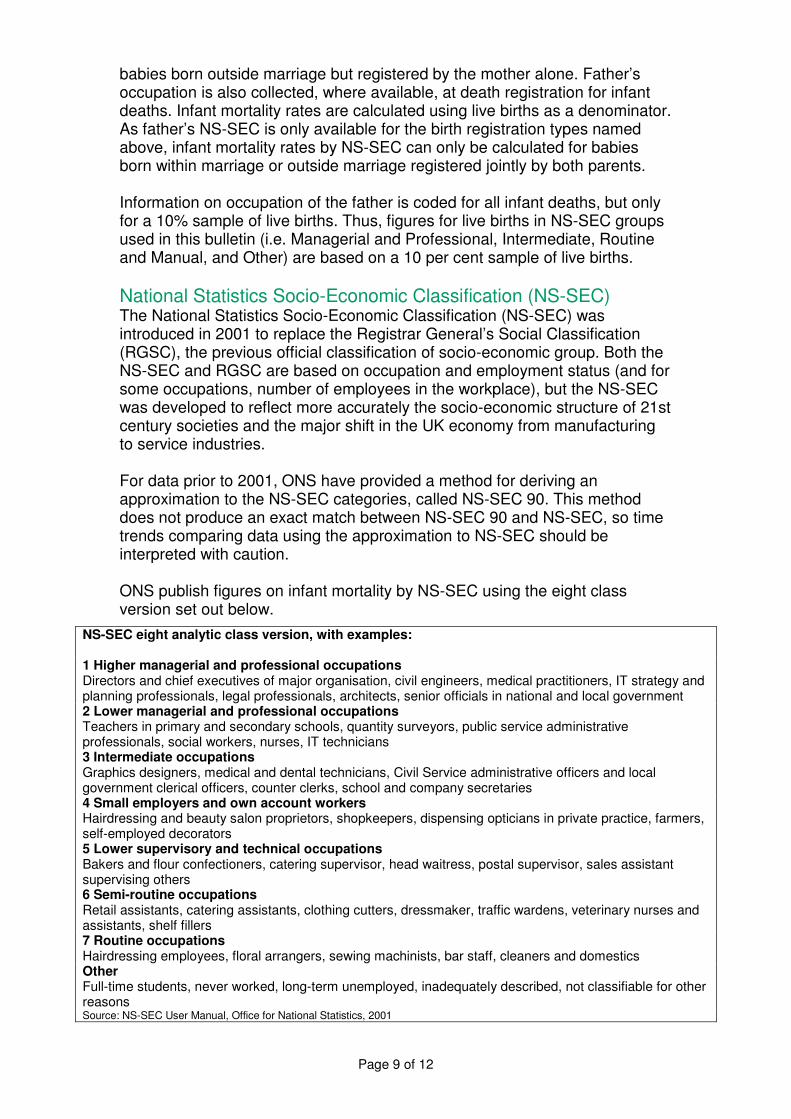
babies born outside marriage but registered by the mother alone. Father’s occupation is also collected, where available, at death registration for infant deaths. Infant mortality rates are calculated using live births as a denominator. As father’s NS-SEC is only available for the birth registration types named above, infant mortality rates by NS-SEC can only be calculated for babies born within marriage or outside marriage registered jointly by both parents. Information on occupation of the father is coded for all infant deaths, but only for a 10% sample of live births. Thus, figures for live births in NS-SEC groups used in this bulletin (i.e. Managerial and Professional, Intermediate, Routine and Manual, and Other) are based on a 10 per cent sample of live births.
National Statistics Socio-Economic Classification (NS-SEC) The National Statistics Socio-Economic Classification (NS-SEC) was introduced in 2001 to replace the Registrar General’s Social Classification (RGSC), the previous official classification of socio-economic group. Both the NS-SEC and RGSC are based on occupation and employment status (and for some occupations, number of employees in the workplace), but the NS-SEC was developed to reflect more accurately the socio-economic structure of 21st century societies and the major shift in the UK economy from manufacturing to service industries. For data prior to 2001, ONS have provided a method for deriving an approximation to the NS-SEC categories, called NS-SEC 90. This method does not produce an exact match between NS-SEC 90 and NS-SEC, so time trends comparing data using the approximation to NS-SEC should be interpreted with caution. ONS publish figures on infant mortality by NS-SEC using the eight class version set out below.
NS-SEC eight analytic class version, with examples: 1 Higher managerial and professional occupations Directors and chief executives of major organisation, civil engineers, medical practitioners, IT strategy and planning professionals, legal professionals, architects, senior officials in national and local government 2 Lower managerial and professional occupations Teachers in primary and secondary schools, quantity surveyors, public service administrative professionals, social workers, nurses, IT technicians 3 Intermediate occupations Graphics designers, medical and dental technicians, Civil Service administrative officers and local government clerical officers, counter clerks, school and company secretaries 4 Small employers and own account workers Hairdressing and beauty salon proprietors, shopkeepers, dispensing opticians in private practice, farmers, self-employed decorators 5 Lower supervisory and technical occupations Bakers and flour confectioners, catering supervisor, head waitress, postal supervisor, sales assistant supervising others 6 Semi-routine occupations Retail assistants, catering assistants, clothing cutters, dressmaker, traffic wardens, veterinary nurses and assistants, shelf fillers 7 Routine occupations Hairdressing employees, floral arrangers, sewing machinists, bar staff, cleaners and domestics Other Full-time students, never worked, long-term unemployed, inadequately described, not classifiable for other reasons Source: NS-SEC User Manual, Office for National Statistics, 2001

Page 10 of 12
In this bulletin, data are aggregated into the three class version as follows:
NS-SEC 3 class version NS-SEC 8 class version
Managerial and professional occupations Higher Lower
managerial managerial
and and
professional professional
occupations occupations
Intermediate occupations Intermediate occupations Small employers and own account workers
Routine and manual occupations Lower supervisory and technical Semi-routine occupations Routine occupations
occupations
Other Other
Further details are available from the NS-SEC guidance section of the National Statistics website.6
Explanation of absolute and relative inequality gaps For monitoring of inequalities, both the absolute gap and the relative gap between the Routine and Manual group and the average for All groups (inside marriage / joint registrations) are shown. The absolute gap is the numerical difference between the infant mortality rates for the Routine and Manual group and All groups. The relative gap is the percentage difference between the infant mortality rates for the Routine and Manual group and All groups (i.e. the difference in infant mortality rates as a percentage of the All group infant mortality rate). Both the absolute and relative gaps are important measures of inequality, and should be used in combination to understand the extent of the inequalities. The absolute gap measures the impact of unequal health experience in absolute terms, e.g., how many more infant deaths (per 1,000 live births) occur in a disadvantaged group than average. The relative gap measures how unequal the health experience between groups is, i.e. how much more likely someone from a disadvantaged group is to experience poor health than average. It is important to consider both absolute and relative measures and to interpret these carefully when assessing the extent of inequality. For example, a large social class gradient in a rare cause of death may be less important in public health terms than a smaller social class gradient in a common cause of death (for which absolute differences between social classes, and so the overall impact of the inequalities, are higher). It is also important to assess trends in both absolute and relative measures of inequality when interpreting changes over time. For example, where indicator values are decreasing for the All group average (as is the case for infant mortality rates), it is possible for a narrowing in the absolute gap with the Routine and Manual group to be accompanied by a static or increasing relative gap. (If indicator values were increasing for the All group average, it would be possible for a narrowing in the relative gap to be accompanied by a static or increasing absolute gap). In this bulletin both the absolute and relative gaps have been calculated and presented in Table 1b. The absolute gap is additionally shown in Chart 1b.

Annex B: Former government target on inequalities in infant mortality This document is the latest update in a series of mortality monitoring bulletins published since 2007, initially established to present data related to mortality targets included in the former Public Service Agreements (PSAs) published as part of the 2004 and 2007 Spending Reviews. These targets are no longer in place, and we plan to review the format and content of this bulletin before the next annual update in the light of the indicators in the Transparency section of the Department of Health Business Plan 2011-154 (published following the 2010 Spending Review), and the forthcoming Public Health Outcomes Framework5. The former target on inequalities in infant mortality associated with the data presented in this bulletin was:
• To reduce the relative gap in infant mortality between the Routine and Manual group and the population as a whole (England and Wales), by at least 10% by 2010
The target date for this was 2010 (assessed using data for 2009-11), with progress assessed against a baseline period of 1997-99.
Page 11 of 12
Page 12 of 12
References
1. Mortality Monitoring Bulletin: (Infant mortality, inequalities): Update to include data for 2009, Department of Health (Dec 2010): http://www.dh.gov.uk/en/Publicationsandstatistics/Publications/PublicationsStatistics/DH_122113
2. Infant and perinatal mortality in England and Wales by social and biological factors, 2010, Office for National Statistics (Nov 2011): http://www.ons.gov.uk/ons/rel/child-health/infant-and-perinatal-mortality-in-england-and-wales-by-social-and-biological-factors/2010/stb-infant-and-perinatal-mortality--2010.html
3. Childhood, infant and perinatal mortality in England and Wales, 2009, ONS (March 2011): http://www.ons.gov.uk/ons/rel/vsob1/child-mortality-statistics--childhood--infant-and-perinatal/2009/index.html
4. Business Plan 2011-2015, Department of Health (July 2011): http://www.dh.gov.uk/en/Publicationsandstatistics/Publications/PublicationsPolicyAndGuidance/DH_128494
5. Healthy Lives, Healthy People: transparency in outcomes - proposals for a public health outcomes framework, Department of Health (Dec 2010): http://www.dh.gov.uk/en/Consultations/Closedconsultations/DH_122962
6. The National Statistics Socio-Economic Classification (NS-SEC) pages of the ONS website: http://www.ons.gov.uk/ons/guide-method/classifications/current-standard-classifications/soc2010/soc2010-volume-3-ns-sec--rebased-on-soc2010--user-manual/index.html