Embed Size (px)
Citation preview

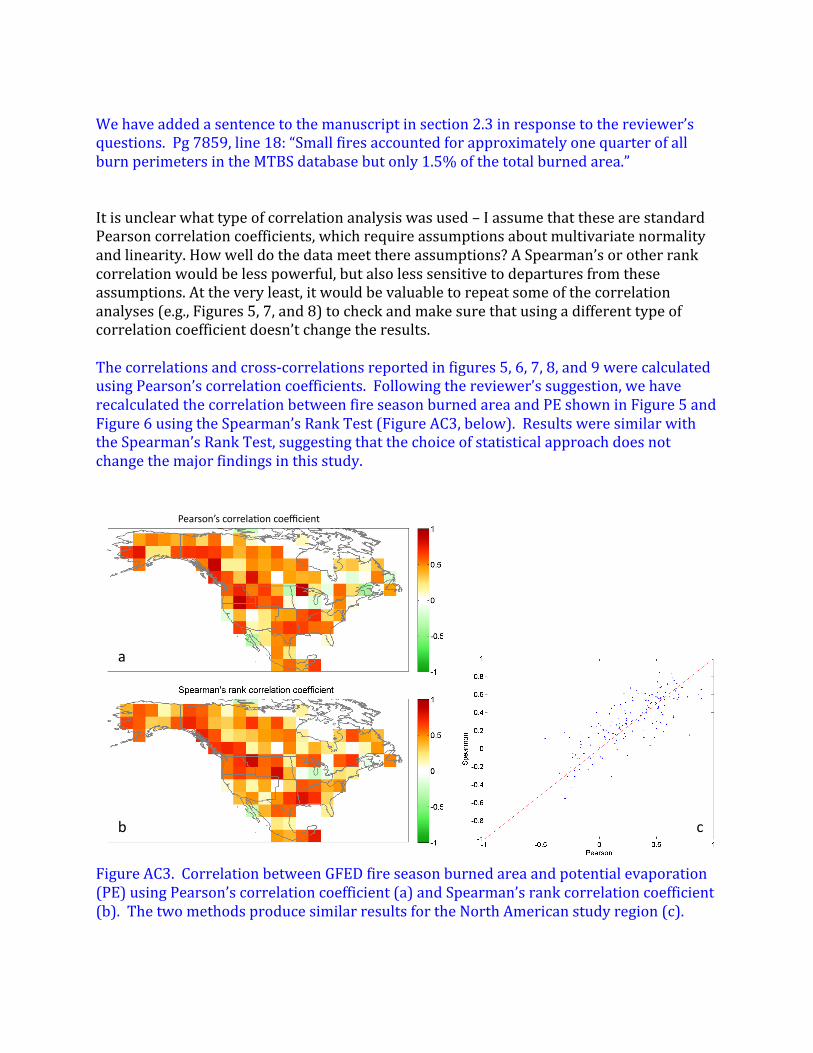
Dear Editor, On behalf of my co-‐authors, I am pleased to submit our detailed responses to the Reviewers’ comments and concerns with our manuscript entitled “Satellite-‐based assessment of climate controls on U.S. burned area.” Reviewer comments appear in black text, and our responses follow in blue text. Thank you for your consideration of our revised manuscript. Cheers, Douglas Morton NASA GSFC Anonymous Referee #1 General Comments One general question I have is about the consistency of the MTBS dataset over time. Based on my knowledge of this project, I am fairly confident that they have consistently included all of the large fires over the 500 and 1000 acres thresholds back to 1984. However, as indicated in the manuscript, other smaller fires were also mapped based on special requests. My assumption is that most of these additional fires occurred during the active years of MTBS (the 2000’s), not during the 1980’s or 1990’s. Could there be temporal biases? If so, could they be influencing the reported trends and climate-‐burned area correlations? As the reviewer suggests, the number of small fires in the MTBS database does show a marked increase in the latter half of the 2000s (see Figure AC1, below), yet this increase is coincident with an increase in burned area in regions with large numbers of small fires (e.g., SE region, Figure AC2). Therefore, more small fires might be expected in years with greater fire activity. Interestingly, the year with highest burned area (2007) had the smallest relative contribution from small fires to total burned area (Figure AC2). Overall, burned area in these small fire perimeters is minor contribution to the total burned area in the MTBS database. In the eastern US (partitioned along the eastern boundary of North Dakota, South Dakota, Kansas, Oklahoma, and Texas), fires <500 ac accounted for 28% of all burn perimeters and 2.8% (~309,000 ac) of total burned area in the MTBS database for 1984-‐2009. Fires <1000 ac in the western US accounted for approximately half as much of the total burned area (1.4%, or 1,345,000 ac) and a similar proportion (26%) of all burn perimeters. Approximately ¼ of small fire perimeters and burned area in the western US occurred in just two states (Kansas and Oklahoma) between 2006-‐2009 (719 perimeters, 340,000 ac). Similarly, 40% of all small fire perimeters in the eastern US occurred in Florida, primarily in 2006 (350). It is possible, as the reviewer suggests, that greater awareness of the MTBS project led to an increase in requests for small fire assessments from specific states in these years.
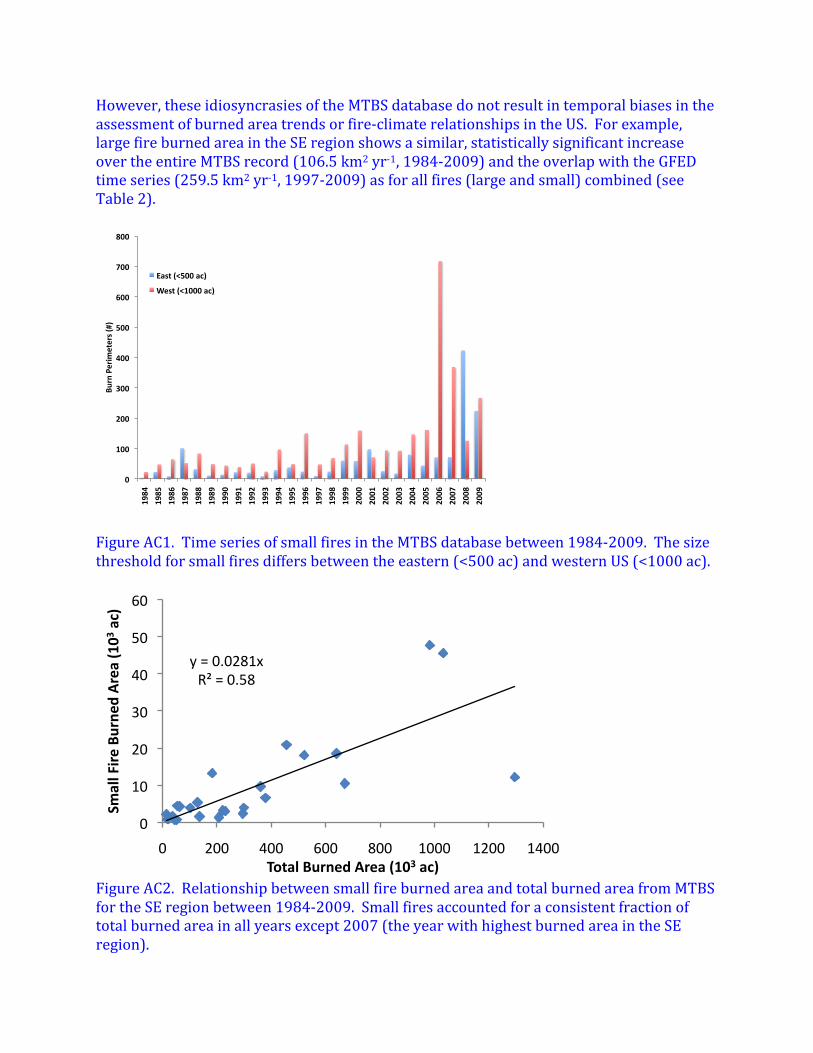
However, these idiosyncrasies of the MTBS database do not result in temporal biases in the assessment of burned area trends or fire-‐climate relationships in the US. For example, large fire burned area in the SE region shows a similar, statistically significant increase over the entire MTBS record (106.5 km2 yr-‐1, 1984-‐2009) and the overlap with the GFED time series (259.5 km2 yr-‐1, 1997-‐2009) as for all fires (large and small) combined (see Table 2).
Figure AC1. Time series of small fires in the MTBS database between 1984-‐2009. The size threshold for small fires differs between the eastern (<500 ac) and western US (<1000 ac).
Figure AC2. Relationship between small fire burned area and total burned area from MTBS for the SE region between 1984-‐2009. Small fires accounted for a consistent fraction of total burned area in all years except 2007 (the year with highest burned area in the SE region).
0"
100"
200"
300"
400"
500"
600"
700"
800"
1984"
1985"
1986"
1987"
1988"
1989"
1990"
1991"
1992"
1993"
1994"
1995"
1996"
1997"
1998"
1999"
2000"
2001"
2002"
2003"
2004"
2005"
2006"
2007"
2008"
2009"
Burn"Perim
eters"(#)"
East"(<500"ac)"
West"(<1000"ac)"
y"="0.0281x"R²"="0.58"
0"
10"
20"
30"
40"
50"
60"
0" 200" 400" 600" 800" 1000" 1200" 1400"
Small%Fire%Bu
rned
%Area%(103%ac)%
Total%Burned%Area%(103%ac)%
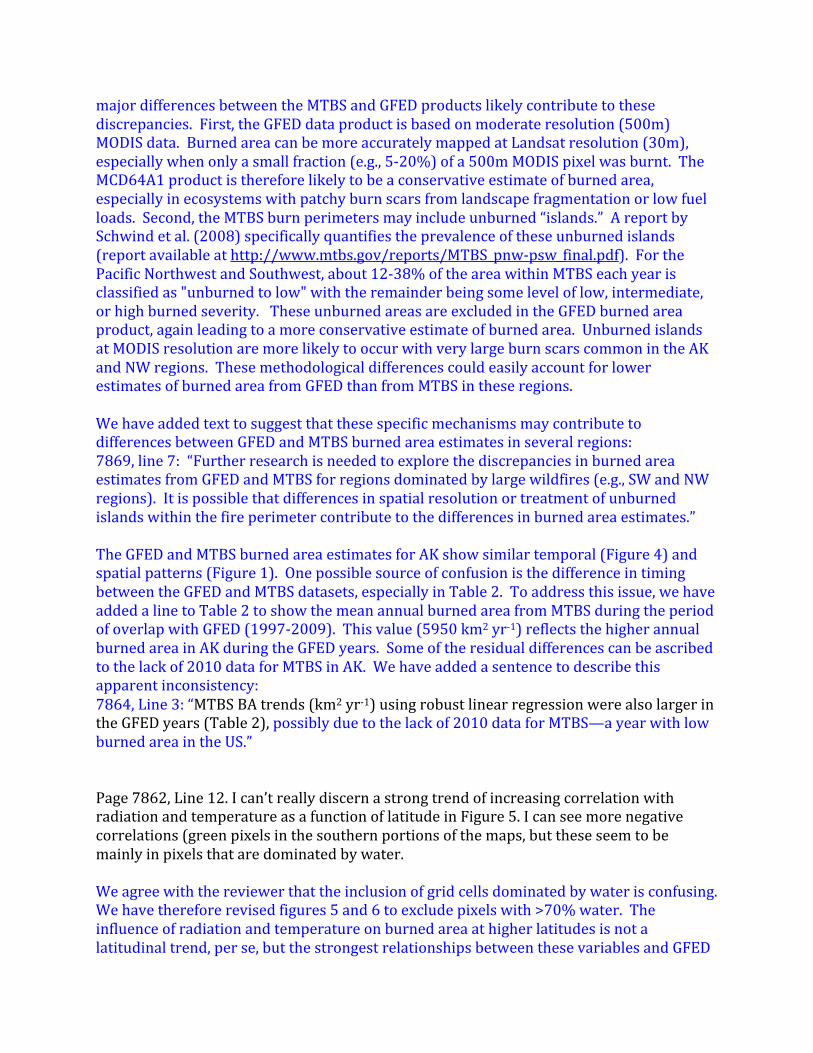
We have added a sentence to the manuscript in section 2.3 in response to the reviewer’s questions. Pg 7859, line 18: “Small fires accounted for approximately one quarter of all burn perimeters in the MTBS database but only 1.5% of the total burned area.” It is unclear what type of correlation analysis was used – I assume that these are standard Pearson correlation coefficients, which require assumptions about multivariate normality and linearity. How well do the data meet there assumptions? A Spearman’s or other rank correlation would be less powerful, but also less sensitive to departures from these assumptions. At the very least, it would be valuable to repeat some of the correlation analyses (e.g., Figures 5, 7, and 8) to check and make sure that using a different type of correlation coefficient doesn’t change the results. The correlations and cross-‐correlations reported in figures 5, 6, 7, 8, and 9 were calculated using Pearson’s correlation coefficients. Following the reviewer’s suggestion, we have recalculated the correlation between fire season burned area and PE shown in Figure 5 and Figure 6 using the Spearman’s Rank Test (Figure AC3, below). Results were similar with the Spearman’s Rank Test, suggesting that the choice of statistical approach does not change the major findings in this study.
Figure AC3. Correlation between GFED fire season burned area and potential evaporation (PE) using Pearson’s correlation coefficient (a) and Spearman’s rank correlation coefficient (b). The two methods produce similar results for the North American study region (c).
Pearson’s)correla,on)coefficient)
a)
b) c)

We have modified the manuscript (Section 2.6, Pg 7861) and figure captions (5-‐9) to indicate the use of Pearson’s correlation coefficients. The discussion generally does a nice job of synthesizing the results and putting them into broader context. However, it mostly emphasizes the concordance between the results of this analysis and previous work. It would help if the discussion could more explicitly highlight the novel results from this paper and how they extend our under-‐ standing of climate-‐fire relationships. We appreciate the Reviewer’s suggestion to strengthen the statements of our key research findings in the first paragraph of the Discussion Section. We have modified the text to better highlight the novel results of our study: “This study provides the first national-‐scale assessment of climate controls on US fire activity using satellite BA data. Satellite BA data provide unprecedented spatial and temporal detail to assess fire-‐climate relationships at national, regional, and sub-‐regional scales. Independent BA datasets from GFED and MTBS indicated increasing fire activity across the southern and western US in recent decades, with a statistically significant increase in total US BA during 1984–2009. Interannual variability in US BA was strongly correlated with atmospheric drying potential during the fire season. Fire season PE increased from the 1980s–2000s, enhancing climate-‐driven fire risk in the SP, NP, NW, and AK where PE-‐BA correlations were strongest. Variability in fire-‐climate relationships during the fire season highlighted the different time scales over which radiation, VPD, and water deficit influence the timing and duration of fire activity. This study expands upon the results of previous research on climate variability and fire activity in the US (Littell et al., 2009; Westerling et al., 2006; Xiao and Zhuang, 2007; Kloster et al., 2010) using a more mechanistic approach to estimate PE (Allen et al., 1998) and satellite-‐based data for monthly BA in forest and non-‐forest cover types. Evidence in this study for increasing climatic control on US wildfires is also consistent with previous research on temperature-‐driven changes in BA for Canadian boreal forests (Balshi et al., 2009; Girardin and Wooton, 2009; Xiao and Zhuang, 2007; Gillett et al., 2004). The detailed PE-‐BA relationships in this study provide a lens for evaluating changes in the timing or duration of regional fire activity under future climate conditions.” Specific Comments Page 7863, Line 22-‐26: I understand the rationale for expecting lower burned area in the MTBS datasets in areas with smaller fires and fires on private land. However, I don’t understand why the MTBS estimates would be higher than GFED in other regions (e.g., NP and SW). Do these differences simply reflect error in the GFED (and MTBS) estimates? Or are there other types of biases at work in these regions? Also, I would not say that the GFED and MTBS estimates are “similar” for the AK region. Burned area estimates from MTBS are higher than GFED in several regions dominated by large wildfires (e.g., the SW region, and to a lesser degree in the NW and AK regions). Two
major differences between the MTBS and GFED products likely contribute to these discrepancies. First, the GFED data product is based on moderate resolution (500m) MODIS data. Burned area can be more accurately mapped at Landsat resolution (30m), especially when only a small fraction (e.g., 5-‐20%) of a 500m MODIS pixel was burnt. The MCD64A1 product is therefore likely to be a conservative estimate of burned area, especially in ecosystems with patchy burn scars from landscape fragmentation or low fuel loads. Second, the MTBS burn perimeters may include unburned “islands.” A report by Schwind et al. (2008) specifically quantifies the prevalence of these unburned islands (report available at http://www.mtbs.gov/reports/MTBS_pnw-‐psw_final.pdf). For the Pacific Northwest and Southwest, about 12-‐38% of the area within MTBS each year is classified as "unburned to low" with the remainder being some level of low, intermediate, or high burned severity. These unburned areas are excluded in the GFED burned area product, again leading to a more conservative estimate of burned area. Unburned islands at MODIS resolution are more likely to occur with very large burn scars common in the AK and NW regions. These methodological differences could easily account for lower estimates of burned area from GFED than from MTBS in these regions. We have added text to suggest that these specific mechanisms may contribute to differences between GFED and MTBS burned area estimates in several regions: 7869, line 7: “Further research is needed to explore the discrepancies in burned area estimates from GFED and MTBS for regions dominated by large wildfires (e.g., SW and NW regions). It is possible that differences in spatial resolution or treatment of unburned islands within the fire perimeter contribute to the differences in burned area estimates.” The GFED and MTBS burned area estimates for AK show similar temporal (Figure 4) and spatial patterns (Figure 1). One possible source of confusion is the difference in timing between the GFED and MTBS datasets, especially in Table 2. To address this issue, we have added a line to Table 2 to show the mean annual burned area from MTBS during the period of overlap with GFED (1997-‐2009). This value (5950 km2 yr-‐1) reflects the higher annual burned area in AK during the GFED years. Some of the residual differences can be ascribed to the lack of 2010 data for MTBS in AK. We have added a sentence to describe this apparent inconsistency: 7864, Line 3: “MTBS BA trends (km2 yr-‐1) using robust linear regression were also larger in the GFED years (Table 2), possibly due to the lack of 2010 data for MTBS—a year with low burned area in the US.” Page 7862, Line 12. I can’t really discern a strong trend of increasing correlation with radiation and temperature as a function of latitude in Figure 5. I can see more negative correlations (green pixels in the southern portions of the maps, but these seem to be mainly in pixels that are dominated by water. We agree with the reviewer that the inclusion of grid cells dominated by water is confusing. We have therefore revised figures 5 and 6 to exclude pixels with >70% water. The influence of radiation and temperature on burned area at higher latitudes is not a latitudinal trend, per se, but the strongest relationships between these variables and GFED

burned area occur at northern latitudes. Out interpretation of Figure 5 is consistent with the seasonal timing of fire activity in the northern regions shown in Figures 2 and 3 (largely restricted to June-‐August). Figure 8 also provides corroborating evidence for the influence of temperature, relative to other climate variables, for interannual variability in burned area during the fire season. Page 7865, Lines 19-‐20. From what I can tell Figure 8 doesn’t include any results about climate controls on potential evapotranspiration. It only reports results of correlations between climatic variable and burned area. We assessed the relative contributions of the individual meteorological variables (Equation 1) to the PE-‐BA correlations in Figure 5. The meteorological inputs needed to calculate PE tend to be highly correlated, and therefore combine to produce large changes in PE. For instance, temperature, net radiation, and VPD are all positively correlated with one another and negatively correlated with precipitation. This behavior is reflected in Figure 5, which shows strong positive correlations for VPD, temperature, and Rn and generally the strongest correlations when combined as PE. Correlations with precipitation are mostly negative. We have modified the text describing this figure in response to a similar comment from Reviewer #2 (Pg 7864, Line 10). We have revised Figure 8 to specifically consider two input variables for the PE calculation that were strongly correlated with BA in Figure 5 (VPD and Rn). These variables, although strongly correlated with each other, reflect different climate controls on PE during the fire season. The analysis still includes Precipitation (P) and Deficit (D, calculated as P-‐PE). This revised figure provides a clearer indication of the climate control on PE as it relates to BA. The revised version of Figure 8 is included, below. The corresponding text (Page 7865) will be changed to better reflect the key points of this figure: “Climate controls on PE and BA varied both within and among regions over the course of the fire season (Fig. 8). Shortwave radiation (R) was the main driver of fire season PE in the AK, whereas the best predictor of fire season BA in the NP, SP, and NW regions was VPD or water deficit (D), likely as a control on fuel availability via the conversion of live plants to fine fuels. Climatic control on monthly BA changed seasonally in the NW regions, shifting from R to D during the fire season (Fig. 8). A similar shift occurred in the SE region from R to VPD. Representation of both R and VPD in the PE calculation integrated the combined influence of warming and drying conditions on BA (Fig. 7). Climate anomalies during the fire season were also important for fires in subsequent months (e.g., AK, SP, SW), suggesting that dry conditions early in the fire season may influence the duration of the fire season later in the year.”

Revised caption for Figure 8. Maximum monthly cross correlation coefficients between GFED (top) and MTBS (bottom) BA and alternate climate indices. Letters in each grid cell indicate the monthly mean climate variable (R: shortwave radiation, V: vapor pressure deficit, P : precipitation; D: water deficit, calculated as P -‐PE), numbers represent the lead time between climate and BA in months (max = 3), and colors represent the correlation coefficient. Black text indicates correlation coefficients with p < 0.05, and grey text signifies correlation coefficients with 0.05 ≤ p < 0.1. Months with <2 % of annual BA or without statistically significant correlations between BA and climate variables (p >0.1) appear white. Blue boxes outline months with ≥20 % of annual BA for each region.

Page 7866, Line 23: “. . . despite lower PE values during the January-‐March fire season in the region.” I assume you mean lower PE values during the fire season than during the other months of the year, but please clarify in the manuscript. Correct, we will clarify in the revised manuscript. “In the SE, PE values were higher in fire cells despite lower PE values during the January–March fire season than during other months of the year in this region.” Page 7866, Line 27. It’s not clear to me how low absolute values of PE necessarily provide evidence that BA is insensitive to PE anomalies. We believe that the Reviewer may have misread this statement. This paragraph actually states the opposite-‐-‐high absolute values show insensitivity of BA to PE in the SW region. Page 7867, Line 4. I don’t think that Figure 11 supports the statement that “Climate controls on US burned area (expressed as PE) increased over the past 30 yr”, since the results have clearly shown that not all regions are equally sensitive to PE and also suggest that climate-‐fire relationships are temporally heterogeneous. The reviewer is correct that the spatial and temporal heterogeneity of US fire activity is one key message from this work. However, elements of similarity also arise from our analysis, including the important relationship between BA and fire season PE for five of the six major burning regions in the US (AK, NW, NP, SP, and SE). Increases in fire season PE in these regions over the past three decades have coincided with increases in burned area. We feel that the body of evidence in this paper leading up to figures 10-‐12 supports this conclusion. Page 7871, Line 10. “Non-‐climate drivers of regional BA were also important for the seasonal and interannual variability of fire activity across the southern US.” It’s not clear how this concluding statement arises from your work, since only climatic factors were considered in the analyses. Are you assuming that non-‐climate factors are more important in the southern US because climate-‐fire relationships were generally weaker in these areas (e.g., Figures 7 and 8)? Non-‐climate drivers are important for the timing and amount of fire activity in the southern US. We specifically support this statement with comparisons between MTBS and GFED BA in regions with significant agricultural fire activity (Pg 7862, Fig 1), analysis of seasonal PE dynamics in fire and non-‐fire grid cells (Pg 7866, Fig. 10), and in the discussion of fire types (Pg. 7868, Line 20). Results shown in Figures 7 and 8, based on comparisons between GFED and MTBS, are also consistent with these lines of evidence regarding agricultural management fires in the SE and SP regions. We have added a sentence to the final paragraph of the discussion section to clarify the justification for this statement in the manuscript:

Page 7871, Line 10: “Differences between GFED and MTBS burned area estimates and weaker climate-‐fire relationships with GFED BA suggest a significant contribution from agricultural management fires in the SP and SE regions.” Figure 5. It would help to indicate the critical values of the correlation coefficient at an alpha level of 0.05 (these should be the same for all pixels if they have the same n). Figure 8. Why aren’t the MTBS BA 1997-‐2010 results also reported in Figure 8? We have revised figure 5 using an alpha value of 0.1 (see revised figure and caption, below). Figure 5 has also been modified to exclude pixels with >70% water. We have added a panel to Figure 8 showing MTBS BA for 1997-‐2009 (see the revised version of Figure 8, above).
Revised Version of Fig. 5. Pearson’s correlation coefficients for the relationships between GFED BA (1997–2010) during the 3-‐month fire season and climate metrics for each 5◦ × 5◦ grid cell in North America. Separate map panels show the correlation between fire-‐season BA and Potential Evaporation (PE), Precipitation, Vapor Pressure Deficit (VPD), mean monthly temperature, and incoming shortwave (SW) radiation from reanalysis climate data. Cells without statistically significant correlation coefficients (p>0.1) appear white.
BA#Precipita,on/
BA#Temperature/ BA#SW/Radia,on/
BA#VPD/
BA#PE/

Anonymous Referee #2 Specific Comments: While this paper is valuable and well written, it has triggered some questions and suggestions for the authors: 1) Are there substantial differences between fires that burn in woodlands, grasslands and savanna, or agricultural fires? I understand the need to simplify the analyses, and to lump fires into similar bins. In my limited experience, there are stark differences (including wind and other climatic variables) between woodland fires, grass fires and agricultural fires. Could the analysis be further refined in the future by examining differences between these unique vegetation types and the climatic drivers that impact these types of fires? We agree with the reviewer that this is a promising direction for future research. One challenge for any large-‐scale study is stratification. Here, we have adopted the geopolitical boundaries of the US National Climate Assessment. A biome-‐level classification of fire-‐climate relationships (similar to the analysis of GFED fire emissions in van der Werf et al., 2010) could highlight gradients of climatic influence on fire extent within and between biomes, such as the influence of fuel loads or fractional woody cover on climate drivers of fire activity. Our research group is specifically working to improve the representation of agricultural fires (Giglio et al., in prep; Lin, Randerson et al., in prep) and other small fires (Randerson et al., in press JGR-‐B) in GFED to further explore the regional influences of management and climate for these fire types. 2) Do either of these data sets (GFED or MTBS) include prescribed fires or fire for resource benefit (ie. Fire Use Fire)? If so, what percent of the fires are “controlled” or prescribed? Would an analysis investigating the relationship of climate on BA be affected to a large extent by fires that are intentionally set in a window of climatic opportunity? Perhaps this could be a future investigation for the authors. As noted above, our research group has a separate publication in preparation that combines burned area data, active fire detections, and land cover information to identify trends in management fires across the US (Lin et al., in prep.). This activity estimates the influence of prescribed fires based on active fire detections outside of wildfires (MTBS) and agricultural areas (land cover). 3) One of the climate variables that are included in the analysis was albedo. I am personally interested in your findings regarding how albedo affects fire systems. I did not see any further mention of albedo in the paper. How was this variable investigated, and were there any interesting interactions discovered? Albedo from the NARR dataset was used to derive parameters for the PE calculation (Equation 1). Albedo changes from fire were not specifically addressed in this study; in the US, most fires alter a small fraction of each 0.5° grid cell, and thus the regional changes in albedo from fire would be expected to have a small impact on the PE calculation. In sub-‐
Saharan Africa, Australia, or other savanna-‐dominated systems, fires may lead to regional changes in albedo on a seasonal basis and related changes in PE and surface energy fluxes. 4) Did the authors consider including a measure of atmospheric stability, similar to the Haines Index, as one of the climate variables in this study? This variable is often linked to the spatial extent of fires; fires growing quickly in a short period of time. In this study, we use PE to integrate a diversity of climate parameters related to fire weather conditions at the surface. The Haines Index is a useful measure of atmospheric stability, and the duration of fire weather events is strongly influenced by large-‐scale circulation patterns (e.g., Duffy et al., 2005). The monthly time step of our analysis is likely too long to capture these synoptic events. However, finer temporal resolution analysis is possible using the GFED BA dataset (fire duration can be estimated from the day of burn information). Given that many fire weather events last only days-‐weeks, further evaluation of fire-‐climate interactions at this finer temporal scale is certainly warranted. We specifically highlight these areas of future research on Pg 7870. 5) It would be extremely interesting to analyze these data in the future to identify any temporal shifts in fire season occurrence across the regions examined in this paper. These data sets could provide rudimentary understanding of temporal shifts in peak fire season under current climate change conditions. This information could be of considerable value to mangers regarding planning for a longer, earlier, or later peak fire season. We agree with the reviewer that the impact of climate change on US fire risk is an important area for continued research. We specifically point to this need in the discussion section (Pg. 7869), and we are currently preparing a manuscript on this topic using climate data from models contributing to the IPCC Fifth Assessment Report. 6) I would have been interested in a more refined analysis of the 4 burning regions with similar regional distribution of GFED and MTBS BA estimates (AK, NP, NW and SW). Perhaps providing a finer scale resolution analysis could tease apart some of the broader relationships, and provide insight into other regions and/or climatic/fire interactions. The reviewer points to another promising area for future study. Figure 1 shows some of the fine-‐scale spatial heterogeneity in these regions (0.5° resolution). A more detailed study of fire activity in these regions would certainly be possible using the MCD64A1 burned area data (500m) or MTBS burn severity estimates (30m resolution), at least during the period of overlap (currently 2001-‐2010). Reviewer #1 raised a similar question—to what extent do differences in these burned area products reflect errors or methodological issues? The question of unburned islands within a larger burn perimeter seems like a possible avenue for future work on this question, including interannual variability in the characteristics of these unburned patches. We have modified the text in response to Reviewer #1 on this topic.
7) It would be very interesting to incorporate specific vegetation models, or coarse fuel distribution mapping into this study. Adding a fuels component would make this study extremely comprehensive, and could probably provide further explanation for some of the results of this study. Again, the reviewer points to a promising area for continued research. Interannual variability in burned area, as described in the current manuscript, is one important control on fire emissions. Feedbacks between climate and combustion completeness or climate and emissions ratios (e.g., CO:CO2) could further enhance the emissions from specific fire types. The GFED project (www.globalfiredata.org) provides estimates of both burned area and fire carbon emissions. We elected to exclude emissions in this study, since comparable emissions estimates were not available for all fires in the MTBS database, and running the GFED model with a different burned area dataset would involve considerable work. We acknowledge that coupling burned area and fuels information is a critical to link the fire-‐climate interactions described in this paper to management and policy arenas that directly consider emissions such as air quality monitoring and greenhouse gas reporting. Technical Corrections: Pg 7882; Figure 2: Explain the legend with text. It was not clear or intuitive if the colors 2-‐12 are representative of months. We have revised the caption for Figure 2 to address this concern: “Fig. 2. Peak fire month in North America, defined as the month with the largest fraction of annual GFED burned area during 1997–2010. Color values from 1-‐12 indicate the calendar month of peak fire activity for each grid cell.” Pg 7862; Figure 5: The trends/correlations are not clear to me. Perhaps better explanation in the text will clarify this figure. We have modified Figure 5 to eliminate pixels with >70% water to aid in the interpretation of the results. We have also added new text on Pg 7864, line 10 to better explain the significance of Figure 5: “Correlations between BA and input variables for the PE calculation (Equation 1) highlight the relative contributions of different climate drivers. The relationships between BA and VPD showed a similar spatial pattern as the BA-‐PE relationship but with somewhat weaker correlations in AK and the NW US (Fig. 5). Shortwave radiation and temperature were better predictors of interannual variability in BA at higher latitudes, and precipitation anomalies and BA were negatively correlated during the fire season in all regions (Fig. 5). Precipitation and associated cloudiness often reduce shortwave radiation, VPD, and temperature, causing substantial reductions in PE. Similarly, temperature, net radiation, and VPD are all positively correlated with one another and negatively correlated with precipitation. This behavior is reflected in Figure 5, which shows strong positive
correlations for VPD, temperature, and Rn and generally the strongest correlations when combined as PE.” Pg 7871; Line 10: “Non-‐climate drivers of regional BA were also important. . ...” I am not certain which drivers you are referring to, or how it relates to the findings in this paper. Reviewer #1 raised a similar concern with this summary sentence in the final paragraph of the discussion section. We now include additional text to tie this statement to the supporting justification in the paper.