Embed Size (px)
Citation preview

Windle Island
Distribution Impact Appraisal for Full Business Case
June 2015


310 TPN ITD 01 A
P:\Birmingham\ITB\Craig W\TAGs_Liverpool\Windle Island\Submissions\MM_WindleIsland_DIA_FBC_v02-KS_Reviewed-
Final_LMC_Actioned.docx June 2015
Windle Island
Distribution Impact Appraisal for Full Business Case
Windle Island
Distribution Impact Appraisal for Full Business Case
June 2015
Mott MacDonald, 9th Floor, Royal Liver Building, Pier Head, Liverpool L3 1JH, United Kingdom
T +44 (0)151 482 9910 F +44 (0)151 236 2985 W www.mottmac.com


310/TPN/ITD/01/A June 2015 P:\Birmingham\ITB\Craig W\TAGs_Liverpool\Windle Island\Submissions\MM_WindleIsland_DIA_FBC_v02-KS_Reviewed-Final_LMC_Actioned.docx
Windle Island Distribution Impact Appraisal for Full Business Case
Revision Date Originator Checker Approver Description
A 19/06/2015 S. Farrace C. Walley
N. Hurst
K. Scott
Final for FBC
Issue and revision record
Information Class: Standard
This document is issued for the party which commissioned it and for specific purposes connected with the above-captioned project only. It should not be relied upon by any other party or used for any other purpose.
We accept no responsibility for the consequences of this document being relied upon by any other party, or being used for any other purpose, or containing any error or omission which is due to an error or omission in data supplied to us by other parties.
This document contains confidential information and proprietary intellectual property. It should not be shown to other parties without consent from us and from the party which commissioned it.

310/TPN/ITD/01/A June 2015 P:\Birmingham\ITB\Craig W\TAGs_Liverpool\Windle Island\Submissions\MM_WindleIsland_DIA_FBC_v02-KS_Reviewed-Final_LMC_Actioned.docx
Windle Island Distribution Impact Appraisal for Full Business Case
Chapter Title Page
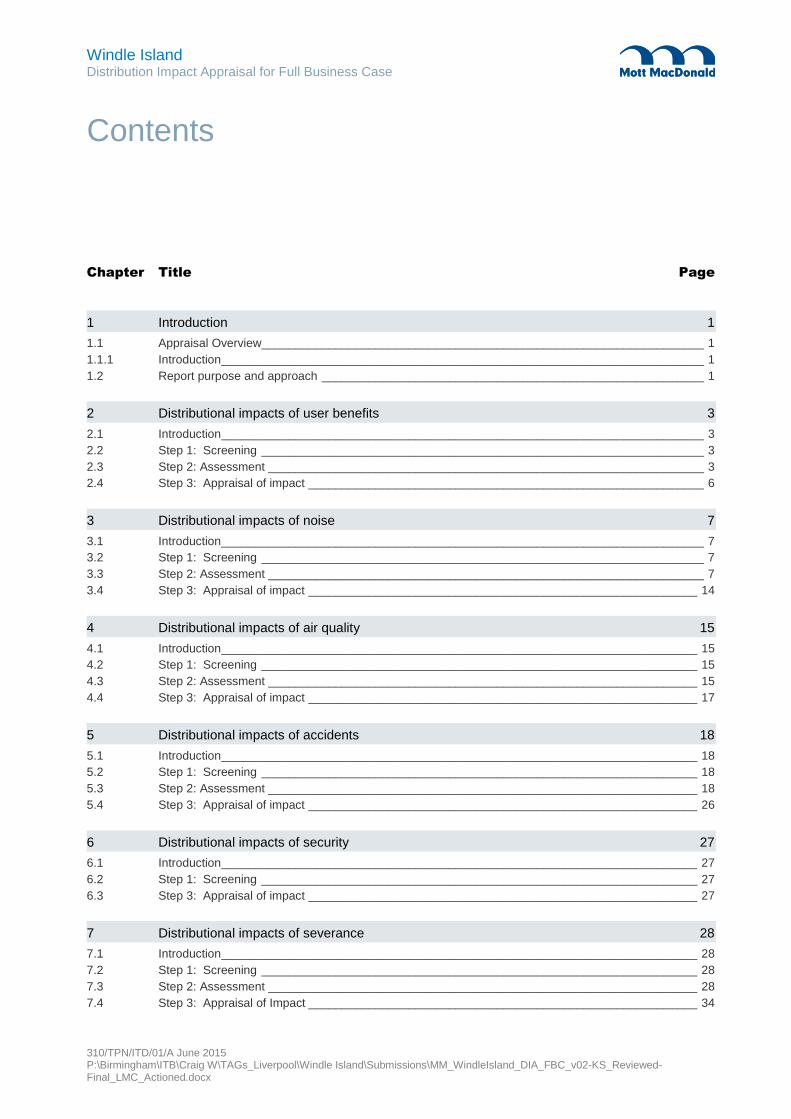
1 Introduction 1
1.1 Appraisal Overview__________________________________________________________________ 1 1.1.1 Introduction ________________________________________________________________________ 1 1.2 Report purpose and approach _________________________________________________________ 1
2 Distributional impacts of user benefits 3
2.1 Introduction ________________________________________________________________________ 3 2.2 Step 1: Screening __________________________________________________________________ 3 2.3 Step 2: Assessment _________________________________________________________________ 3 2.4 Step 3: Appraisal of impact ___________________________________________________________ 6
3 Distributional impacts of noise 7
3.1 Introduction ________________________________________________________________________ 7 3.2 Step 1: Screening __________________________________________________________________ 7 3.3 Step 2: Assessment _________________________________________________________________ 7 3.4 Step 3: Appraisal of impact __________________________________________________________ 14
4 Distributional impacts of air quality 15
4.1 Introduction _______________________________________________________________________ 15 4.2 Step 1: Screening _________________________________________________________________ 15 4.3 Step 2: Assessment ________________________________________________________________ 15 4.4 Step 3: Appraisal of impact __________________________________________________________ 17
5 Distributional impacts of accidents 18
5.1 Introduction _______________________________________________________________________ 18 5.2 Step 1: Screening _________________________________________________________________ 18 5.3 Step 2: Assessment ________________________________________________________________ 18 5.4 Step 3: Appraisal of impact __________________________________________________________ 26
6 Distributional impacts of security 27
6.1 Introduction _______________________________________________________________________ 27 6.2 Step 1: Screening _________________________________________________________________ 27 6.3 Step 3: Appraisal of impact __________________________________________________________ 27
7 Distributional impacts of severance 28
7.1 Introduction _______________________________________________________________________ 28 7.2 Step 1: Screening _________________________________________________________________ 28 7.3 Step 2: Assessment ________________________________________________________________ 28 7.4 Step 3: Appraisal of Impact __________________________________________________________ 34
Contents

310/TPN/ITD/01/A June 2015 P:\Birmingham\ITB\Craig W\TAGs_Liverpool\Windle Island\Submissions\MM_WindleIsland_DIA_FBC_v02-KS_Reviewed-Final_LMC_Actioned.docx
Windle Island Distribution Impact Appraisal for Full Business Case
8 Distributional impacts of accessibility 36
8.1 Introduction _______________________________________________________________________ 36 8.2 Step 1: Screening _________________________________________________________________ 36 8.3 Step 3: Appraisal of impact __________________________________________________________ 36
9 Distributional impacts of personal affordability 37
9.1 Introduction _______________________________________________________________________ 37 9.2 Step 1: Screening _________________________________________________________________ 37 9.3 Step 3: Appraisal of impact __________________________________________________________ 37
10 Step 3B: Summary of DIs and AST 38
10.1 Distributional impact appraisal summary ________________________________________________ 38 10.2 Next steps _______________________________________________________________________ 42

Windle Island Distribution Impact Appraisal for Full Business Case
310/TPN/ITD/01/A June 2015 P:\Birmingham\ITB\Craig W\TAGs_Liverpool\Windle Island\Submissions\MM_WindleIsland_DIA_FBC_v02-KS_Reviewed-Final_LMC_Actioned.docx
1
1.1 Appraisal Overview
1.1.1 Introduction
Mott MacDonald has been commissioned by St Helens Metropolitan Borough Council to support the
development of the Full Business Case (FBC) for Major Scheme Business Case funding for the proposed
Windle Island junction improvements. The report aims to provide proportionate distributional impact (DI)
input to inform the FBC; it will be included as an appendix to the FBC document.
1.2 Report purpose and approach
DI appraisals consider the variance of a scheme’s impact across different social groups. Both beneficial
and /or adverse DIs of proposed interventions are considered, along with the identification of social groups
likely to be affected.
The impacts considered are: user benefits, noise, air quality, accidents, security, severance, accessibility
and personal affordability. The appraisal approaches for each of these impacts are described in the
following sections in this report. Each impact has been appraised individually using a screening proforma
(TAG Unit 4.2 Step 1 – Screening) to determine whether it requires further assessment.
A DI appraisal encompasses a number of stages. Step 1 consists of an initial screening process which
examines the eight impacts and determines whether they need to be appraised further. Step 2A confirms
the impact area extent for when the impacts are mapped using GIS software. Step 2B identifies social
groups and 2C identifies related amenities in the impact areas. Finally, Step 3 appraises the results and
provides an assessment of the impacts of the intervention.
The screening process considers the areas where the transport intervention might have negative or
positive impacts on specific social groups. These groups are: children, older people, people with a limiting
long term illness (LLTI), Black and Minority Ethnic (BME) communities, people without access to a car, and
people on low incomes. These are further explained in Table 1.1 overleaf, extracted from WebTAG Unit
4.2, which highlights the groups considered for each impact.
1 Introduction

Windle Island Distribution Impact Appraisal for Full Business Case
310/TPN/ITD/01/A June 2015 P:\Birmingham\ITB\Craig W\TAGs_Liverpool\Windle Island\Submissions\MM_WindleIsland_DIA_FBC_v02-KS_Reviewed-Final_LMC_Actioned.docx
2
Table 1.1: Scope of socio-demographic analysis for DIs (Step 2b)1
This DI appraisal has been undertaken by giving consideration to the social effects (both beneficial and
adverse) of the proposed scheme, against the eight DIs in TAG Unit 4.2. The effects of the scheme have
been identified using a seven-point scale system, in accordance with the WebTAG criteria as shown in
Table 1.2 below.
Table 1.2: Seven-point scale system for determining scheme distributional impact
Impact
Large adverse
Moderate adverse
Slight adverse
0 Neutral
Slight beneficial
Moderate beneficial
Large beneficial
This scoring utilises the DI grading system prescribed in TAG 4.2. The appraisal looks to identify if the
impact is beneficial, neutral or adverse. Neutral impacts are left as neutral, however beneficial or adverse
impacts are scored using the following guidance:
Social groups that have impact area proportions that are significantly larger (> +5%) than their national
averages are assessed large.
Social groups that have impact area proportions that are broadly in line (+ or -5%) with their national
averages are assessed as moderate,
Social groups that have impact area proportions that are smaller (< -5%) than their national averages
are assessed as slight.
1 Department for Transport (Jan 2014) TAG Unit A4.2 Distributional Impact Appraisal
Windle Island Distribution Impact Appraisal for Full Business Case
310/TPN/ITD/01/A June 2015 P:\Birmingham\ITB\Craig W\TAGs_Liverpool\Windle Island\Submissions\MM_WindleIsland_DIA_FBC_v02-KS_Reviewed-Final_LMC_Actioned.docx
3
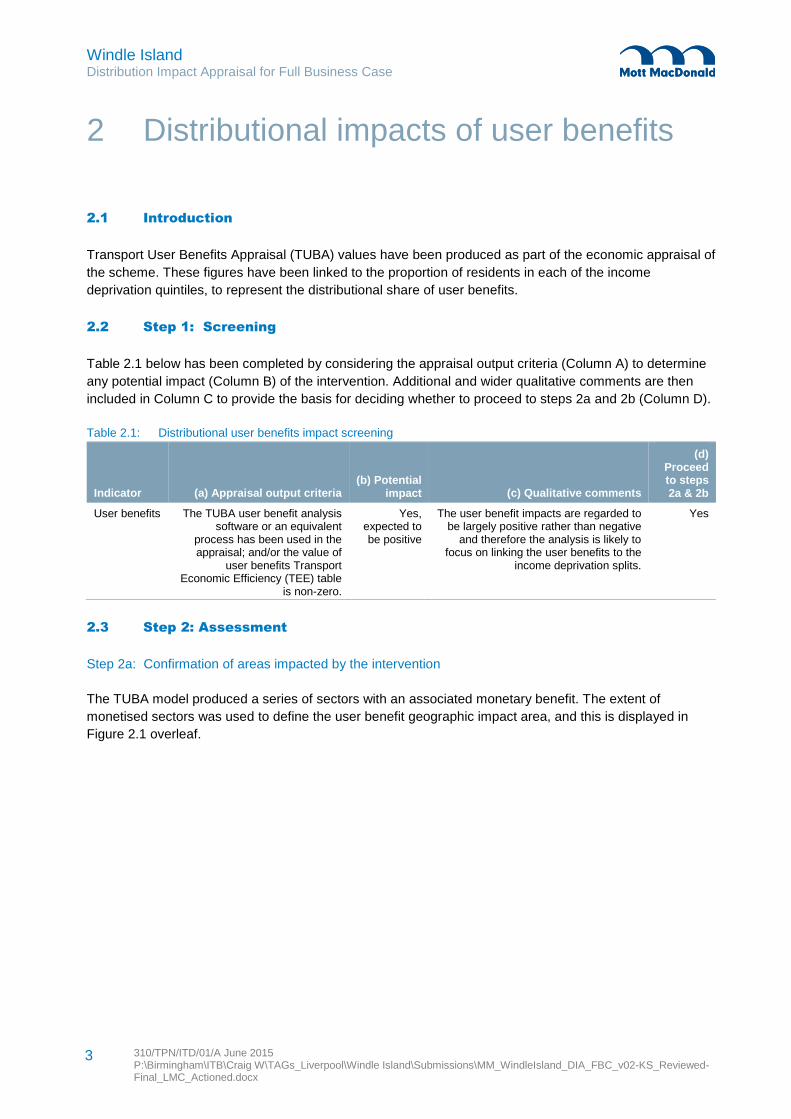
2.1 Introduction
Transport User Benefits Appraisal (TUBA) values have been produced as part of the economic appraisal of
the scheme. These figures have been linked to the proportion of residents in each of the income
deprivation quintiles, to represent the distributional share of user benefits.
2.2 Step 1: Screening
Table 2.1 below has been completed by considering the appraisal output criteria (Column A) to determine
any potential impact (Column B) of the intervention. Additional and wider qualitative comments are then
included in Column C to provide the basis for deciding whether to proceed to steps 2a and 2b (Column D).
Table 2.1: Distributional user benefits impact screening
Indicator (a) Appraisal output criteria (b) Potential
impact (c) Qualitative comments
(d) Proceed to steps 2a & 2b
User benefits The TUBA user benefit analysis software or an equivalent
process has been used in the appraisal; and/or the value of
user benefits Transport Economic Efficiency (TEE) table
is non-zero.
Yes, expected to be positive
The user benefit impacts are regarded to be largely positive rather than negative
and therefore the analysis is likely to focus on linking the user benefits to the
income deprivation splits.
Yes
2.3 Step 2: Assessment
Step 2a: Confirmation of areas impacted by the intervention
The TUBA model produced a series of sectors with an associated monetary benefit. The extent of
monetised sectors was used to define the user benefit geographic impact area, and this is displayed in
Figure 2.1 overleaf.
2 Distributional impacts of user benefits

Windle Island Distribution Impact Appraisal for Full Business Case
310/TPN/ITD/01/A June 2015 P:\Birmingham\ITB\Craig W\TAGs_Liverpool\Windle Island\Submissions\MM_WindleIsland_DIA_FBC_v02-KS_Reviewed-Final_LMC_Actioned.docx
4
Figure 2.1: User benefits impact area
Step 2b: Identification of social groups in the impact area
The income distribution map (Figure 2.2 below) shows that there is a considerable spread of income
deprivation across the user benefit assessment area. Windle Island is located in an area of low income
deprivation when compared to the greater region; however the junction does neighbour areas with high
income deprivation levels. The main areas of income deprivation include Liverpool and Birkenhead to the
west and areas of St Helens to the east of the impact area. Approximately 37% of the impact area
population is located in the lowest income quintile, broadly in line with the St Helens District average of
35%, but significantly higher than the national average figure of 20% (which accounts for 20% of LSOAs
and not the national population).

Windle Island Distribution Impact Appraisal for Full Business Case
310/TPN/ITD/01/A June 2015 P:\Birmingham\ITB\Craig W\TAGs_Liverpool\Windle Island\Submissions\MM_WindleIsland_DIA_FBC_v02-KS_Reviewed-Final_LMC_Actioned.docx
5
Figure 2.2: Income distribution in the user benefits impact area
Source: 2010 Indices of Multiple Deprivation
Step 2c: Identification of amenities in the impact area
TAG 4.2 states that the identification of amenities within the user benefits DI appraisal is not required due
to the appraisal focusing on the impact across income deprivation quintiles and the impact area being too
large to warrant identification of local attractors.

Windle Island Distribution Impact Appraisal for Full Business Case
310/TPN/ITD/01/A June 2015 P:\Birmingham\ITB\Craig W\TAGs_Liverpool\Windle Island\Submissions\MM_WindleIsland_DIA_FBC_v02-KS_Reviewed-Final_LMC_Actioned.docx
6
2.4 Step 3: Appraisal of impact
Step 3a: Core analysis of impacts
Table 2.2: Distributional analysis of user benefits
User benefits impact area
< Most deprived Income quintiles Least deprived>
Total 0% <20% 20% <40% 40% <60% 60% <80% 80% <100%
Population 37% 18% 18% 16% 12% 1,819,804
Share of user benefits (£) 2,692,736 1,290,888 1,313,395 1,187,569 873,885 7,358,473
Share of user disbenefits - - - - - 0
National average* 20% 20% 20% 20% 20% 53,012,456
Assessment
Source: TUBA sectorised benefits
The TUBA model produced a non-business benefit figure of £7,358,473. The distributional analysis of user
benefits in Table 2.2 assigns this overall benefit figure proportionately amongst the income quintiles found
in the user benefits impact area.
Table 2.2 shows the scheme improvements will generate a moderate beneficial assessment score due to
three of the income quintiles experiencing user benefit shares that are in line (+/-5%) with the share of
population in the impact area.
Summary assessment score: Moderate beneficial

Windle Island Distribution Impact Appraisal for Full Business Case
310/TPN/ITD/01/A June 2015 P:\Birmingham\ITB\Craig W\TAGs_Liverpool\Windle Island\Submissions\MM_WindleIsland_DIA_FBC_v02-KS_Reviewed-Final_LMC_Actioned.docx
7
3.1 Introduction
Noise impacts are likely to occur where an intervention results in changes to traffic flows, speeds or where
the physical gap between people and traffic is altered.
3.2 Step 1: Screening
Table 3.1: Distributional impact - noise screening
Indicator (a) Appraisal output criteria (b) Potential
impact (c) Qualitative comments
(d) Proceed to steps 2a & 2b
Noise Any change in alignment of transport corridor or any links
with significant changes (>25% or <-20%) in vehicle flow, speed
or %HDV content. Also note comment in TAG Unit A3.
Expected to be neutral or
potentially adverse
Impacts during construction and operation will be considered, however the change in flow is unlikely to cause
impacts above a slight classification.
Yes
3.3 Step 2: Assessment
Step 2a: Confirmation of areas impacted by the intervention
The second study area (as shown in Figure 3.1 below) has been created to more accurately portray the
effects of the DI of noise in the vicinity of the corridor. This is currently set to 1km around the scheme
boundary with an inner study area of 250m to align with the environment appraisal. The study shows that
there are 2943 households within 1km, and 184 households within 250m (see Figure 3.2).
Figure 3.1 should also be referred to when reviewing the DI of air quality within the next section of this
report (Section 4).
3 Distributional impacts of noise

Windle Island Distribution Impact Appraisal for Full Business Case
310/TPN/ITD/01/A June 2015 P:\Birmingham\ITB\Craig W\TAGs_Liverpool\Windle Island\Submissions\MM_WindleIsland_DIA_FBC_v02-KS_Reviewed-Final_LMC_Actioned.docx
8
Figure 3.1: 1km impact area

Windle Island Distribution Impact Appraisal for Full Business Case
310/TPN/ITD/01/A June 2015 P:\Birmingham\ITB\Craig W\TAGs_Liverpool\Windle Island\Submissions\MM_WindleIsland_DIA_FBC_v02-KS_Reviewed-Final_LMC_Actioned.docx
9
Figure 3.2: Households in the 1km impact area
Step 2b: Identification of social groups in the impact area
As listed in Table 1.1, WebTAG Unit 4.2 states that the social groups required to analyse distributional
noise impacts for this project are children under the age of 16 and income distribution of the population
within the impact area.
Figure 3.3 shows the proportion those aged under 16 in the study area is 17%, broadly in line with the St
Helen’s District and national figures of 18% and 19% respectively. Population density of children under 16
is low in the impact area, with large areas containing less than 3 under 16s per hectare (see Figure 3.4).

Windle Island Distribution Impact Appraisal for Full Business Case
310/TPN/ITD/01/A June 2015 P:\Birmingham\ITB\Craig W\TAGs_Liverpool\Windle Island\Submissions\MM_WindleIsland_DIA_FBC_v02-KS_Reviewed-Final_LMC_Actioned.docx
10
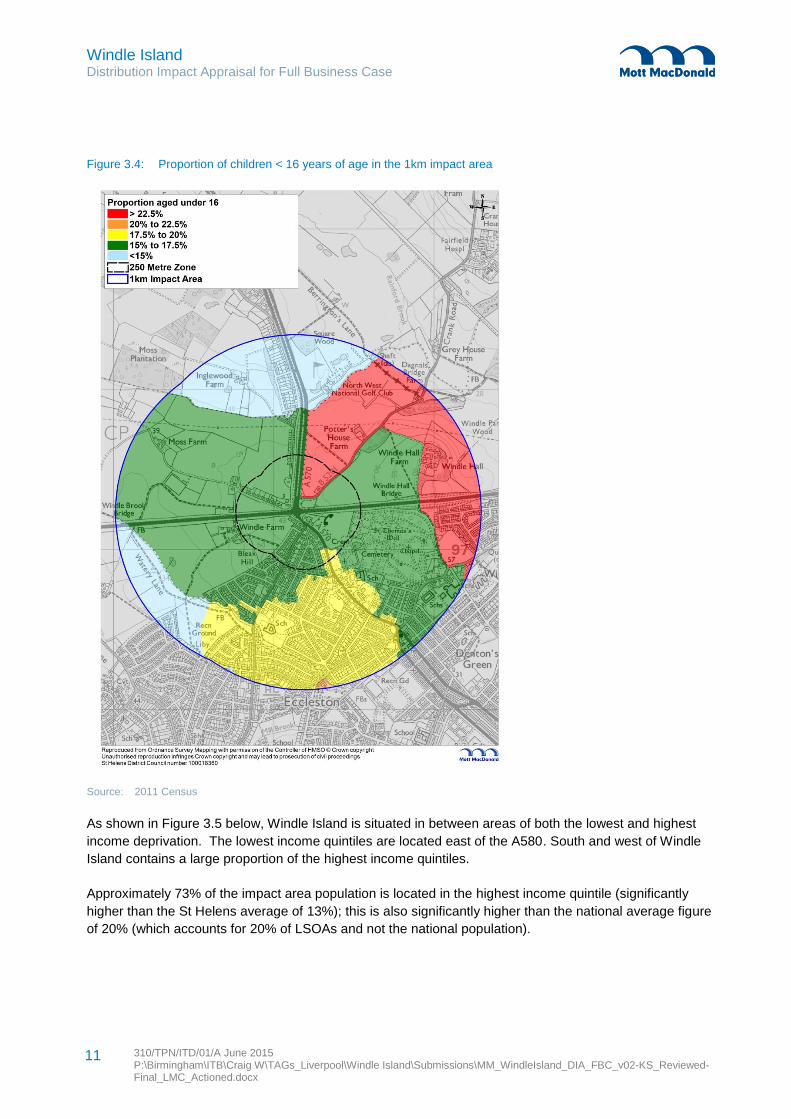
Figure 3.3: Proportion of children < 16 years of age in the 1km impact area
Windle Island Distribution Impact Appraisal for Full Business Case
310/TPN/ITD/01/A June 2015 P:\Birmingham\ITB\Craig W\TAGs_Liverpool\Windle Island\Submissions\MM_WindleIsland_DIA_FBC_v02-KS_Reviewed-Final_LMC_Actioned.docx
11
Figure 3.4: Proportion of children < 16 years of age in the 1km impact area
Source: 2011 Census
As shown in Figure 3.5 below, Windle Island is situated in between areas of both the lowest and highest
income deprivation. The lowest income quintiles are located east of the A580. South and west of Windle
Island contains a large proportion of the highest income quintiles.
Approximately 73% of the impact area population is located in the highest income quintile (significantly
higher than the St Helens average of 13%); this is also significantly higher than the national average figure
of 20% (which accounts for 20% of LSOAs and not the national population).

Windle Island Distribution Impact Appraisal for Full Business Case
310/TPN/ITD/01/A June 2015 P:\Birmingham\ITB\Craig W\TAGs_Liverpool\Windle Island\Submissions\MM_WindleIsland_DIA_FBC_v02-KS_Reviewed-Final_LMC_Actioned.docx
12
Figure 3.5: Income distribution in the noise and air quality impact area
Source: IMD 2010
Step 2c: Identification of amenities in the impact area
Step 2C of the appraisal looks to identify which trip attractors / amenities are located within the impact
area. TAG Unit 4.2 states that the “only clearly established evidence of social impact as a result of noise
level changes is the impact of noise levels on children’s concentration when learning”. Consideration has
been given to the number and locations facilities that are used by young persons. Using GIS software and
Ordnance Survey address base data, the following amenities were mapped (see Figure 3.6 below):
Education establishments including nurseries, schools, secondary schools and colleges
Leisure facilities and sports centres / clubs
Medical facilities including surgeries and hospitals
Public parks and playgrounds

Windle Island Distribution Impact Appraisal for Full Business Case
310/TPN/ITD/01/A June 2015 P:\Birmingham\ITB\Craig W\TAGs_Liverpool\Windle Island\Submissions\MM_WindleIsland_DIA_FBC_v02-KS_Reviewed-Final_LMC_Actioned.docx
13
The map indicates that there are six facilities utilised by young persons within 1km of the scheme boundary
and these are listed within Table 3.2 below.
Figure 3.6: Amenities within the noise impact area
Source: OS Address Base / Census 2011
Table 3.2: Amenities frequented by children <16 in the noise impact area
Amenity Total
Nursery / Creche 3
Sports / Leisure Centre 2
Primary School 1

Windle Island Distribution Impact Appraisal for Full Business Case
310/TPN/ITD/01/A June 2015 P:\Birmingham\ITB\Craig W\TAGs_Liverpool\Windle Island\Submissions\MM_WindleIsland_DIA_FBC_v02-KS_Reviewed-Final_LMC_Actioned.docx
14
3.4 Step 3: Appraisal of impact
Step 3a: Core analysis of impacts
The environmental appraisal2 conducted as part of the Windle Island transport appraisal process
concluded that the scheme is likely to produce neutral noise impacts. Increases in traffic flow and speed
may produce noise impacts; however this could be offset with mitigation measures in the form of acoustic
barriers. Assuming appropriate noise impact measures are put into place, it is not anticipated that there will
be any significant noise impacts.
Summary assessment score: Neutral
2 Mott MacDonald (June 2015) Windle Island Junction Improvement Scheme – Full Business Case Environmental Impact Appraisal

Windle Island Distribution Impact Appraisal for Full Business Case
310/TPN/ITD/01/A June 2015 P:\Birmingham\ITB\Craig W\TAGs_Liverpool\Windle Island\Submissions\MM_WindleIsland_DIA_FBC_v02-KS_Reviewed-Final_LMC_Actioned.docx
15
4.1 Introduction
Air quality impacts, like noise impacts, are likely to occur where an intervention results in changes to traffic
flows, speeds or where the physical gap between people and traffic is altered.
4.2 Step 1: Screening
Table 4.1: Distributional impact – air quality screening
Indicator (a) Appraisal output criteria (b) Potential
impact (c) Qualitative comments
(d) Proceed to steps 2a & 2b
Air quality Any change in alignment of transport corridor or any links
with significant changes in vehicle flow, speed or %HDV
content: • Change in 24 hour AADT of
1000 vehicles or more • Change in 24 hour AADT of HDV of 200 HDV vehicles or
more • Change in daily average speed
of 10kph or more • Change in peak hour speed of
20kph or more • Change in road alignment of
5m or more
Expected to be neutral
Impacts during construction and operation will be considered, however the change in flow is unlikely to cause
impacts above a slight classification
Yes
4.3 Step 2: Assessment
Step 2a: Confirmation of areas impacted by the intervention
Air quality impacts are assessed in the same way as noise impacts. As such, Figures 3.1 and 3.2 within
Section 3.3 should be reviewed in conjunction with this appraisal as they are relevant to the air quality
assessment.
Step 2b: Identification of social groups in the impact area
Children under the age of 16 are most likely to be affected by changes in air quality as they tend to spend
more time outside. Air quality can also affect those living in areas of low car ownership as these people
experience impacts of car use but they themselves do not have access to a car. The review of air quality
impacts therefore focuses on children and those living in relatively high income deprivation areas in
relation to the site. WebTAG guidance also suggests amenities frequented by older people aged over 70
should be mapped and considered as part of the air quality appraisal.
As mentioned in Section 3.3, 17% of residents within the impact area are aged under 16, and 73% of the
impact area is within a low income deprivation area.
4 Distributional impacts of air quality

Windle Island Distribution Impact Appraisal for Full Business Case
310/TPN/ITD/01/A June 2015 P:\Birmingham\ITB\Craig W\TAGs_Liverpool\Windle Island\Submissions\MM_WindleIsland_DIA_FBC_v02-KS_Reviewed-Final_LMC_Actioned.docx
16
Step 2c: Identification of amenities in the impact area
The amenities displayed in Figure 4.1 are applicable to the air quality assessment. WebTAG Unit 4.2
requires the addition of care / nursing homes, surgeries and hospitals to analyse the impact of air quality
on elderly residents as well as children, as these facilities have limited or no alternative options to lessen
interference from local emissions sources. Figure 4.1 and Table 4.2 below show there is one nursing / care
home in addition to the amenities identified for noise impacts.
Figure 4.1: Amenities within the air quality impact area

Windle Island Distribution Impact Appraisal for Full Business Case
310/TPN/ITD/01/A June 2015 P:\Birmingham\ITB\Craig W\TAGs_Liverpool\Windle Island\Submissions\MM_WindleIsland_DIA_FBC_v02-KS_Reviewed-Final_LMC_Actioned.docx
17
Table 4.2: Amenities frequented by children U16 and elderly residents aged 70+ in the air quality impact area
4.4 Step 3: Appraisal of impact
Step 3a: Core analysis of impacts
Air quality impacts were assessed as part of the schemes environmental appraisal. The appraisal concluded that the scheme is likely to produce slight beneficial local air quality impacts. The scheme aims to reduce congestion at the junction, which would improve air quality due to “less idling vehicles and less very low speed traffic”.
Table 4.3 below looks to summarise the DI assessment scores given to the social groups related to this
impact. The mapping of social groups has resulted in the slight beneficial score awarded in the
environmental appraisal becoming a moderate beneficial distributional score.
Table 4.3: Air quality - social group assessment summary table
Social Group Impact
area National average Assessment
Most deprived quintile 9% *20% Slight beneficial
Children (<16) 17% 19% Moderate beneficial
Older people (70+) 16% 12% Moderate beneficial
Overall assessment Moderate beneficial
* 20% of LSOAs
Summary assessment score: Moderate beneficial
Amenity Total
Nursery / Creche 3
Sports / Leisure Centre 2
Primary School 1
Nursing / Care Home 1

Windle Island Distribution Impact Appraisal for Full Business Case
310/TPN/ITD/01/A June 2015 P:\Birmingham\ITB\Craig W\TAGs_Liverpool\Windle Island\Submissions\MM_WindleIsland_DIA_FBC_v02-KS_Reviewed-Final_LMC_Actioned.docx
18
5.1 Introduction
Accident impacts mostly occur on the road network and distribution impacts need to be assessed for
children under 16, older people (70+) and young adults.
5.2 Step 1: Screening
Table 5.1: Distributional impacts – accident screening
Indicator (a) Appraisal output criteria (b) Potential
impact (c) Qualitative comments
(d) Proceed to steps 2a & 2b
Accidents Any change in alignment of transport corridor (or road layout)
that may have positive or negative safety impacts, or any links with significant changes in
vehicle flow, speed, %HDV content or any significant change
(>10%) in the number of pedestrians, cyclists or
motorcyclists using road network.
Yes, expected to be positive
Improvement in road safety is expected due to a number of improvements at the site. These include: improved pedestrian
and cyclist facilities and improving the poor road surface.
Yes
5.3 Step 2: Assessment
Step 2a: Confirmation of areas impacted by the intervention
The Liverpool City Region has been used as the geographic area for reviewing the distributional impacts of
accidents; see Figure 5.1 below.
5 Distributional impacts of accidents

Windle Island Distribution Impact Appraisal for Full Business Case
310/TPN/ITD/01/A June 2015 P:\Birmingham\ITB\Craig W\TAGs_Liverpool\Windle Island\Submissions\MM_WindleIsland_DIA_FBC_v02-KS_Reviewed-Final_LMC_Actioned.docx
19
Figure 5.1: Accidents impact area
Step 2b: Identification of social groups in the impact area
The accidents analysis requires groups that are more susceptible to road and traffic accidents to be
represented. As such, modelling has been undertaken for children aged under 16 (Figures 5.2 and 5.3),
young persons aged 16-25 (Figures 5.4 and 5.5), and older people aged over 70 (Figures 5.6 and 5.7).

Windle Island Distribution Impact Appraisal for Full Business Case
310/TPN/ITD/01/A June 2015 P:\Birmingham\ITB\Craig W\TAGs_Liverpool\Windle Island\Submissions\MM_WindleIsland_DIA_FBC_v02-KS_Reviewed-Final_LMC_Actioned.docx
20
Figure 5.2: Proportion of children < 16 in the accidents impact area
Source: 2011 Census

Windle Island Distribution Impact Appraisal for Full Business Case
310/TPN/ITD/01/A June 2015 P:\Birmingham\ITB\Craig W\TAGs_Liverpool\Windle Island\Submissions\MM_WindleIsland_DIA_FBC_v02-KS_Reviewed-Final_LMC_Actioned.docx
21
Figure 5.3: Density of children <16 in the accidents impact area
Source: 2011 Census
Figure 5.2 and 5.3 display the proportion and density of children under 16 years of age within the LCR.
Approximately 18% of the total population are children and this is in line with the district (St Helens) and
national figures (18% and 19% respectively). The highest densities of children under 16 are primarily
concentrated in and around urban developments.

Windle Island Distribution Impact Appraisal for Full Business Case
310/TPN/ITD/01/A June 2015 P:\Birmingham\ITB\Craig W\TAGs_Liverpool\Windle Island\Submissions\MM_WindleIsland_DIA_FBC_v02-KS_Reviewed-Final_LMC_Actioned.docx
22
Figure 5.4: Proportion of young people 16 – 25 in in the accidents impact area
Source: 2011 Census

Windle Island Distribution Impact Appraisal for Full Business Case
310/TPN/ITD/01/A June 2015 P:\Birmingham\ITB\Craig W\TAGs_Liverpool\Windle Island\Submissions\MM_WindleIsland_DIA_FBC_v02-KS_Reviewed-Final_LMC_Actioned.docx
23
Figure 5.5: Density of young people 16 – 25 in the accidents impact area
Source: 2011 Census
Figures 5.4 and 5.5 display the proportion and density of young people aged 16 and 25 children within
LCR, approximately 14% of the population. This is broadly in line with the district and national figures
(12% and 13% respectively). The highest densities of children under 16 are primarily concentrated in and
around urban developments.
Windle Island Distribution Impact Appraisal for Full Business Case
310/TPN/ITD/01/A June 2015 P:\Birmingham\ITB\Craig W\TAGs_Liverpool\Windle Island\Submissions\MM_WindleIsland_DIA_FBC_v02-KS_Reviewed-Final_LMC_Actioned.docx
24
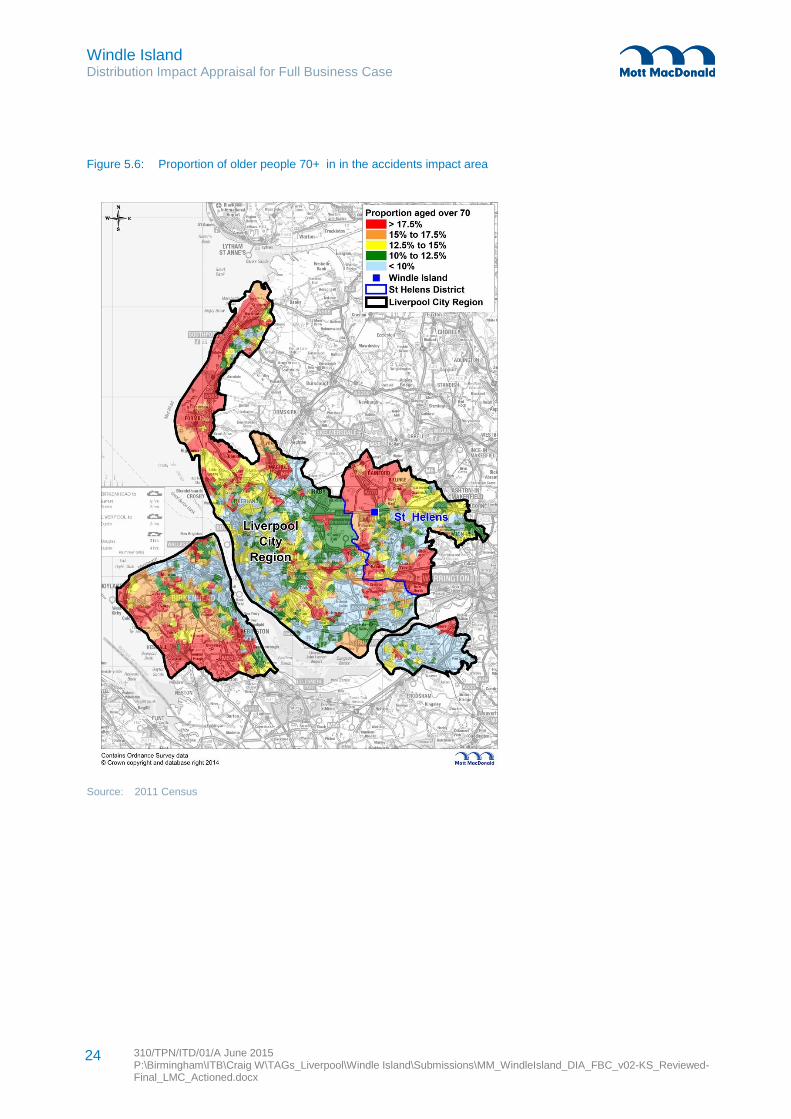
Figure 5.6: Proportion of older people 70+ in in the accidents impact area
Source: 2011 Census

Windle Island Distribution Impact Appraisal for Full Business Case
310/TPN/ITD/01/A June 2015 P:\Birmingham\ITB\Craig W\TAGs_Liverpool\Windle Island\Submissions\MM_WindleIsland_DIA_FBC_v02-KS_Reviewed-Final_LMC_Actioned.docx
25
Figure 5.7: Density of older people 70+ in the accidents impact area
Source: 2011 Census
Figures 5.6 and 5.7 display the proportion and density of older people over 70 within LCR, approximately
12% of the population, which is the same as the district and national averages (both 12%). On average
between two and eight (people over 70) per hectare live within the impact area and the highest densities
are primarily concentrated in and around urban developments.

Windle Island Distribution Impact Appraisal for Full Business Case
310/TPN/ITD/01/A June 2015 P:\Birmingham\ITB\Craig W\TAGs_Liverpool\Windle Island\Submissions\MM_WindleIsland_DIA_FBC_v02-KS_Reviewed-Final_LMC_Actioned.docx
26
Step 2c: Identification of amenities in the impact area
The identification of amenities has been deemed inappropriate for the accidents impact areas as it is too
large to warrant identification of local trip attractors.
5.4 Step 3: Appraisal of impact
Step 3a: Core analysis of impacts
The Social Impact (SI) appraisal conducted alongside this report anticipates a moderate beneficial
accidents impact as a result of the scheme. The total average cost savings associated with road and
pedestrian accident prevention as a result of road safety improvements at the junction is calculated to be
nearly £2.2 million over the period from 2008 to 2013.
The mapping of social groups in the impact area has revealed that the social groups considered to be at
risk of accidents (children under 16, young adults aged 16-25, and older people aged over 70) all have
proportions that are in line with their respective national averages. Table 5.2 summarises the assessment
scores for accident impacts. The moderate beneficial score awarded in the SI appraisal has been
preserved.
Table 5.2: Accidents - social group assessment summary table
Social Group Impact
Area National Average Assessment
Children (<16) 18% 19% Moderate beneficial
Young people (16 - 25) 14% 13% Moderate beneficial
Older people (70+) 12% 12% Moderate beneficial
Overall assessment Moderate beneficial
* 20% of LSOAs
Summary assessment score: Moderate beneficial

Windle Island Distribution Impact Appraisal for Full Business Case
310/TPN/ITD/01/A June 2015 P:\Birmingham\ITB\Craig W\TAGs_Liverpool\Windle Island\Submissions\MM_WindleIsland_DIA_FBC_v02-KS_Reviewed-Final_LMC_Actioned.docx
27
6.1 Introduction
The social groups considered relevant when considering potential security impacts are children (under 16),
young adults (16-25), older people (over 70), those with an LLTI and those from BME communities.
6.2 Step 1: Screening
Table 6.1: Distributional impact – security screening
Indicator (a) Appraisal output criteria (b) Potential
impact (c) Qualitative comments
(d) Proceed to steps 2a & 2b
Security Any change in public transport waiting/interchange facilities including pedestrian access
expected to affect user perceptions of personal security.
Expected to be neutral
People’s perception of personal safety at the site will increase due to the
improvement of facilities for pedestrians and cyclists. These improvements
include larger pedestrian/cyclist refuge areas at crossings, and protective guard
rails.
Security impacts overlap with accident impacts and to avoid double counting
security has been scoped out of the DI appraisal
No
6.3 Step 3: Appraisal of impact
Step 3a: Core analysis of impacts
It can be expected that personal safety at Windle Island junction will increase as a result of scheme
improvements; however these have been accounted for and scored in the accidents impacts assessment.
As such security impacts have been scoped out of the appraisal.
Summary assessment score: Neutral (scoped out)
6 Distributional impacts of security
Windle Island Distribution Impact Appraisal for Full Business Case
310/TPN/ITD/01/A June 2015 P:\Birmingham\ITB\Craig W\TAGs_Liverpool\Windle Island\Submissions\MM_WindleIsland_DIA_FBC_v02-KS_Reviewed-Final_LMC_Actioned.docx
28
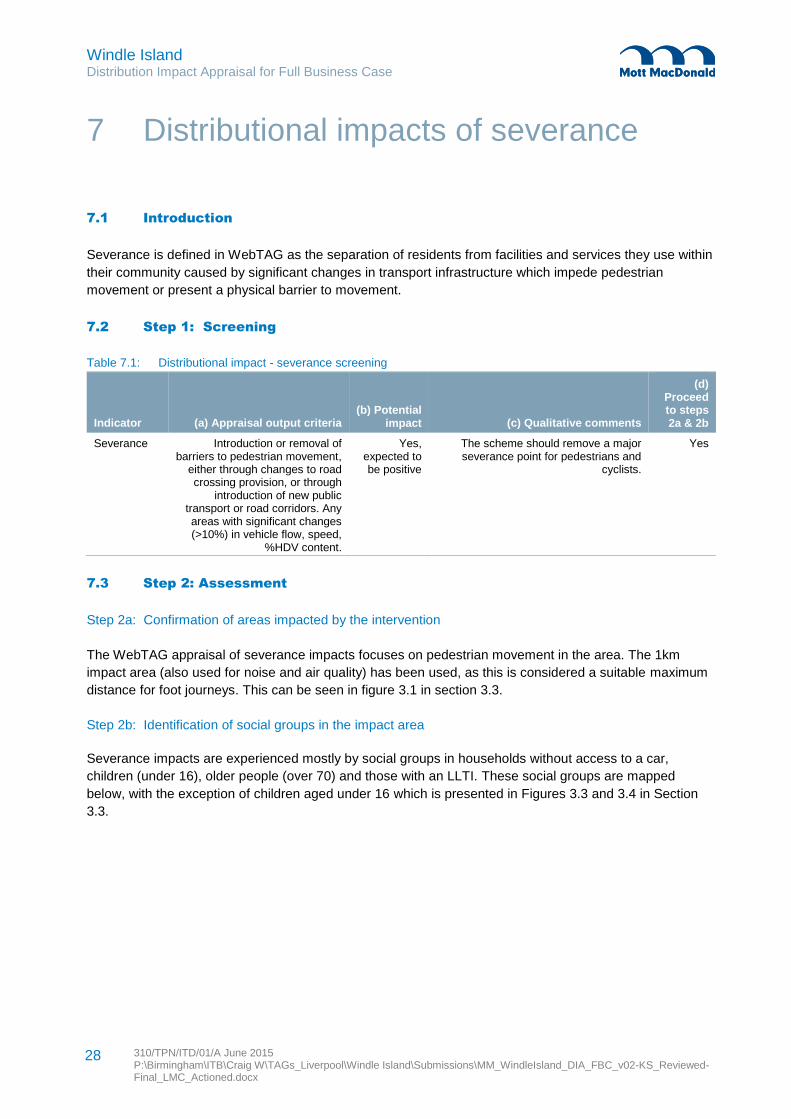
7.1 Introduction
Severance is defined in WebTAG as the separation of residents from facilities and services they use within
their community caused by significant changes in transport infrastructure which impede pedestrian
movement or present a physical barrier to movement.
7.2 Step 1: Screening
Table 7.1: Distributional impact - severance screening
Indicator (a) Appraisal output criteria (b) Potential
impact (c) Qualitative comments
(d) Proceed to steps 2a & 2b
Severance Introduction or removal of barriers to pedestrian movement,
either through changes to road crossing provision, or through
introduction of new public transport or road corridors. Any areas with significant changes (>10%) in vehicle flow, speed,
%HDV content.
Yes, expected to be positive
The scheme should remove a major severance point for pedestrians and
cyclists.
Yes
7.3 Step 2: Assessment
Step 2a: Confirmation of areas impacted by the intervention
The WebTAG appraisal of severance impacts focuses on pedestrian movement in the area. The 1km
impact area (also used for noise and air quality) has been used, as this is considered a suitable maximum
distance for foot journeys. This can be seen in figure 3.1 in section 3.3.
Step 2b: Identification of social groups in the impact area
Severance impacts are experienced mostly by social groups in households without access to a car,
children (under 16), older people (over 70) and those with an LLTI. These social groups are mapped
below, with the exception of children aged under 16 which is presented in Figures 3.3 and 3.4 in Section
3.3.
7 Distributional impacts of severance

Windle Island Distribution Impact Appraisal for Full Business Case
310/TPN/ITD/01/A June 2015 P:\Birmingham\ITB\Craig W\TAGs_Liverpool\Windle Island\Submissions\MM_WindleIsland_DIA_FBC_v02-KS_Reviewed-Final_LMC_Actioned.docx
29
Figure 7.1: Proportion of older people aged over 70 in the severance impact area
Source: 2011 Census

Windle Island Distribution Impact Appraisal for Full Business Case
310/TPN/ITD/01/A June 2015 P:\Birmingham\ITB\Craig W\TAGs_Liverpool\Windle Island\Submissions\MM_WindleIsland_DIA_FBC_v02-KS_Reviewed-Final_LMC_Actioned.docx
30
Figure 7.2: Density of older people aged over 70 in the severance impact area
Source: 2011 Census
Figures 7.1 and 7.2 display the proportion and density of older people aged over 70 within the severance
impact area. Approximately 16% of the population are aged over 70, which is higher (yet still broadly in
line) with the district and national averages of 12%.

Windle Island Distribution Impact Appraisal for Full Business Case
310/TPN/ITD/01/A June 2015 P:\Birmingham\ITB\Craig W\TAGs_Liverpool\Windle Island\Submissions\MM_WindleIsland_DIA_FBC_v02-KS_Reviewed-Final_LMC_Actioned.docx
31
Figure 7.3: Proportion of residents with an LLTI in the severance impact area
Source: 2011 Census

Windle Island Distribution Impact Appraisal for Full Business Case
310/TPN/ITD/01/A June 2015 P:\Birmingham\ITB\Craig W\TAGs_Liverpool\Windle Island\Submissions\MM_WindleIsland_DIA_FBC_v02-KS_Reviewed-Final_LMC_Actioned.docx
32
Figure 7.4: Density of residents with an LLTI in the severance impact area
Source: 2011 Census
Figures 7.3 and 7.4 display the proportion and density of those with LLTI within the severance impact area.
Approximately 19% of the population has a LLTI, which is broadly in line with the district figure of 23%, and
the national average of 18%.

Windle Island Distribution Impact Appraisal for Full Business Case
310/TPN/ITD/01/A June 2015 P:\Birmingham\ITB\Craig W\TAGs_Liverpool\Windle Island\Submissions\MM_WindleIsland_DIA_FBC_v02-KS_Reviewed-Final_LMC_Actioned.docx
33
Figure 7.5: Proportion of households with no access to a car in the severance impact area
Source: 2011 Census

Windle Island Distribution Impact Appraisal for Full Business Case
310/TPN/ITD/01/A June 2015 P:\Birmingham\ITB\Craig W\TAGs_Liverpool\Windle Island\Submissions\MM_WindleIsland_DIA_FBC_v02-KS_Reviewed-Final_LMC_Actioned.docx
34
Figure 7.6: Density of households with no access to a car in the severance impact area
Source: 2011 Census
Figures 7.5 and 7.6 display the proportion and density of households with no access to a car within the
severance impact area. Approximately 14% of households do not have access to a vehicle, considerably
lower than both district and national figures (27% and 26% respectively).
7.4 Step 3: Appraisal of Impact
Step 3a: Core analysis of impacts
The SI appraisal anticipates a moderate beneficial score for severance. All of the severance related social
groups (with the exception of no car households) have proportions that are broadly in line with their
respective national averages, preserving the moderate beneficial score awarded in the SI appraisal as
shown in Table 7.2 below.

Windle Island Distribution Impact Appraisal for Full Business Case
310/TPN/ITD/01/A June 2015 P:\Birmingham\ITB\Craig W\TAGs_Liverpool\Windle Island\Submissions\MM_WindleIsland_DIA_FBC_v02-KS_Reviewed-Final_LMC_Actioned.docx
35
Table 7.2: Severance - social group assessment summary table
Social Group Impact
area National average Assessment
Children (<16) 17% 19% Moderate beneficial
Older people (70+) 16% 12% Moderate beneficial
Those with a LLTI 19% 18% Moderate beneficial
No car households (% of households) 14% 26% Slight beneficial
Overall assessment Moderate beneficial
Summary assessment score: Moderate beneficial

Windle Island Distribution Impact Appraisal for Full Business Case
310/TPN/ITD/01/A June 2015 P:\Birmingham\ITB\Craig W\TAGs_Liverpool\Windle Island\Submissions\MM_WindleIsland_DIA_FBC_v02-KS_Reviewed-Final_LMC_Actioned.docx
36
8.1 Introduction
Accessibility assessment within a DI appraisal focuses on public transport accessibility in terms of
accessing employment, services and social networks. Social groups included within this appraisal section
include:
Income distribution
Children < 16
Young people 16 – 25
Older people 70+
Those with an LLTI
Those from BME backgrounds
Households with no car
Households with dependent children
8.2 Step 1: Screening
Table 8.1: Distributional impacts – accessibility screening
Indicator (a) Appraisal output criteria (b) Potential
impact (c) Qualitative comments
(d) Proceed to steps 2a & 2b
Accessibility Changes in routings or timings of current public transport services, any changes to public transport
provision, including routing, frequencies, waiting facilities (bus stops / rail stations) and
rolling stock, or any indirect impacts on accessibility to
services (e.g. demolition & re-location of a school).
Neutral There are no proposed public transport improvements associated with the
Windle Island scheme and as such this has been scoped out of the DI appraisal.
No
8.3 Step 3: Appraisal of impact
Step 3a: Core analysis of impacts
WebTAG 4.2 guidance for the DI appraisal primarily focuses on public transport when analysing
accessibility impacts. The Windle Island proposal does not incorporate any proposed public transport
improvements and as such this has been scoped out of this appraisal.
Summary Assessment Score: Neutral (scoped out)
8 Distributional impacts of accessibility

Windle Island Distribution Impact Appraisal for Full Business Case
310/TPN/ITD/01/A June 2015 P:\Birmingham\ITB\Craig W\TAGs_Liverpool\Windle Island\Submissions\MM_WindleIsland_DIA_FBC_v02-KS_Reviewed-Final_LMC_Actioned.docx
37
9.1 Introduction
The most significant affordability impacts relating to travel costs are experienced by young adults (16-25)
and older people (over 70) and those within low income households, particularly when travelling to
employment and education sites.
9.2 Step 1: Screening
Table 9.1: Distributional impacts – affordability screening
Indicator (a) Appraisal output criteria (b) Potential
impact (c) Qualitative comments
(d) Proceed to steps 2a & 2b
Affordability In cases where the following charges would occur; Parking
charges (including where changes in the allocation of free
or reduced fee spaces may occur); Car fuel and non-fuel
operating costs (where, for example, rerouting or changes in
journey speeds and congestion occur resulting in changes in
costs); Road user charges (including discounts and
exemptions for different groups of travellers); Public transport
fare changes (where, for example premium fares are set
on new or existing modes or where multi-modal discounted
travel tickets become available due to new ticketing
technologies); or public transport concession availability (where,
for example concession arrangements vary as a result of a move in service provision from
bus to light rail or heavy rail, where such concession
entitlement is not maintained by the local authority).
Expected to be neutral
The scheme’s impacts are unlikely to affect affordability issues directly.
No
9.3 Step 3: Appraisal of impact
Step 3a: Core analysis of impacts
There are no changes identified that affect travel affordability so this has been scoped out of the DI
appraisal.
Summary Assessment Score: Neutral (scoped out)
9 Distributional impacts of personal affordability

Windle Island Distribution Impact Appraisal for Full Business Case
310/TPN/ITD/01/A June 2015 P:\Birmingham\ITB\Craig W\TAGs_Liverpool\Windle Island\Submissions\MM_WindleIsland_DIA_FBC_v02-KS_Reviewed-Final_LMC_Actioned.docx
38
10.1 Distributional impact appraisal summary
This appraisal has addressed the eight distributional impact areas outlined in TAG Unit 4.2. The report has
followed a quantitative and qualitative approach, assigning an assessment score on a seven point scale of
beneficial, neutral and adverse for each impact area.
The appraisal has found that the scheme will deliver broadly positive benefits. Table 10.1 below provides a
summary of the assessment scores assigned to each impact area.
Table 10.1: Summary assessment scores
Impact area Score
User benefits Moderate beneficial
Noise Neutral
Air quality Moderate beneficial
Accidents Moderate beneficial
Security Neutral (scoped out)
Severance Moderate beneficial
Accessibility Neutral (scoped out)
Personal affordability Neutral (scoped out)
The overall output summary table and distributional impact matrix can be seen in Tables 10.1 and 10.2
overleaf. These tables were used as the basis of assigning DI assessment scores to each of the impact
areas.
10 Step 3B: Summary of DIs and AST

39 310/TPN/ITD/01/A June 2015 P:\Birmingham\ITB\Craig W\TAGs_Liverpool\Windle Island\Submissions\MM_WindleIsland_DIA_FBC_v02-KS_Reviewed-Final_LMC_Actioned.docx
Windle Island Distribution Impact Appraisal for Full Business Case
Figure 10.1: Output Summary Table
User
Ben
efi
ts
No
ise
Air
qu
ali
ty
Accid
en
ts
Secu
rity
Severa
nce
Accessib
ilit
y
Aff
ord
ab
ilit
y
St
Hele
ns
En
gla
nd
0-20% 37% 9% 9% 35% *20%
20-40% 18% 1% 1% 23% *20%
40-60% 18% 9% 9% 11% *20%
60-80% 16% 9% 9% 19% *20%
80-100% 12% 73% 73% 13% *20%
17% 17% 18% 17% 18% 19%
10% 10% 14% 12% 13%
16% 12% 16% 12% 12%
19% 23% 18%
3% 20%
14% 27% 26%
29% 29%
1,819,804 5,261 5,261 1,506,935 5,261 175,308 53,012,456
- -
- -
- -
- -
- - -
- -
- -
* This value represents the proportion of LSOA's within the IMD Income Distribution band
Indicator population in the impact area
Amenities present
within the impact area
Schools / nurseries
Playgrounds
Parks and open spaces
Hospitals
Care homes / day centres
Community centre
Social group and amenities indicators
Resident population in
the impact area
Children (<16)
Young people
Older people
People with a disability
Black Minority Ethnic
No car households
Households with dependent children
Income distribution
quintiles

40 310/TPN/ITD/01/A June 2015 P:\Birmingham\ITB\Craig W\TAGs_Liverpool\Windle Island\Submissions\MM_WindleIsland_DIA_FBC_v02-KS_Reviewed-Final_LMC_Actioned.docx
Windle Island Distribution Impact Appraisal for Full Business Case
Figure 10.2: Distributional Impact Appraisal Matrix
0-20% 20-40% 40-60% 60-80% 80-100%
User benefits
No
Noise
No
Air quality
No
Affordability
Accessibility
Children
& young
people
Older
people Carers Women Disabled BME Pedestrians Cyclists
Motor-
cyclists
Young
male
drivers
Noise Neutral
Neutral
Air Quality
Beneficial and the population impacted is broadly in line w ith the
proportion of the group in the total population.
Accidents
Beneficial and the population impacted is broadly in line w ith the
proportion of the group in the total population.
Security
Neutral
Severance
Beneficial and the population impacted is broadly in line w ith the
proportion of the group in the total population.
Accessibility
Neutral
Scoped out at initial screening stage
Scoped out at initial screening stage
AST entry
The noise impact study area has a disproportionate spread of income deprivation, therefore noise impacts w ould
be spread disproportionately amongst the income deprivation quintiles. How ever, the environmental analysis has
show n the level of noise impact is expected to be neutral and therefore this is unlikely to result in an impact for this
scheme.
The air quality impact study area has a disproportionate spread of income deprivation, therefore air quality impacts
w ould be spread disproportionately amongst the income deprivation quintiles. How ever, the environmental analysis
has show n the level of air quality impact is expected to be slight and therefore this is unlikely to result in a
signif icant overall impact for this scheme.
The impact area has a mixed spread of income deprivation, how ever the largest proportion of the population w ithin
the impact area is w ithin the most income deprived quintile (37%). Therefore it can be expected that impacts w ill be
slightly disproportionate, w ith a geater share of the benefits being seen by low income residents.
Not quantitatively assessed
Not quantitatively assessed
Not quantitatively assessed
Scoped out at initial screening stage
Scoped out at initial screening stage
Qualitative statement (including any impact on
residential population AND identified amenities)
Key impacts - Qualitative statements (example below)
Windle Island
Distributional impact of income deprivation
Are the
impacts
distributed
evenly?
Impact
Social groups User groups

41 310/TPN/ITD/01/A June 2015 P:\Birmingham\ITB\Craig W\TAGs_Liverpool\Windle Island\Submissions\MM_WindleIsland_DIA_FBC_v02-KS_Reviewed-Final_LMC_Actioned.docx
Windle Island Distribution Impact Appraisal for Full Business Case
Windle Island Distribution Impact Appraisal for Full Business Case
310/TPN/ITD/01/A June 2015 P:\Birmingham\ITB\Craig W\TAGs_Liverpool\Windle Island\Submissions\MM_WindleIsland_DIA_FBC_v02-KS_Reviewed-Final_LMC_Actioned.docx
42
10.2 Next steps
This DI appraisal will be included as an appendix to the FBC for the proposed Windle Island scheme. This
appraisal will help inform the decision-making for major transport scheme funding.