Embed Size (px)
Citation preview
RESEARCH Open Access
Movement of leopard tortoises in responseto environmental and climatic variables ina semi-arid environmentMartyn Drabik-Hamshare and Colleen T. Downs*
Abstract
Background: Tortoises (Testudinidae) occur in a wide range of environments, providing important ecosystemfunctions, such as seed dispersal and refuge in the form of burrows. Tortoise movement has previously beenshown to be related to resource availability, reproductive status and local environmental conditions. However,understanding of the variables that drive their movement remains comparatively low. We investigated aspectsof movement in leopard tortoises Stigmochelys pardalis—the largest and most abundant tortoise species insub-Saharan Africa—in response to environmental, climatic and individual variables in the semi-arid Karoo, SouthAfrica. We used GPS telemetry to calculate bihourly and daily movement and used generalized linear mixed models(GLMMs) to ascertain important predictor variables.
Results: Temperature, distance from water sources, and month were important variables for predicting bothbihourly and daily movement. Our results showed that movement increased when individuals were close toknown water sources, indicating that individuals close to water resources make regular long distance movements.Movement showed a positive relationship for temperature in both models, whilst rainfall was an importantpredictor for bihourly movement. Our results displayed aspects of seasonality, with movement highest in springmonths, likely related to reproductive activities, although no sex differences were observed.
Conclusions: We identified temporal and spatial conditions in which leopard tortoise movement increased. Ourresults further support the relationship between water as a resource and movement in leopard tortoises. Individualsused one of two basic movement behaviours in relation to water in this water scarce environment. Either anindividual’s home range and movements included permanent water resources allowing internal water storagereplenishment, or excluded these with reliance on food resources (such as grasses, forbs, and succulents) for water.
Keywords: Spatial ecology, Water loss, Karoo, Stigmochelys pardalis, Environmental variables, Electric fencing
BackgroundContinual growth of human population increases the needto harvest and distribute essential resources, causing modi-fications to environments, and subsequent disturbance andcontamination of local ecosystems [1]. Such land usechange is a primary cause for damage to ecosystems andanimal populations [2], as it directly relates to habitat loss,habitat defragmentation, and global warming [3]. It is ofgreat importance to conduct systematic research withregards to potential effects of land use change, in order to
produce effective decision-making and management forprotection and conservation of endangered and threatenedspecies and habitats. Land use change in the Central Karooover the last few centuries has greatly affected animal popu-lations, with the vast majority of pre-existing lands nowconverted to private commercial farming. Introduction oflivestock, building of roads and fences, and reliance ofanimal and human communities on already depleted watersupplies, has negatively affected many animal and plantspecies. For example, wattled cranes (Bugeranus caruncula-tus), southern bald ibis (Geronticus calvus), and Capevultures (Gyps coprotheres)—regionally common before thearrival of Europeans (c. 1650)—are now all but extinctregionally, partly due to changes in availability of water and
* Correspondence: [email protected] of Life Sciences, University of KwaZulu-Natal, Private Bag X01,Scottsville, Pietermaritzburg, KwaZulu-Natal 3209, South Africa
© The Author(s). 2017 Open Access This article is distributed under the terms of the Creative Commons Attribution 4.0International License (http://creativecommons.org/licenses/by/4.0/), which permits unrestricted use, distribution, andreproduction in any medium, provided you give appropriate credit to the original author(s) and the source, provide a link tothe Creative Commons license, and indicate if changes were made. The Creative Commons Public Domain Dedication waiver(http://creativecommons.org/publicdomain/zero/1.0/) applies to the data made available in this article, unless otherwise stated.
Drabik-Hamshare and Downs Movement Ecology (2017) 5:5 DOI 10.1186/s40462-017-0096-y
natural food resources [4–6]. Changes in land use in theKaroo are expected to continue with the introduction ofhydraulic fracturing (fracking) activities: a process wherebyfuel is extracted from deep within the Earth’s surfacefollowing the injection of a highly pressurised liquidfluid [7]. Fracking operations are expected before endof 2017 [8, 9], despite worries about impacts on hu-man and animal communities due to increasing watersalinity and altering water quality through accidentalrelease of water runoff [10, 11].The Karoo is an important ecosystem, as it is seen as a
centre for endemism in birds and reptiles [12, 13]. Forexample, of the 18 tortoise species in sub-SaharanAfrica, at least eight species occur somewhere in theKaroo: up to five sympatrically [14–16]. Tortoises are ofthe most threatened animals, with as many as 80% clas-sified at least as ‘Vulnerable’, and 47% at least as ‘Endan-gered’ by the International Union for the Conservationof Nature (IUCN) [14, 17]. The importance of tortoisesto their environments is increasingly being understood.Tortoises provide an important ecosystem function inthe form of seed dispersal [18, 19] promoted by period-ical long distance movement and long gut retention time[20]. This function is particularly importance in xericareas where natural herbivores are no longer present.Tortoises are considered keystone species in some re-gions. For example, burrowing species such as Gopherusspp. produce refugia used by multiple species to escapeharsh environmental conditions [21]. It is important toimprove understanding of tortoise spatial ecology.Tortoises are able to tolerate imbalances in regards to
their water:electrolyte ratio [22, 23], allowing a greaterability to survive drought conditions [23, 24]. However,drinking water remains necessary to facilitate urinationto remove waste products, which otherwise can causesevere stress and mortality [24]. Several studies investigat-ing spatial ecology of tortoises have identified the positiverelationship between movement and water (e.g. perman-ent water sources or rainfall) with movement typicallyincreased after periods of higher rainfall [22, 25–29]. In-creased tortoise movement has also been related to highertemperatures [30, 31], seasonality (e.g. higher in spring)[31–34], and reproductive status (search for mates, egg-laying habitat and resources to feed increased energydemand) [32, 35–38]. Resource availability also appears tobe of importance. For example, distribution and move-ment in Aldabra tortoises (Aldabrachelys gigantea)appears to be related to resources [39], whilst the SantaCruz giant tortoise of the Galápagos archipelago (Che-lonoidis nigra) undertakes seasonal altitudinal mig-rations in response to vegetation dynamics [40]. Incontrast, most other tortoise species maintain homeranges, instead modifying home range size in responseto resource availability [22, 34]. Further information is
required to better understand interactions betweentortoises and environmental conditions.The leopard tortoise (Stigmochelys pardalis) is the
largest tortoise species in sub-Saharan Africa, inhabitinga wide range of environmental conditions across theeastern and southern parts of the continent [14, 15]. Thespecies is currently classified by IUCN as ‘LeastConcern’ [14, 36], though they appear to be particularlyvulnerable to electric fencing, which is common inKaroo farms to control predation on livestock by caracal(Caracal caracal) and black-backed jackal (Canismesomelas) [41]. Previous leopard tortoise research hasshown great variability in movement distances and homerange sizes, likely related to seasonal temperature, foodavailability, rainfall, mean body mass, and access to otherimportant resources [31, 33, 42]. For example, leopardtortoises were shown to move much larger distances inthe Nama-Karoo (up to 8 km per day) [33]—even dis-playing nomadic behaviour in some cases [26]—whencompared with populations in valley thicket (up to100 m per day) [43] and Swaziland (about 50 m per day)[31]. Karoo leopard tortoises also have larger homerange sizes, using areas upwards of 200 ha [33] com-pared with valley thicket (57.56 ha) and Swaziland(13.49 ha). These studies suggest that movement andhome range is higher in areas where resource availability(e.g. food, water, and mates) is decreased. Despite severalstudies investigating movement of leopard tortoises, in-formation on drivers of movement and habitat use is notfully understood.Geolocation information helps to understand species
interactions, identify important habitats, and quantifythe relationship between behaviour and climatic andenvironmental variables [44]. Improving knowledge ofspatial ecology is important to identify biotic and abioticeffects relating to land use, and to guide successful man-agement decisions for species conservation [45]. Globalpositioning system (GPS) transmitters were deployed onten wild-caught individuals. We set out to further inves-tigate spatial ecology of leopard tortoises, to a) providedetails on movement distances in relation to climatic,environmental and sex variables, and b) highlight im-portance of water and food resources.We predicted higher movement closer to important
resources (e.g. food and water), as previous studies haveshown increased activity when resources are abundant[22]. We predicted climatic variables (temperature andrainfall) would positively influence movement, as highertemperatures causes increased metabolic rates; whilsttortoises are expected to seek natural water sources afterrain events [22, 28]. Finally, we expected tortoises wouldmake larger movements during the breeding season(September to November), as mate-searching, egg-laying,and associated increases in energy demand is increased
Drabik-Hamshare and Downs Movement Ecology (2017) 5:5 Page 2 of 16
[46, 47]. However, given leopard tortoises can occur atvery low densities (0.017 tortoises per ha) [25], we ex-pected mate-searching behaviour by males would producehigher movements overall.
MethodsStudy areaThe semi-arid Karoo covers much of the Northern,Western and Eastern Cape Provinces of South Africa,covering an area of approximately 37 million ha [48].Northern and western parts of the Karoo are typicallyarid, though even in eastern semi-arid areas, rainfall isboth unpredictable and unreliable [49, 50]. During sum-mer, daily temperatures of more than 30 °C are regularlyrecorded [49], whilst severe frost events also occur [51].Plants in the region have adapted to such conditions—hairycuticles, tannins and phenolic compounds [52]—to copewith severe stress and desiccation [48, 49, 53]. Due tocommon weather conditions, vegetation of the CentralKaroo is highly homogenous with typically low levelsof endemism [54].The study was carried out on three private mixed live-
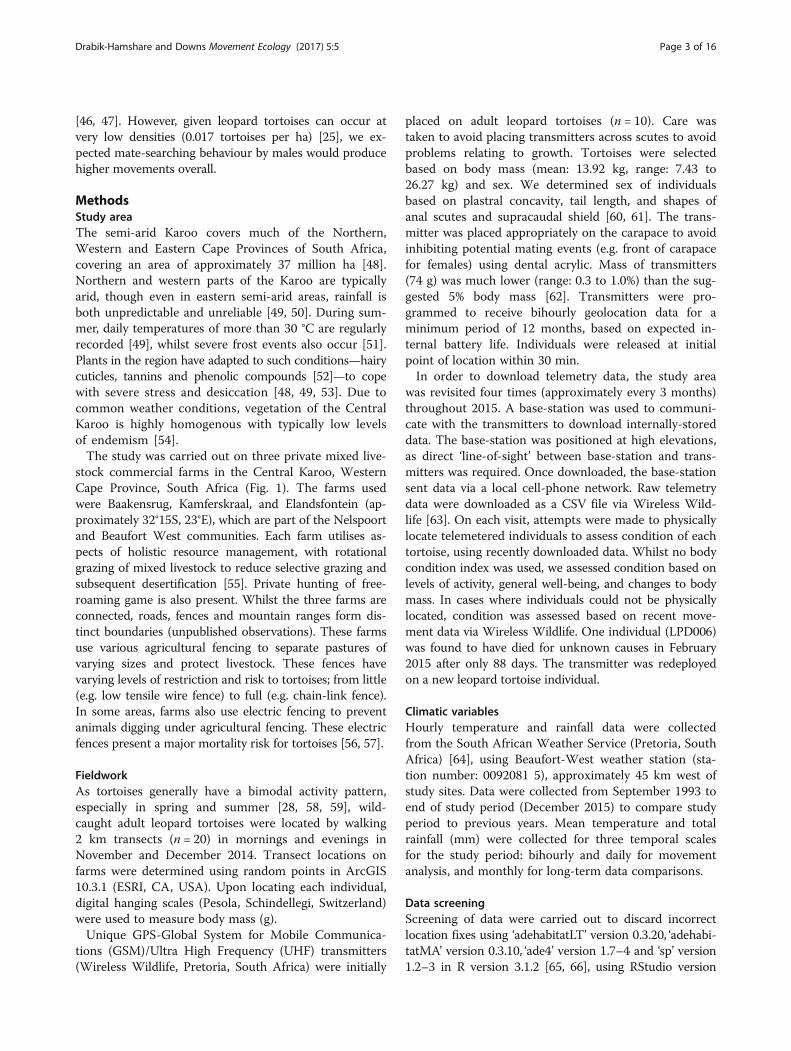
stock commercial farms in the Central Karoo, WesternCape Province, South Africa (Fig. 1). The farms usedwere Baakensrug, Kamferskraal, and Elandsfontein (ap-proximately 32°15S, 23°E), which are part of the Nelspoortand Beaufort West communities. Each farm utilises as-pects of holistic resource management, with rotationalgrazing of mixed livestock to reduce selective grazing andsubsequent desertification [55]. Private hunting of free-roaming game is also present. Whilst the three farms areconnected, roads, fences and mountain ranges form dis-tinct boundaries (unpublished observations). These farmsuse various agricultural fencing to separate pastures ofvarying sizes and protect livestock. These fences havevarying levels of restriction and risk to tortoises; from little(e.g. low tensile wire fence) to full (e.g. chain-link fence).In some areas, farms also use electric fencing to preventanimals digging under agricultural fencing. These electricfences present a major mortality risk for tortoises [56, 57].
FieldworkAs tortoises generally have a bimodal activity pattern,especially in spring and summer [28, 58, 59], wild-caught adult leopard tortoises were located by walking2 km transects (n = 20) in mornings and evenings inNovember and December 2014. Transect locations onfarms were determined using random points in ArcGIS10.3.1 (ESRI, CA, USA). Upon locating each individual,digital hanging scales (Pesola, Schindellegi, Switzerland)were used to measure body mass (g).Unique GPS-Global System for Mobile Communica-
tions (GSM)/Ultra High Frequency (UHF) transmitters(Wireless Wildlife, Pretoria, South Africa) were initially
placed on adult leopard tortoises (n = 10). Care wastaken to avoid placing transmitters across scutes to avoidproblems relating to growth. Tortoises were selectedbased on body mass (mean: 13.92 kg, range: 7.43 to26.27 kg) and sex. We determined sex of individualsbased on plastral concavity, tail length, and shapes ofanal scutes and supracaudal shield [60, 61]. The trans-mitter was placed appropriately on the carapace to avoidinhibiting potential mating events (e.g. front of carapacefor females) using dental acrylic. Mass of transmitters(74 g) was much lower (range: 0.3 to 1.0%) than the sug-gested 5% body mass [62]. Transmitters were pro-grammed to receive bihourly geolocation data for aminimum period of 12 months, based on expected in-ternal battery life. Individuals were released at initialpoint of location within 30 min.In order to download telemetry data, the study area
was revisited four times (approximately every 3 months)throughout 2015. A base-station was used to communi-cate with the transmitters to download internally-storeddata. The base-station was positioned at high elevations,as direct ‘line-of-sight’ between base-station and trans-mitters was required. Once downloaded, the base-stationsent data via a local cell-phone network. Raw telemetrydata were downloaded as a CSV file via Wireless Wild-life [63]. On each visit, attempts were made to physicallylocate telemetered individuals to assess condition of eachtortoise, using recently downloaded data. Whilst no bodycondition index was used, we assessed condition based onlevels of activity, general well-being, and changes to bodymass. In cases where individuals could not be physicallylocated, condition was assessed based on recent move-ment data via Wireless Wildlife. One individual (LPD006)was found to have died for unknown causes in February2015 after only 88 days. The transmitter was redeployedon a new leopard tortoise individual.
Climatic variablesHourly temperature and rainfall data were collectedfrom the South African Weather Service (Pretoria, SouthAfrica) [64], using Beaufort-West weather station (sta-tion number: 0092081 5), approximately 45 km west ofstudy sites. Data were collected from September 1993 toend of study period (December 2015) to compare studyperiod to previous years. Mean temperature and totalrainfall (mm) were collected for three temporal scalesfor the study period: bihourly and daily for movementanalysis, and monthly for long-term data comparisons.
Data screeningScreening of data were carried out to discard incorrectlocation fixes using ‘adehabitatLT’ version 0.3.20, ‘adehabi-tatMA’ version 0.3.10, ‘ade4’ version 1.7–4 and ‘sp’ version1.2–3 in R version 3.1.2 [65, 66], using RStudio version
Drabik-Hamshare and Downs Movement Ecology (2017) 5:5 Page 3 of 16
0.98.1091 [67]. Data were discarded based on values forextreme horizontal dilution of precision (HDOP) values,incorrect time zones, incomplete or dubious transmitterdata (e.g. negative activity), impossible and improbablemovement distances, and z-coordinate error.
Habitat extraction and proximityA 2014 South Africa land cover layer was downloadedfrom GEOTERRAIMAGE (Pretoria, South Africa). The
land cover layer is a raster that categorises land area as ahabitat; for example, grassland, low shrubland, or culti-vated commercial fields. ArcGIS was used to crop rasterto local area. Habitats were extracted from the rasterlayer to each GPS location, with extracted results savedas an Excel file. The land cover raster layer wasconverted to place a point for each 3 m × 3 m pixel.In addition, two other important layers were also used;
inland water areas, and manmade water source points;
Fig. 1 Study sites. Local area map of study sites near Beaufort West, South Africa
Drabik-Hamshare and Downs Movement Ecology (2017) 5:5 Page 4 of 16
taken from a 1:50,000 topographical map of SouthAfrica. These two layers represent potentially importantwater features that may not be recognised by the landcover layer, as the feature is within a forested area (andso would be classified as the top layer) or is too small tobe recognised in the South Africa land cover layer (man-made wells and feeding or drinking stations for live-stock). We calculated an individual’s Euclidean distanceto water resources (inland water areas and manmadewater source points) to create an additional predictorvariable for generalized linear mixed models (GLMMs).For purpose of identifying associations with habitats
that might supply more food resources, we groupedother habitat categories (dense bush, open bush, wetland,grassland, cultivated commercial fields) based on expecta-tions compared to low shrubland and non-vegetated habi-tats (Table 1). We grouped the cultivated commercial fieldcategories, which were previously separated into high,medium or low layers. Other habitat types were excluded,due to no nearby tortoise location data. We used theproximity function to also calculate distances to a)water resources, b) increased food resources, and 3)cultivation areas.
StatisticsPrior to calculating distances between tortoise locations,transmitter fix error was quantified. We used Euclideandistances between fix locations and known transmitterlocations in Pietermaritzburg, South Africa, prior totransmitter deployment. Test data had a mean (± SE) fixerror of 17.01 ± 0.59 m (range: 1.78 to 134.78 m).Distances between transmitter locations and subse-
quent statistical analyses were carried out in R [65] using
RStudio [67]. Bihourly movement was calculated using‘adehabitatLT’, ‘adehabitatMA’, ‘ade4’ and ‘sp’ [66]. We as-sumed each movement was Euclidean distance betweensuccessive locations [68]. We assumed each location fixwas affected by a fix error. We ranked calculated dis-tance for each movement and assumed larger distanceswere more likely to be due to larger fix errors. There-fore, we corrected each calculated distance by deductinginverse log of the quantile for the known error fixes(Equation 1), where drank is the dth percentile from logtransformed known error distribution, dest is estimateddistance between points, and dcorr is corrected distance.
dcorr ¼ dest−10 log drankð Þ ð1Þ
In addition to the above, data was also screened basedon z-coordinate error [69]. Internal transmitter altitudeestimates were compared with approximate heights indigital elevation models (DEMs)—freely available from‘raster’ version 2.5–2 package [70]—and discarded whenz-coordinate error exceeded 100 m. Fixes were alsodiscarded if time record was not approximate to prede-fined settings (e.g. > 120 s after intended fix), whichwould indicate error in transmitter functionality orinaccuracy based on receiving satellite data.Cumulative distances were calculated for daily and
monthly periods for all but one individual: LPD006 wasexcluded from analyses due to death and reduced data.Bihourly and daily movement distances were tested fornormality using a ‘quantile-quantile’ plot using ‘stats’version 3.1.2 package in R [65]. As these data were heav-ily right-skewed, log transformations of both bihourlyand daily datasets were carried out prior to analyses. As
Table 1 Habitat and resource groupings used in the current study
Land cover layer classification Updated classification Additional layers Resource categories
Water seasonal Water seasonal - Water
Water permanent Water permanent - Water
Wetlands Wetlands - Food
Thicket/Dense bush Dense bush - Food
Woodlan/Open bush Open bush - Food
Grassland Grassland - Food
Low shrubland Low shrubland - None
Cultivated comm fields (high) Cultivated commercial fields - Food
Cultivated comm fields (med) Cultivated commercial fields - Food
Cultivated comm fields (low) Cultivated commercial fields - Food
Bare none vegetated Non-vegetated - None
- - Manmade water source points Water
- - Inland water areas Water
(Habitat classifications were from 2014 South Africa land cover layer, GEOTERRAIMAGE (Pretoria, South Africa). Additional layers include manmade water sourcepoints and inland water areas from a 1:50,000 topographical map of South Africa. Resource categories are based on expected access to increased food resourcesand water.)
Drabik-Hamshare and Downs Movement Ecology (2017) 5:5 Page 5 of 16
tortoise movement can be strongly affected by environ-mental conditions [22], we compared the study year tolong-term data for the region. We used Welch two sam-ple t-tests to compare monthly mean temperature andtotal rainfall data to previous years.GLMMs were used to create and test models to com-
pare effect of predictor variables on bihourly and dailymovement. Predictor variables used were a mix of indi-vidual, environmental and weather variables; habitat,month, sex, time of day, distance from water source,mean temperature, and total rainfall. Tortoise ID was setas the random variable to account for pseudoreplication.To ensure data were standardised, we used the standardizefunction in ‘arm’ version 1.8–6 package in R [71]. For dailymodels, habitat type for each datapoint was determined asthe most common habitat type used by individual for eachday. Time of day was not included in daily analysis, ashour-sensitive data were combined for each day. For thecontinuous predictor variables in daily models we tookthe mean result for all locations during that day. Asidefrom temperature, continuous predictor variables usedin bihourly models did not use mean results. Allpossible combination models were tested using the‘glmer’ function within ‘lme4’ version 1.1–10 package[72] and ‘dredge’ function using ‘MuMIn’ version1.15.6 package [73].Top candidate models (ΔAICc < 2) were selected for
bihourly and daily GLMMs, with models ranked basedon values for AICc; Akaike’s Information Criterion, ad-justed for small sample size [74]. As both GLMMs pro-vided more than one top model, model averaging wasused to identify important predictor variables and modelcoefficients based on those variables. All mean move-ment results are reported with standard error (± SE).Interaction effects for important predictor variables inboth models were tested using analysis of deviance in‘phia’ version 0.2–1 package [75]. For bihourly models,we tested effect of month and time on other variables,whilst month and habitat were tested for daily models.Predictor variables not identified as important wereexcluded from post-hoc analyses.
ResultsMovement summaryAs mentioned, relocation data were collected from 10telemetry transmitters on adult leopard tortoises fromNovember 2014 to December 2015. LPD048 was trackedfor only 283 days, as the transmitter was redeployedfollowing death of LPD006. All other individuals weretracked for a minimum of 359 days. In total, 42,467 datapoints were collected (Table 2). The data screeningprocess removed 5,413 data points: a mean (± SE) of541.3 (± 77.20) per individual. The final bihourly datasetconsisted of 37,054 data points.
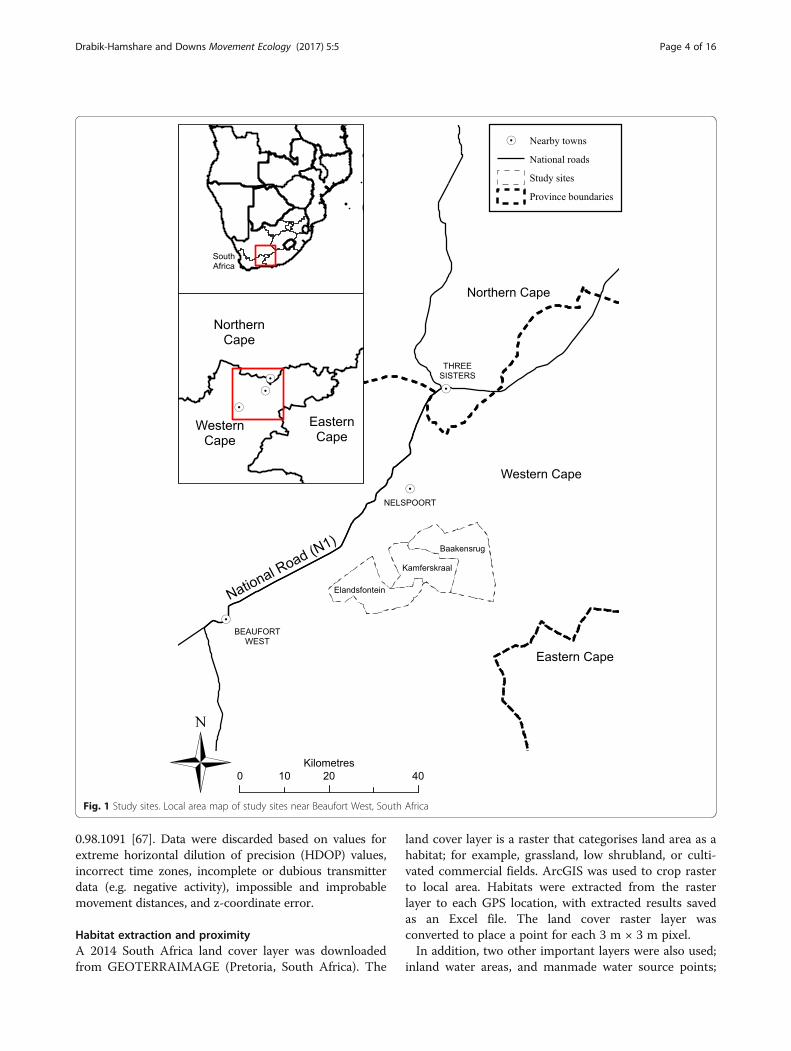
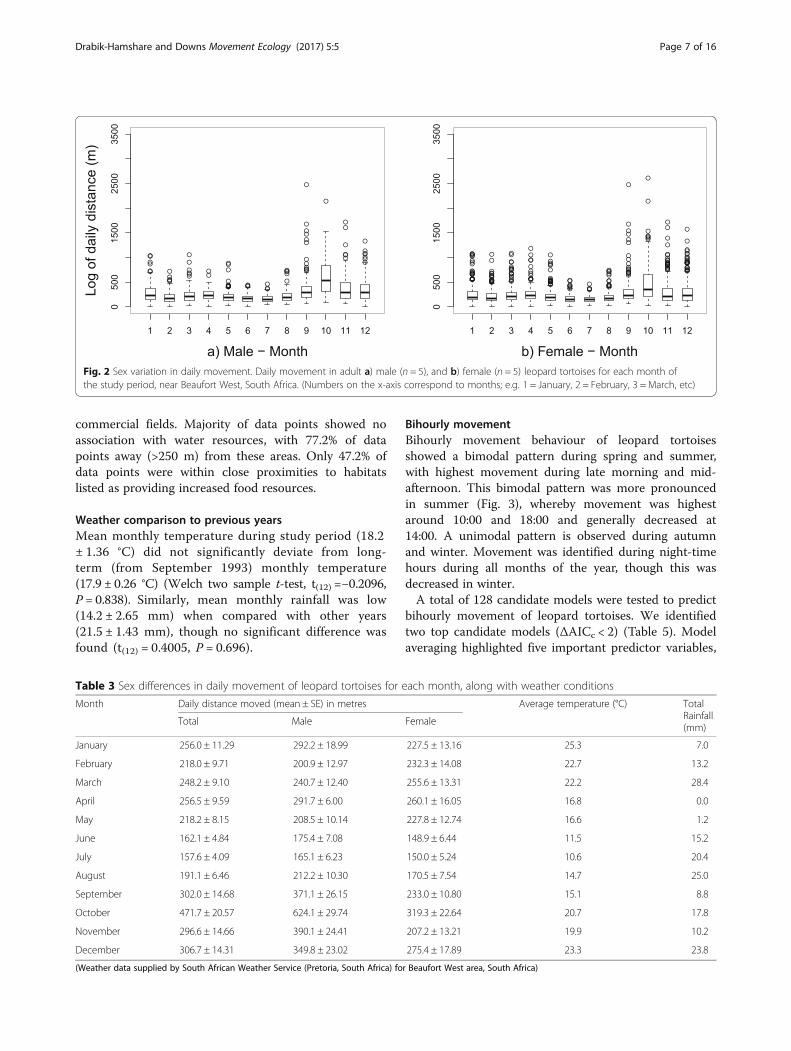
Bihourly and daily movement of leopard tortoiseswere calculated for each individual throughout courseof the study period. Overall mean distance movedby leopard tortoises was 257.7 (± 3.64) m per day(range: 1.79 to 2611.24 m). Males (291.6 ± 6.00 m)appeared to move further than females (225.9 ±4.11 m), although largest daily distance moved was by afemale (2611.24 m). The largest daily distance by a maletortoise was 2477.31 m. Movement varied seasonally,with spring months of September (302.0 ± 14.68 m),October (471.7 ± 20.57 m), and November (295.6 ±14.66 m) showing largest daily movement distances(Fig. 2, Table 3). Mean daily movement was consistentlyabove 150 m per day throughout much of the year, butwinter months showed the shortest movement dis-tances; June (162.1 ± 4.84 m), July (157.6 ± 4.09 m), andAugust (191.1 ± 6.46 m).
Habitat type associationsHabitat extractions showed variability between individ-ual leopard tortoises. Whilst 85.1% of all data pointswere within habitat classified as ‘low shrubland’, twoindividuals were found in low shrubland habitat lessthan 50% of the time. In each, dense bush was an im-portant habitat type, with over 30% of data points. Useof wetlands (0.05%), grassland (1.1%), and non-vegetated(2.1%) habitats were used infrequently, although amountof land covered by each of these was much lower thanlow shrubland. There were changes to habitat usethroughout the year (Table 4), in particular during win-ter months (June to August), where individuals appearedto stay in low shrubland areas.The above is also reflected by associations leopard
tortoises had with features. Only one telemetered indi-vidual (LPD011) approached within 250 m of cultivated
Table 2 Biological information for each telemetered individualleopard tortoise, along with the number of geolocation fixesused in final analyses for each
Individual Farm Sex Body mass (g) Screened fixes
LPD001 Baakensrug Female 11,685 4017
LPD002 Baakensrug Female 11,580 3587
LPD004 Baakensrug Male 7,425 4122
LPD010 Kamferskraal Female 26,167 4159
LPD011 Kamferskraal Female 18,400 3647
LPD013 Kamferskraal Male 12,560 3790
LPD015 Elandsfontein Male 15,125 3941
LPD016 Elandsfontein Male 14,870 3330
LPD017 Elandsfontein Female 16,638 3884
LPD048* Baakensrug Male 9,275 2577
*Telemetered individual LPD006 was found dead through course of study. TheGPS unit was recovered and reattached to a new individual (LPD048). Datafrom the dead tortoise were excluded from the analyses
Drabik-Hamshare and Downs Movement Ecology (2017) 5:5 Page 6 of 16
commercial fields. Majority of data points showed noassociation with water resources, with 77.2% of datapoints away (>250 m) from these areas. Only 47.2% ofdata points were within close proximities to habitatslisted as providing increased food resources.
Weather comparison to previous yearsMean monthly temperature during study period (18.2± 1.36 °C) did not significantly deviate from long-term (from September 1993) monthly temperature(17.9 ± 0.26 °C) (Welch two sample t-test, t(12) =−0.2096,P = 0.838). Similarly, mean monthly rainfall was low(14.2 ± 2.65 mm) when compared with other years(21.5 ± 1.43 mm), though no significant difference wasfound (t(12) = 0.4005, P = 0.696).
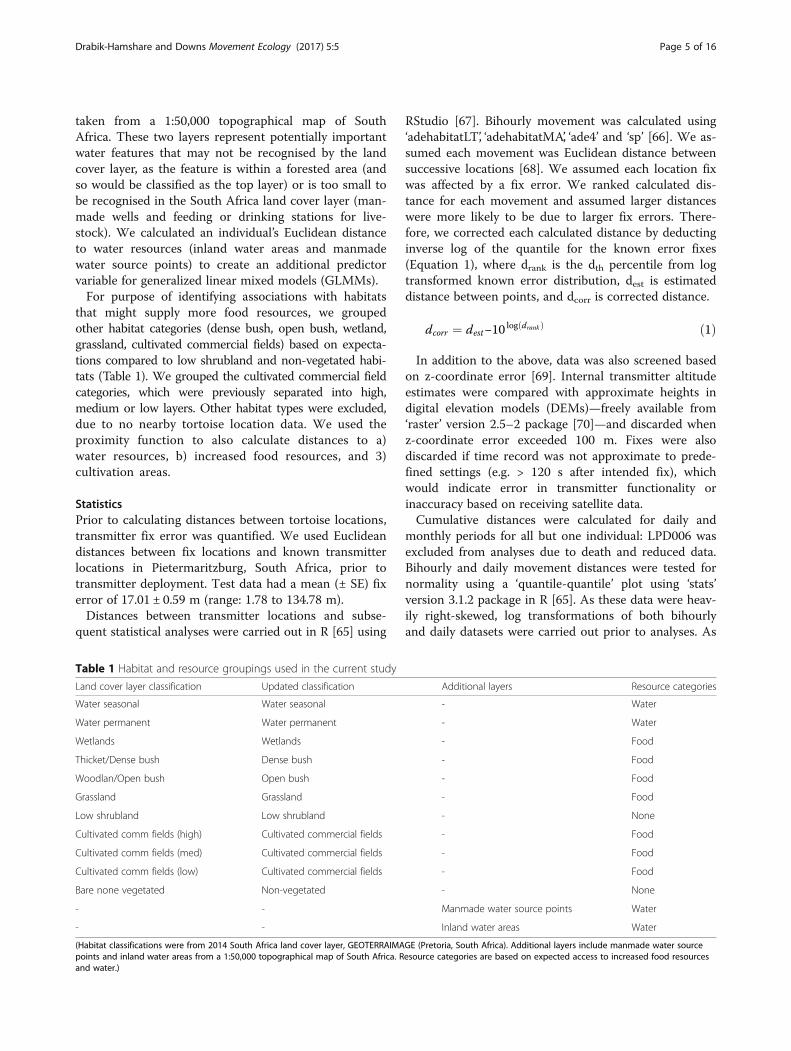
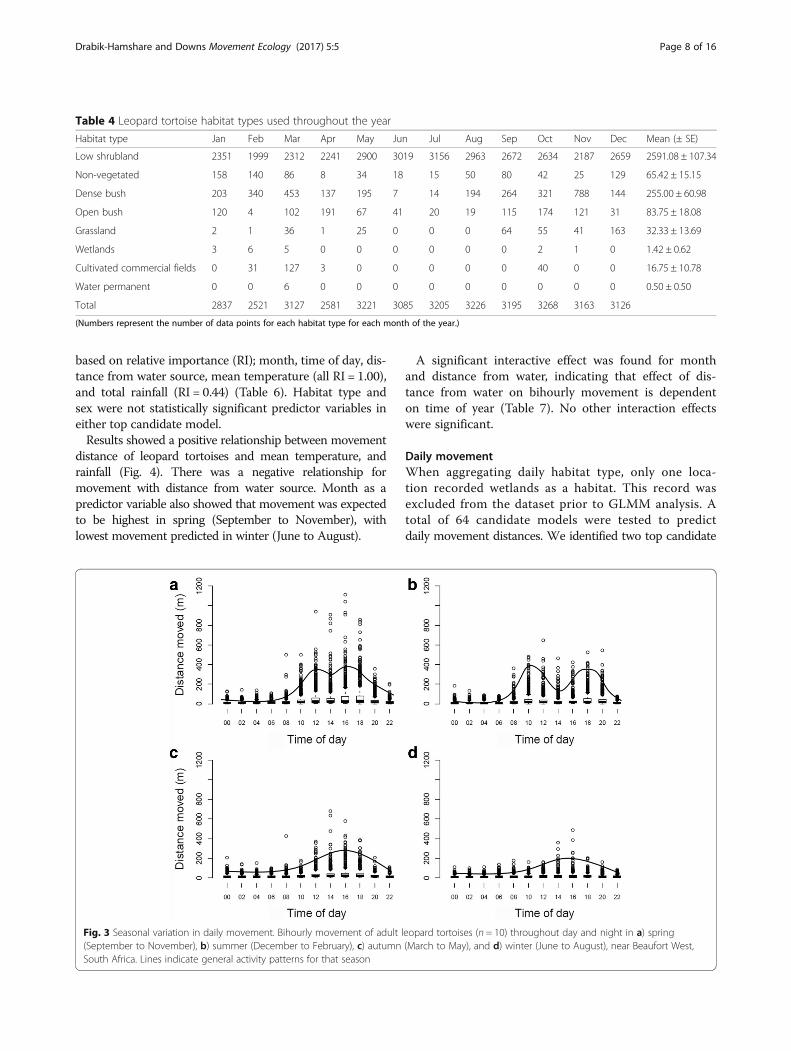
Bihourly movementBihourly movement behaviour of leopard tortoisesshowed a bimodal pattern during spring and summer,with highest movement during late morning and mid-afternoon. This bimodal pattern was more pronouncedin summer (Fig. 3), whereby movement was highestaround 10:00 and 18:00 and generally decreased at14:00. A unimodal pattern is observed during autumnand winter. Movement was identified during night-timehours during all months of the year, though this wasdecreased in winter.A total of 128 candidate models were tested to predict
bihourly movement of leopard tortoises. We identifiedtwo top candidate models (ΔAICc < 2) (Table 5). Modelaveraging highlighted five important predictor variables,
Fig. 2 Sex variation in daily movement. Daily movement in adult a) male (n = 5), and b) female (n = 5) leopard tortoises for each month ofthe study period, near Beaufort West, South Africa. (Numbers on the x-axis correspond to months; e.g. 1 = January, 2 = February, 3 = March, etc)
Table 3 Sex differences in daily movement of leopard tortoises for each month, along with weather conditions
Month Daily distance moved (mean ± SE) in metres Average temperature (°C) TotalRainfall(mm)
Total Male Female
January 256.0 ± 11.29 292.2 ± 18.99 227.5 ± 13.16 25.3 7.0
February 218.0 ± 9.71 200.9 ± 12.97 232.3 ± 14.08 22.7 13.2
March 248.2 ± 9.10 240.7 ± 12.40 255.6 ± 13.31 22.2 28.4
April 256.5 ± 9.59 291.7 ± 6.00 260.1 ± 16.05 16.8 0.0
May 218.2 ± 8.15 208.5 ± 10.14 227.8 ± 12.74 16.6 1.2
June 162.1 ± 4.84 175.4 ± 7.08 148.9 ± 6.44 11.5 15.2
July 157.6 ± 4.09 165.1 ± 6.23 150.0 ± 5.24 10.6 20.4
August 191.1 ± 6.46 212.2 ± 10.30 170.5 ± 7.54 14.7 25.0
September 302.0 ± 14.68 371.1 ± 26.15 233.0 ± 10.80 15.1 8.8
October 471.7 ± 20.57 624.1 ± 29.74 319.3 ± 22.64 20.7 17.8
November 296.6 ± 14.66 390.1 ± 24.41 207.2 ± 13.21 19.9 10.2
December 306.7 ± 14.31 349.8 ± 23.02 275.4 ± 17.89 23.3 23.8
(Weather data supplied by South African Weather Service (Pretoria, South Africa) for Beaufort West area, South Africa)
Drabik-Hamshare and Downs Movement Ecology (2017) 5:5 Page 7 of 16
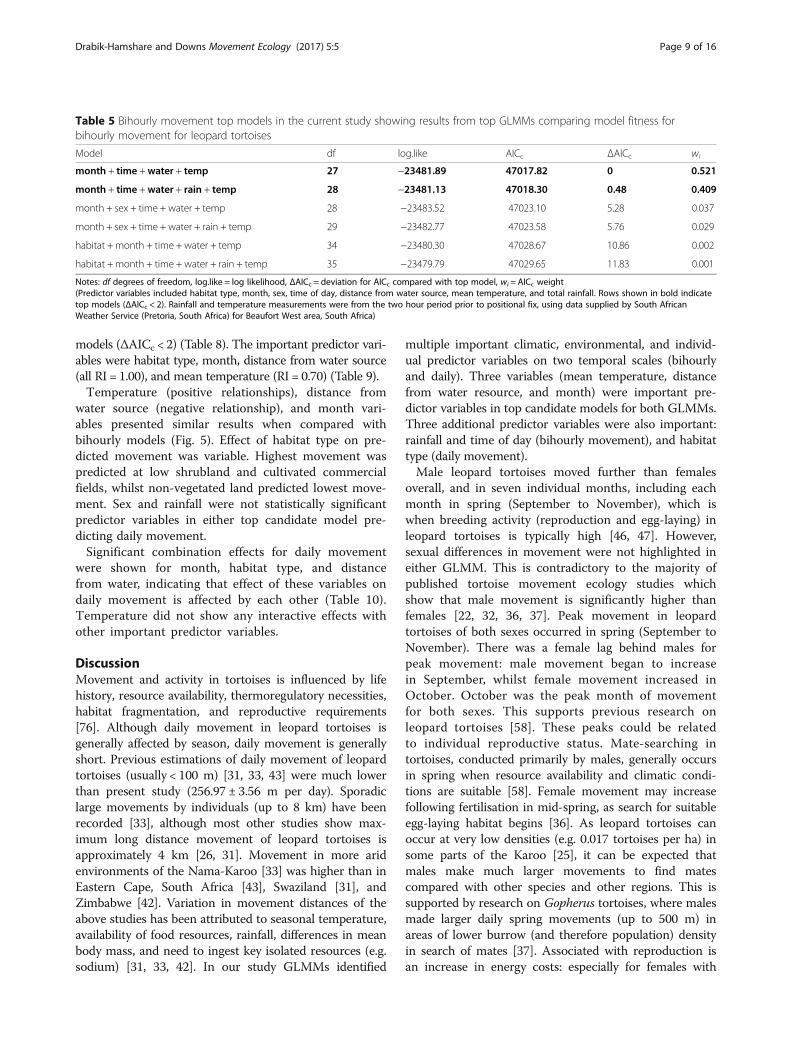
based on relative importance (RI); month, time of day, dis-tance from water source, mean temperature (all RI = 1.00),and total rainfall (RI = 0.44) (Table 6). Habitat type andsex were not statistically significant predictor variables ineither top candidate model.Results showed a positive relationship between movement
distance of leopard tortoises and mean temperature, andrainfall (Fig. 4). There was a negative relationship formovement with distance from water source. Month as apredictor variable also showed that movement was expectedto be highest in spring (September to November), withlowest movement predicted in winter (June to August).
A significant interactive effect was found for monthand distance from water, indicating that effect of dis-tance from water on bihourly movement is dependenton time of year (Table 7). No other interaction effectswere significant.
Daily movementWhen aggregating daily habitat type, only one loca-tion recorded wetlands as a habitat. This record wasexcluded from the dataset prior to GLMM analysis. Atotal of 64 candidate models were tested to predictdaily movement distances. We identified two top candidate
Table 4 Leopard tortoise habitat types used throughout the year
Habitat type Jan Feb Mar Apr May Jun Jul Aug Sep Oct Nov Dec Mean (± SE)
Low shrubland 2351 1999 2312 2241 2900 3019 3156 2963 2672 2634 2187 2659 2591.08 ± 107.34
Non-vegetated 158 140 86 8 34 18 15 50 80 42 25 129 65.42 ± 15.15
Dense bush 203 340 453 137 195 7 14 194 264 321 788 144 255.00 ± 60.98
Open bush 120 4 102 191 67 41 20 19 115 174 121 31 83.75 ± 18.08
Grassland 2 1 36 1 25 0 0 0 64 55 41 163 32.33 ± 13.69
Wetlands 3 6 5 0 0 0 0 0 0 2 1 0 1.42 ± 0.62
Cultivated commercial fields 0 31 127 3 0 0 0 0 0 40 0 0 16.75 ± 10.78
Water permanent 0 0 6 0 0 0 0 0 0 0 0 0 0.50 ± 0.50
Total 2837 2521 3127 2581 3221 3085 3205 3226 3195 3268 3163 3126
(Numbers represent the number of data points for each habitat type for each month of the year.)
Fig. 3 Seasonal variation in daily movement. Bihourly movement of adult leopard tortoises (n = 10) throughout day and night in a) spring(September to November), b) summer (December to February), c) autumn (March to May), and d) winter (June to August), near Beaufort West,South Africa. Lines indicate general activity patterns for that season
Drabik-Hamshare and Downs Movement Ecology (2017) 5:5 Page 8 of 16
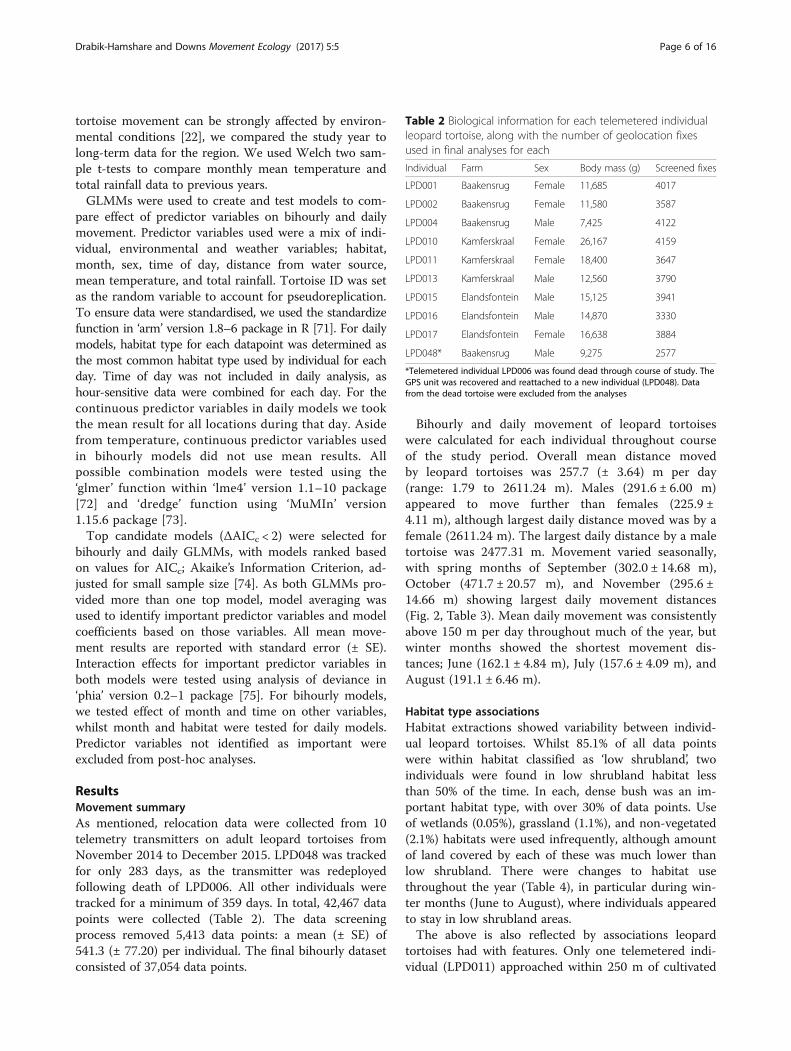
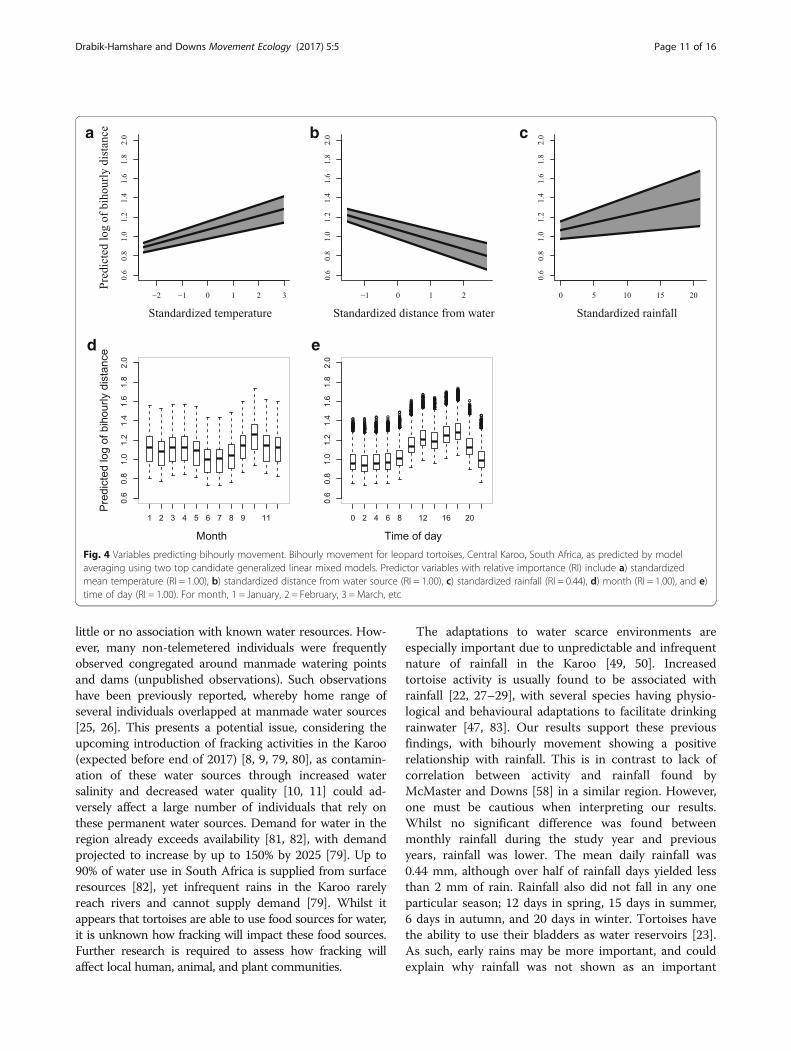
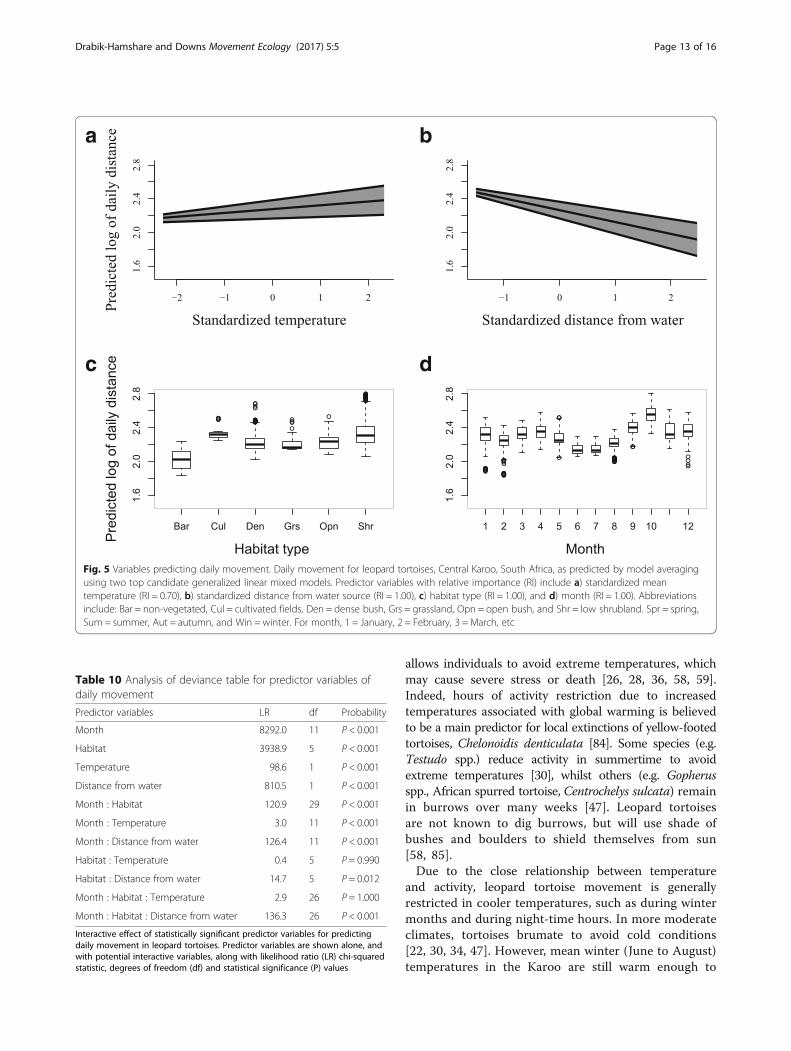
models (ΔAICc < 2) (Table 8). The important predictor vari-ables were habitat type, month, distance from water source(all RI = 1.00), and mean temperature (RI = 0.70) (Table 9).Temperature (positive relationships), distance from
water source (negative relationship), and month vari-ables presented similar results when compared withbihourly models (Fig. 5). Effect of habitat type on pre-dicted movement was variable. Highest movement waspredicted at low shrubland and cultivated commercialfields, whilst non-vegetated land predicted lowest move-ment. Sex and rainfall were not statistically significantpredictor variables in either top candidate model pre-dicting daily movement.Significant combination effects for daily movement
were shown for month, habitat type, and distancefrom water, indicating that effect of these variables ondaily movement is affected by each other (Table 10).Temperature did not show any interactive effects withother important predictor variables.
DiscussionMovement and activity in tortoises is influenced by lifehistory, resource availability, thermoregulatory necessities,habitat fragmentation, and reproductive requirements[76]. Although daily movement in leopard tortoises isgenerally affected by season, daily movement is generallyshort. Previous estimations of daily movement of leopardtortoises (usually < 100 m) [31, 33, 43] were much lowerthan present study (256.97 ± 3.56 m per day). Sporadiclarge movements by individuals (up to 8 km) have beenrecorded [33], although most other studies show max-imum long distance movement of leopard tortoises isapproximately 4 km [26, 31]. Movement in more aridenvironments of the Nama-Karoo [33] was higher than inEastern Cape, South Africa [43], Swaziland [31], andZimbabwe [42]. Variation in movement distances of theabove studies has been attributed to seasonal temperature,availability of food resources, rainfall, differences in meanbody mass, and need to ingest key isolated resources (e.g.sodium) [31, 33, 42]. In our study GLMMs identified
multiple important climatic, environmental, and individ-ual predictor variables on two temporal scales (bihourlyand daily). Three variables (mean temperature, distancefrom water resource, and month) were important pre-dictor variables in top candidate models for both GLMMs.Three additional predictor variables were also important:rainfall and time of day (bihourly movement), and habitattype (daily movement).Male leopard tortoises moved further than females
overall, and in seven individual months, including eachmonth in spring (September to November), which iswhen breeding activity (reproduction and egg-laying) inleopard tortoises is typically high [46, 47]. However,sexual differences in movement were not highlighted ineither GLMM. This is contradictory to the majority ofpublished tortoise movement ecology studies whichshow that male movement is significantly higher thanfemales [22, 32, 36, 37]. Peak movement in leopardtortoises of both sexes occurred in spring (September toNovember). There was a female lag behind males forpeak movement: male movement began to increasein September, whilst female movement increased inOctober. October was the peak month of movementfor both sexes. This supports previous research onleopard tortoises [58]. These peaks could be relatedto individual reproductive status. Mate-searching intortoises, conducted primarily by males, generally occursin spring when resource availability and climatic condi-tions are suitable [58]. Female movement may increasefollowing fertilisation in mid-spring, as search for suitableegg-laying habitat begins [36]. As leopard tortoises canoccur at very low densities (e.g. 0.017 tortoises per ha) insome parts of the Karoo [25], it can be expected thatmales make much larger movements to find matescompared with other species and other regions. This issupported by research on Gopherus tortoises, where malesmade larger daily spring movements (up to 500 m) inareas of lower burrow (and therefore population) densityin search of mates [37]. Associated with reproduction isan increase in energy costs: especially for females with
Table 5 Bihourly movement top models in the current study showing results from top GLMMs comparing model fitness forbihourly movement for leopard tortoises
Model df log.like AICc ΔAICc wi
month + time +water + temp 27 −23481.89 47017.82 0 0.521
month + time +water + rain + temp 28 −23481.13 47018.30 0.48 0.409
month + sex + time + water + temp 28 −23483.52 47023.10 5.28 0.037
month + sex + time + water + rain + temp 29 −23482.77 47023.58 5.76 0.029
habitat + month + time + water + temp 34 −23480.30 47028.67 10.86 0.002
habitat + month + time + water + rain + temp 35 −23479.79 47029.65 11.83 0.001
Notes: df degrees of freedom, log.like = log likelihood, ΔAICc = deviation for AICc compared with top model, wi = AICc weight(Predictor variables included habitat type, month, sex, time of day, distance from water source, mean temperature, and total rainfall. Rows shown in bold indicatetop models (ΔAICc < 2). Rainfall and temperature measurements were from the two hour period prior to positional fix, using data supplied by South AfricanWeather Service (Pretoria, South Africa) for Beaufort West area, South Africa)
Drabik-Hamshare and Downs Movement Ecology (2017) 5:5 Page 9 of 16

regards to producing eggs [32, 35]. Tortoises of both sexesgenerally increase activity, not only to search for matesand egg-laying habitat, but also for increased demand forfood intake and, in case of females, other importantresources [35, 37]. No specific instances of reproductivebehaviour was observed, though one male (LPD013) wasobserved alongside several non-telemetered females at awatering point during December 2015.Habitat type was found to be an important pre-
dictor variable for predicting daily leopard tortoisemovement. Daily movement was shown to be highest
in low shrubland habitat, the most-used habitat type. Cul-tivated commercial fields also predicted high movementdistances, although only one individual used this habitat.We classified multiple habitat types as providing an ex-pected higher supply of food resources, compared withlow shrubland and non-vegetated habitats. However, onlytwo individuals remained in these areas throughout ma-jority of the study. The results showed that non-vegetatedhabitat type was predicted to have lowest movements bydaily models, which supports previous research that showsthat activity is decreased when resources are low [22]. Ourclassification for higher food resources was based on ex-pected resources from a land cover layer. However, nosurveys were conducted for these habitat types and diet inleopard tortoises is extremely adaptable. Diet-switchingbehaviour has been identified in leopard tortoises wherebythey feed on different plants through year, dependingon resource availability [18]. In addition, they will feedon a wide variety of foods, including grasses, forbs,fruits, and succulents [18]. Succulents are even avoidedby livestock [18], and are sometimes present in over-grazed areas, such as non-vegetated habitat (unpub-lished observations). Therefore, smaller movements byindividuals in non-vegetated habitat may be due to ahigher food searching efficiency by leopard tortoises.Distance from known water sources was an important
predictor in both GLMMs. Contrary to our predictions,movement decreased as individuals moved away fromwater resources. As forbs (74.5%) and succulents (51.0%)generally represent a large percentage of their diet [77],it is likely that high water content of these plants couldsupplement water intake for individuals for much of theyear, especially in such a water scarce habitat [31]. Inaddition, leopard tortoises are able to adapt digestiveparameters (food intake, water loss and urine osmolality)in response to diet to maintain body mass and waterbalance [20]. This could make them even more resilientto lack of water associated with arid environments[22, 24]. Despite their ability to obtain much of theirwater requirements from food intake and metabolicwater, they may need to drink free standing water sosupplement their water budget demands and restoreosmotic homoeostasis, as high electrolyte contents cancause severe stress and sometimes death [22–24].It appears leopard tortoise movement increased when
individuals were closer to water resources, perhapsbecause of knowledge of resource localities: animalsmaintain and continually update a cognitive map [78].Whereas tortoises further away from permanent waterappear to rely on food resources for water intake, ifknown water sources exist within an animal’s homerange, individuals may make regular movements tomaintain internal water balance, though water balancewas not measured. Most telemetered individuals had
Table 6 Statistically significant predictor variables for bihourlymovement in leopard tortoises
β SE z Confidence intervals RI
2.5% 97.5%
(Intercept) 1.009 0.037 27.26 0.94 1.08 -
Montha 1.00
January −0.010 0.013 0.72 −0.04 0.02
February −0.047 0.013 3.47 −0.07 −0.02
March −0.018 0.013 1.46 −0.04 0.00
May −0.025 0.012 2.02 −0.05 −0.00
June −0.086 0.013 6.76 −0.11 −0.06
July −0.081 0.013 6.34 −0.11 −0.06
August −0.057 0.037 4.66 −0.08 −0.03
September 0.044 0.012 3.55 0.02 0.07
October 0.0114 0.012 9.25 0.09 0.14
November 0.010 0.012 0.79 −0.01 0.03
December −0.011 0.013 0.87 −0.04 0.01
Time of dayb 1.00
2 am −0.008 0.012 0.68 −0.03 0.02
4 am 0.015 0.012 1.27 −0.01 0.04
6 am 0.021 0.012 1.77 −0.00 0.04
8 am 0.058 0.012 4.86 0.03 0.08
10 am 0.176 0.012 14.90 0.15 0.20
12 pm 0.228 0.012 18.90 0.20 0.25
2 pm 0.190 0.012 15.21 0.17 0.21
4 pm 0.248 0.013 19.41 0.22 0.27
6 pm 0.281 0.012 22.53 0.26 0.31
8 pm 0.143 0.012 11.93 0.12 0.17
10 pm 0.018 0.012 1.52 −0.01 0.04
Distance from water −0.101 0.008 11.86 −0.12 −0.08 1.00
Rainfall 0.016 0.005 0.82 0.01 0.03 0.44
Temperature 0.072 0.008 8.48 0.06 0.09 1.00
Notes: a = April used as reference for month variable. b = 00 am used asreference for time of day variable(Unconditional parameter estimates, standard error, confidence intervals andrelative importance (RI) of tested predictor variables for bihourly displacementdistances, using two top candidate models (ΔAICc < 2). Predictor variablesshown include month, time of day, distance from water source, total rainfall,and mean temperature)
Drabik-Hamshare and Downs Movement Ecology (2017) 5:5 Page 10 of 16
little or no association with known water resources. How-ever, many non-telemetered individuals were frequentlyobserved congregated around manmade watering pointsand dams (unpublished observations). Such observationshave been previously reported, whereby home range ofseveral individuals overlapped at manmade water sources[25, 26]. This presents a potential issue, considering theupcoming introduction of fracking activities in the Karoo(expected before end of 2017) [8, 9, 79, 80], as contamin-ation of these water sources through increased watersalinity and decreased water quality [10, 11] could ad-versely affect a large number of individuals that rely onthese permanent water sources. Demand for water in theregion already exceeds availability [81, 82], with demandprojected to increase by up to 150% by 2025 [79]. Up to90% of water use in South Africa is supplied from surfaceresources [82], yet infrequent rains in the Karoo rarelyreach rivers and cannot supply demand [79]. Whilst itappears that tortoises are able to use food sources for water,it is unknown how fracking will impact these food sources.Further research is required to assess how fracking willaffect local human, animal, and plant communities.
The adaptations to water scarce environments areespecially important due to unpredictable and infrequentnature of rainfall in the Karoo [49, 50]. Increasedtortoise activity is usually found to be associated withrainfall [22, 27–29], with several species having physio-logical and behavioural adaptations to facilitate drinkingrainwater [47, 83]. Our results support these previousfindings, with bihourly movement showing a positiverelationship with rainfall. This is in contrast to lack ofcorrelation between activity and rainfall found byMcMaster and Downs [58] in a similar region. However,one must be cautious when interpreting our results.Whilst no significant difference was found betweenmonthly rainfall during the study year and previousyears, rainfall was lower. The mean daily rainfall was0.44 mm, although over half of rainfall days yielded lessthan 2 mm of rain. Rainfall also did not fall in any oneparticular season; 12 days in spring, 15 days in summer,6 days in autumn, and 20 days in winter. Tortoises havethe ability to use their bladders as water reservoirs [23].As such, early rains may be more important, and couldexplain why rainfall was not shown as an important
a b
d e
c
Fig. 4 Variables predicting bihourly movement. Bihourly movement for leopard tortoises, Central Karoo, South Africa, as predicted by modelaveraging using two top candidate generalized linear mixed models. Predictor variables with relative importance (RI) include a) standardizedmean temperature (RI = 1.00), b) standardized distance from water source (RI = 1.00), c) standardized rainfall (RI = 0.44), d) month (RI = 1.00), and e)time of day (RI = 1.00). For month, 1 = January, 2 = February, 3 = March, etc
Drabik-Hamshare and Downs Movement Ecology (2017) 5:5 Page 11 of 16
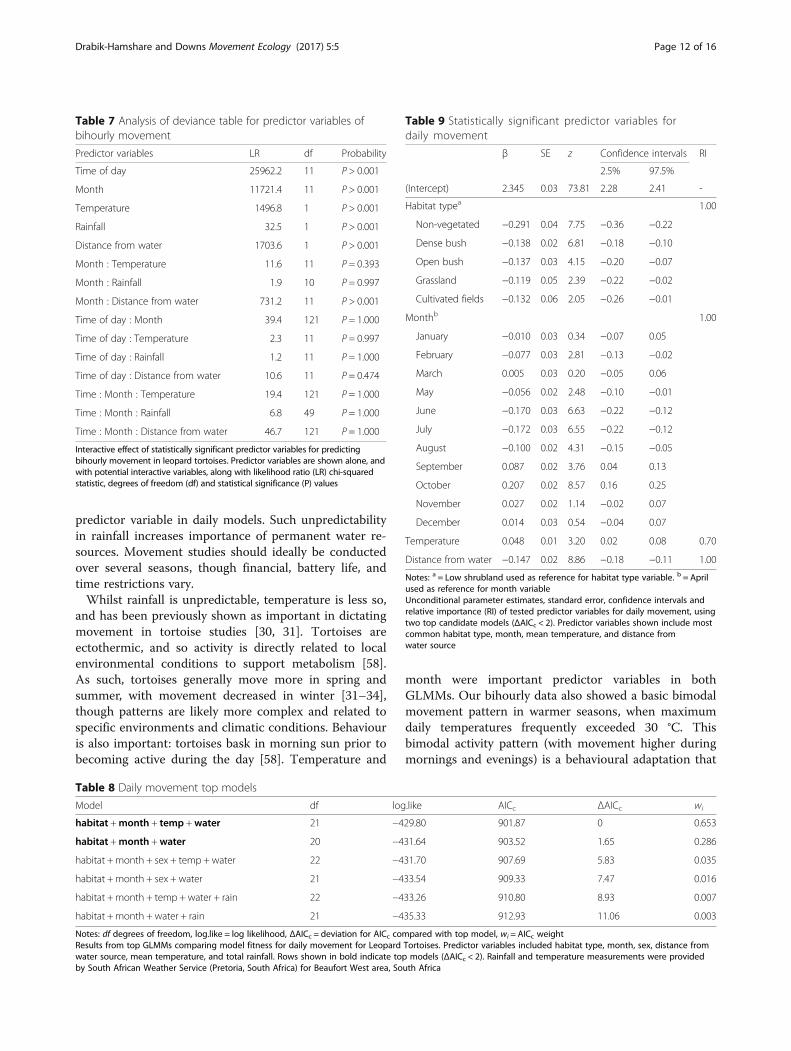
predictor variable in daily models. Such unpredictabilityin rainfall increases importance of permanent water re-sources. Movement studies should ideally be conductedover several seasons, though financial, battery life, andtime restrictions vary.Whilst rainfall is unpredictable, temperature is less so,
and has been previously shown as important in dictatingmovement in tortoise studies [30, 31]. Tortoises areectothermic, and so activity is directly related to localenvironmental conditions to support metabolism [58].As such, tortoises generally move more in spring andsummer, with movement decreased in winter [31–34],though patterns are likely more complex and related tospecific environments and climatic conditions. Behaviouris also important: tortoises bask in morning sun prior tobecoming active during the day [58]. Temperature and
month were important predictor variables in bothGLMMs. Our bihourly data also showed a basic bimodalmovement pattern in warmer seasons, when maximumdaily temperatures frequently exceeded 30 °C. Thisbimodal activity pattern (with movement higher duringmornings and evenings) is a behavioural adaptation that
Table 7 Analysis of deviance table for predictor variables ofbihourly movement
Predictor variables LR df Probability
Time of day 25962.2 11 P > 0.001
Month 11721.4 11 P > 0.001
Temperature 1496.8 1 P > 0.001
Rainfall 32.5 1 P > 0.001
Distance from water 1703.6 1 P > 0.001
Month : Temperature 11.6 11 P = 0.393
Month : Rainfall 1.9 10 P = 0.997
Month : Distance from water 731.2 11 P > 0.001
Time of day : Month 39.4 121 P = 1.000
Time of day : Temperature 2.3 11 P = 0.997
Time of day : Rainfall 1.2 11 P = 1.000
Time of day : Distance from water 10.6 11 P = 0.474
Time : Month : Temperature 19.4 121 P = 1.000
Time : Month : Rainfall 6.8 49 P = 1.000
Time : Month : Distance from water 46.7 121 P = 1.000
Interactive effect of statistically significant predictor variables for predictingbihourly movement in leopard tortoises. Predictor variables are shown alone, andwith potential interactive variables, along with likelihood ratio (LR) chi-squaredstatistic, degrees of freedom (df) and statistical significance (P) values
Table 8 Daily movement top models
Model df log.like AICc ΔAICc wi
habitat +month + temp +water 21 −429.80 901.87 0 0.653
habitat +month +water 20 −431.64 903.52 1.65 0.286
habitat + month + sex + temp +water 22 −431.70 907.69 5.83 0.035
habitat + month + sex + water 21 −433.54 909.33 7.47 0.016
habitat + month + temp +water + rain 22 −433.26 910.80 8.93 0.007
habitat + month + water + rain 21 −435.33 912.93 11.06 0.003
Notes: df degrees of freedom, log.like = log likelihood, ΔAICc = deviation for AICc compared with top model, wi = AICc weightResults from top GLMMs comparing model fitness for daily movement for Leopard Tortoises. Predictor variables included habitat type, month, sex, distance fromwater source, mean temperature, and total rainfall. Rows shown in bold indicate top models (ΔAICc < 2). Rainfall and temperature measurements were providedby South African Weather Service (Pretoria, South Africa) for Beaufort West area, South Africa
Table 9 Statistically significant predictor variables fordaily movement
β SE z Confidence intervals RI
2.5% 97.5%
(Intercept) 2.345 0.03 73.81 2.28 2.41 -
Habitat typea 1.00
Non-vegetated −0.291 0.04 7.75 −0.36 −0.22
Dense bush −0.138 0.02 6.81 −0.18 −0.10
Open bush −0.137 0.03 4.15 −0.20 −0.07
Grassland −0.119 0.05 2.39 −0.22 −0.02
Cultivated fields −0.132 0.06 2.05 −0.26 −0.01
Monthb 1.00
January −0.010 0.03 0.34 −0.07 0.05
February −0.077 0.03 2.81 −0.13 −0.02
March 0.005 0.03 0.20 −0.05 0.06
May −0.056 0.02 2.48 −0.10 −0.01
June −0.170 0.03 6.63 −0.22 −0.12
July −0.172 0.03 6.55 −0.22 −0.12
August −0.100 0.02 4.31 −0.15 −0.05
September 0.087 0.02 3.76 0.04 0.13
October 0.207 0.02 8.57 0.16 0.25
November 0.027 0.02 1.14 −0.02 0.07
December 0.014 0.03 0.54 −0.04 0.07
Temperature 0.048 0.01 3.20 0.02 0.08 0.70
Distance from water −0.147 0.02 8.86 −0.18 −0.11 1.00
Notes: a = Low shrubland used as reference for habitat type variable. b = Aprilused as reference for month variableUnconditional parameter estimates, standard error, confidence intervals andrelative importance (RI) of tested predictor variables for daily movement, usingtwo top candidate models (ΔAICc < 2). Predictor variables shown include mostcommon habitat type, month, mean temperature, and distance fromwater source
Drabik-Hamshare and Downs Movement Ecology (2017) 5:5 Page 12 of 16
allows individuals to avoid extreme temperatures, whichmay cause severe stress or death [26, 28, 36, 58, 59].Indeed, hours of activity restriction due to increasedtemperatures associated with global warming is believedto be a main predictor for local extinctions of yellow-footedtortoises, Chelonoidis denticulata [84]. Some species (e.g.Testudo spp.) reduce activity in summertime to avoidextreme temperatures [30], whilst others (e.g. Gopherusspp., African spurred tortoise, Centrochelys sulcata) remainin burrows over many weeks [47]. Leopard tortoisesare not known to dig burrows, but will use shade ofbushes and boulders to shield themselves from sun[58, 85].Due to the close relationship between temperature
and activity, leopard tortoise movement is generallyrestricted in cooler temperatures, such as during wintermonths and during night-time hours. In more moderateclimates, tortoises brumate to avoid cold conditions[22, 30, 34, 47]. However, mean winter (June to August)temperatures in the Karoo are still warm enough to
a b
c d
Fig. 5 Variables predicting daily movement. Daily movement for leopard tortoises, Central Karoo, South Africa, as predicted by model averagingusing two top candidate generalized linear mixed models. Predictor variables with relative importance (RI) include a) standardized meantemperature (RI = 0.70), b) standardized distance from water source (RI = 1.00), c) habitat type (RI = 1.00), and d) month (RI = 1.00). Abbreviationsinclude: Bar = non-vegetated, Cul = cultivated fields, Den = dense bush, Grs = grassland, Opn = open bush, and Shr = low shrubland. Spr = spring,Sum = summer, Aut = autumn, and Win = winter. For month, 1 = January, 2 = February, 3 = March, etc
Table 10 Analysis of deviance table for predictor variables ofdaily movement
Predictor variables LR df Probability
Month 8292.0 11 P < 0.001
Habitat 3938.9 5 P < 0.001
Temperature 98.6 1 P < 0.001
Distance from water 810.5 1 P < 0.001
Month : Habitat 120.9 29 P < 0.001
Month : Temperature 3.0 11 P < 0.001
Month : Distance from water 126.4 11 P < 0.001
Habitat : Temperature 0.4 5 P = 0.990
Habitat : Distance from water 14.7 5 P = 0.012
Month : Habitat : Temperature 2.9 26 P = 1.000
Month : Habitat : Distance from water 136.3 26 P < 0.001
Interactive effect of statistically significant predictor variables for predictingdaily movement in leopard tortoises. Predictor variables are shown alone, andwith potential interactive variables, along with likelihood ratio (LR) chi-squaredstatistic, degrees of freedom (df) and statistical significance (P) values
Drabik-Hamshare and Downs Movement Ecology (2017) 5:5 Page 13 of 16
facilitate movement: over one third of winter dayshad maximum temperatures exceeding 20 °C. Meandaily movement of leopard tortoises during wintermonths exceeded 150 m. Leopard tortoises do nottypically brumate [26, 31], although isolated recordsdo occur [25]. In contrast to bimodal activity patternsin warmer months, a unimodal activity pattern wasobserved in autumn and winter, as described previ-ously by McMaster and Downs [58]. McMaster andDowns [58] also noted leopard tortoises are generallyinactive during night-time. However, our results shownight-time movement does occur, especially in summerand autumn months. Night-time foraging in leopard tor-toises has been reported in one individual previously [46].It is currently unknown what may facilitate night-timemovement, although it appears that night-time tempera-tures are often non-restrictive during these periods. Moreresearch is required to ascertain variables enabling thisnight-time movement. Other potentially important var-iables, such as environmental illumination, may alsoaffect movement ability during night-time hours whentemperatures are non-restrictive.Information regarding drivers of movement, and pe-
riods in which movement is highest, can be used to miti-gate against other threats to tortoises. For example,electric fencing is used in much of the Karoo as a meansto control predation on livestock by caracal and black-backed jackal [41]. This electric fencing causes mortal-ities in a number of mammals, reptiles, and amphibians[56], though fatalities are highest with respect to tortoisespecies and ground pangolin (Smutsia temmincki) [56].Leopard tortoises account for most (>86%) electric fen-cing related reptile mortalities [56, 57], likely related totheir size and spatial ecology. As electric fencing is be-coming more affordable in South Africa, tortoise mortal-ities by electrocutions is increasing. Whilst it has beenrecommended that raising the electric line to a mini-mum height of 250 mm could reduce mortalities [57],strategic planning can also be incorporated into opera-tions by reducing use of electric fencing when and wheretortoises are most active: in mornings and evenings,mating season, and nearer to water sources.
ConclusionsOur results further display the relationship between wateras a resource and movement in leopard tortoises. Weprovide evidence individuals can use either one of twobasic movement behaviours in relation to water sources inwater scarce environments: either an individual’s homerange and movement is such that it includes permanentwater resources, allowing regular long-distance move-ments to replenish water storage; or access to theseresources are excluded and there is instead a reliance onfood resources (such as grasses, forbs, and succulents) as
the primary source of water. It is known from previousresearch that multiple tortoise species are able to toleratehigh electrolyte concentrations, though drinking water is arequirement for urination and restoration of water bal-ance. Further research should be carried out on potentialimpacts of fracking activities, as contamination and in-creased salination of groundwater may affect ability torestore water balance. Subsequent dehydration couldcause severe stress and possible mortality.In particular our research identified temporal and
spatial conditions in which leopard tortoise movementincreased. Such information can be used to guide de-signs, constructions and operations of electric fencing.As leopard tortoise movement is higher in areas closerto water resources, we advise that electric fencing doesnot occur within close proximities to these areas. Wealso advise that electric fencing should not operate dur-ing spring and summer months, whereby reproductiveand general activities are increased. However, our datashows tortoises move throughout the year, and even dur-ing night-time hours. Whilst is may not be possible toavoid all mortalities related to electric fencing, we hopethat the above suggestions could reduce impacts. In-creasing time between shocks, or alternating in electricfence functionality at intervals may also enable shockedindividuals to escape should contact occur. We alsosupport previous suggestions whereby the electrified lineis raised to a minimum height of 250 mm.
AbbreviationsAIC: Akaike’s information criterion; GLMM: Generalized linear mixed model;GPS: Global positioning system; GSM: Global system for mobilecommunications; HDOP: Horizontal dilution of precision; RI: Relativeimportance; UHF: Ultra high frequency
AcknowledgementsWe would like to thank the following people and companies for helping withthe study; V. Hugo, Animal Trackem, and Wireless Wildlife, for provision oftelemetry equipment, study recommendations, and training for use oftelemetry equipment, IDEA WILD for donating key fieldwork equipment,multiple members of the Nelspoort and Beaufort West community, including R.du Toit, D. Jackson, L. Reynolds, and G. Lund, for allowing research on their landand providing field accommodation, C. Elstob, for initiating contact betweenUniversity of KwaZulu-Natal and the aforementioned landowners, R. Johnson ofAIFA, Beaufort West, for flying a base-station device over study sites to searchfor a missing tortoise, and B. Gijbertsen for providing material, software andtraining for use with GIS programmes. We would also like to thank M. Pfeiffer,P. Potter, T. van der Meer, P. Singh, K. Pillay, and C. Cormac for hard work as fieldassistants. We are grateful to the University of KwaZulu-Natal and the NationalResearch Foundation (ZA) for some financial support. We are grateful for theconstructive comments of anonymous reviewers.
FundingIDEA WILD, Gay Langmuir bursary, the University of KwaZulu-Natal and theNational Research Foundation (ZA) provided financial support.
Availability of data and materialsThe datasets generated and/or analysed during the current study are notpublicly available due to them being part of a current postgraduate studybut are available from the corresponding author on reasonable request.
Drabik-Hamshare and Downs Movement Ecology (2017) 5:5 Page 14 of 16
Authors’ contributionsMDH and CTD conceptualised the ms. MDH collected, analysed andinterpreted the telemetry data. MDH drafted the ms. All authors revised andapproved the final manuscript.
Competing interestsThe authors declare that they have no competing interests.
Consent for publicationNot applicable.
Ethics approval and consent to participateWe had ethics approval from the University of KwaZulu-Natal Ethics Committee.
Received: 17 November 2016 Accepted: 22 February 2017
References1. Foley JA, Defries R, Asner GP, Barford C, Bonan G, Carpenter SR, et al.
Global consequences of land use. Science. 2005; doi:10.1126/science.1111772.2. 2. Hoffman MT. Changing patterns of rural land use and land cover in
South Africa and their implications for land reform. J S Afr Stud. 2014;doi:10.1080/03057070.2014.943525.
3. Kalnay E, Cai M. Impact of urbanization and land-use change on climate.Nature. 2003;423:528–31.
4. Manry D. Distribution, abundance and conservation of the bald ibisGeronticus calvus in southern Africa. Biol Conserv. 1985; doi:10.1016/0006-3207(85)90076-X.
5. Brooke R, Vernon C. Historical records of the wattled crane Bugeranuscarunculatus (Gmelin) in the Cape Province and the Orange Free State,South Africa. Annals of the Cape Provincial Museums (Natural History).1988;16:363–71.
6. Jackson ADJ. Manna in the desert: A revelation of the Great Karroo.Johannesburg: Christian Literature Depot; 1920.
7. Bažant ZP, Salviato M, Chau VT, Viswanathan H, Zubelewicz A. Why frackingworks. J Appl Mech. 2014; doi:10.1115/1.4028192.
8. De Wit MJ. The great shale debate in the Karoo. S Afr J Sci. 2011; doi:10.4102/sajs.v107i7/8.791
9. Reuters. http://www.reuters.com/article/us-safrica-shalegas-idUSKCN0WA26F10. Schmidt CW. Estimating wastewater impacts from fracking. Environ H Persp.
2013; doi:10.1289/ehp.121-a117.11. Vidic RD, Brantley SL, Vandenbossche JM, Yoxtheimer D, Abad JD. Impact
of shale gas development on regional water quality. Science. 2013; doi:10.1126/science.1235009.
12. Dean WRJ. Where birds are rare or fill the air: The protection of theendemic and the nomadic avifaunas of the Karoo, PhD Thesis. Rondebosch:University of Cape Town; 1995.
13. Branch W, Benn G, Lombard A. The tortoises (Testudinidae) and terrapins(Pelomedusidae) of southern Africa: Their diversity, distribution andconservation. S Afr J Zool. 1995; doi:10.1080/02541858.1995.11448377.
14. Turtle Taxonomy Working Group. [van Dijk, PP, Iverson, JB, Rhodin, AGJ,Shaffer, HB, Bour, R.] Turtles of the world, 7th Edition: Annotated checklistof taxonomy, synonymy, distribution with maps, and conservation status.In: Rhodin, AGJ, Pritchard, PCH, van Dijk, PP, Saumure, RA, Buhlmann, KA,Iverson, JB, et al., editors. Conservation biology of freshwater turtles andtortoises: a compilation project of the IUCN/SSC Tortoise and FreshwaterTurtle Specialist Group. Chelonian research monographs; 2014. doi:10.3854/crm.5.000.checklist.v7.2014.
15. Hofmeyr MD, Boycott RC, Baard EHW. Family Testudinidae. In: Bates MF,Branch WR, Bauer AM, Burger M, Marais J, Alexander GJ, et al., editors. Atlasand Red List of the reptiles of South Africa, Lesotho and Swaziland. Pretoria:South African Biodiversity Institute; 2014. p. 70–85.
16. SANParks. Karoo National Park. http://www.sanparks.co.za/parks/karoo/all.php. Accessed 1 Apr 2015
17. IUCN. IUCN Red List of Threatened Species. International Union for theConservation of Nature: Published online: http://www.iucnredlist.org/. 2008.
18. Milton SJ. Plants eaten and dispersed by adult leopard tortoises Geochelonepardalis (Reptilia, Chelonii) in the southern Karoo. S Afr J Zool. 1992;27:45–9.
19. Jerozolimski A, Ribeiro MBN, Martins M. Are tortoises important seeddispersers in Amazonian forests? Oecologia. 2009; doi:10.1007/s00442-009-1396-8.
20. McMaster MK, Downs CT. Digestive parameters and water turnover of theleopard tortoise. Comparative Biochemistry and Physiology, Part A. 2008;doi:10.1016/j.cbpa.2008.06.007.
21. Alexy KJ, Brunjes KJ, Gassett JW, Miller KV. Continuous remote monitoring ofgopher tortoise burrow use. Wildlife Soc B. 2003;31:1240–3.
22. Duda JJ, Krzysik AJ, Freilich JE. Effects of drought on desert tortoisemovement and activity. J Wildlife Manage. 1999; doi:10.2307/3802836.
23. Nagy KA, Medica PA. Physiological ecology of desert tortoises in southernNevada. Herpetologica. 1986;42:73–92.
24. Peterson CC. Anhomeostasis: Seasonal water and solute relations in twopopulations of the desert tortoise (Gopherus agassizii) during chronicdrought. Physiol Zool. 1996; doi:10.1086/physzool.69.6.30164263.
25. McMaster MK, Downs CT. Population structure and density of leopardtortoises (Geochelone pardalis) on farmland in the Nama-Karoo. J Herpetol.2006; doi:10.1670/0022-1511(2006)40[495:Psadol]2.0.Co;2.
26. Rall M. Ekologiese waarnemings van’n Bergskilpadpopulasie, Geochelonepardalis Bell, 1828, soos aangeteken in die Soetdoring-Natuurreser-vaat indie Oranje-Vrystaat. Koedoe. 1985; doi:10.4102/koedoe.v28i1.534.
27. Medica PA, Bury RB, Luckenbach RA. Drinking and construction of watercatchments by the desert tortoise, Gopherus agassizii, in the Mojave Desert.Herpetologica. 1980;36:301–4.
28. Rose FL, Judd FW. Activity and home range size of the Texas tortoise,Gopherus berlandieri, in south Texas. Herpetologica. 1975;31:448–56.
29. Hailey A, Coulson IM. Temperature and the tropical tortoise Kinixys spekii:Constraints on activity level and body temperature. J Zool. 1996; doi:10.1111/j.1469-7998.1996.tb05303.x.
30. Díaz-Paniagua C, Keller C, Andreu AC. Annual variation of activity and dailydistances moved in adult spur-thighed tortoises, Testudo graeca, insouthwestern Spain. Herpetologica. 1995;51:225–33.
31. Monadjem A, McCleery RA, Collier BA. Activity and movement patterns ofthe tortoise Stigmochelys pardalis in a subtropical savanna. J Herpetol. 2013;doi:10.1670/12-070.
32. Eubanks JO, Michener WK, Guyer C. Patterns of movement and burrow usein a population of gopher tortoises (Gopherus polyphemus). Herpetologica.2003; doi:10.1655/01-105.1.
33. McMaster MK, Downs CT. Home range and daily movement of leopardtortoises (Stigmochelys pardalis) in the Nama-Karoo, South Africa. J Herpetol.2009; doi:10.1670/07-078.1.
34. Diemer JE. Home range and movements of the tortoise Gopheruspolyphemus in northern Florida. J Herpetol. 1992; doi:10.2307/1564857.
35. Henen B. Energy and water balance, diet, and reproduction of femaledesert tortoises (Gopherus agassizii). Chelonian Conserv Biol. 2002;4:319–29.
36. Van Bloemestein UP. Seasonal movement and activity patterns of theendangered geometric tortoise, Psammobates geometricus, MSc Thesis.Bellville: University of the Western Cape; 2005.
37. Guyer C, Johnson VM, Hermann SM. Effects of population density on patternsof movement and behavior of gopher tortoises (Gopherus polyphemus).Herpetol Monogr. 2012; doi:10.1655/HERPMONOGRAPHS-D-10-00004.1.
38. Henen BT. Seasonal and annual energy budgets of female desert tortoises(Gopherus agassizii). Ecology. 1997;78:283–96.
39. Gibson C, Hamilton J. Feeding ecology and seasonal movements of gianttortoises on Aldabra atoll. Oecologia. 1983; doi:10.1007/BF00378221.
40. Blake S, Yackulic CB, Cabrera F, Tapia W, Gibbs JP, Kummeth F, et al. Vegetationdynamics drive segregation by body size in Galápagos tortoises migratingacross altitudinal gradients. J Anim Ecol. 2013; doi:10.1111/1365-2656.12020.
41. Bergman DL, De Waal H, Avenant NL, Bodenchuk M, Marlow MC, Nolte DL.The need to address black-backed jackal and caracal predation in SouthAfrica. In: Wildlife Damage Management Conferences - Proceedings. 2013.
42. Hailey A, Coulson IM. Differential scaling of home-range area to daily movementdistance in two African tortoises. Can J Zool. 1996; doi:10.1139/Z96-013.
43. Mason MC, Weatherby CA. Home range of Geochelone pardalis and Chersinaangulata: Two sympatric genera in the Eastern Cape, South Africa. AfricanHerp News. 1996;25:10.
44. Clobert J, Galliard L, Cote J, Meylan S, Massot M. Informed dispersal,heterogeneity in animal dispersal syndromes and the dynamics of spatiallystructured populations. Ecol Lett. 2009; doi:10.1111/j.1461-0248.2008.01267.x.
45. Hebblewhite M, Haydon DT. Distinguishing technology from biology: Acritical review of the use of GPS telemetry data in ecology. Philos T Royal Soc B.2010; doi:10.1098/rstb.2010.0087.
46. Grobler J. The leopard tortoise in the Mountain Zebra National Park.Koedoe. 1982;25:49–53.
Drabik-Hamshare and Downs Movement Ecology (2017) 5:5 Page 15 of 16
47. Bonin F, Devaux B, Dupré A. Turtles of the world. London: BloomsburyPublishing PLC; 2006.
48. Vorster M, Roux P. Veld of the Karoo areas. Proc Ann Cong Grassland Soc SAfr. 1983; doi:10.1080/00725560.1983.9648975.
49. Mucina L, Rutherford MC, Palmer AR, Dold AP. Nama-Karoo biome. In:Mucina L, Rutherford MC, editors. The vegetation of South Africa, Lesothoand Swaziland. Strelitzia 19. Pretoria: South African National BiodiversityInstitute; 2006. p. 324–47.
50. Van Rooyen MW. Functional aspects of short-lived plants. In: Dean WRJ,Milton S, editors. The Karoo: Ecological patterns and processes. Cambridge:Cambridge University Press; 1999. p. 107–22.
51. Muller K, O’Connor TG, Henschel JR. Impact of a severe frost event in 2014 onwoody vegetation within the Nama-Karoo and semi-arid savanna biomes ofSouth Africa. J Arid Environ. 2016; doi:10.1016/j.jaridenv.2016.06.010.
52. Dean WRJ, Milton SJ. Animal foraging and food. In: Dean WRJ, Milton S,editors. The Karoo: Ecological patterns and processes. Cambridge:Cambridge University Press; 1999. p. 164–76.
53. Milton SJ, Zimmermann HG, Hoffman JH. Alien plant invaders of the Karoo:Attributes, impacts and control. In: Dean WRJ, Milton S, editors. The Karoo:Ecological patterns and processes. Cambridge: Cambridge University Press;1999. p. 274–87.
54. Hilton-Taylor C. Phytogeography and origins of the Karoo flora. In: Cowling RM,Roux PW, editors. The Karoo biome: a preliminary synthesis: Part 2 - vegetationand history. South African National Scientific Programme Reports. South Africa:Foundation for Research Development; 1987. p. 70–95.
55. Savory A. Holistic resource management: A conceptual framework forecologically sound economic modelling. Ecological Economics. 1991; doi:10.1016/0921-8009(91)90031-9.
56. Beck A. Electric fence induced mortality in South Africa, MSc Thesis.Johannesburg: University of the Witwatersrand; 2010.
57. Burger M, Branch WR. Tortoise mortality caused by electrified fences in theThomas Baines Nature Reserve. S Afr J Wildl Res. 1994;24:32–7.
58. McMaster MK, Downs CT. Seasonal and daily activity patterns of leopardtortoises (Stigmochelys pardalis Bell, 1828) on farmland in the Nama-Karoo,South Africa. Afr Zool. 2013;48:72–83.
59. Hailey A, Coulson IM. Temperature and the tropical tortoise Kinixys spekii:Tests of thermoregulation. J Zool. 1996; doi:10.1111/j.1469-7998.1996.tb05304.x.
60. Boycott RC, Bourquin O. The southern African tortoise book: A guide tosouthern African tortoises, terrapins and turtles. Pietermaritzburg:Interpak; 2000.
61. Branch B. Tortoises, terrapins & turtles of Africa. South Africa: RandomHouse Struik; 2012.
62. Gursky S. Effects of radio transmitter weight on a small nocturnal primate.Am J Primatol. 1998; doi:10.1002/(SICI)1098-2345(1998)46:2<145::AID-AJP4>3.0.CO;2-W.
63. Wireless Wildlife. http://www.wireless-wildlife.co.za/. Accessed 7 June 201664. South African Weather Service. http://www.weathersa.co.za/. Accessed 9
Nov 201665. R Core Development Team. R. A language and environment for statistical
computing. Vienna: R Core Development Team. R; 2014.66. Calenge C. The package adehabitat for the R software: A tool for the
analysis of space and habitat use by animals. Ecol Model. 2006; doi:10.1016/j.ecolmodel.2006.03.017.
67. RStudio Team. RStudio: Integrated Development for R. Boston, MA. 2015.http://www.rstudio.com/
68. Conner L, Plowman B. Using Euclidean distances to assess nonrandomhabitat use. In: Millspaugh J, Marzluff J, editors. Radio tracking and animalpopulations. San Diego: Academic; 2001. p. 275–90.
69. Laver PN, Powell RA, Alexander KA. Screening GPS telemetry data forlocations having unacceptable error. Ecol Inform. 2015; doi: 10.1016/j.ecoinf.2015.02.001.
70. Hijmans RJ. raster: Geographic Data Analysis and Modeling. 2015. R packageversion 2.5-2. http://CRAN.R-project.org/package=raster
71. Gelman A, Su Y-S, Yajima M, Hill J, Pittau MG, Kerman J, et al. arm: Dataanalysis using regression and multilevel/hierarchical models. 2009. Rpackage, version 9.01. http://CRAN.R-project.org/package=arm
72. Bates D, Mächler M, Bolker B, Walker S. Fitting linear mixed-effects modelsusing lme4. Journal of Statistical Software. 2015; doi:10.18637/jss.v067.i01.
73. Bartoń K. MuMIn: Multi-model inference. 2016. R package version 1.15.6.http://CRAN.R-project.org/package=MuMIn
74. Hurvich CM, Tsai C-L. Regression and time series model selection in smallsamples. Biometrika. 1989; doi:10.1093/biomet/76.2.297
75. De Rosario-Martinez H. phia: Post-hoc interaction analysis. 2015. R packageversion 0.2-1. http://CRAN.R-project.org/package=phia
76. Rozylowicz L, Popescu VD. Habitat selection and movement ecology ofeastern Hermann’s tortoises in a rural Romanian landscape. Eur J WildlifeRes. 2013; doi:10.1007/s10344-012-0646-y.
77. Kabigumila J. Sighting frequency and food habits of the leopard tortoise,Geochelone pardalis, in northern Tanzania. Afr J Ecol. 2001; doi:10.1046/j.1365-2028.2001.00316.x.
78. Gautestad AO. Memory matters: Influence from a cognitive map on animalspace use. J Theor Biol. 2011; doi:10.1016/j.jtbi.2011.07.010.
79. Le Maitre D, Colvin C, Maherry A. Water resources in the Klein Karoo: Thechallenge of sustainable development in a water-scarce area. S Afr J Sci.2009; doi:10.1590/S0038-23532009000100019.
80. Serrai Z, Corrigan IM. Governance of fracking in Africa. Governance in Africa.2015; doi:10.5334/gia.aj.
81. Academy of Science of South Africa. Academy of Science of South Africa.doi:10.17159/assaf.2016/0003
82. DWAF. Overview of water resources availability and utilisation. Pretoria:Department of Water Affairs and Forestry; 2003. Report number: P WMA16/000/00/0203.
83. Auffenberg W. A note on the drinking habits of some land tortoises. AnimBehav. 1963; doi:10.1016/0003-3472(63)90012-5.
84. Sinervo B. The sixth mass extinction is underway. In: The current reptile andamphibian biodiversity crisis compared to extinctions over the past 200million years. Hangzhou: 8th World Congress of Herpetology; 2016.
85. McMaster MK, Downs CT. Do seasonal and behavioral differences in the useof refuges by the leopard tortoise (Geochelone pardalis) favor passivethermoregulation? Herpetologica. 2006; doi:10.1655/04-16.1.
• We accept pre-submission inquiries
• Our selector tool helps you to find the most relevant journal
• We provide round the clock customer support
• Convenient online submission
• Thorough peer review
• Inclusion in PubMed and all major indexing services
• Maximum visibility for your research
Submit your manuscript atwww.biomedcentral.com/submit
Submit your next manuscript to BioMed Central and we will help you at every step:
Drabik-Hamshare and Downs Movement Ecology (2017) 5:5 Page 16 of 16