Embed Size (px)
Citation preview
Moving right alongMeadWestvaco 2009 Annual Report
At MWV, we’re here to win. We know there’s a lot on the line, from our reputation as an industry leader for more than a century to the investment of our valued shareholders and customers – and we understand what’s at stake. So in the face of a challenging economic climate, we developed a solid plan for success. We made it happen in 2009, and we’re primed for an even stronger showing in 2010.
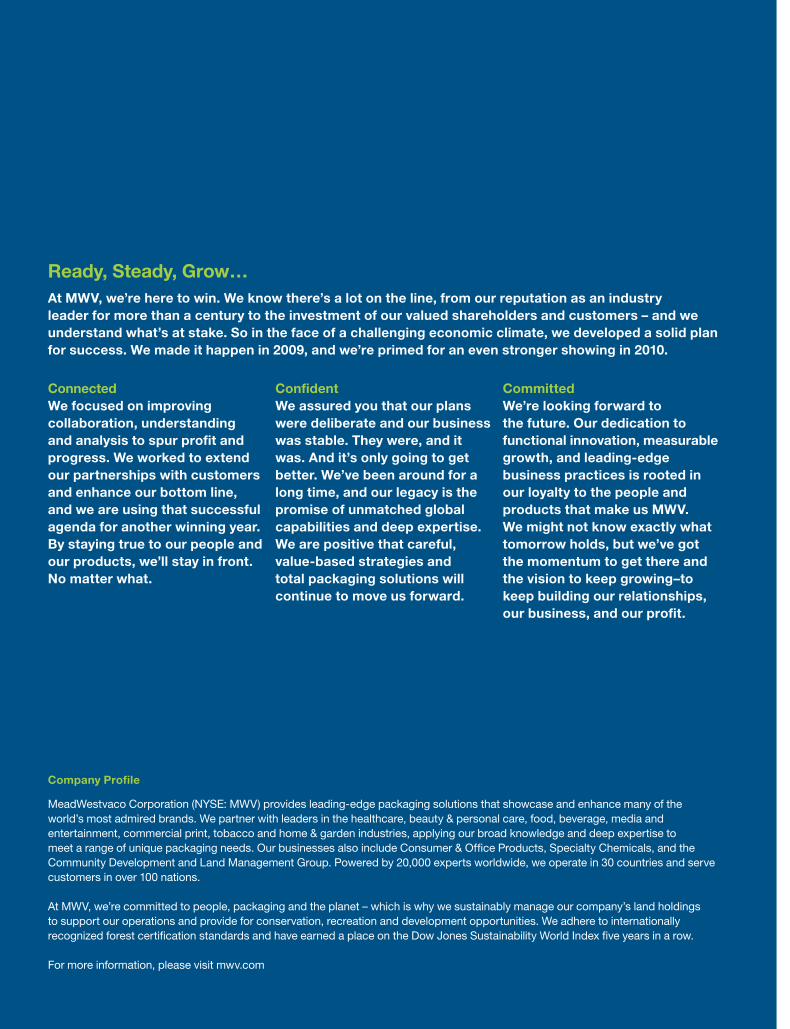
Ready, Steady, Grow…
ConnectedWe focused on improving collaboration, understanding and analysis to spur profit and progress. We worked to extend our partnerships with customers and enhance our bottom line, and we are using that successful agenda for another winning year. By staying true to our people and our products, we’ll stay in front. No matter what.
ConfidentWe assured you that our plans were deliberate and our business was stable. They were, and it was. And it’s only going to get better. We’ve been around for a long time, and our legacy is the promise of unmatched global capabilities and deep expertise. We are positive that careful, value-based strategies and total packaging solutions will continue to move us forward.
CommittedWe’re looking forward to the future. Our dedication to functional innovation, measurable growth, and leading-edge business practices is rooted in our loyalty to the people and products that make us MWV. We might not know exactly what tomorrow holds, but we’ve got the momentum to get there and the vision to keep growing–to keep building our relationships, our business, and our profit.
MeadWestvaco Corporation (NYSE: MWV) provides leading-edge packaging solutions that showcase and enhance many of the world’s most admired brands. We partner with leaders in the healthcare, beauty & personal care, food, beverage, media and entertainment, commercial print, tobacco and home & garden industries, applying our broad knowledge and deep expertise to meet a range of unique packaging needs. Our businesses also include Consumer & Offi ce Products, Specialty Chemicals, and the Community Development and Land Management Group. Powered by 20,000 experts worldwide, we operate in 30 countries and serve customers in over 100 nations.
At MWV, we’re committed to people, packaging and the planet – which is why we sustainably manage our company’s land holdings to support our operations and provide for conservation, recreation and development opportunities. We adhere to internationally recognized forest certifi cation standards and have earned a place on the Dow Jones Sustainability World Index fi ve years in a row.
For more information, please visit mwv.com
Company Profi le
John A. Luke, Jr.Chairman and Chief Executive Officer
In physics, momentum is roughly measured as the product of size and velocity. At MWV, ours directly reflects the breadth of our ambitious strategic agenda and the speed with which we have executed on our plans this year. But momentum is also directional; ours is clearly forward.
A year ago, we were ready to compete in an uncertain world. We set a course that would help us manage through this challenging economic period, a deliberate strategic plan to improve earnings and increase shareholder value. And we followed it. Now, we’re even more prepared, even stronger financially and even more competitive in our global markets – we’ve got momentum. Today, it’s plain to see we’re moving right along.
To Our Shareholders, Customers and Employees:
MWV 2009 Annual ReportII
During 2009, we moved confidently to refine our participation in the marketplace and improve the competitiveness of our business model. These strategic imperatives were essential given the current economic crisis, but they were also necessary for the long-term prosperity of our company. With this deliberate focus on a set of strategies to maximize the value we deliver to shareholders, we made steady and determined progress in several areas of priority emphasis, including cost reductions, business model improvements, customer partnerships and financial strength.
We completed a thorough analysis of each of our markets, products, customers and facilities. The information we gathered about the profitability and value-creation potential in each of our businesses led to deliberate choices about where we compete, which facilities we operate and where we will invest for future growth. This value-based strategy has become a guiding force across our company and a common agenda for all of our employees. The singular goal is to create value for shareholders.
It includes a determined focus on innovation – not for the sake of innovation, but to extend our partnerships with customers and enhance our bottom line. It includes an emphasis on growth in emerging markets – not for the sake of growth, but to align our future with that of our customers and increase our profitability around the world. It includes a focus on value-creating behaviors – not for the sake of organizational change, but to transform MWV into a world-class competitor and a world-renowned leader in our markets.
With this strategic agenda – and focused discipline – we continue to make progress in the areas of our business that matter most.
We launched or enhanced 15 new products in 2009 that helped solidify and extend our relationships with key customers, and continue to build our position in new and existing markets. We updated our Shellpak® healthcare packaging product with a new format for larger dosages and longer regimens, and we’ve not only grown our business with Walmart’s prescription drug program but also added new branded and generic pharmaceutical customers. We announced a revolutionary new tobacco packaging paperboard, called Promina®, which has helped us gain market share especially with premium brands in China. And we re-launched our popular food service line of paperboard – MWare™ – that is used to make fully-renewable cups and plates that include post-consumer recycled fiber and bio-based coatings.
These products and many others contributed to growth with our customers in some of the fastest-growing regions of the world. The global economic recovery has begun in places like China and Brazil, and we are already well-positioned to take advantage of this growth. We increased our beverage packaging business in emerging Asian countries by 50 percent in 2009 – growing with some of our biggest customers by introducing the multi-pack format to newly affluent consumers. We’re doing business with generic prescription drug makers in India who want to use Shellpak® packaging to export their products to the United States. And we continue to position MWV for further growth in Brazil – where we have been a leader for more than half a century. We acquired Grafon’s – a high-end stationery provider – to augment our offerings for the attractive school and office supplies markets in Brazil, and we continue to capture growth opportunities through Rigesa.
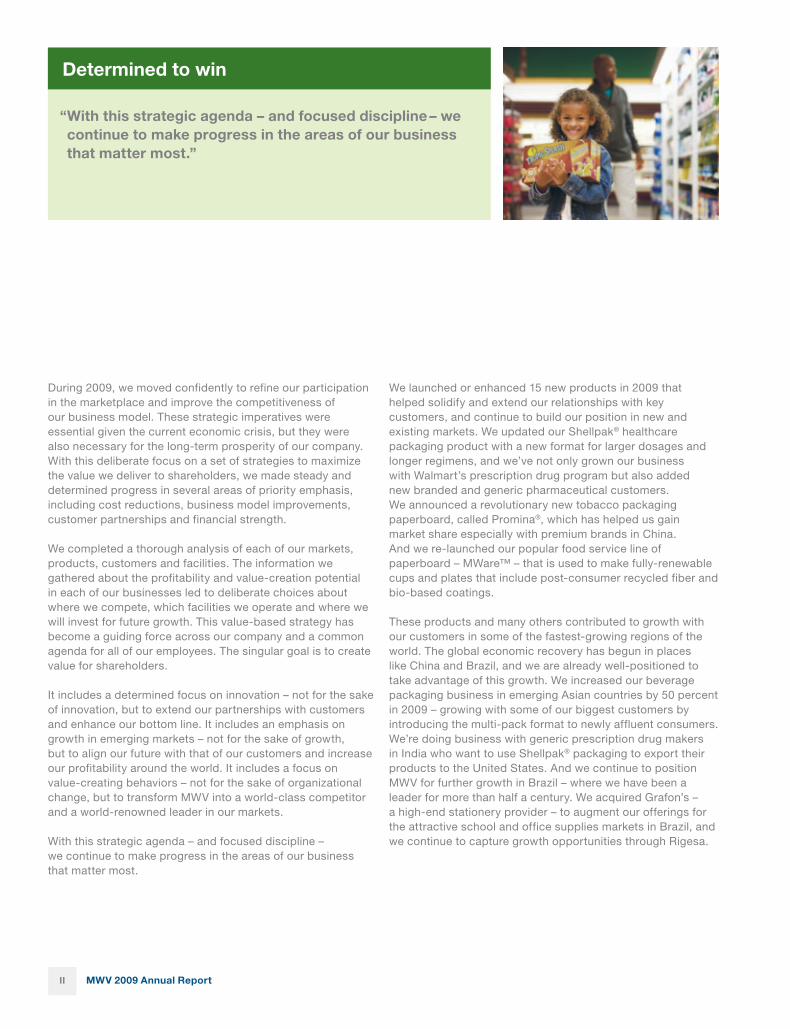
Determined to win
“With this strategic agenda – and focused discipline – we continue to make progress in the areas of our business that matter most.”
MWV 2009 Annual Report III
The signs of our progress are many, and varied. We had a banner year for our asphalt paving additives in our Specialty Chemicals business – including a number of high-profile projects in China and the United States. We unveiled the master plan for our East Edisto property near Charleston, South Carolina – and our Community Development and Land Management team is already working with local governments on development agreements for the next several decades. And at the center of all this activity, we moved into a new building for our global headquarters in Richmond, Virginia, – reflective of our heritage as a sustainability leader and our aspirations as a hub for creativity and closer collaboration with colleagues and customers.
This focused strategic agenda – and a rigorous execution discipline – had a positive impact on our financial performance. We exceeded expectations in almost every one of our businesses – we increased profits, expanded margins and generated a significant amount of cash from our operations. This progress came despite the decline in demand for many of our products and solutions due to global economic conditions and lower consumer spending.
Volumes were down about eight percent across the company. Some of our customers slowed production, canceled new product launches, tightened inventories and downgraded from value-added to cost-conscious choices whenever possible. Our business was relatively stable for consumer staples like food, beverage, healthcare and tobacco packaging – as well as for asphalt paving supported by government stimulus spending and essentials like back-to-school supplies. On the other hand, luxury or specialty applications for personal care, fragrance and media were hit hard by the reduction in consumer spending around the world, and business products such as commercial print paperboard, envelopes and auto carbon were also impacted by the slowdown of economic activity and production.
In response, each of our businesses reset their cost structure and delivered outstanding productivity improvement during the year. We laid out a series of ambitious improvements to our business model at the beginning of the year – cost reduction efforts that would coincide with our value-based assessment of our business. Once the work began, we identified additional opportunities for savings, additional areas for reductions and additional changes to our operating footprint that would improve our overall efficiency and profitability. We expected to achieve $125 million in overhead cost savings by eliminating positions and restructuring our manufacturing footprint. We exceeded this target; through the end of 2009, we had eliminated $154 million of overhead costs – and our work continues apace in 2010.
With all of our progress this year, we generated more than $875 million in cash flow from our operations – adding about $300 million to our balance sheet. In addition, we further strengthened our financial position by reducing debt and securing our near-term financial flexibility with a renewed credit facility. This is a remarkable performance in such a tough operating and economic environment, and has helped us move into a position of strength and stability for our customers, our shareholders and other key stakeholders.
In one of the toughest years in recent memory, we increased shareholder value substantially – delivering for our customers, keeping promises to our investors and rewarding our employees for a job well done. Despite this success, we know that the path ahead will not be easy. The broader global economy looks substantially similar to the way it did a year ago – consumers are wary, customers are hesitant and businesses are waiting to invest. Conditions in our markets have stabilized, for sure. But there remain challenges that will test our resolve, and opportunities on which we must capitalize to further improve performance and increase shareholder value.
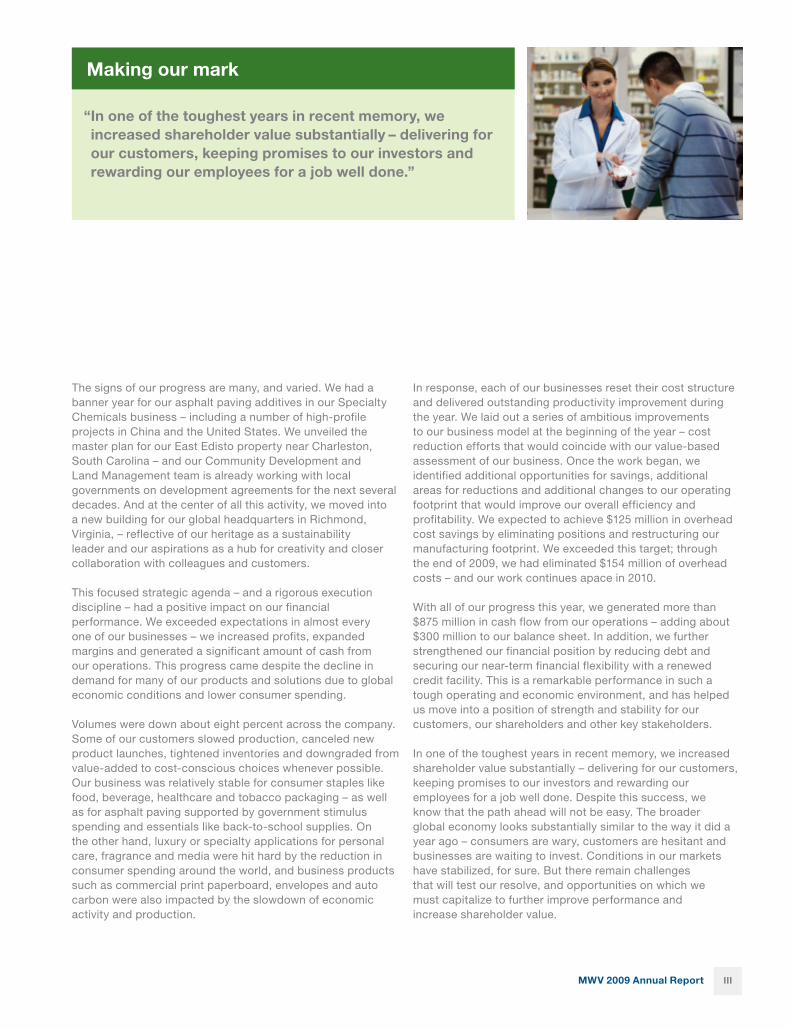
Making our mark
“In one of the toughest years in recent memory, we increased shareholder value substantially – delivering for our customers, keeping promises to our investors and rewarding our employees for a job well done.”
MWV 2009 Annual ReportIV
In the United States, we are concerned that leaders and policy makers are focused on objectives that would continue to stifle, rather than stimulate, economic growth and job creation. Healthcare reform, climate change legislation and government intrusion into the affairs of the private sector – through new taxes and regulations – are all areas of concern for our business, and for the global competitiveness of American industry more broadly. We remain active participants in the public policy process, advocating for sensible solutions to these problems – greenhouse gas reductions that don’t cripple the manufacturing industry, healthcare reforms that reduce costs for both employers and consumers and leaders who understand and appreciate the role of the private sector in creating jobs and increasing quality of life for everyone.
(1) Excluding the items described below, adjusted net income from continuing operations was $135 million, or $0.78 per share in 2009 compared to $108 million, or $0.63 per share in 2008. 2009 includes the following: after-tax income of $242 million, or $1.40 per share, from alternative fuel mixture credits, after-tax restructuring charges of $122 million, or $0.70 per share, tax charges of $32 million, or $0.18 per share, related to domestic and foreign tax audits, after-tax charges of $14 million, or $0.08 per share, from early extinguishments of debt, after-tax income of $13 million, or $0.07 per share, from vacation accrual adjustments due to a policy change, an after-tax expense of $12 million, or $0.07 per share, from a contribution to the MeadWestvaco Foundation, after-tax gains of $11 million, or $0.06 per share, related to sales of certain assets, and an after-tax gain of $4 million, or $0.02 per share, from a pension curtailment. 2008 includes the following: after-tax restructuring charges of $44 million, or $0.26 per share, after-tax gains of $10 million, or $0.05 per share, related to sales of certain assets, and an after-tax gain of $6 million, or $0.04 per share, from a pension curtailment.
Meanwhile, we know that to keep moving along the path we’re on – and to maintain our momentum – we must continue to build our partnerships with customers. We’ll do that by introducing new innovations, new growth plans in emerging markets and by emphasizing our stability and financial strength.
We’re on the right path to make MWV a more valuable global packaging company, and with the power of 20,000 employees around the world, we’re moving with pace and determination toward our goals. The momentum we’ve carried into 2010 is a product of their hard work and ingenuity. I’m proud to work alongside this talented team – and each of MWV’s stakeholders around the world – toward our shared vision of success.
Sincerely,
John A. Luke, Jr.Chairman and Chief Executive OfficerFebruary 23, 2010
Financial highlights
In millions, except per share data 2009 2008
Net Sales $ 6,049 $ 6,637 Net Income from Continuing Operations (1) 225 80Net Income per Share from Continuing Operations (1) 1.31 0.46 Dividends per Share 0.92 0.92 Cash Flow Provided by Operating Activities 876 376 Shareholders' Equity 3,406 2,967
UNITED STATESSECURITIES AND EXCHANGE COMMISSION
WASHINGTON, D.C. 20549
FORM 10-KÈ ANNUAL REPORT PURSUANT TO SECTION 13 OR 15(d) OF THE SECURITIES
EXCHANGE ACT OF 1934FOR THE YEAR ENDED DECEMBER 31, 2009
‘ TRANSITION REPORT PURSUANT TO SECTION 13 OR 15(d) OF THE SECURITIESEXCHANGE ACT OF 1934
FOR THE TRANSITION PERIOD FROM TOCOMMISSION FILE NUMBER 1-31215
MeadWestvaco Corporation(Exact name of registrant as specified in its charter)
Delaware 501 South 5th StreetRichmond, Virginia 23219-0501
Telephone 804-444-1000(Address and telephone number of
Registrant’s principal executive offices)
(State or other jurisdiction ofincorporation or organization)
31-1797999(I.R.S. Employer Identification No.)
SECURITIES REGISTERED PURSUANT TO SECTION 12(b) OF THE ACT:Title of each class Name of each exchange on which registered
Common Stock, $0.01 par value New York Stock ExchangeSECURITIES REGISTERED PURSUANT TO SECTION 12(g) OF THE ACT: NONE
Indicate by check mark if the registrant is a well-known seasoned issuer (as defined in Rule 405 of the SecuritiesAct). Yes È No ‘
Indicate by check mark if the registrant is not required to file reports pursuant to Section 13 or Section 15(d) of theAct. Yes ‘ No È
Indicate by check mark whether the registrant (1) has filed all reports required to be filed by Section 13 or 15(d) ofthe Securities Exchange Act of 1934 during the preceding 12 months (or for such shorter period that the registrant wasrequired to file such reports), and (2) has been subject to such filing requirements for the past 90 days. Yes È No ‘
Indicate by check mark whether the registrant has submitted electronically and posted on its corporate Web site, ifany, every Interactive Data File required to be submitted and posted pursuant to Rule 405 of Regulation S-T during thepreceding 12 months (or for such shorter period that the registrant was required to submit and post suchfiles). Yes ‘ No ‘
Indicate by check mark if disclosure of delinquent filers pursuant to Item 405 of Regulation S-K is not containedherein, and will not be contained, to the best of registrant’s knowledge, in definitive proxy or information statementsincorporated by reference in Part III of this Form 10-K or any amendment to this Form 10-K. È
Indicate by check mark whether the registrant is a large accelerated filer, an accelerated filer, a non-accelerated fileror a smaller reporting company. See the definitions of “large accelerated filer” and “accelerated filer” and “smallerreporting company” in Rule 12b-2 of the Exchange Act.Large accelerated filer È Accelerated filer ‘
Non-accelerated filer ‘ (Do not check if a smaller reporting company) Smaller reporting company ‘
Indicate by check mark whether the registrant is a shell company (as defined in Rule 12b-2 of the ExchangeAct). Yes ‘ No È
At June 30, 2009, the aggregate market value of common stock held by non-affiliates was $2,736,091,339. Suchdetermination shall not, however, be deemed to be an admission that any person is an “affiliate” as defined in Rule 405under the Securities Act of 1933.
At January 31, 2010, the number of shares of the common stock of the Registrant outstanding was 171,277,193.
DOCUMENTS INCORPORATED BY REFERENCEPortions of the Registrant’s Proxy Statement for the Annual Meeting of Shareholders to be held on April 26, 2010,
are incorporated by reference for Part III; definitive copies of said Proxy Statement will be filed with the Securities andExchange Commission on or before March 26, 2010.
TABLE OF CONTENTS
Item Page
PART I
1. Business . . . . . . . . . . . . . . . . . . . . . . . . . . . . . . . . . . . . . . . . . . . . . . . . . . . . . . . . . . . . . . . . . . . . . . . . . 11A. Risk factors . . . . . . . . . . . . . . . . . . . . . . . . . . . . . . . . . . . . . . . . . . . . . . . . . . . . . . . . . . . . . . . . . . . . . . . 51B. Unresolved staff comments . . . . . . . . . . . . . . . . . . . . . . . . . . . . . . . . . . . . . . . . . . . . . . . . . . . . . . . . . . 82. Properties . . . . . . . . . . . . . . . . . . . . . . . . . . . . . . . . . . . . . . . . . . . . . . . . . . . . . . . . . . . . . . . . . . . . . . . . 93. Legal proceedings . . . . . . . . . . . . . . . . . . . . . . . . . . . . . . . . . . . . . . . . . . . . . . . . . . . . . . . . . . . . . . . . . 114. Submission of matters to a vote of security holders . . . . . . . . . . . . . . . . . . . . . . . . . . . . . . . . . . . . . . . 11
PART II
5. Market for registrant’s common equity, related stockholder matters and issuer purchases of equitysecurities . . . . . . . . . . . . . . . . . . . . . . . . . . . . . . . . . . . . . . . . . . . . . . . . . . . . . . . . . . . . . . . . . . . . . . . 14
6. Selected financial data . . . . . . . . . . . . . . . . . . . . . . . . . . . . . . . . . . . . . . . . . . . . . . . . . . . . . . . . . . . . . . 157. Management’s discussion and analysis of financial condition and results of operations . . . . . . . . . . . 177A. Quantitative and qualitative disclosures about market risk . . . . . . . . . . . . . . . . . . . . . . . . . . . . . . . . . . 408. Financial statements and supplementary data . . . . . . . . . . . . . . . . . . . . . . . . . . . . . . . . . . . . . . . . . . . . 419. Changes in and disagreements with accountants on accounting and financial disclosure . . . . . . . . . . . 859A. Controls and procedures . . . . . . . . . . . . . . . . . . . . . . . . . . . . . . . . . . . . . . . . . . . . . . . . . . . . . . . . . . . . . 859B. Other information . . . . . . . . . . . . . . . . . . . . . . . . . . . . . . . . . . . . . . . . . . . . . . . . . . . . . . . . . . . . . . . . . . 85
PART III
10. Directors, executive officers and corporate governance . . . . . . . . . . . . . . . . . . . . . . . . . . . . . . . . . . . . 8611. Executive compensation . . . . . . . . . . . . . . . . . . . . . . . . . . . . . . . . . . . . . . . . . . . . . . . . . . . . . . . . . . . . . 8612. Security ownership of certain beneficial owners and management and related stockholder matters . . 8613. Certain relationships and related transactions, and director independence . . . . . . . . . . . . . . . . . . . . . . 8614. Principle accounting fees and services . . . . . . . . . . . . . . . . . . . . . . . . . . . . . . . . . . . . . . . . . . . . . . . . . . 86
PART IV
15. Exhibits, financial statement schedules . . . . . . . . . . . . . . . . . . . . . . . . . . . . . . . . . . . . . . . . . . . . . . . . . 87Signatures . . . . . . . . . . . . . . . . . . . . . . . . . . . . . . . . . . . . . . . . . . . . . . . . . . . . . . . . . . . . . . . . . . . . . . . . 91
Part I
Item 1. Business
General
MeadWestvaco Corporation (“MeadWestvaco”, “MWV”, or the “company”), a Delaware corporationformed in 2001 following the merger of Westvaco Corporation and The Mead Corporation, is a global packagingcompany that provides packaging solutions to many of the world’s brands in the healthcare, personal care andbeauty, food, beverage, media and entertainment, home and garden, tobacco, and commercial print industries.MWV’s other business operations serve the consumer and office products, specialty chemicals, forestry and realestate markets. MWV’s business segments are (i) Packaging Resources, (ii) Consumer Solutions, (iii) Consumer& Office Products, (iv) Specialty Chemicals, and (v) Community Development and Land Management.
Packaging Resources
The Packaging Resources segment produces bleached paperboard (“SBS”), Coated Natural Kraft®
paperboard (“CNK®”) and linerboard. This segment’s paperboard products are manufactured at three millslocated in the U.S. and two mills located in Brazil. SBS is used for packaging high-value consumer products inmarkets such as pharmaceuticals, personal care, beauty, tobacco, and beverage and food service. CNK® is usedfor a range of packaging applications, the largest of which for MWV is multi-pack beverage packaging.Linerboard is used in the manufacture of corrugated boxes and other containers.
Consumer Solutions
The Consumer Solutions segment designs and produces multi-pack cartons and packaging systems primarilyfor the global beverage take-home market and packaging for the global tobacco market. In addition, this segmentoffers a full range of converting and consumer packaging solutions including printed plastic packaging andinjection-molded products used for personal care, beauty, and pharmaceutical products; dispensing and sprayersystems for personal care, beauty, healthcare, fragrance and home and garden markets; and packaging for mediaproducts such as DVDs, CDs, video games and software. Paperboard and plastic are converted into packagingproducts at plants located in North America, South America, Europe and Asia. In addition, this segment has apharmaceutical packaging contract with a mass-merchant, and manufactures equipment that is leased or sold toits beverage and dairy customers to package their products.
Consumer & Office Products
The Consumer & Office Products segment manufactures, sources, markets and distributes school and officeproducts, time-management products and envelopes in North America and Brazil through both retail andcommercial channels. MWV produces many of the leading brand names in school supplies, time-managementand commercial office products, including AMCAL, ® AT-A-GLANCE, ® Cambridge, ® COLUMBIAN, ® DayRunner, ® Five Star, ® Mead ® and Trapper Keeper. ®
Specialty Chemicals
The Specialty Chemicals segment manufactures, markets and distributes specialty chemicals derived fromsawdust and other byproducts of the papermaking process in North America, South America and Asia. Productsinclude activated carbon used in emission control systems for automobiles and trucks, as well as for water andfood purification applications, and performance chemicals used in printing inks, asphalt paving, adhesives andlubricants for the agricultural, paper and petroleum industries.
Community Development and Land Management
The Community Development and Land Management segment is responsible for maximizing the value ofthe company’s landholdings in North America. Operations of the segment include real estate development,forestry operations and leasing activities. Real estate development includes (i) selling non-core forestlands
1
primarily for recreational and residential uses, (ii) entitling and improving high-value tracts through jointventures and other ownership arrangements, and (iii) master planning select landholdings. Forestry operationsinclude growing and harvesting softwood and hardwood on the company’s forestlands for external consumptionand for use by the company’s mill-based business. Leasing activities include fees from third parties undertakingmineral extraction operations, as well as fees from recreational leases on the company’s forestlands.
For a more detailed description of our business segments, including financial information, see Note S ofNotes to Consolidated Financial Statements included in Part II, Item 8.
Marketing and distribution
The principal markets for our products are in North America, South America, Europe and Asia. We operatein 30 countries and serve customers in more than 100 nations. Our products are sold through a combination ofour own sales force and paperboard merchants and distributors. The company has sales offices in key citiesthroughout the world.
Intellectual property
MeadWestvaco has a large number of foreign and domestic trademarks, trade names, patents, patent rightsand licenses relating to its business. While, in the aggregate, intellectual property rights are material to ourbusiness, the loss of any one or any related group of such rights would not have a material adverse effect on ourbusiness, with the exception of the “Mead ®” trademark and the “AT-A-GLANCE ®” trademark for consumerand office products.
Competition
MeadWestvaco operates in a very challenging global marketplace and competes with many large, well-established and highly competitive manufacturers and service providers. In addition, our business is affected by arange of macroeconomic conditions, including industry capacity changes, a trend in the packaging, paperboardand forest products industry toward consolidation, global competition, economic conditions in the U.S. andabroad, and currency exchange rates.
We compete principally through quality, price, value-added products and services such as packagingsolutions, customer service, innovation, technology, and product design. Our proprietary trademarks and patents,in the aggregate, are also important to our competitive position in certain markets.
The Packaging Resources segment competes globally with manufacturers of value-added CNK® and SBSfor packaging and graphic applications, as well as specialty paperboards. The Consumer Solutions segmentcompetes globally with numerous packaging service providers in the package design, development, andmanufacturing arenas, as well as the manufacture of dispensing and spraying systems. The Consumer & OfficeProducts segment competes with national and regional converters, as well as foreign producers, especially fromAsia. The Specialty Chemicals segment competes on a worldwide basis with producers of activated carbons,refined tall oil products, lignin-based chemicals and specialty resins. The Community Development and LandManagement segment competes in the real estate sales and development market and the forestry productsindustry in the U.S.
Research
MeadWestvaco conducts research and development in the areas of packaging and chemicals. Innovativeproduct development and manufacturing process improvement are the main objectives of these efforts. Thecompany also evaluates and adapts for use new and emerging technologies that may enable new productdevelopment and manufacturing cost reductions.
2
Environmental laws and regulations
Our operations are subject to extensive regulation by federal, state and local authorities, as well asregulatory authorities with jurisdiction over foreign operations of the company. Due to changes in environmentallaws and regulations, the application of such regulations, and changes in environmental control technology, it isnot possible for us to predict with certainty the amount of capital expenditures to be incurred for environmentalpurposes. Taking these uncertainties into account, we estimate that we will incur $27 million and $32 million inenvironmental capital expenditures in 2010 and 2011, respectively. Approximately $15 million was spent onenvironmental capital projects in 2009.
The company has been notified by the U.S. Environmental Protection Agency or by various state or localgovernments that it may be liable under federal environmental laws or under applicable state or local laws withrespect to the cleanup of hazardous substances at sites previously operated or used by the company. Thecompany is currently named as a potentially responsible party (“PRP”), or has received third-party requests forcontribution under the Comprehensive Environmental Response, Compensation and Liability Act (“CERCLA”)and similar state or local laws with respect to numerous sites. Some of these proceedings are described in moredetail in Part I, Item 3. There are other sites which may contain contamination or which may be potentialSuperfund sites, but for which MeadWestvaco has not received any notice or claim. The potential liability for allthese sites will depend upon several factors, including the extent of contamination, the method of remediation,insurance coverage and contribution by other PRPs. The company regularly evaluates its potential liability atthese various sites. At December 31, 2009, MeadWestvaco had recorded liabilities of approximately $24 millionfor estimated potential cleanup costs based upon its close monitoring of ongoing activities and its past experiencewith these matters. The company believes that it is reasonably possible that costs associated with these sites mayexceed amounts of recorded liabilities by an amount that could range from an insignificant amount to as much as$10 million. This estimate is less certain than the estimate upon which the environmental liabilities were based.After consulting with legal counsel and after considering established liabilities, it is our judgment that theresolution of pending litigation and proceedings is not expected to have a material adverse effect on thecompany’s consolidated financial condition or liquidity. In any given period or periods, however, it is possiblesuch proceedings or matters could have a material effect on the company’s results of operations. Additionalmatters involving environmental proceedings for MeadWestvaco are set forth in Part I, Item 3.
Employees
MeadWestvaco employs approximately 20,000 people worldwide, of whom approximately 10,000 areemployed in the U.S. and approximately 10,000 are employed internationally. Approximately 7,500 employeesare represented by labor unions under various collective bargaining agreements. MeadWestvaco considers itsrelationship with employees, including those covered by collective bargaining agreements, to be generally good.The company engages in negotiations with labor unions for new collective bargaining agreements from time totime and at present is in the process of negotiating new agreements at two manufacturing locations coveringapproximately 1,000 employees. While it is the company’s objective to reach agreements without workstoppages, it cannot predict the outcome of any negotiations.
International operations
MeadWestvaco’s operations outside the U.S. are conducted through subsidiaries located in Canada, Mexico,South America, Europe and Asia. While there are risks inherent in foreign investments, we do not believe at thistime that such risks are material to our overall business prospects. MeadWestvaco’s sales that were attributable toU.S. operations, including export sales, were 67%, 66% and 67% for the years ended December 31, 2009, 2008and 2007, respectively. Export sales from MeadWestvaco’s U.S. operations were 13% for each of the yearsended December 31, 2009 and 2008 and 12% for the year ended December 31, 2007. Sales that were attributableto foreign operations were 33%, 34% and 33% for the years ended December 31, 2009, 2008 and 2007,respectively. For more information about the company’s U.S. and foreign operations, see Note S of Notes toConsolidated Financial Statements included in Part II, Item 8.
3
Available information
Our Internet address is www.mwv.com. Please note that MWV’s Internet address is included in this AnnualReport on Form 10-K as an inactive textual reference only. The information contained on our website is notincorporated by reference into this Annual Report on Form 10-K and should not be considered part of this report.MWV makes available on this website free of charge, our annual reports on Form 10-K, quarterly reports onForm 10-Q, current reports on Form 8-K, and amendments to those reports as soon as reasonably practicableafter we electronically file or furnish such materials to the U.S. Securities and Exchange Commission (“SEC”).You may access these filings via the hyperlink to the SEC website provided on the Investor Information page ofour website. MWV’s Corporate Governance Principles, our charters (Nominating and Governance Committee,Audit Committee, Compensation and Organization Development Committee, Finance Committee, Safety, Healthand Environment Committee, and Executive Committee) and our Code of Conduct can be found at our website atthe following address: http://www.mwv.com/AboutUs/InvestorRelations/CorporateGovernance/index.htm.
4
Item 1A. Risk factors
Risks relating to our business
U.S. and global economic conditions could have an adverse effect on the profitability of some or all of ourbusinesses.
Concerns regarding adverse consumer and business confidence, the availability and cost of credit, reducedconsumer spending and business investment, the volatility and strength of the capital and credit markets, andinflation all affect the business and economic environment and, ultimately, the profitability of our business. In aneconomic downturn characterized by higher unemployment, lower family income, lower corporate earnings,lower business investment and lower consumer spending, the demand for our products is adversely affected.Adverse changes in the U.S. or global economy could negatively affect earnings and could have a materialadverse effect on our business, results of operations, cash flows and financial position. In a challenging anduncertain economic environment, we cannot predict whether or when such circumstances may occur, or whatimpact, if any, such circumstances could have on our business, results of operations, cash flows and financialposition.
Conditions in the global capital and credit markets and the economy generally may materially adversely affectour business, results of operations and financial position and we do not expect these conditions to improve in thenear future.
Our results of operations and financial position could be materially affected by adverse changes in theglobal capital and credit markets and the economy generally, including declines in consumer and businessconfidence and spending, both in the U.S. and elsewhere around the world. Conditions in the capital and creditmarkets and the effects of declines in consumer and business confidence and spending may adversely impact theability of our lenders, suppliers and customers to conduct their business activities. The consequences of suchadverse effects could include the interruption of production at the facilities of our customers, the reduction, delayor cancellation of customer orders, delays in or the inability of customers to obtain financing to purchase ourproducts, and bankruptcy of customers or other creditors.
While we have procedures to monitor and limit exposure to credit risk, there can be no assurance suchprocedures will effectively limit our credit risk and avoid losses, which could have a material adverse effect onour financial condition and operating results.
Certain of the company’s businesses are affected by cyclical market conditions which can significantly impactoperating results and cash flows.
Certain of the company’s businesses are affected by cyclical market conditions that can significantlyinfluence the demand for certain of the company’s products, as well as the pricing we can obtain for theseproducts. The company’s paperboard business is particularly subject to cyclical market conditions. The companymay be unable to sustain pricing in the face of weaker demand, and weaker demand may in turn cause us to takeproduction downtime. In addition to lost revenue from lower shipment volumes, production downtime causesunabsorbed fixed manufacturing costs due to lower production levels. As a result, the company’s results ofoperations and cash flows may be materially impacted in a period of prolonged and significant market weakness.Moreover, the company is not able to predict market conditions or its ability to sustain pricing and productionlevels during periods of weak demand with any degree of certainty. Market conditions may also impact thecompany’s ability to achieve its planned or announced price increases.
The company’s businesses are subject to significant cost pressures. Pricing volatility and our ability to passhigher costs on to our customers through price increases or other adjustments is uncertain and dependent onmarket conditions.
The pricing environment for raw materials used in a number of our businesses continues to be challengingand volatile. Additionally, energy costs remain volatile and unpredictable.
5
Further unpredictable increases in the cost of raw materials or energy may materially impact our results ofoperations. Depending on market forces and the terms of customer contracts, our ability to recover these coststhrough increased pricing may be limited.
Certain of the company’s consumer packaging converting businesses are affected by consumer behavior and newtechnology which can significantly impact operating results and cash flows.
Changes in consumer behavior and technology for the distribution of consumer products, such as music andvideo entertainment, can, and is having a dramatic impact on the demand for packaging products produced by thecompany’s packaging converting businesses.
The company faces intense competition in each of its businesses, and competitive challenges from lower costmanufacturers in overseas markets. If we cannot successfully compete in an increasingly global market place,our operating results may be adversely affected.
The company operates in competitive domestic and international markets and competes with many large,well-established and highly competitive manufacturers and service providers, both domestically and on a globalbasis. The company’s businesses are facing competition from lower cost manufacturers in Asia and elsewhere. Inaddition, there is a risk that growth in paperboard capacity could outpace demand. All of these conditions cancontribute to substantial pricing and demand pressures, which could adversely affect the company’s operatingresults.
A key component of the company’s competitive position is MeadWestvaco’s ability to manage expensessuccessfully. This requires continuous management focus on reducing and improving efficiency through costcontrols, productivity enhancements and regular appraisal of our asset portfolio.
The company’s operations are increasingly global in nature, particularly in our consumer packaging businesses.Our business, financial condition and results of operations could be adversely affected by the political andeconomic conditions of the countries in which we conduct business, by fluctuations in currency exchange ratesand other factors related to our international operations.
Approximately 46% of the company’s annual revenues in 2009 were derived from export sales and salesfrom locations outside the U.S. As our international operations and activities expand, we face increasingexposure to the risks of operating in many foreign countries. These factors include:
• Changes in foreign currency exchange rates which could adversely affect our competitive position,selling prices and manufacturing costs, and therefore the demand for our products in a particularmarket.
• Trade protection measures in favor of local producers of competing products, including governmentsubsidies, tax benefits, trade actions (such as anti-dumping proceedings) and other measures givinglocal producers a competitive advantage over the company.
• Changes generally in political, regulatory or economic conditions in the countries in which we conductbusiness.
These risks could affect the cost of manufacturing and selling our products, our pricing, sales volume, andultimately our financial performance. The likelihood of such occurrences and their potential effect on thecompany vary from country to country and are unpredictable.
6
The company continues to realign and restructure its packaging converting businesses. Although the companybelieves that it will implement and manage the reorganization effectively to achieve substantial savings for thecompany, these major changes have attendant inherent risks, including the potential for disruption in ourpackaging businesses and operations as we implement the realignment.
The company’s packaging businesses continue to be transitioned into a focused end market facingcommercial organization. The company’s leadership expects to successfully and seamlessly manage thesetransitions. However, any major reorganization presents challenges and it is possible that there could bedisruptions in our business and operations during the transition period. Disruptions in production, quality control,customer service and innovation, as well as in other aspects of our operations, could negatively impact our resultsof operations.
The company is subject to extensive regulation under various environmental laws and regulations, and isinvolved in various legal proceedings related to the environment. Environmental regulation and legalproceedings have the potential for involving significant costs and liability for the company.
The company’s operations are subject to a wide range of general and industry-specific environmental lawsand regulations. The company has been focused for some time on improving energy efficiency which alsoreduces its emissions of carbon dioxide. In recent years, acting unilaterally, the company reduced its carbondioxide emissions even as overall production has increased. Since 2000, MWV reduced the annual emissions atits three currently operating U.S. integrated mills by over 475,000 metric tons. In 2008, total direct emissionsfrom the company’s U.S. manufacturing facilities were 2,377,000 metric tons. In 2008, total indirect emissionsfrom purchased electric power consumed at its U.S. manufacturing facilities were 902,000 metric tons. Indirectemissions in 2008 resulting from transportation are estimated to have been 300,000 metric tons (the bulk of theseemissions are related to transportation by third parties of raw materials and finished goods) from the company’sU.S. manufacturing facilities. Data analysis for 2009 has not been developed at this time. The company iscommitted to obtaining additional reductions in these emissions as the efficient use of various forms of energy isenhanced. MWV’s emissions are calculated using the WRI/WBCSD (World Resources Institute/World BusinessCouncil for Sustainable Development) guidance for reporting greenhouse gas emissions.
Legislation recently approved by the House of Representatives would, over time, require sweepingreductions of greenhouse gas emissions in the United States. Although substantial allowances would be providedto energy intensive industries in the early years of this program, the adverse economic impact on certain of thecompany’s more energy intensive operations could increase substantially in future decades, especially for thosemost dependent on coal. The possibility of ever increasing, and ever more uncertain, energy costs may influencethe company’s investment decisions regarding certain of its energy intensive operations, should such legislationbe enacted. Key variables include, but are not limited to, the cost, and the relative predictability of the cost, ofany required emissions permits; the availability and affordability of alternative, lower carbon, energy sources; theregulatory treatment of biomass as a fuel source for the forest products industry and other industries; therecognition given to emissions reductions already achieved; the future cost of energy generally and its overallimpact on the economy; and the degree to which new regulatory requirements would also be borne by thecompany’s international competitors. The company has communicated its concerns about provisions of thepending legislation to members of Congress.
The U.S. Environmental Protection Agency has announced its intention to adopt new air emissionregulations covering greenhouse gas emissions, new emission standards for industrial boilers and establishmentof more stringent ambient air quality standards. Changes in environmental laws and regulations, or theirapplication, could subject the company to significant additional capital expenditures and operating expenses infuture years. However, any such changes are uncertain and, therefore, it is not possible for the company topredict with certainty the amount of additional capital expenditures or operating expenses that could be necessaryfor compliance with respect to any such changes.
7
The company is also subject to various environmental proceedings and may be subject to additionalproceedings in the future. In the case of known potential liabilities, it is management’s judgment that theresolution of pending litigation and proceedings is not expected to have a material adverse effect on thecompany’s consolidated financial condition or liquidity. In any given period or periods, however, it is possiblesuch proceedings or matters could have a material effect on the results of operations. The company could also besubject to new environmental proceedings which could cause the company to incur substantial additional costswith resulting impact on results of operations.
Additional information regarding environmental proceedings involving MeadWestvaco is set forth in Part I,Item 3.
Material disruptions at one of our manufacturing facilities could negatively impact our financial results.
We believe we operate our facilities in compliance with applicable rules and regulations and take measuresto minimize the risks of disruption at our facilities. A material operational disruption in one of our majorfacilities could negatively impact production and our financial results. Such a disruption could occur as a resultof any number of events including but not limited to a major equipment failure, labor stoppages, transportationfailures affecting the supply and shipment of materials, severe weather conditions, and disruptions in utilityservices.
The real estate industry is highly competitive and economically cyclical.
The company engages in value-added real estate development activities, including obtaining entitlementsand establishing joint ventures and other development-related arrangements. Many of our competitors in thisindustry have greater resources and experience in real estate development than we have currently. In addition,our ability to execute our plans to divest or otherwise realize the greater value associated with our landholdingsmay be affected by the following factors, among others:
• General economic conditions, including credit markets and interest rates.
• Local real estate market conditions, including competition from sellers of land and real estatedevelopers.
• Impact of federal, state and local laws and regulations affecting land use, land use entitlements, landprotection and zoning.
Changes in tax laws may have a material effect on our future cash flows and results of operations.
Changes in business tax laws being proposed by the President relating to domestic and international taxationcould subject the company to significant additional taxes. Future changes in U.S. and foreign tax provisions areuncertain and, therefore, it is not possible for the company to predict with certainty the amount of additional taxexpense the company would incur.
Item 1B. Unresolved staff comments
None.
8
Item 2. Properties
MeadWestvaco is headquartered in Richmond, Virginia. MeadWestvaco believes that its facilities havesufficient capacity to meet current production requirements. The locations of MeadWestvaco’s productionfacilities as of December 31, 2009 were as follows:
Packaging Resources
Blumenau, Santa Catarina, Brazil Pacajus, Ceara, BrazilCottonton, Alabama Silsbee, TexasCovington, Virginia Tres Barras, Santa Catarina, BrazilEvadale, Texas Valinhos, Sao Paulo, BrazilFeira de Santana, Bahia, Brazil Venlo, The NetherlandsLow Moor, Virginia
Consumer Solutions
Ajax, Ontario, Canada Melrose Park, Illinois (Leased)Atlanta, Georgia Milan, Italy (Leased)Barcelona, Spain Moscow, Russian Federation (Leased)Bilbao, Spain Piaseczno, PolandBristol, United Kingdom Pittsfield, Massachusetts (Leased)Buenos Aires, Argentina (Leased) Preston, United KingdomBydgoszcz, Poland Roosendaal, The NetherlandsChateauroux, France Sao Paulo, Sao Paulo, Brazil (Leased)Chicago, Illinois San Luis Potosi, MexicoCorby, United Kingdom Santiago de Chile, Chile (Leased)Deols, France Shimada, JapanDublin, Ireland (Leased) Slough, United Kingdom (Leased)Elizabethtown, Kentucky Smyrna, GeorgiaEnschede, The Netherlands Svitavy, Czech RepublicFreden, Germany Swindon, United Kingdom (Leased)Grandview, Missouri Thalgau, Austria (Leased)Graz, Austria Tecate, Mexico (Leased)Hemer, Germany Tijuana, Mexico (Leased)Jacksonville, Illinois Trier, GermanyKrakow, Poland Troyes, FranceLanett, Alabama Valinhos, Sao Paulo, BrazilLondon, United Kingdom (Leased) Winfield, KansasMebane, North Carolina Wuxi, People’s Republic of China
Consumer & Office Products
Alexandria, Pennsylvania Los Angeles, CaliforniaBauru, Sao Paulo, Brazil Santana de Parnaiba, Sao Paulo, Brazil (Leased)Chamblee, Georgia Sidney, New YorkDallas, Texas (Leased) Toronto, Ontario, Canada (Leased)Indianapolis, Indiana Williamsburg, PennsylvaniaKenosha, Wisconsin
Specialty Chemicals
Covington, Virginia Shaxian, People’s Republic of ChinaDeRidder, Louisiana Waynesboro, GeorgiaNorth Charleston, South Carolina Wickliffe, Kentucky
9
Community Development and Land Management Group and Forestry Centers
Rupert, West Virginia Tres Barras, Santa Catarina, BrazilSummerville, South Carolina Waverly Hall, Georgia
Research Facilities
Raleigh, North Carolina (Leased) Shekou Shenzhen, People’s Republic of ChinaNorth Charleston, South Carolina Tres Barras, Santa Catarina, Brazil
Leases
For financial data on MeadWestvaco’s lease commitments, see Note I of Notes to Consolidated FinancialStatements included in Part II, Item 8.
Other information
MeadWestvaco owns all of the facilities listed above, except as noted.
A limited number of MeadWestvaco facilities are owned, in whole or in part, by municipal or other publicauthorities pursuant to standard industrial revenue bond financing arrangements and are accounted for asproperty owned by MeadWestvaco. MeadWestvaco holds options under which it may purchase each of thesefacilities from such authorities by paying a nominal purchase price and assuming the indebtedness of theindustrial revenue bonds at the time of the purchase.
As of December 31, 2009, MeadWestvaco owned about 755,000 acres of forestlands and other landholdingsin the U.S. and about 135,000 acres of forestlands in Brazil (more than 1,200 miles from the Amazon rainforest).
10
Item 3. Legal proceedings
On August 28, 2000, an enforcement action in Federal District Court in Maryland was brought by the U.S.Environmental Protection Agency (“EPA”) asserting that Westvaco did not obtain permits under the preventionof significant deterioration regulations under the Clean Air Act or install required pollution controls inconnection with capital projects at the Luke, Maryland mill carried out in the 1980s. MeadWestvaco stronglydisagrees and is vigorously defending this action. On April 23, 2001, the Court dismissed the EPA’s claims forcivil penalties under the major counts of the complaint and the government subsequently abandoned several of itsclaims. Motions for summary judgment have resulted in dismissal of one of the two remaining claims. Additionalmotions addressed to the remaining claim have been scheduled by the Court. Based on information currentlyavailable, MeadWestvaco does not expect this proceeding will have a material adverse effect on our consolidatedfinancial condition or liquidity. In any given period or periods, however, it is possible such proceeding couldhave a material effect on the results of operations.
MeadWestvaco has established liabilities of $24 million relating to environmental proceedings. Additionalinformation is included in Part I, Item 1, and Note P of Notes to Consolidated Financial Statements included inPart II, Item 8.
MeadWestvaco is involved in various other litigation and administrative proceedings arising in the normalcourse of business. Although the ultimate outcome of such matters cannot be predicted with certainty, we do notbelieve that the currently expected outcome of any proceeding, lawsuit or claim that is pending or threatened, orall of them combined, will have a material adverse effect on its consolidated financial condition or liquidity. Inany given period or periods, however, it is possible such proceedings or matters could have a material effect onthe results of operations.
Item 4. Submission of matters to a vote of security holders
There were no matters submitted to a vote of security holders of MeadWestvaco, through the solicitation ofproxies or otherwise, during the fourth quarter of 2009.
11
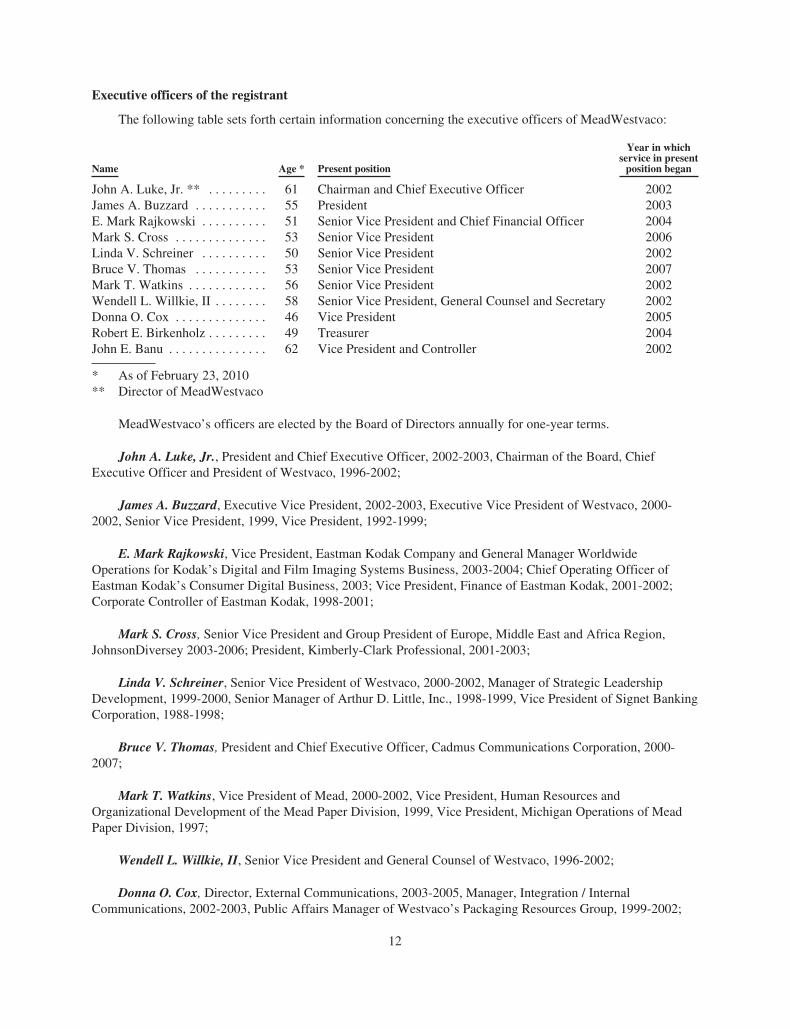
Executive officers of the registrant
The following table sets forth certain information concerning the executive officers of MeadWestvaco:
Name Age * Present position
Year in whichservice in presentposition began
John A. Luke, Jr. ** . . . . . . . . . 61 Chairman and Chief Executive Officer 2002James A. Buzzard . . . . . . . . . . . 55 President 2003E. Mark Rajkowski . . . . . . . . . . 51 Senior Vice President and Chief Financial Officer 2004Mark S. Cross . . . . . . . . . . . . . . 53 Senior Vice President 2006Linda V. Schreiner . . . . . . . . . . 50 Senior Vice President 2002Bruce V. Thomas . . . . . . . . . . . 53 Senior Vice President 2007Mark T. Watkins . . . . . . . . . . . . 56 Senior Vice President 2002Wendell L. Willkie, II . . . . . . . . 58 Senior Vice President, General Counsel and Secretary 2002Donna O. Cox . . . . . . . . . . . . . . 46 Vice President 2005Robert E. Birkenholz . . . . . . . . . 49 Treasurer 2004John E. Banu . . . . . . . . . . . . . . . 62 Vice President and Controller 2002
* As of February 23, 2010** Director of MeadWestvaco
MeadWestvaco’s officers are elected by the Board of Directors annually for one-year terms.
John A. Luke, Jr., President and Chief Executive Officer, 2002-2003, Chairman of the Board, ChiefExecutive Officer and President of Westvaco, 1996-2002;
James A. Buzzard, Executive Vice President, 2002-2003, Executive Vice President of Westvaco, 2000-2002, Senior Vice President, 1999, Vice President, 1992-1999;
E. Mark Rajkowski, Vice President, Eastman Kodak Company and General Manager WorldwideOperations for Kodak’s Digital and Film Imaging Systems Business, 2003-2004; Chief Operating Officer ofEastman Kodak’s Consumer Digital Business, 2003; Vice President, Finance of Eastman Kodak, 2001-2002;Corporate Controller of Eastman Kodak, 1998-2001;
Mark S. Cross, Senior Vice President and Group President of Europe, Middle East and Africa Region,JohnsonDiversey 2003-2006; President, Kimberly-Clark Professional, 2001-2003;
Linda V. Schreiner, Senior Vice President of Westvaco, 2000-2002, Manager of Strategic LeadershipDevelopment, 1999-2000, Senior Manager of Arthur D. Little, Inc., 1998-1999, Vice President of Signet BankingCorporation, 1988-1998;
Bruce V. Thomas, President and Chief Executive Officer, Cadmus Communications Corporation, 2000-2007;
Mark T. Watkins, Vice President of Mead, 2000-2002, Vice President, Human Resources andOrganizational Development of the Mead Paper Division, 1999, Vice President, Michigan Operations of MeadPaper Division, 1997;
Wendell L. Willkie, II, Senior Vice President and General Counsel of Westvaco, 1996-2002;
Donna O. Cox, Director, External Communications, 2003-2005, Manager, Integration / InternalCommunications, 2002-2003, Public Affairs Manager of Westvaco’s Packaging Resources Group, 1999-2002;
12
Robert E. Birkenholz, Assistant Treasurer, 2003-2004; Assistant Treasurer, Amerada Hess Corporation,1997-2002;
John E. Banu, Vice President of Westvaco, 1999-2002; Controller, 1995-1999.
There are no family relationships among executive officers or understandings between any executive officerand any other person pursuant to which the officer was selected as an officer.
13
Part II
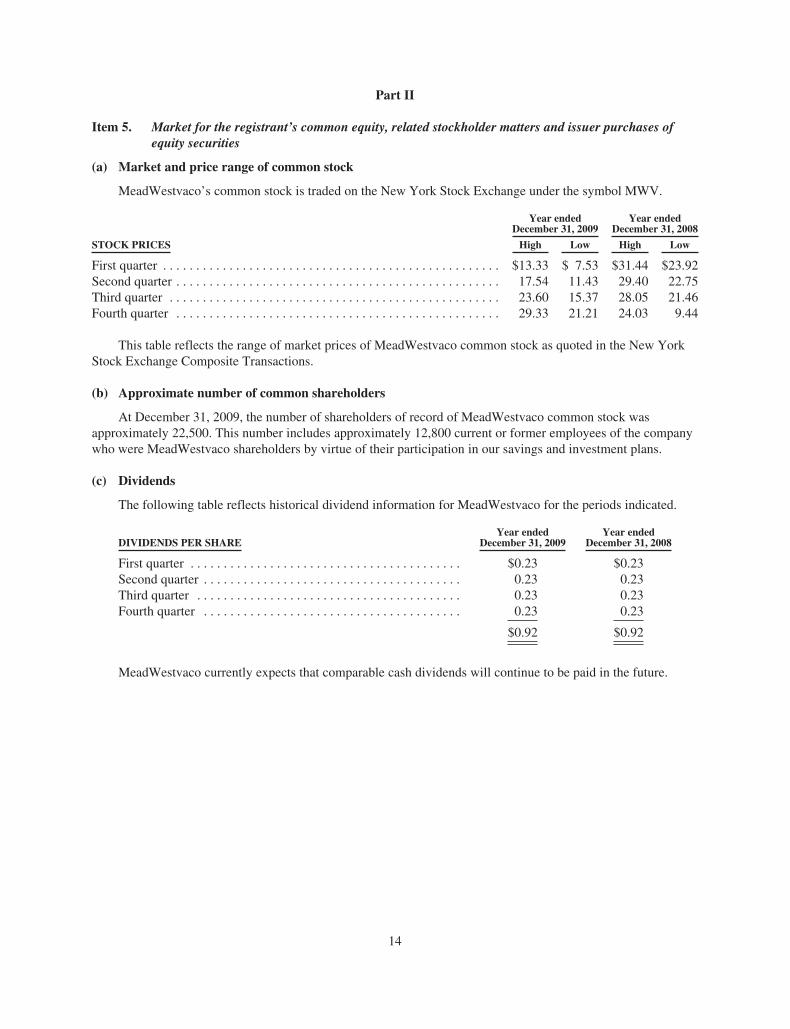
Item 5. Market for the registrant’s common equity, related stockholder matters and issuer purchases ofequity securities
(a) Market and price range of common stock
MeadWestvaco’s common stock is traded on the New York Stock Exchange under the symbol MWV.
Year endedDecember 31, 2009
Year endedDecember 31, 2008
STOCK PRICES High Low High Low
First quarter . . . . . . . . . . . . . . . . . . . . . . . . . . . . . . . . . . . . . . . . . . . . . . . . . . . $13.33 $ 7.53 $31.44 $23.92Second quarter . . . . . . . . . . . . . . . . . . . . . . . . . . . . . . . . . . . . . . . . . . . . . . . . . 17.54 11.43 29.40 22.75Third quarter . . . . . . . . . . . . . . . . . . . . . . . . . . . . . . . . . . . . . . . . . . . . . . . . . . 23.60 15.37 28.05 21.46Fourth quarter . . . . . . . . . . . . . . . . . . . . . . . . . . . . . . . . . . . . . . . . . . . . . . . . . 29.33 21.21 24.03 9.44
This table reflects the range of market prices of MeadWestvaco common stock as quoted in the New YorkStock Exchange Composite Transactions.
(b) Approximate number of common shareholders
At December 31, 2009, the number of shareholders of record of MeadWestvaco common stock wasapproximately 22,500. This number includes approximately 12,800 current or former employees of the companywho were MeadWestvaco shareholders by virtue of their participation in our savings and investment plans.
(c) Dividends
The following table reflects historical dividend information for MeadWestvaco for the periods indicated.
DIVIDENDS PER SHAREYear ended
December 31, 2009Year ended
December 31, 2008
First quarter . . . . . . . . . . . . . . . . . . . . . . . . . . . . . . . . . . . . . . . . . $0.23 $0.23Second quarter . . . . . . . . . . . . . . . . . . . . . . . . . . . . . . . . . . . . . . . 0.23 0.23Third quarter . . . . . . . . . . . . . . . . . . . . . . . . . . . . . . . . . . . . . . . . 0.23 0.23Fourth quarter . . . . . . . . . . . . . . . . . . . . . . . . . . . . . . . . . . . . . . . 0.23 0.23
$0.92 $0.92
MeadWestvaco currently expects that comparable cash dividends will continue to be paid in the future.
14
Item 6. Selected financial data
Years ended December 31,
Dollars in millions, except per share data 2009 2008 2007 2006 2005
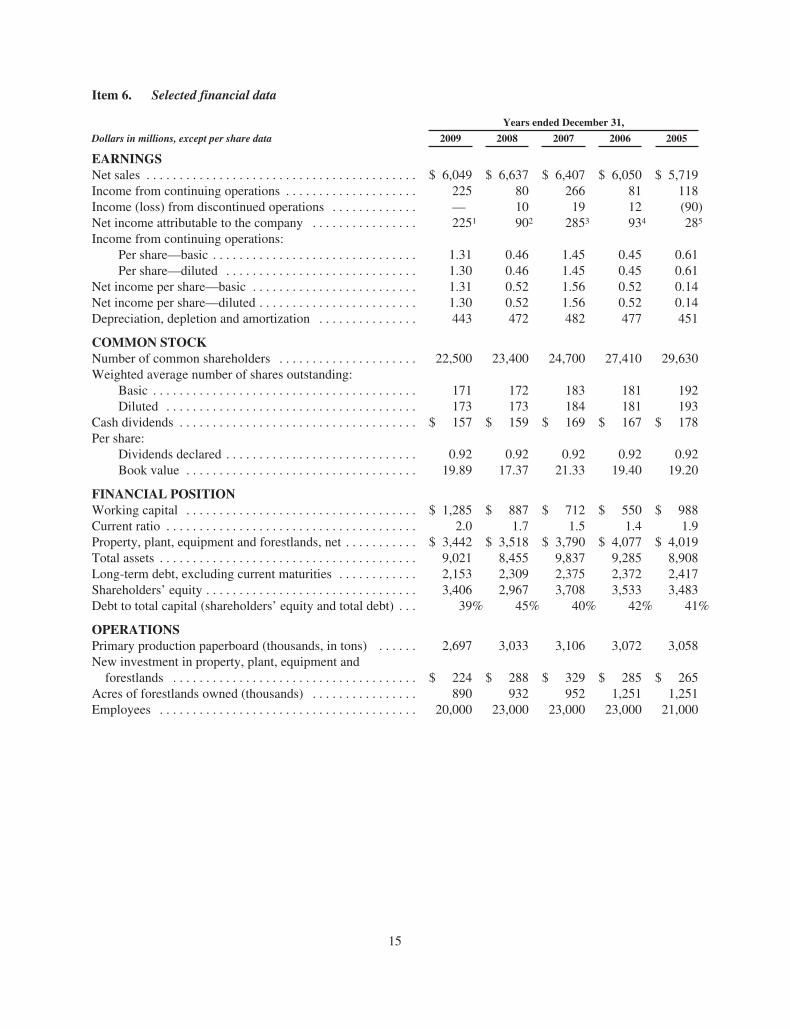
EARNINGSNet sales . . . . . . . . . . . . . . . . . . . . . . . . . . . . . . . . . . . . . . . . . $ 6,049 $ 6,637 $ 6,407 $ 6,050 $ 5,719Income from continuing operations . . . . . . . . . . . . . . . . . . . . 225 80 266 81 118Income (loss) from discontinued operations . . . . . . . . . . . . . — 10 19 12 (90)Net income attributable to the company . . . . . . . . . . . . . . . . 2251 902 2853 934 285
Income from continuing operations:Per share—basic . . . . . . . . . . . . . . . . . . . . . . . . . . . . . . . 1.31 0.46 1.45 0.45 0.61Per share—diluted . . . . . . . . . . . . . . . . . . . . . . . . . . . . . 1.30 0.46 1.45 0.45 0.61
Net income per share—basic . . . . . . . . . . . . . . . . . . . . . . . . . 1.31 0.52 1.56 0.52 0.14Net income per share—diluted . . . . . . . . . . . . . . . . . . . . . . . . 1.30 0.52 1.56 0.52 0.14Depreciation, depletion and amortization . . . . . . . . . . . . . . . 443 472 482 477 451
COMMON STOCKNumber of common shareholders . . . . . . . . . . . . . . . . . . . . . 22,500 23,400 24,700 27,410 29,630Weighted average number of shares outstanding:
Basic . . . . . . . . . . . . . . . . . . . . . . . . . . . . . . . . . . . . . . . . 171 172 183 181 192Diluted . . . . . . . . . . . . . . . . . . . . . . . . . . . . . . . . . . . . . . 173 173 184 181 193
Cash dividends . . . . . . . . . . . . . . . . . . . . . . . . . . . . . . . . . . . . $ 157 $ 159 $ 169 $ 167 $ 178Per share:
Dividends declared . . . . . . . . . . . . . . . . . . . . . . . . . . . . . 0.92 0.92 0.92 0.92 0.92Book value . . . . . . . . . . . . . . . . . . . . . . . . . . . . . . . . . . . 19.89 17.37 21.33 19.40 19.20
FINANCIAL POSITIONWorking capital . . . . . . . . . . . . . . . . . . . . . . . . . . . . . . . . . . . $ 1,285 $ 887 $ 712 $ 550 $ 988Current ratio . . . . . . . . . . . . . . . . . . . . . . . . . . . . . . . . . . . . . . 2.0 1.7 1.5 1.4 1.9Property, plant, equipment and forestlands, net . . . . . . . . . . . $ 3,442 $ 3,518 $ 3,790 $ 4,077 $ 4,019Total assets . . . . . . . . . . . . . . . . . . . . . . . . . . . . . . . . . . . . . . . 9,021 8,455 9,837 9,285 8,908Long-term debt, excluding current maturities . . . . . . . . . . . . 2,153 2,309 2,375 2,372 2,417Shareholders’ equity . . . . . . . . . . . . . . . . . . . . . . . . . . . . . . . . 3,406 2,967 3,708 3,533 3,483Debt to total capital (shareholders’ equity and total debt) . . . 39% 45% 40% 42% 41%
OPERATIONSPrimary production paperboard (thousands, in tons) . . . . . . 2,697 3,033 3,106 3,072 3,058New investment in property, plant, equipment andforestlands . . . . . . . . . . . . . . . . . . . . . . . . . . . . . . . . . . . . . $ 224 $ 288 $ 329 $ 285 $ 265
Acres of forestlands owned (thousands) . . . . . . . . . . . . . . . . 890 932 952 1,251 1,251Employees . . . . . . . . . . . . . . . . . . . . . . . . . . . . . . . . . . . . . . . 20,000 23,000 23,000 23,000 21,000
15
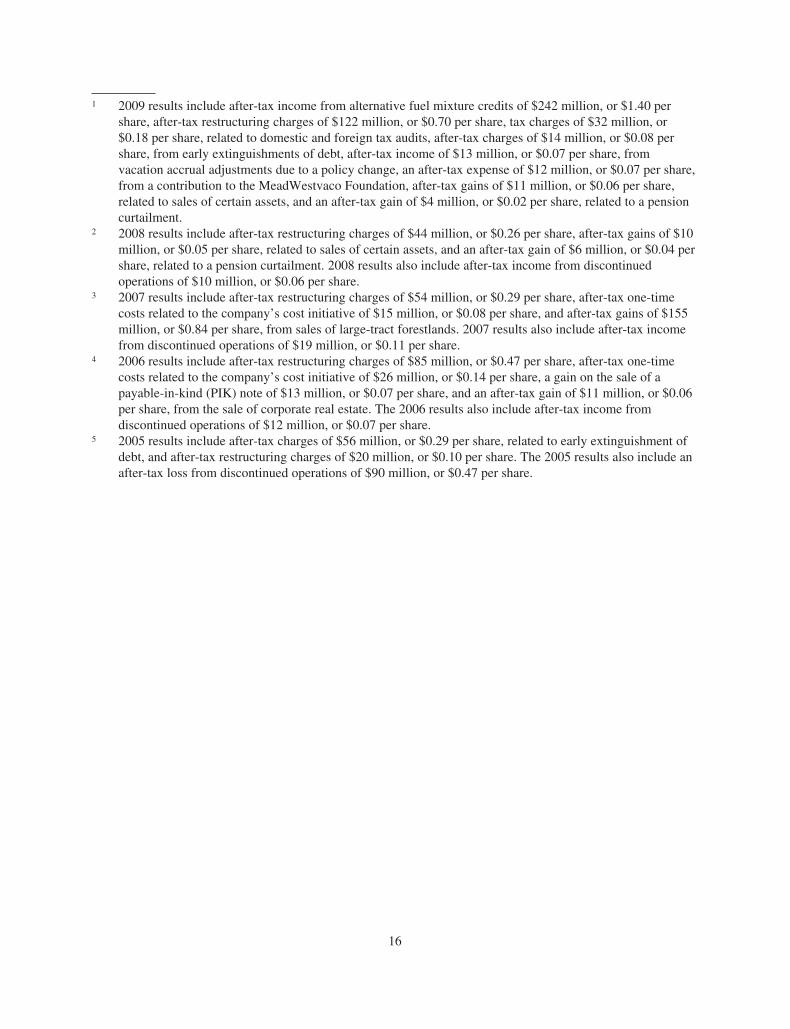
1 2009 results include after-tax income from alternative fuel mixture credits of $242 million, or $1.40 pershare, after-tax restructuring charges of $122 million, or $0.70 per share, tax charges of $32 million, or$0.18 per share, related to domestic and foreign tax audits, after-tax charges of $14 million, or $0.08 pershare, from early extinguishments of debt, after-tax income of $13 million, or $0.07 per share, fromvacation accrual adjustments due to a policy change, an after-tax expense of $12 million, or $0.07 per share,from a contribution to the MeadWestvaco Foundation, after-tax gains of $11 million, or $0.06 per share,related to sales of certain assets, and an after-tax gain of $4 million, or $0.02 per share, related to a pensioncurtailment.
2 2008 results include after-tax restructuring charges of $44 million, or $0.26 per share, after-tax gains of $10million, or $0.05 per share, related to sales of certain assets, and an after-tax gain of $6 million, or $0.04 pershare, related to a pension curtailment. 2008 results also include after-tax income from discontinuedoperations of $10 million, or $0.06 per share.
3 2007 results include after-tax restructuring charges of $54 million, or $0.29 per share, after-tax one-timecosts related to the company’s cost initiative of $15 million, or $0.08 per share, and after-tax gains of $155million, or $0.84 per share, from sales of large-tract forestlands. 2007 results also include after-tax incomefrom discontinued operations of $19 million, or $0.11 per share.
4 2006 results include after-tax restructuring charges of $85 million, or $0.47 per share, after-tax one-timecosts related to the company’s cost initiative of $26 million, or $0.14 per share, a gain on the sale of apayable-in-kind (PIK) note of $13 million, or $0.07 per share, and an after-tax gain of $11 million, or $0.06per share, from the sale of corporate real estate. The 2006 results also include after-tax income fromdiscontinued operations of $12 million, or $0.07 per share.
5 2005 results include after-tax charges of $56 million, or $0.29 per share, related to early extinguishment ofdebt, and after-tax restructuring charges of $20 million, or $0.10 per share. The 2005 results also include anafter-tax loss from discontinued operations of $90 million, or $0.47 per share.
16
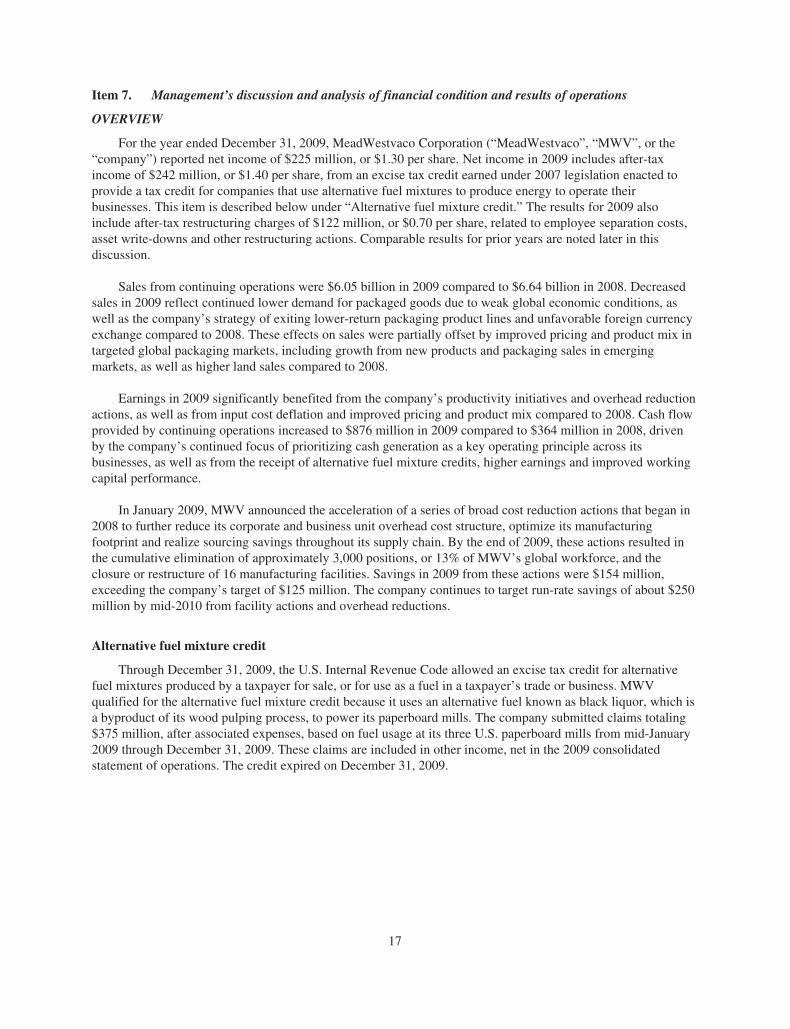
Item 7. Management’s discussion and analysis of financial condition and results of operations
OVERVIEW
For the year ended December 31, 2009, MeadWestvaco Corporation (“MeadWestvaco”, “MWV”, or the“company”) reported net income of $225 million, or $1.30 per share. Net income in 2009 includes after-taxincome of $242 million, or $1.40 per share, from an excise tax credit earned under 2007 legislation enacted toprovide a tax credit for companies that use alternative fuel mixtures to produce energy to operate theirbusinesses. This item is described below under “Alternative fuel mixture credit.” The results for 2009 alsoinclude after-tax restructuring charges of $122 million, or $0.70 per share, related to employee separation costs,asset write-downs and other restructuring actions. Comparable results for prior years are noted later in thisdiscussion.
Sales from continuing operations were $6.05 billion in 2009 compared to $6.64 billion in 2008. Decreasedsales in 2009 reflect continued lower demand for packaged goods due to weak global economic conditions, aswell as the company’s strategy of exiting lower-return packaging product lines and unfavorable foreign currencyexchange compared to 2008. These effects on sales were partially offset by improved pricing and product mix intargeted global packaging markets, including growth from new products and packaging sales in emergingmarkets, as well as higher land sales compared to 2008.
Earnings in 2009 significantly benefited from the company’s productivity initiatives and overhead reductionactions, as well as from input cost deflation and improved pricing and product mix compared to 2008. Cash flowprovided by continuing operations increased to $876 million in 2009 compared to $364 million in 2008, drivenby the company’s continued focus of prioritizing cash generation as a key operating principle across itsbusinesses, as well as from the receipt of alternative fuel mixture credits, higher earnings and improved workingcapital performance.
In January 2009, MWV announced the acceleration of a series of broad cost reduction actions that began in2008 to further reduce its corporate and business unit overhead cost structure, optimize its manufacturingfootprint and realize sourcing savings throughout its supply chain. By the end of 2009, these actions resulted inthe cumulative elimination of approximately 3,000 positions, or 13% of MWV’s global workforce, and theclosure or restructure of 16 manufacturing facilities. Savings in 2009 from these actions were $154 million,exceeding the company’s target of $125 million. The company continues to target run-rate savings of about $250million by mid-2010 from facility actions and overhead reductions.
Alternative fuel mixture credit
Through December 31, 2009, the U.S. Internal Revenue Code allowed an excise tax credit for alternativefuel mixtures produced by a taxpayer for sale, or for use as a fuel in a taxpayer’s trade or business. MWVqualified for the alternative fuel mixture credit because it uses an alternative fuel known as black liquor, which isa byproduct of its wood pulping process, to power its paperboard mills. The company submitted claims totaling$375 million, after associated expenses, based on fuel usage at its three U.S. paperboard mills from mid-January2009 through December 31, 2009. These claims are included in other income, net in the 2009 consolidatedstatement of operations. The credit expired on December 31, 2009.
17
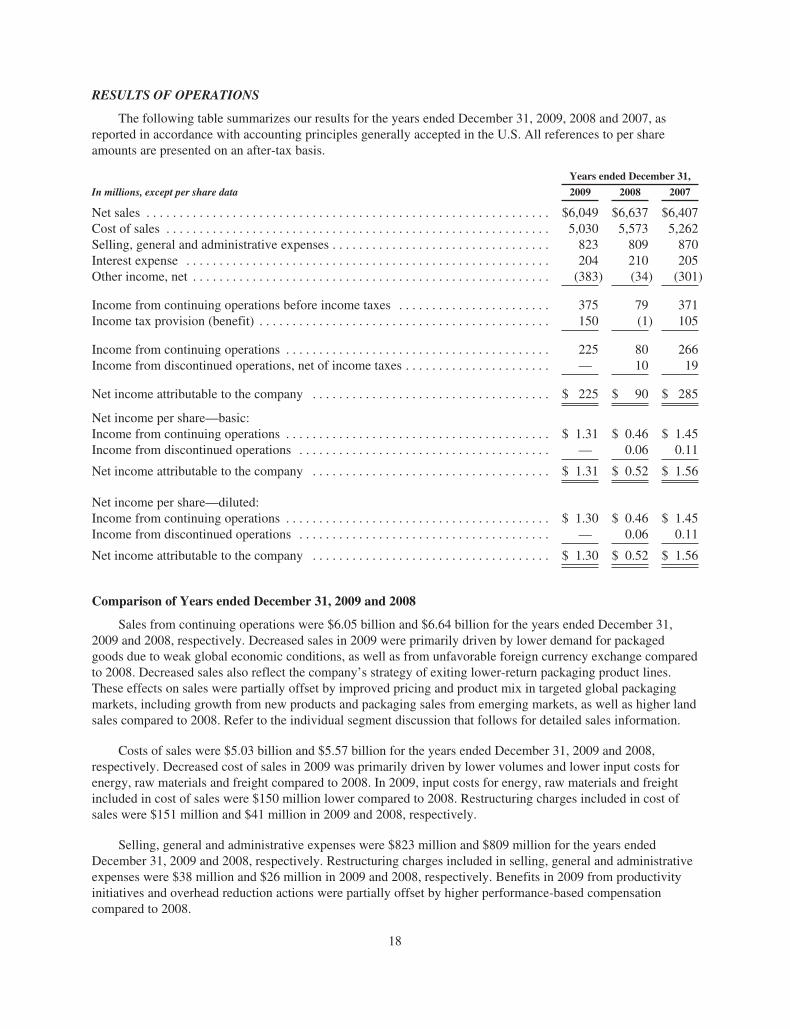
RESULTS OF OPERATIONS
The following table summarizes our results for the years ended December 31, 2009, 2008 and 2007, asreported in accordance with accounting principles generally accepted in the U.S. All references to per shareamounts are presented on an after-tax basis.
Years ended December 31,
In millions, except per share data 2009 2008 2007
Net sales . . . . . . . . . . . . . . . . . . . . . . . . . . . . . . . . . . . . . . . . . . . . . . . . . . . . . . . . . . . . . $6,049 $6,637 $6,407Cost of sales . . . . . . . . . . . . . . . . . . . . . . . . . . . . . . . . . . . . . . . . . . . . . . . . . . . . . . . . . . 5,030 5,573 5,262Selling, general and administrative expenses . . . . . . . . . . . . . . . . . . . . . . . . . . . . . . . . . 823 809 870Interest expense . . . . . . . . . . . . . . . . . . . . . . . . . . . . . . . . . . . . . . . . . . . . . . . . . . . . . . . 204 210 205Other income, net . . . . . . . . . . . . . . . . . . . . . . . . . . . . . . . . . . . . . . . . . . . . . . . . . . . . . . (383) (34) (301)
Income from continuing operations before income taxes . . . . . . . . . . . . . . . . . . . . . . . 375 79 371Income tax provision (benefit) . . . . . . . . . . . . . . . . . . . . . . . . . . . . . . . . . . . . . . . . . . . . 150 (1) 105
Income from continuing operations . . . . . . . . . . . . . . . . . . . . . . . . . . . . . . . . . . . . . . . . 225 80 266Income from discontinued operations, net of income taxes . . . . . . . . . . . . . . . . . . . . . . — 10 19
Net income attributable to the company . . . . . . . . . . . . . . . . . . . . . . . . . . . . . . . . . . . . $ 225 $ 90 $ 285
Net income per share—basic:Income from continuing operations . . . . . . . . . . . . . . . . . . . . . . . . . . . . . . . . . . . . . . . . $ 1.31 $ 0.46 $ 1.45Income from discontinued operations . . . . . . . . . . . . . . . . . . . . . . . . . . . . . . . . . . . . . . — 0.06 0.11
Net income attributable to the company . . . . . . . . . . . . . . . . . . . . . . . . . . . . . . . . . . . . $ 1.31 $ 0.52 $ 1.56
Net income per share—diluted:Income from continuing operations . . . . . . . . . . . . . . . . . . . . . . . . . . . . . . . . . . . . . . . . $ 1.30 $ 0.46 $ 1.45Income from discontinued operations . . . . . . . . . . . . . . . . . . . . . . . . . . . . . . . . . . . . . . — 0.06 0.11
Net income attributable to the company . . . . . . . . . . . . . . . . . . . . . . . . . . . . . . . . . . . . $ 1.30 $ 0.52 $ 1.56
Comparison of Years ended December 31, 2009 and 2008
Sales from continuing operations were $6.05 billion and $6.64 billion for the years ended December 31,2009 and 2008, respectively. Decreased sales in 2009 were primarily driven by lower demand for packagedgoods due to weak global economic conditions, as well as from unfavorable foreign currency exchange comparedto 2008. Decreased sales also reflect the company’s strategy of exiting lower-return packaging product lines.These effects on sales were partially offset by improved pricing and product mix in targeted global packagingmarkets, including growth from new products and packaging sales from emerging markets, as well as higher landsales compared to 2008. Refer to the individual segment discussion that follows for detailed sales information.
Costs of sales were $5.03 billion and $5.57 billion for the years ended December 31, 2009 and 2008,respectively. Decreased cost of sales in 2009 was primarily driven by lower volumes and lower input costs forenergy, raw materials and freight compared to 2008. In 2009, input costs for energy, raw materials and freightincluded in cost of sales were $150 million lower compared to 2008. Restructuring charges included in cost ofsales were $151 million and $41 million in 2009 and 2008, respectively.
Selling, general and administrative expenses were $823 million and $809 million for the years endedDecember 31, 2009 and 2008, respectively. Restructuring charges included in selling, general and administrativeexpenses were $38 million and $26 million in 2009 and 2008, respectively. Benefits in 2009 from productivityinitiatives and overhead reduction actions were partially offset by higher performance-based compensationcompared to 2008.
18
Pension income was $68 million and $93 million for the years ended December 31, 2009 and 2008,respectively. For 2009 and 2008, pension income includes curtailment gains of $6 million and $11 million,respectively, resulting from U.S. employee reductions associated with the company’s 2008 and 2005 strategiccost management programs. Pension income is included in cost of sales and selling, general and administrativeexpenses, and is included in Corporate and Other for segment reporting purposes.
Interest expense was $204 million for the year ended December 31, 2009 and was comprised of $166million related to bond and bank debt, $4 million related to a long-term obligation non-recourse to MWV, $20million related to borrowings under life insurance policies and $14 million related to other borrowings. Interestexpense was $210 million for the year ended December 31, 2008 and was comprised of $164 million related tobond and bank debt, $13 million related to a long-term obligation non-recourse to MWV, $17 million related toborrowings under life insurance policies and $16 million related to other borrowings.
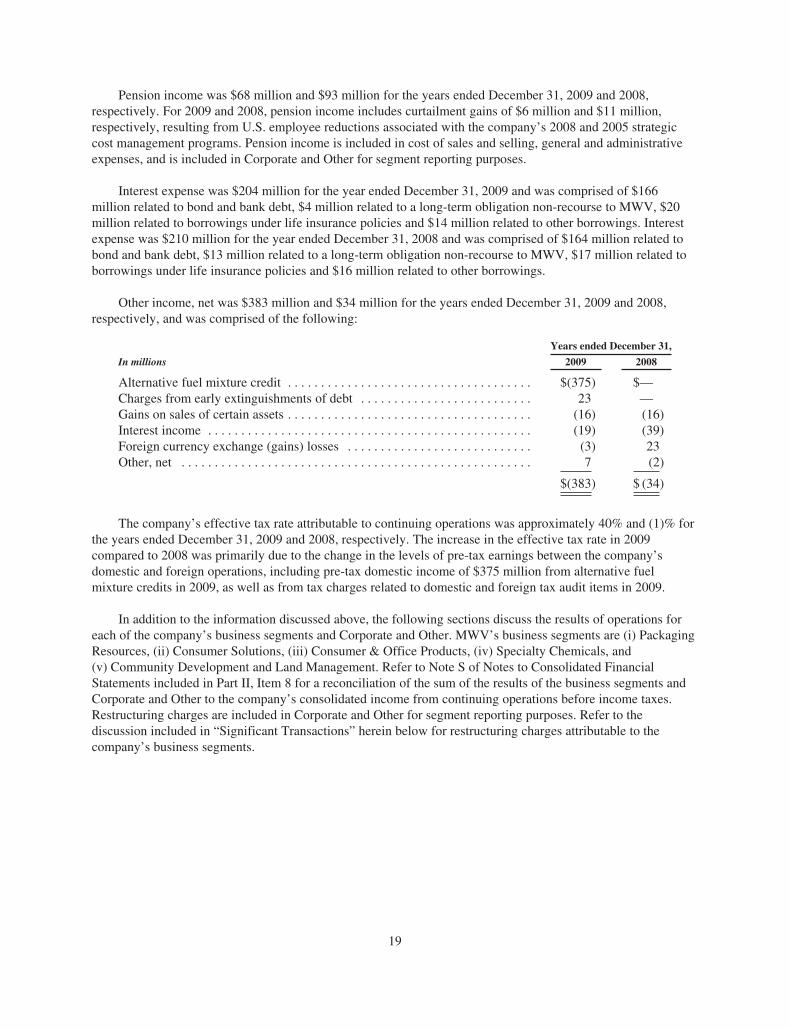
Other income, net was $383 million and $34 million for the years ended December 31, 2009 and 2008,respectively, and was comprised of the following:
Years ended December 31,
In millions 2009 2008
Alternative fuel mixture credit . . . . . . . . . . . . . . . . . . . . . . . . . . . . . . . . . . . . . $(375) $—Charges from early extinguishments of debt . . . . . . . . . . . . . . . . . . . . . . . . . . 23 —Gains on sales of certain assets . . . . . . . . . . . . . . . . . . . . . . . . . . . . . . . . . . . . . (16) (16)Interest income . . . . . . . . . . . . . . . . . . . . . . . . . . . . . . . . . . . . . . . . . . . . . . . . . (19) (39)Foreign currency exchange (gains) losses . . . . . . . . . . . . . . . . . . . . . . . . . . . . (3) 23Other, net . . . . . . . . . . . . . . . . . . . . . . . . . . . . . . . . . . . . . . . . . . . . . . . . . . . . . 7 (2)
$(383) $ (34)
The company’s effective tax rate attributable to continuing operations was approximately 40% and (1)% forthe years ended December 31, 2009 and 2008, respectively. The increase in the effective tax rate in 2009compared to 2008 was primarily due to the change in the levels of pre-tax earnings between the company’sdomestic and foreign operations, including pre-tax domestic income of $375 million from alternative fuelmixture credits in 2009, as well as from tax charges related to domestic and foreign tax audit items in 2009.
In addition to the information discussed above, the following sections discuss the results of operations foreach of the company’s business segments and Corporate and Other. MWV’s business segments are (i) PackagingResources, (ii) Consumer Solutions, (iii) Consumer & Office Products, (iv) Specialty Chemicals, and(v) Community Development and Land Management. Refer to Note S of Notes to Consolidated FinancialStatements included in Part II, Item 8 for a reconciliation of the sum of the results of the business segments andCorporate and Other to the company’s consolidated income from continuing operations before income taxes.Restructuring charges are included in Corporate and Other for segment reporting purposes. Refer to thediscussion included in “Significant Transactions” herein below for restructuring charges attributable to thecompany’s business segments.
19
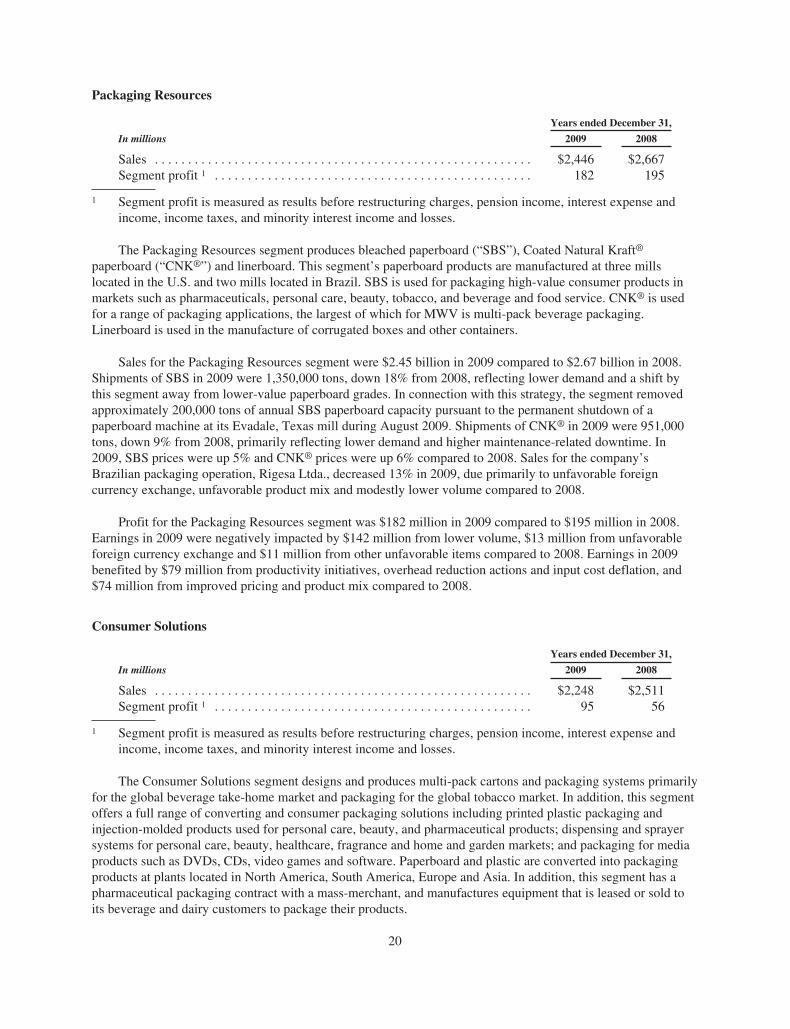
Packaging Resources
Years ended December 31,
In millions 2009 2008
Sales . . . . . . . . . . . . . . . . . . . . . . . . . . . . . . . . . . . . . . . . . . . . . . . . . . . . . . . . . $2,446 $2,667Segment profit 1 . . . . . . . . . . . . . . . . . . . . . . . . . . . . . . . . . . . . . . . . . . . . . . . . 182 195
1 Segment profit is measured as results before restructuring charges, pension income, interest expense andincome, income taxes, and minority interest income and losses.
The Packaging Resources segment produces bleached paperboard (“SBS”), Coated Natural Kraft®
paperboard (“CNK®”) and linerboard. This segment’s paperboard products are manufactured at three millslocated in the U.S. and two mills located in Brazil. SBS is used for packaging high-value consumer products inmarkets such as pharmaceuticals, personal care, beauty, tobacco, and beverage and food service. CNK® is usedfor a range of packaging applications, the largest of which for MWV is multi-pack beverage packaging.Linerboard is used in the manufacture of corrugated boxes and other containers.
Sales for the Packaging Resources segment were $2.45 billion in 2009 compared to $2.67 billion in 2008.Shipments of SBS in 2009 were 1,350,000 tons, down 18% from 2008, reflecting lower demand and a shift bythis segment away from lower-value paperboard grades. In connection with this strategy, the segment removedapproximately 200,000 tons of annual SBS paperboard capacity pursuant to the permanent shutdown of apaperboard machine at its Evadale, Texas mill during August 2009. Shipments of CNK® in 2009 were 951,000tons, down 9% from 2008, primarily reflecting lower demand and higher maintenance-related downtime. In2009, SBS prices were up 5% and CNK® prices were up 6% compared to 2008. Sales for the company’sBrazilian packaging operation, Rigesa Ltda., decreased 13% in 2009, due primarily to unfavorable foreigncurrency exchange, unfavorable product mix and modestly lower volume compared to 2008.
Profit for the Packaging Resources segment was $182 million in 2009 compared to $195 million in 2008.Earnings in 2009 were negatively impacted by $142 million from lower volume, $13 million from unfavorableforeign currency exchange and $11 million from other unfavorable items compared to 2008. Earnings in 2009benefited by $79 million from productivity initiatives, overhead reduction actions and input cost deflation, and$74 million from improved pricing and product mix compared to 2008.
Consumer Solutions
Years ended December 31,
In millions 2009 2008
Sales . . . . . . . . . . . . . . . . . . . . . . . . . . . . . . . . . . . . . . . . . . . . . . . . . . . . . . . . . $2,248 $2,511Segment profit 1 . . . . . . . . . . . . . . . . . . . . . . . . . . . . . . . . . . . . . . . . . . . . . . . . 95 56
1 Segment profit is measured as results before restructuring charges, pension income, interest expense andincome, income taxes, and minority interest income and losses.
The Consumer Solutions segment designs and produces multi-pack cartons and packaging systems primarilyfor the global beverage take-home market and packaging for the global tobacco market. In addition, this segmentoffers a full range of converting and consumer packaging solutions including printed plastic packaging andinjection-molded products used for personal care, beauty, and pharmaceutical products; dispensing and sprayersystems for personal care, beauty, healthcare, fragrance and home and garden markets; and packaging for mediaproducts such as DVDs, CDs, video games and software. Paperboard and plastic are converted into packagingproducts at plants located in North America, South America, Europe and Asia. In addition, this segment has apharmaceutical packaging contract with a mass-merchant, and manufactures equipment that is leased or sold toits beverage and dairy customers to package their products.
20
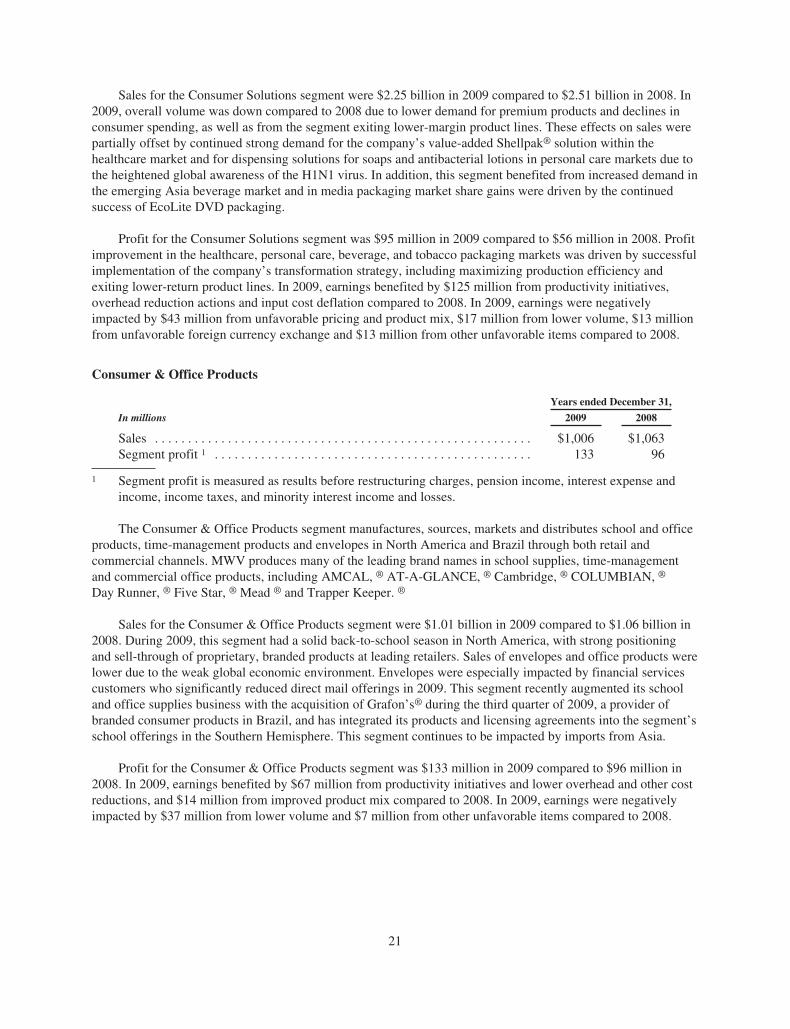
Sales for the Consumer Solutions segment were $2.25 billion in 2009 compared to $2.51 billion in 2008. In2009, overall volume was down compared to 2008 due to lower demand for premium products and declines inconsumer spending, as well as from the segment exiting lower-margin product lines. These effects on sales werepartially offset by continued strong demand for the company’s value-added Shellpak® solution within thehealthcare market and for dispensing solutions for soaps and antibacterial lotions in personal care markets due tothe heightened global awareness of the H1N1 virus. In addition, this segment benefited from increased demand inthe emerging Asia beverage market and in media packaging market share gains were driven by the continuedsuccess of EcoLite DVD packaging.
Profit for the Consumer Solutions segment was $95 million in 2009 compared to $56 million in 2008. Profitimprovement in the healthcare, personal care, beverage, and tobacco packaging markets was driven by successfulimplementation of the company’s transformation strategy, including maximizing production efficiency andexiting lower-return product lines. In 2009, earnings benefited by $125 million from productivity initiatives,overhead reduction actions and input cost deflation compared to 2008. In 2009, earnings were negativelyimpacted by $43 million from unfavorable pricing and product mix, $17 million from lower volume, $13 millionfrom unfavorable foreign currency exchange and $13 million from other unfavorable items compared to 2008.
Consumer & Office Products
Years ended December 31,
In millions 2009 2008
Sales . . . . . . . . . . . . . . . . . . . . . . . . . . . . . . . . . . . . . . . . . . . . . . . . . . . . . . . . . $1,006 $1,063Segment profit 1 . . . . . . . . . . . . . . . . . . . . . . . . . . . . . . . . . . . . . . . . . . . . . . . . 133 96
1 Segment profit is measured as results before restructuring charges, pension income, interest expense andincome, income taxes, and minority interest income and losses.
The Consumer & Office Products segment manufactures, sources, markets and distributes school and officeproducts, time-management products and envelopes in North America and Brazil through both retail andcommercial channels. MWV produces many of the leading brand names in school supplies, time-managementand commercial office products, including AMCAL, ® AT-A-GLANCE, ® Cambridge, ® COLUMBIAN, ®
Day Runner, ® Five Star, ® Mead ® and Trapper Keeper. ®
Sales for the Consumer & Office Products segment were $1.01 billion in 2009 compared to $1.06 billion in2008. During 2009, this segment had a solid back-to-school season in North America, with strong positioningand sell-through of proprietary, branded products at leading retailers. Sales of envelopes and office products werelower due to the weak global economic environment. Envelopes were especially impacted by financial servicescustomers who significantly reduced direct mail offerings in 2009. This segment recently augmented its schooland office supplies business with the acquisition of Grafon’s® during the third quarter of 2009, a provider ofbranded consumer products in Brazil, and has integrated its products and licensing agreements into the segment’sschool offerings in the Southern Hemisphere. This segment continues to be impacted by imports from Asia.
Profit for the Consumer & Office Products segment was $133 million in 2009 compared to $96 million in2008. In 2009, earnings benefited by $67 million from productivity initiatives and lower overhead and other costreductions, and $14 million from improved product mix compared to 2008. In 2009, earnings were negativelyimpacted by $37 million from lower volume and $7 million from other unfavorable items compared to 2008.
21
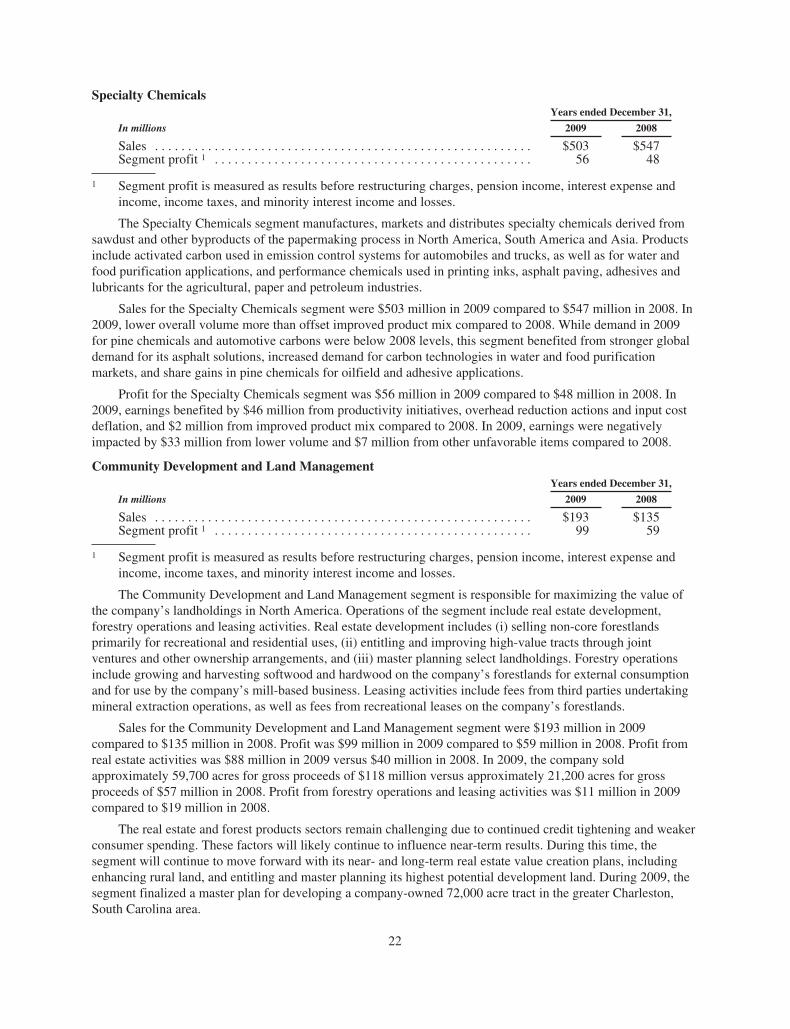
Specialty ChemicalsYears ended December 31,
In millions 2009 2008
Sales . . . . . . . . . . . . . . . . . . . . . . . . . . . . . . . . . . . . . . . . . . . . . . . . . . . . . . . . . $503 $547Segment profit 1 . . . . . . . . . . . . . . . . . . . . . . . . . . . . . . . . . . . . . . . . . . . . . . . . 56 48
1 Segment profit is measured as results before restructuring charges, pension income, interest expense andincome, income taxes, and minority interest income and losses.
The Specialty Chemicals segment manufactures, markets and distributes specialty chemicals derived fromsawdust and other byproducts of the papermaking process in North America, South America and Asia. Productsinclude activated carbon used in emission control systems for automobiles and trucks, as well as for water andfood purification applications, and performance chemicals used in printing inks, asphalt paving, adhesives andlubricants for the agricultural, paper and petroleum industries.
Sales for the Specialty Chemicals segment were $503 million in 2009 compared to $547 million in 2008. In2009, lower overall volume more than offset improved product mix compared to 2008. While demand in 2009for pine chemicals and automotive carbons were below 2008 levels, this segment benefited from stronger globaldemand for its asphalt solutions, increased demand for carbon technologies in water and food purificationmarkets, and share gains in pine chemicals for oilfield and adhesive applications.
Profit for the Specialty Chemicals segment was $56 million in 2009 compared to $48 million in 2008. In2009, earnings benefited by $46 million from productivity initiatives, overhead reduction actions and input costdeflation, and $2 million from improved product mix compared to 2008. In 2009, earnings were negativelyimpacted by $33 million from lower volume and $7 million from other unfavorable items compared to 2008.
Community Development and Land ManagementYears ended December 31,
In millions 2009 2008
Sales . . . . . . . . . . . . . . . . . . . . . . . . . . . . . . . . . . . . . . . . . . . . . . . . . . . . . . . . . $193 $135Segment profit 1 . . . . . . . . . . . . . . . . . . . . . . . . . . . . . . . . . . . . . . . . . . . . . . . . 99 59
1 Segment profit is measured as results before restructuring charges, pension income, interest expense andincome, income taxes, and minority interest income and losses.
The Community Development and Land Management segment is responsible for maximizing the value ofthe company’s landholdings in North America. Operations of the segment include real estate development,forestry operations and leasing activities. Real estate development includes (i) selling non-core forestlandsprimarily for recreational and residential uses, (ii) entitling and improving high-value tracts through jointventures and other ownership arrangements, and (iii) master planning select landholdings. Forestry operationsinclude growing and harvesting softwood and hardwood on the company’s forestlands for external consumptionand for use by the company’s mill-based business. Leasing activities include fees from third parties undertakingmineral extraction operations, as well as fees from recreational leases on the company’s forestlands.
Sales for the Community Development and Land Management segment were $193 million in 2009compared to $135 million in 2008. Profit was $99 million in 2009 compared to $59 million in 2008. Profit fromreal estate activities was $88 million in 2009 versus $40 million in 2008. In 2009, the company soldapproximately 59,700 acres for gross proceeds of $118 million versus approximately 21,200 acres for grossproceeds of $57 million in 2008. Profit from forestry operations and leasing activities was $11 million in 2009compared to $19 million in 2008.
The real estate and forest products sectors remain challenging due to continued credit tightening and weakerconsumer spending. These factors will likely continue to influence near-term results. During this time, thesegment will continue to move forward with its near- and long-term real estate value creation plans, includingenhancing rural land, and entitling and master planning its highest potential development land. During 2009, thesegment finalized a master plan for developing a company-owned 72,000 acre tract in the greater Charleston,South Carolina area.
22
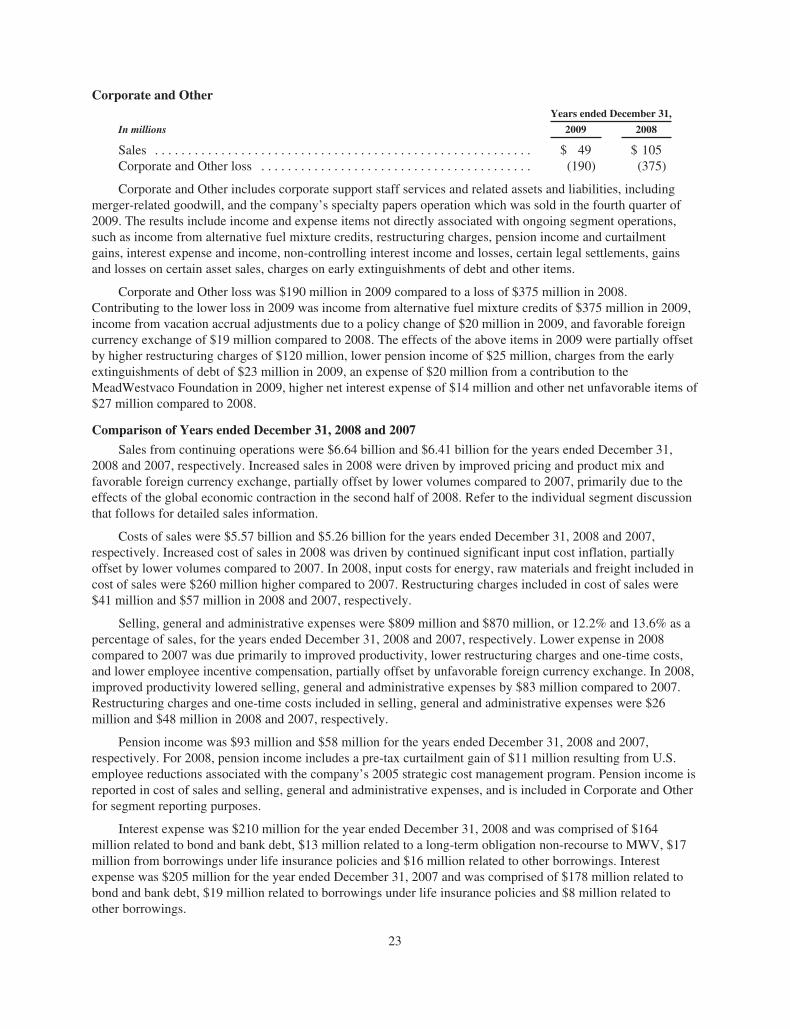
Corporate and OtherYears ended December 31,
In millions 2009 2008
Sales . . . . . . . . . . . . . . . . . . . . . . . . . . . . . . . . . . . . . . . . . . . . . . . . . . . . . . . . . $ 49 $ 105Corporate and Other loss . . . . . . . . . . . . . . . . . . . . . . . . . . . . . . . . . . . . . . . . . (190) (375)
Corporate and Other includes corporate support staff services and related assets and liabilities, includingmerger-related goodwill, and the company’s specialty papers operation which was sold in the fourth quarter of2009. The results include income and expense items not directly associated with ongoing segment operations,such as income from alternative fuel mixture credits, restructuring charges, pension income and curtailmentgains, interest expense and income, non-controlling interest income and losses, certain legal settlements, gainsand losses on certain asset sales, charges on early extinguishments of debt and other items.
Corporate and Other loss was $190 million in 2009 compared to a loss of $375 million in 2008.Contributing to the lower loss in 2009 was income from alternative fuel mixture credits of $375 million in 2009,income from vacation accrual adjustments due to a policy change of $20 million in 2009, and favorable foreigncurrency exchange of $19 million compared to 2008. The effects of the above items in 2009 were partially offsetby higher restructuring charges of $120 million, lower pension income of $25 million, charges from the earlyextinguishments of debt of $23 million in 2009, an expense of $20 million from a contribution to theMeadWestvaco Foundation in 2009, higher net interest expense of $14 million and other net unfavorable items of$27 million compared to 2008.
Comparison of Years ended December 31, 2008 and 2007
Sales from continuing operations were $6.64 billion and $6.41 billion for the years ended December 31,2008 and 2007, respectively. Increased sales in 2008 were driven by improved pricing and product mix andfavorable foreign currency exchange, partially offset by lower volumes compared to 2007, primarily due to theeffects of the global economic contraction in the second half of 2008. Refer to the individual segment discussionthat follows for detailed sales information.
Costs of sales were $5.57 billion and $5.26 billion for the years ended December 31, 2008 and 2007,respectively. Increased cost of sales in 2008 was driven by continued significant input cost inflation, partiallyoffset by lower volumes compared to 2007. In 2008, input costs for energy, raw materials and freight included incost of sales were $260 million higher compared to 2007. Restructuring charges included in cost of sales were$41 million and $57 million in 2008 and 2007, respectively.
Selling, general and administrative expenses were $809 million and $870 million, or 12.2% and 13.6% as apercentage of sales, for the years ended December 31, 2008 and 2007, respectively. Lower expense in 2008compared to 2007 was due primarily to improved productivity, lower restructuring charges and one-time costs,and lower employee incentive compensation, partially offset by unfavorable foreign currency exchange. In 2008,improved productivity lowered selling, general and administrative expenses by $83 million compared to 2007.Restructuring charges and one-time costs included in selling, general and administrative expenses were $26million and $48 million in 2008 and 2007, respectively.
Pension income was $93 million and $58 million for the years ended December 31, 2008 and 2007,respectively. For 2008, pension income includes a pre-tax curtailment gain of $11 million resulting from U.S.employee reductions associated with the company’s 2005 strategic cost management program. Pension income isreported in cost of sales and selling, general and administrative expenses, and is included in Corporate and Otherfor segment reporting purposes.
Interest expense was $210 million for the year ended December 31, 2008 and was comprised of $164million related to bond and bank debt, $13 million related to a long-term obligation non-recourse to MWV, $17million from borrowings under life insurance policies and $16 million related to other borrowings. Interestexpense was $205 million for the year ended December 31, 2007 and was comprised of $178 million related tobond and bank debt, $19 million related to borrowings under life insurance policies and $8 million related toother borrowings.
23
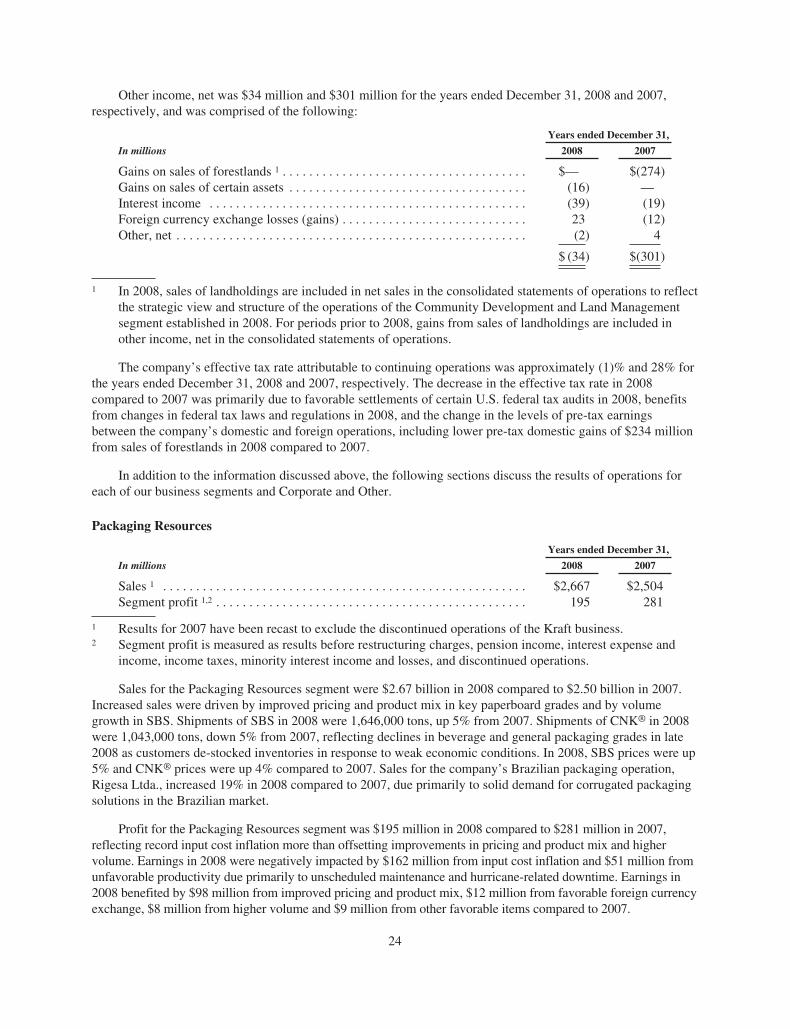
Other income, net was $34 million and $301 million for the years ended December 31, 2008 and 2007,respectively, and was comprised of the following:
Years ended December 31,
In millions 2008 2007
Gains on sales of forestlands 1 . . . . . . . . . . . . . . . . . . . . . . . . . . . . . . . . . . . . . $— $(274)Gains on sales of certain assets . . . . . . . . . . . . . . . . . . . . . . . . . . . . . . . . . . . . (16) —Interest income . . . . . . . . . . . . . . . . . . . . . . . . . . . . . . . . . . . . . . . . . . . . . . . . (39) (19)Foreign currency exchange losses (gains) . . . . . . . . . . . . . . . . . . . . . . . . . . . . 23 (12)Other, net . . . . . . . . . . . . . . . . . . . . . . . . . . . . . . . . . . . . . . . . . . . . . . . . . . . . . (2) 4
$ (34) $(301)
1 In 2008, sales of landholdings are included in net sales in the consolidated statements of operations to reflectthe strategic view and structure of the operations of the Community Development and Land Managementsegment established in 2008. For periods prior to 2008, gains from sales of landholdings are included inother income, net in the consolidated statements of operations.
The company’s effective tax rate attributable to continuing operations was approximately (1)% and 28% forthe years ended December 31, 2008 and 2007, respectively. The decrease in the effective tax rate in 2008compared to 2007 was primarily due to favorable settlements of certain U.S. federal tax audits in 2008, benefitsfrom changes in federal tax laws and regulations in 2008, and the change in the levels of pre-tax earningsbetween the company’s domestic and foreign operations, including lower pre-tax domestic gains of $234 millionfrom sales of forestlands in 2008 compared to 2007.
In addition to the information discussed above, the following sections discuss the results of operations foreach of our business segments and Corporate and Other.
Packaging Resources
Years ended December 31,
In millions 2008 2007
Sales 1 . . . . . . . . . . . . . . . . . . . . . . . . . . . . . . . . . . . . . . . . . . . . . . . . . . . . . . . $2,667 $2,504Segment profit 1,2 . . . . . . . . . . . . . . . . . . . . . . . . . . . . . . . . . . . . . . . . . . . . . . . 195 281
1 Results for 2007 have been recast to exclude the discontinued operations of the Kraft business.2 Segment profit is measured as results before restructuring charges, pension income, interest expense and
income, income taxes, minority interest income and losses, and discontinued operations.
Sales for the Packaging Resources segment were $2.67 billion in 2008 compared to $2.50 billion in 2007.Increased sales were driven by improved pricing and product mix in key paperboard grades and by volumegrowth in SBS. Shipments of SBS in 2008 were 1,646,000 tons, up 5% from 2007. Shipments of CNK® in 2008were 1,043,000 tons, down 5% from 2007, reflecting declines in beverage and general packaging grades in late2008 as customers de-stocked inventories in response to weak economic conditions. In 2008, SBS prices were up5% and CNK® prices were up 4% compared to 2007. Sales for the company’s Brazilian packaging operation,Rigesa Ltda., increased 19% in 2008 compared to 2007, due primarily to solid demand for corrugated packagingsolutions in the Brazilian market.
Profit for the Packaging Resources segment was $195 million in 2008 compared to $281 million in 2007,reflecting record input cost inflation more than offsetting improvements in pricing and product mix and highervolume. Earnings in 2008 were negatively impacted by $162 million from input cost inflation and $51 million fromunfavorable productivity due primarily to unscheduled maintenance and hurricane-related downtime. Earnings in2008 benefited by $98 million from improved pricing and product mix, $12 million from favorable foreign currencyexchange, $8 million from higher volume and $9 million from other favorable items compared to 2007.
24
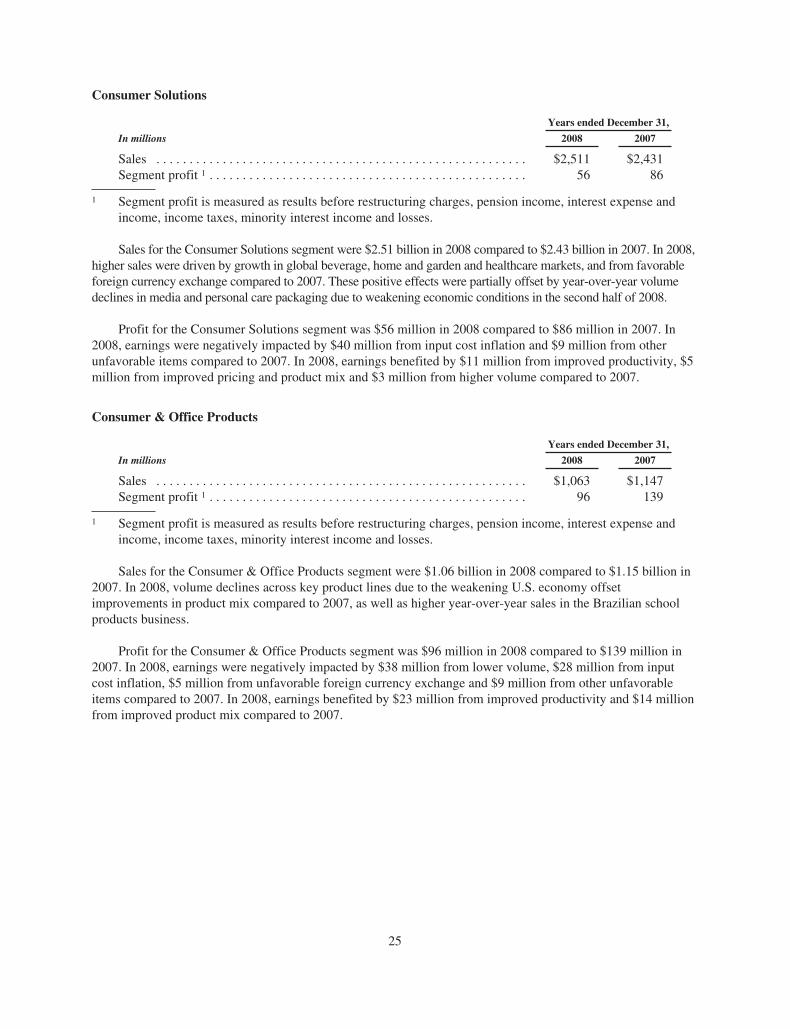
Consumer Solutions
Years ended December 31,
In millions 2008 2007
Sales . . . . . . . . . . . . . . . . . . . . . . . . . . . . . . . . . . . . . . . . . . . . . . . . . . . . . . . . $2,511 $2,431Segment profit 1 . . . . . . . . . . . . . . . . . . . . . . . . . . . . . . . . . . . . . . . . . . . . . . . . 56 86
1 Segment profit is measured as results before restructuring charges, pension income, interest expense andincome, income taxes, minority interest income and losses.
Sales for the Consumer Solutions segment were $2.51 billion in 2008 compared to $2.43 billion in 2007. In 2008,higher sales were driven by growth in global beverage, home and garden and healthcare markets, and from favorableforeign currency exchange compared to 2007. These positive effects were partially offset by year-over-year volumedeclines in media and personal care packaging due to weakening economic conditions in the second half of 2008.
Profit for the Consumer Solutions segment was $56 million in 2008 compared to $86 million in 2007. In2008, earnings were negatively impacted by $40 million from input cost inflation and $9 million from otherunfavorable items compared to 2007. In 2008, earnings benefited by $11 million from improved productivity, $5million from improved pricing and product mix and $3 million from higher volume compared to 2007.
Consumer & Office Products
Years ended December 31,
In millions 2008 2007
Sales . . . . . . . . . . . . . . . . . . . . . . . . . . . . . . . . . . . . . . . . . . . . . . . . . . . . . . . . $1,063 $1,147Segment profit 1 . . . . . . . . . . . . . . . . . . . . . . . . . . . . . . . . . . . . . . . . . . . . . . . . 96 139
1 Segment profit is measured as results before restructuring charges, pension income, interest expense andincome, income taxes, minority interest income and losses.
Sales for the Consumer & Office Products segment were $1.06 billion in 2008 compared to $1.15 billion in2007. In 2008, volume declines across key product lines due to the weakening U.S. economy offsetimprovements in product mix compared to 2007, as well as higher year-over-year sales in the Brazilian schoolproducts business.
Profit for the Consumer & Office Products segment was $96 million in 2008 compared to $139 million in2007. In 2008, earnings were negatively impacted by $38 million from lower volume, $28 million from inputcost inflation, $5 million from unfavorable foreign currency exchange and $9 million from other unfavorableitems compared to 2007. In 2008, earnings benefited by $23 million from improved productivity and $14 millionfrom improved product mix compared to 2007.
25
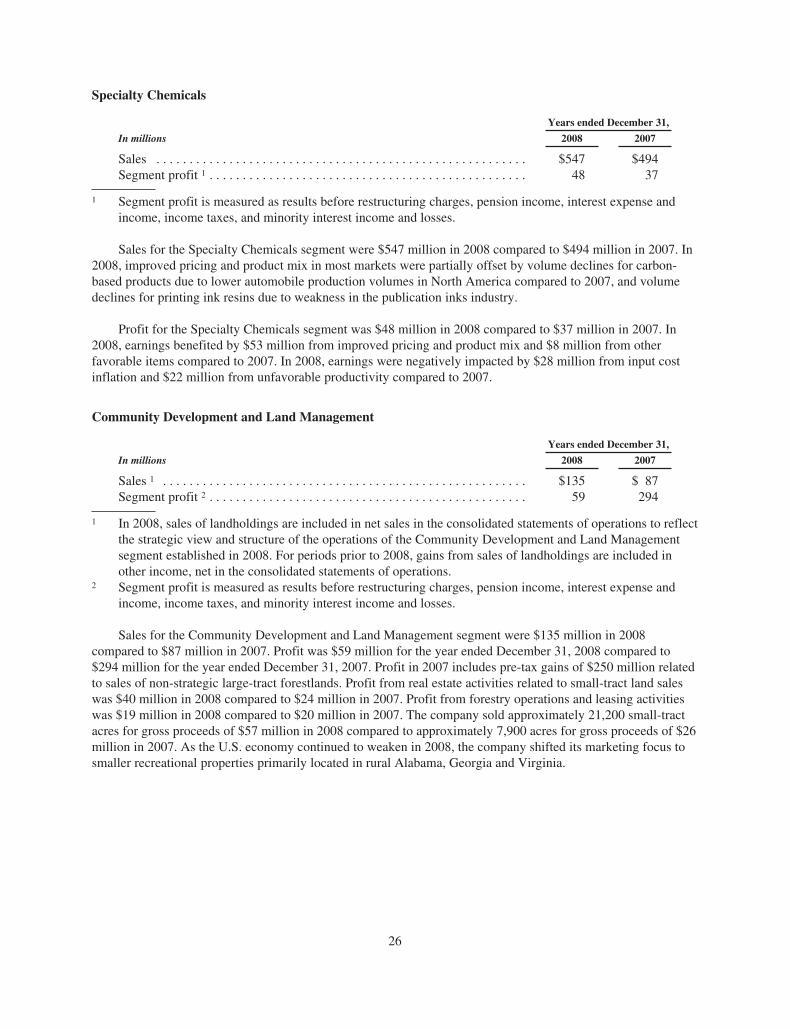
Specialty Chemicals
Years ended December 31,
In millions 2008 2007
Sales . . . . . . . . . . . . . . . . . . . . . . . . . . . . . . . . . . . . . . . . . . . . . . . . . . . . . . . . $547 $494Segment profit 1 . . . . . . . . . . . . . . . . . . . . . . . . . . . . . . . . . . . . . . . . . . . . . . . . 48 37
1 Segment profit is measured as results before restructuring charges, pension income, interest expense andincome, income taxes, and minority interest income and losses.
Sales for the Specialty Chemicals segment were $547 million in 2008 compared to $494 million in 2007. In2008, improved pricing and product mix in most markets were partially offset by volume declines for carbon-based products due to lower automobile production volumes in North America compared to 2007, and volumedeclines for printing ink resins due to weakness in the publication inks industry.
Profit for the Specialty Chemicals segment was $48 million in 2008 compared to $37 million in 2007. In2008, earnings benefited by $53 million from improved pricing and product mix and $8 million from otherfavorable items compared to 2007. In 2008, earnings were negatively impacted by $28 million from input costinflation and $22 million from unfavorable productivity compared to 2007.
Community Development and Land Management
Years ended December 31,
In millions 2008 2007
Sales 1 . . . . . . . . . . . . . . . . . . . . . . . . . . . . . . . . . . . . . . . . . . . . . . . . . . . . . . . $135 $ 87Segment profit 2 . . . . . . . . . . . . . . . . . . . . . . . . . . . . . . . . . . . . . . . . . . . . . . . . 59 294
1 In 2008, sales of landholdings are included in net sales in the consolidated statements of operations to reflectthe strategic view and structure of the operations of the Community Development and Land Managementsegment established in 2008. For periods prior to 2008, gains from sales of landholdings are included inother income, net in the consolidated statements of operations.
2 Segment profit is measured as results before restructuring charges, pension income, interest expense andincome, income taxes, and minority interest income and losses.
Sales for the Community Development and Land Management segment were $135 million in 2008compared to $87 million in 2007. Profit was $59 million for the year ended December 31, 2008 compared to$294 million for the year ended December 31, 2007. Profit in 2007 includes pre-tax gains of $250 million relatedto sales of non-strategic large-tract forestlands. Profit from real estate activities related to small-tract land saleswas $40 million in 2008 compared to $24 million in 2007. Profit from forestry operations and leasing activitieswas $19 million in 2008 compared to $20 million in 2007. The company sold approximately 21,200 small-tractacres for gross proceeds of $57 million in 2008 compared to approximately 7,900 acres for gross proceeds of $26million in 2007. As the U.S. economy continued to weaken in 2008, the company shifted its marketing focus tosmaller recreational properties primarily located in rural Alabama, Georgia and Virginia.
26
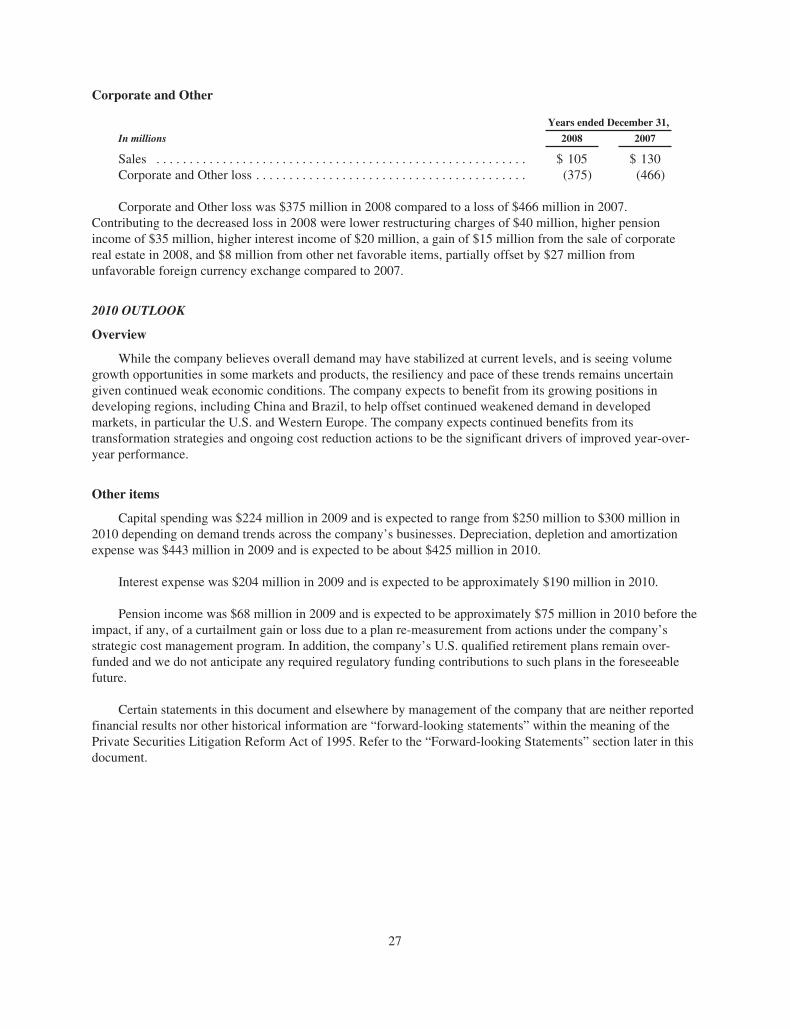
Corporate and Other
Years ended December 31,
In millions 2008 2007
Sales . . . . . . . . . . . . . . . . . . . . . . . . . . . . . . . . . . . . . . . . . . . . . . . . . . . . . . . . $ 105 $ 130Corporate and Other loss . . . . . . . . . . . . . . . . . . . . . . . . . . . . . . . . . . . . . . . . . (375) (466)
Corporate and Other loss was $375 million in 2008 compared to a loss of $466 million in 2007.Contributing to the decreased loss in 2008 were lower restructuring charges of $40 million, higher pensionincome of $35 million, higher interest income of $20 million, a gain of $15 million from the sale of corporatereal estate in 2008, and $8 million from other net favorable items, partially offset by $27 million fromunfavorable foreign currency exchange compared to 2007.
2010 OUTLOOK
Overview
While the company believes overall demand may have stabilized at current levels, and is seeing volumegrowth opportunities in some markets and products, the resiliency and pace of these trends remains uncertaingiven continued weak economic conditions. The company expects to benefit from its growing positions indeveloping regions, including China and Brazil, to help offset continued weakened demand in developedmarkets, in particular the U.S. and Western Europe. The company expects continued benefits from itstransformation strategies and ongoing cost reduction actions to be the significant drivers of improved year-over-year performance.
Other items
Capital spending was $224 million in 2009 and is expected to range from $250 million to $300 million in2010 depending on demand trends across the company’s businesses. Depreciation, depletion and amortizationexpense was $443 million in 2009 and is expected to be about $425 million in 2010.
Interest expense was $204 million in 2009 and is expected to be approximately $190 million in 2010.
Pension income was $68 million in 2009 and is expected to be approximately $75 million in 2010 before theimpact, if any, of a curtailment gain or loss due to a plan re-measurement from actions under the company’sstrategic cost management program. In addition, the company’s U.S. qualified retirement plans remain over-funded and we do not anticipate any required regulatory funding contributions to such plans in the foreseeablefuture.
Certain statements in this document and elsewhere by management of the company that are neither reportedfinancial results nor other historical information are “forward-looking statements” within the meaning of thePrivate Securities Litigation Reform Act of 1995. Refer to the “Forward-looking Statements” section later in thisdocument.
27
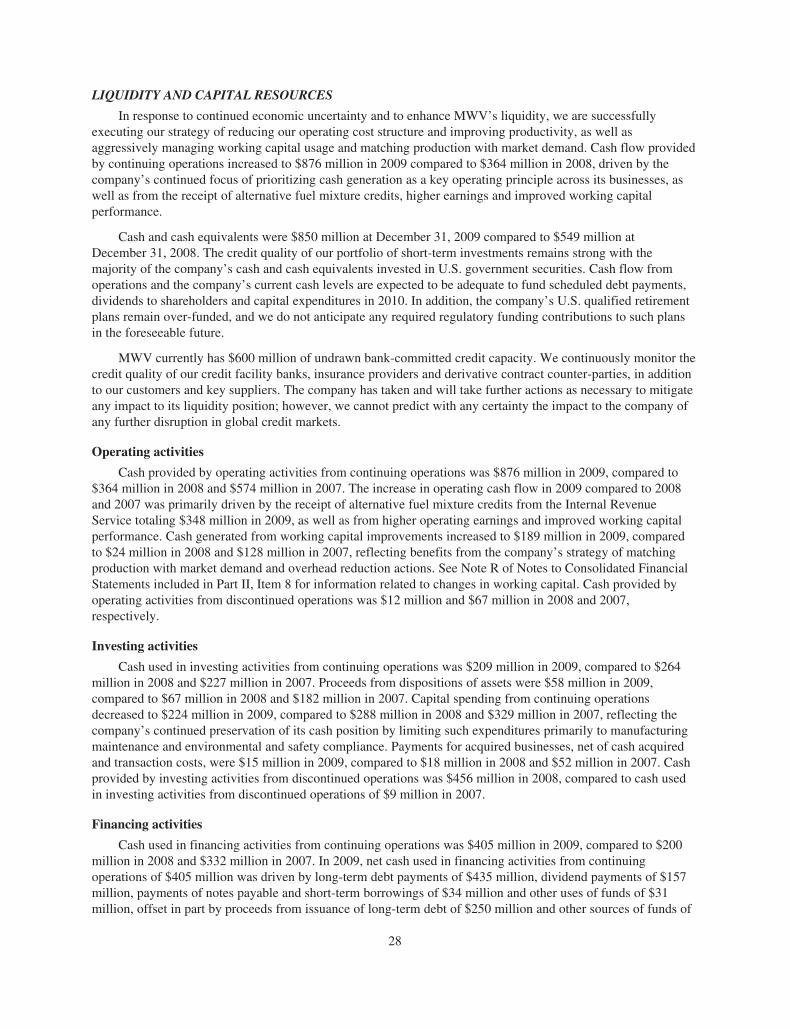
LIQUIDITY AND CAPITAL RESOURCES
In response to continued economic uncertainty and to enhance MWV’s liquidity, we are successfullyexecuting our strategy of reducing our operating cost structure and improving productivity, as well asaggressively managing working capital usage and matching production with market demand. Cash flow providedby continuing operations increased to $876 million in 2009 compared to $364 million in 2008, driven by thecompany’s continued focus of prioritizing cash generation as a key operating principle across its businesses, aswell as from the receipt of alternative fuel mixture credits, higher earnings and improved working capitalperformance.
Cash and cash equivalents were $850 million at December 31, 2009 compared to $549 million atDecember 31, 2008. The credit quality of our portfolio of short-term investments remains strong with themajority of the company’s cash and cash equivalents invested in U.S. government securities. Cash flow fromoperations and the company’s current cash levels are expected to be adequate to fund scheduled debt payments,dividends to shareholders and capital expenditures in 2010. In addition, the company’s U.S. qualified retirementplans remain over-funded, and we do not anticipate any required regulatory funding contributions to such plansin the foreseeable future.
MWV currently has $600 million of undrawn bank-committed credit capacity. We continuously monitor thecredit quality of our credit facility banks, insurance providers and derivative contract counter-parties, in additionto our customers and key suppliers. The company has taken and will take further actions as necessary to mitigateany impact to its liquidity position; however, we cannot predict with any certainty the impact to the company ofany further disruption in global credit markets.
Operating activities
Cash provided by operating activities from continuing operations was $876 million in 2009, compared to$364 million in 2008 and $574 million in 2007. The increase in operating cash flow in 2009 compared to 2008and 2007 was primarily driven by the receipt of alternative fuel mixture credits from the Internal RevenueService totaling $348 million in 2009, as well as from higher operating earnings and improved working capitalperformance. Cash generated from working capital improvements increased to $189 million in 2009, comparedto $24 million in 2008 and $128 million in 2007, reflecting benefits from the company’s strategy of matchingproduction with market demand and overhead reduction actions. See Note R of Notes to Consolidated FinancialStatements included in Part II, Item 8 for information related to changes in working capital. Cash provided byoperating activities from discontinued operations was $12 million and $67 million in 2008 and 2007,respectively.
Investing activities
Cash used in investing activities from continuing operations was $209 million in 2009, compared to $264million in 2008 and $227 million in 2007. Proceeds from dispositions of assets were $58 million in 2009,compared to $67 million in 2008 and $182 million in 2007. Capital spending from continuing operationsdecreased to $224 million in 2009, compared to $288 million in 2008 and $329 million in 2007, reflecting thecompany’s continued preservation of its cash position by limiting such expenditures primarily to manufacturingmaintenance and environmental and safety compliance. Payments for acquired businesses, net of cash acquiredand transaction costs, were $15 million in 2009, compared to $18 million in 2008 and $52 million in 2007. Cashprovided by investing activities from discontinued operations was $456 million in 2008, compared to cash usedin investing activities from discontinued operations of $9 million in 2007.
Financing activities
Cash used in financing activities from continuing operations was $405 million in 2009, compared to $200million in 2008 and $332 million in 2007. In 2009, net cash used in financing activities from continuingoperations of $405 million was driven by long-term debt payments of $435 million, dividend payments of $157million, payments of notes payable and short-term borrowings of $34 million and other uses of funds of $31million, offset in part by proceeds from issuance of long-term debt of $250 million and other sources of funds of
28
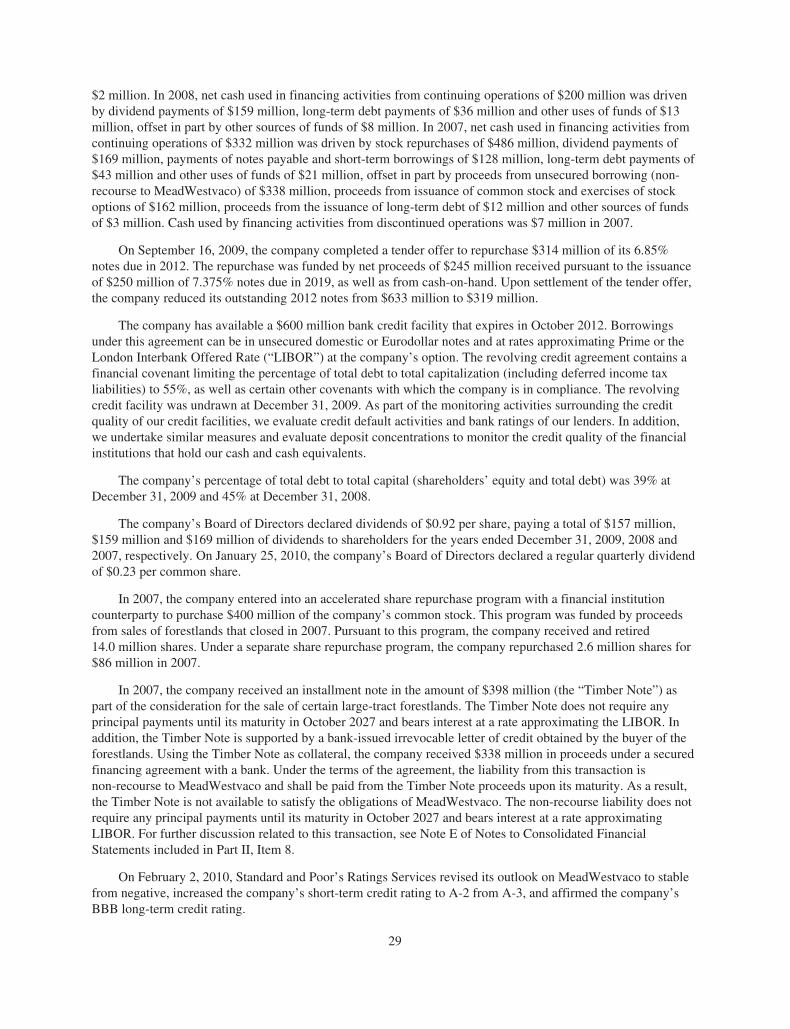
$2 million. In 2008, net cash used in financing activities from continuing operations of $200 million was drivenby dividend payments of $159 million, long-term debt payments of $36 million and other uses of funds of $13million, offset in part by other sources of funds of $8 million. In 2007, net cash used in financing activities fromcontinuing operations of $332 million was driven by stock repurchases of $486 million, dividend payments of$169 million, payments of notes payable and short-term borrowings of $128 million, long-term debt payments of$43 million and other uses of funds of $21 million, offset in part by proceeds from unsecured borrowing (non-recourse to MeadWestvaco) of $338 million, proceeds from issuance of common stock and exercises of stockoptions of $162 million, proceeds from the issuance of long-term debt of $12 million and other sources of fundsof $3 million. Cash used by financing activities from discontinued operations was $7 million in 2007.
On September 16, 2009, the company completed a tender offer to repurchase $314 million of its 6.85%notes due in 2012. The repurchase was funded by net proceeds of $245 million received pursuant to the issuanceof $250 million of 7.375% notes due in 2019, as well as from cash-on-hand. Upon settlement of the tender offer,the company reduced its outstanding 2012 notes from $633 million to $319 million.
The company has available a $600 million bank credit facility that expires in October 2012. Borrowingsunder this agreement can be in unsecured domestic or Eurodollar notes and at rates approximating Prime or theLondon Interbank Offered Rate (“LIBOR”) at the company’s option. The revolving credit agreement contains afinancial covenant limiting the percentage of total debt to total capitalization (including deferred income taxliabilities) to 55%, as well as certain other covenants with which the company is in compliance. The revolvingcredit facility was undrawn at December 31, 2009. As part of the monitoring activities surrounding the creditquality of our credit facilities, we evaluate credit default activities and bank ratings of our lenders. In addition,we undertake similar measures and evaluate deposit concentrations to monitor the credit quality of the financialinstitutions that hold our cash and cash equivalents.
The company’s percentage of total debt to total capital (shareholders’ equity and total debt) was 39% atDecember 31, 2009 and 45% at December 31, 2008.
The company’s Board of Directors declared dividends of $0.92 per share, paying a total of $157 million,$159 million and $169 million of dividends to shareholders for the years ended December 31, 2009, 2008 and2007, respectively. On January 25, 2010, the company’s Board of Directors declared a regular quarterly dividendof $0.23 per common share.
In 2007, the company entered into an accelerated share repurchase program with a financial institutioncounterparty to purchase $400 million of the company’s common stock. This program was funded by proceedsfrom sales of forestlands that closed in 2007. Pursuant to this program, the company received and retired14.0 million shares. Under a separate share repurchase program, the company repurchased 2.6 million shares for$86 million in 2007.
In 2007, the company received an installment note in the amount of $398 million (the “Timber Note”) aspart of the consideration for the sale of certain large-tract forestlands. The Timber Note does not require anyprincipal payments until its maturity in October 2027 and bears interest at a rate approximating the LIBOR. Inaddition, the Timber Note is supported by a bank-issued irrevocable letter of credit obtained by the buyer of theforestlands. Using the Timber Note as collateral, the company received $338 million in proceeds under a securedfinancing agreement with a bank. Under the terms of the agreement, the liability from this transaction isnon-recourse to MeadWestvaco and shall be paid from the Timber Note proceeds upon its maturity. As a result,the Timber Note is not available to satisfy the obligations of MeadWestvaco. The non-recourse liability does notrequire any principal payments until its maturity in October 2027 and bears interest at a rate approximatingLIBOR. For further discussion related to this transaction, see Note E of Notes to Consolidated FinancialStatements included in Part II, Item 8.
On February 2, 2010, Standard and Poor’s Ratings Services revised its outlook on MeadWestvaco to stablefrom negative, increased the company’s short-term credit rating to A-2 from A-3, and affirmed the company’sBBB long-term credit rating.
29
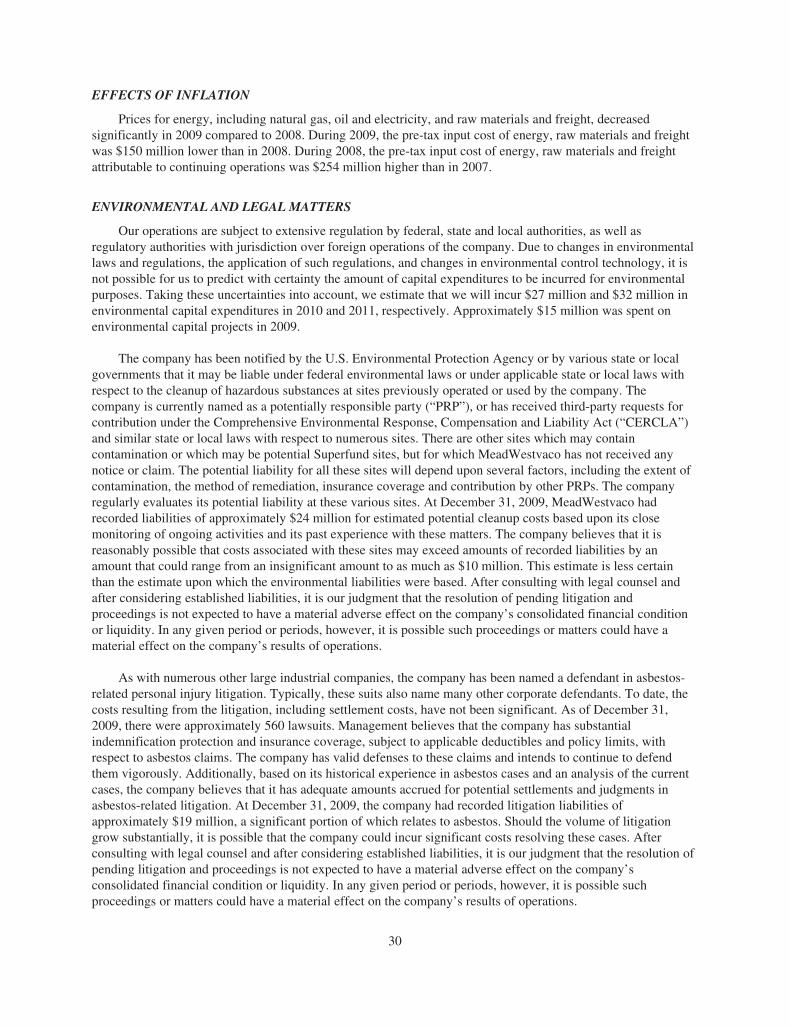
EFFECTS OF INFLATION
Prices for energy, including natural gas, oil and electricity, and raw materials and freight, decreasedsignificantly in 2009 compared to 2008. During 2009, the pre-tax input cost of energy, raw materials and freightwas $150 million lower than in 2008. During 2008, the pre-tax input cost of energy, raw materials and freightattributable to continuing operations was $254 million higher than in 2007.
ENVIRONMENTAL AND LEGAL MATTERS
Our operations are subject to extensive regulation by federal, state and local authorities, as well asregulatory authorities with jurisdiction over foreign operations of the company. Due to changes in environmentallaws and regulations, the application of such regulations, and changes in environmental control technology, it isnot possible for us to predict with certainty the amount of capital expenditures to be incurred for environmentalpurposes. Taking these uncertainties into account, we estimate that we will incur $27 million and $32 million inenvironmental capital expenditures in 2010 and 2011, respectively. Approximately $15 million was spent onenvironmental capital projects in 2009.
The company has been notified by the U.S. Environmental Protection Agency or by various state or localgovernments that it may be liable under federal environmental laws or under applicable state or local laws withrespect to the cleanup of hazardous substances at sites previously operated or used by the company. Thecompany is currently named as a potentially responsible party (“PRP”), or has received third-party requests forcontribution under the Comprehensive Environmental Response, Compensation and Liability Act (“CERCLA”)and similar state or local laws with respect to numerous sites. There are other sites which may containcontamination or which may be potential Superfund sites, but for which MeadWestvaco has not received anynotice or claim. The potential liability for all these sites will depend upon several factors, including the extent ofcontamination, the method of remediation, insurance coverage and contribution by other PRPs. The companyregularly evaluates its potential liability at these various sites. At December 31, 2009, MeadWestvaco hadrecorded liabilities of approximately $24 million for estimated potential cleanup costs based upon its closemonitoring of ongoing activities and its past experience with these matters. The company believes that it isreasonably possible that costs associated with these sites may exceed amounts of recorded liabilities by anamount that could range from an insignificant amount to as much as $10 million. This estimate is less certainthan the estimate upon which the environmental liabilities were based. After consulting with legal counsel andafter considering established liabilities, it is our judgment that the resolution of pending litigation andproceedings is not expected to have a material adverse effect on the company’s consolidated financial conditionor liquidity. In any given period or periods, however, it is possible such proceedings or matters could have amaterial effect on the company’s results of operations.
As with numerous other large industrial companies, the company has been named a defendant in asbestos-related personal injury litigation. Typically, these suits also name many other corporate defendants. To date, thecosts resulting from the litigation, including settlement costs, have not been significant. As of December 31,2009, there were approximately 560 lawsuits. Management believes that the company has substantialindemnification protection and insurance coverage, subject to applicable deductibles and policy limits, withrespect to asbestos claims. The company has valid defenses to these claims and intends to continue to defendthem vigorously. Additionally, based on its historical experience in asbestos cases and an analysis of the currentcases, the company believes that it has adequate amounts accrued for potential settlements and judgments inasbestos-related litigation. At December 31, 2009, the company had recorded litigation liabilities ofapproximately $19 million, a significant portion of which relates to asbestos. Should the volume of litigationgrow substantially, it is possible that the company could incur significant costs resolving these cases. Afterconsulting with legal counsel and after considering established liabilities, it is our judgment that the resolution ofpending litigation and proceedings is not expected to have a material adverse effect on the company’sconsolidated financial condition or liquidity. In any given period or periods, however, it is possible suchproceedings or matters could have a material effect on the company’s results of operations.
30
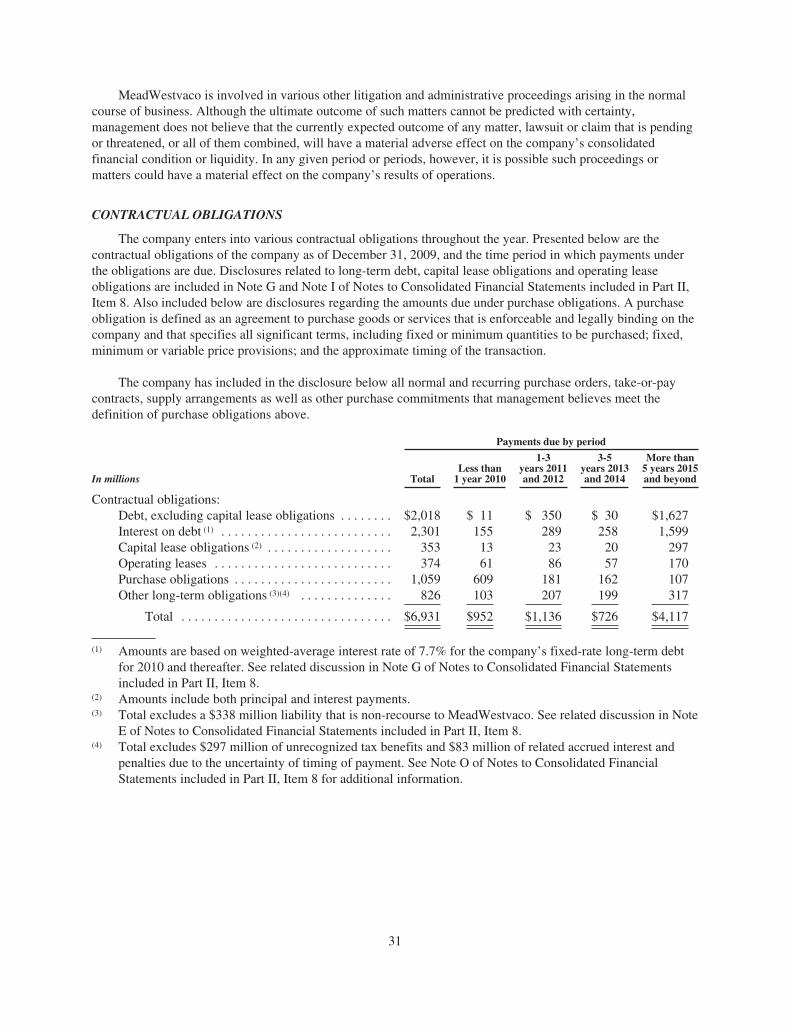
MeadWestvaco is involved in various other litigation and administrative proceedings arising in the normalcourse of business. Although the ultimate outcome of such matters cannot be predicted with certainty,management does not believe that the currently expected outcome of any matter, lawsuit or claim that is pendingor threatened, or all of them combined, will have a material adverse effect on the company’s consolidatedfinancial condition or liquidity. In any given period or periods, however, it is possible such proceedings ormatters could have a material effect on the company’s results of operations.
CONTRACTUAL OBLIGATIONS
The company enters into various contractual obligations throughout the year. Presented below are thecontractual obligations of the company as of December 31, 2009, and the time period in which payments underthe obligations are due. Disclosures related to long-term debt, capital lease obligations and operating leaseobligations are included in Note G and Note I of Notes to Consolidated Financial Statements included in Part II,Item 8. Also included below are disclosures regarding the amounts due under purchase obligations. A purchaseobligation is defined as an agreement to purchase goods or services that is enforceable and legally binding on thecompany and that specifies all significant terms, including fixed or minimum quantities to be purchased; fixed,minimum or variable price provisions; and the approximate timing of the transaction.
The company has included in the disclosure below all normal and recurring purchase orders, take-or-paycontracts, supply arrangements as well as other purchase commitments that management believes meet thedefinition of purchase obligations above.
Payments due by period
In millions TotalLess than1 year 2010
1-3years 2011and 2012
3-5years 2013and 2014
More than5 years 2015and beyond
Contractual obligations:Debt, excluding capital lease obligations . . . . . . . . $2,018 $ 11 $ 350 $ 30 $1,627Interest on debt (1) . . . . . . . . . . . . . . . . . . . . . . . . . . 2,301 155 289 258 1,599Capital lease obligations (2) . . . . . . . . . . . . . . . . . . . 353 13 23 20 297Operating leases . . . . . . . . . . . . . . . . . . . . . . . . . . . 374 61 86 57 170Purchase obligations . . . . . . . . . . . . . . . . . . . . . . . . 1,059 609 181 162 107Other long-term obligations (3)(4) . . . . . . . . . . . . . . 826 103 207 199 317
Total . . . . . . . . . . . . . . . . . . . . . . . . . . . . . . . . $6,931 $952 $1,136 $726 $4,117
(1) Amounts are based on weighted-average interest rate of 7.7% for the company’s fixed-rate long-term debtfor 2010 and thereafter. See related discussion in Note G of Notes to Consolidated Financial Statementsincluded in Part II, Item 8.
(2) Amounts include both principal and interest payments.(3) Total excludes a $338 million liability that is non-recourse to MeadWestvaco. See related discussion in Note
E of Notes to Consolidated Financial Statements included in Part II, Item 8.(4) Total excludes $297 million of unrecognized tax benefits and $83 million of related accrued interest and
penalties due to the uncertainty of timing of payment. See Note O of Notes to Consolidated FinancialStatements included in Part II, Item 8 for additional information.
31
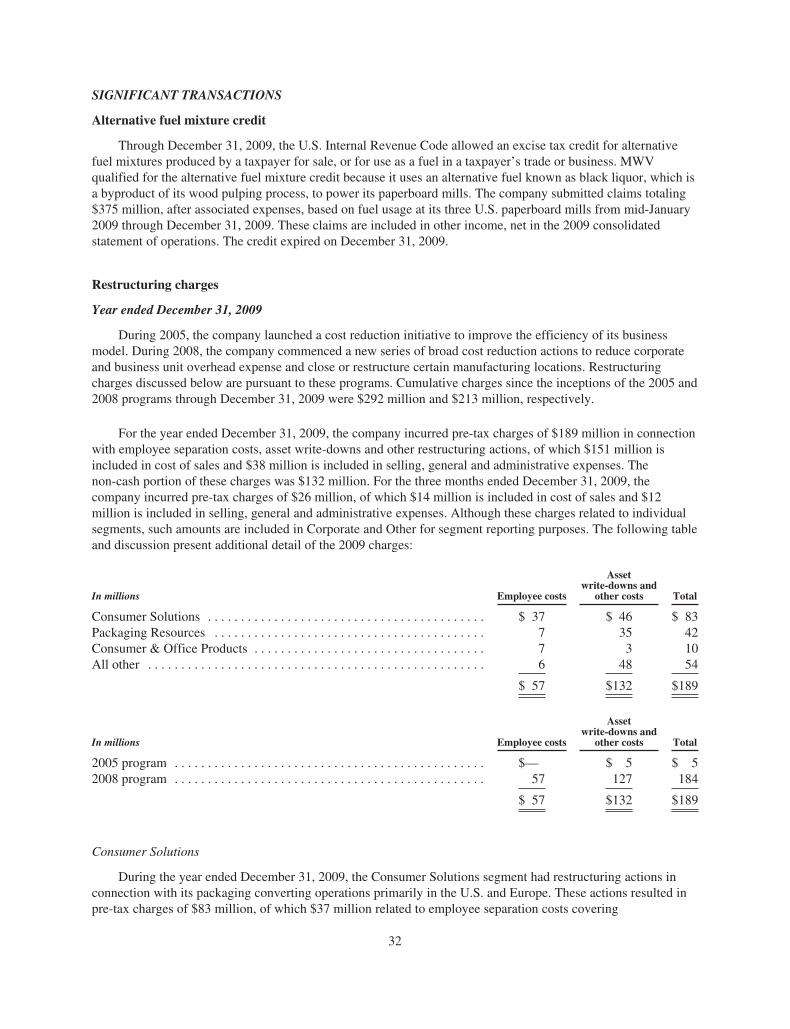
SIGNIFICANT TRANSACTIONS
Alternative fuel mixture credit
Through December 31, 2009, the U.S. Internal Revenue Code allowed an excise tax credit for alternativefuel mixtures produced by a taxpayer for sale, or for use as a fuel in a taxpayer’s trade or business. MWVqualified for the alternative fuel mixture credit because it uses an alternative fuel known as black liquor, which isa byproduct of its wood pulping process, to power its paperboard mills. The company submitted claims totaling$375 million, after associated expenses, based on fuel usage at its three U.S. paperboard mills from mid-January2009 through December 31, 2009. These claims are included in other income, net in the 2009 consolidatedstatement of operations. The credit expired on December 31, 2009.
Restructuring charges
Year ended December 31, 2009
During 2005, the company launched a cost reduction initiative to improve the efficiency of its businessmodel. During 2008, the company commenced a new series of broad cost reduction actions to reduce corporateand business unit overhead expense and close or restructure certain manufacturing locations. Restructuringcharges discussed below are pursuant to these programs. Cumulative charges since the inceptions of the 2005 and2008 programs through December 31, 2009 were $292 million and $213 million, respectively.
For the year ended December 31, 2009, the company incurred pre-tax charges of $189 million in connectionwith employee separation costs, asset write-downs and other restructuring actions, of which $151 million isincluded in cost of sales and $38 million is included in selling, general and administrative expenses. Thenon-cash portion of these charges was $132 million. For the three months ended December 31, 2009, thecompany incurred pre-tax charges of $26 million, of which $14 million is included in cost of sales and $12million is included in selling, general and administrative expenses. Although these charges related to individualsegments, such amounts are included in Corporate and Other for segment reporting purposes. The following tableand discussion present additional detail of the 2009 charges:
In millions Employee costs
Assetwrite-downs and
other costs Total
Consumer Solutions . . . . . . . . . . . . . . . . . . . . . . . . . . . . . . . . . . . . . . . . . . $ 37 $ 46 $ 83Packaging Resources . . . . . . . . . . . . . . . . . . . . . . . . . . . . . . . . . . . . . . . . . 7 35 42Consumer & Office Products . . . . . . . . . . . . . . . . . . . . . . . . . . . . . . . . . . . 7 3 10All other . . . . . . . . . . . . . . . . . . . . . . . . . . . . . . . . . . . . . . . . . . . . . . . . . . . 6 48 54
$ 57 $132 $189
In millions Employee costs
Assetwrite-downs and
other costs Total
2005 program . . . . . . . . . . . . . . . . . . . . . . . . . . . . . . . . . . . . . . . . . . . . . . . $— $ 5 $ 52008 program . . . . . . . . . . . . . . . . . . . . . . . . . . . . . . . . . . . . . . . . . . . . . . . 57 127 184
$ 57 $132 $189
Consumer Solutions
During the year ended December 31, 2009, the Consumer Solutions segment had restructuring actions inconnection with its packaging converting operations primarily in the U.S. and Europe. These actions resulted inpre-tax charges of $83 million, of which $37 million related to employee separation costs covering
32
approximately 840 employees and $46 million related to asset write-downs and other restructuring actionsincluding the closure or restructure of 11 manufacturing facilities. The affected employees will be separated fromthe company by mid-2010.
Packaging Resources
During the year ended December 31, 2009, the Packaging Resources segment had restructuring actions in itsmanufacturing operations primarily in the U.S. and South America. These actions resulted in pre-tax charges of$42 million, of which $7 million related to employee separation costs covering approximately 150 employeesand $35 million related to asset write-downs and other actions primarily associated with the permanent shutdownof a paperboard machine at the segment’s Evadale, Texas mill. The affected employees will be separated fromthe company by mid-2010.
Consumer & Office Products
During the year ended December 31, 2009, the Consumer & Office Products segment had restructuringactions in connection with its operations in the U.S. These actions resulted in pre-tax charges of $10 million, ofwhich $7 million related to employee separation costs covering approximately 330 employees and $3 millionrelated to asset write-downs and other restructuring actions. The affected employees will be separated from thecompany by mid-2010.
All other
During the year ended December 31, 2009, the company incurred additional charges of $54 million. Thesecharges include employee separation costs of $6 million related to approximately 180 employees. The affectedemployees will separate from the company by mid-2010. The remaining $48 million was related to asset write-downs and other restructuring actions primarily in connection with the disposition of the company’s specialtypapers operation.
Year ended December 31, 2008
For the year ended December 31, 2008, the company incurred pre-tax charges of $69, of which $41 million,$26 million and $2 million is included in cost of sales, selling, general and administrative expenses, and otherincome, net, respectively. Of these charges, $44 million related to the Consumer Solutions segment, $8 millionrelated to the Consumer & Office Products segment, $4 million related to the Packaging Resources segment, $4million related to the Specialty Chemicals segment, and $9 million was attributed to Corporate and Other. Thenon-cash portion of these charges was $43 million. These charges related to various restructuring actions,including asset write-downs and employee separation costs covering approximately 1,885 employees. As ofDecember 31, 2009, all employee separation costs were paid.
Year ended December 31, 2007
For the year ended December 31, 2007, the company incurred pre-tax charges of $85 million, of which $57million, $24 million and $4 million is included in cost of sales, selling, general and administrative expenses, andother income, net, respectively. Of these charges, $23 million related to the Consumer Solutions segment, $5million related to the Consumer & Office Products segment, $2 million related to the Packaging Resourcessegment, and $55 million was attributed to Corporate and Other. The non-cash portion of these charges was $67million. These charges related to various restructuring actions, including asset write-downs and employeeseparation costs covering approximately 240 employees. As of December 31, 2008, all employee separation costswere paid. Charges attributed to Corporate and Other include $42 million in connection with asset write-downsand facility closure costs in connection with the company’s specialty papers division.
33
CRITICAL ACCOUNTING POLICIES
Our principal accounting policies are described in the Summary of Significant Accounting Policies in theNotes to Consolidated Financial Statements included in Part II, Item 8. The preparation of financial statements inaccordance with GAAP requires management to make estimates and assumptions that affect the reportedamounts of some assets and liabilities and, in some instances, the reported amounts of revenues and expensesduring the reporting period. Actual results could differ from these estimates. Management believes theaccounting policies discussed below represent those accounting policies requiring the exercise of judgmentwhere a different set of judgments could result in the greatest changes to reported results. Management hasdiscussed the development and selection of the critical accounting estimates with the Audit Committee of theBoard of Directors, and the Audit Committee has reviewed the company’s disclosure.
Environmental and legal liabilities: We record accruals for estimated environmental liabilities whenremedial efforts are probable and the costs can be reasonably estimated. These estimates reflect assumptions andjudgments as to the probable nature, magnitude and timing of required investigation, remediation and monitoringactivities, as well as availability of insurance coverage and contribution by other potentially responsible parties.Due to the numerous uncertainties and variables associated with these assumptions and judgments, and changesin governmental regulations and environmental technologies, accruals are subject to substantial uncertainties, andactual costs could be materially greater or less than the estimated amounts. We record accruals for other legalcontingencies, which are also subject to numerous uncertainties and variables associated with assumptions andjudgments, when the loss is probable and reasonably estimable. Liabilities recorded for claims are limited topending cases based on the company’s historical experience, consultation with outside counsel and consultationwith an actuarial specialist concerning the feasibility of reasonably estimating liabilities associated with claimsthat may arise in the future. We recognize insurance recoveries when collection is reasonably assured.
Restructuring and other charges: We periodically record charges for the reduction of our workforce, theclosure of manufacturing facilities and other actions related to business improvement and productivity initiatives.These events require estimates of liabilities for employee separation payments and related benefits, demolition,facility closures and other costs, which could differ from actual costs incurred.
Pension and postretirement benefits: Assumptions used in the determination of net pension cost andpostretirement benefit expense, including the discount rate, the expected return on plan assets, and increases infuture compensation and medical costs, are evaluated by the company, reviewed with the plan actuaries annuallyand updated as appropriate. Actual asset returns and compensation and medical costs, which are more favorablethan assumptions, can have the effect of lowering expense and cash contributions, and, conversely, actual results,which are less favorable than assumptions, could increase expense and cash contributions. In accordance withgenerally accepted accounting principles, actual results that differ from assumptions are accumulated andamortized over future periods and, therefore, affect expense in such future periods.
In 2009, the company recorded pre-tax pension income from continuing operations of $68 million,compared to $93 million in 2008 and $58 million in 2007. The company currently estimates pre-tax pensionincome in 2010 to be approximately $75 million. This estimate assumes a long-term rate of return on plan assetsof 8.0%, and a discount rate of 5.74%. The company determined the discount rate by referencing the CitigroupPension Discount Curve. The company believes that using a yield curve approach more accurately reflectschanges in the present value of liabilities over time since each cash flow is discounted at the rate at which itcould effectively be settled.
If the expected rate of return on plan assets were to change by 0.5%, annual pension income in 2010 wouldchange by approximately $17 million. Similarly, if the discount rate were to change by 0.5%, annual pensionincome in 2010 would change by approximately $9 million.
34
At December 31, 2009, the aggregate value of pension fund assets had increased to $3.5 billion from $3.1billion at December 31, 2008, reflecting overall favorable equity and fixed income market performance during2009. For further details regarding pension fund assets, see Note L of Notes to Consolidated Financial Statementsincluded in Part II, Item 8.
Prior service cost and actuarial gains and losses in the retirement and postretirement benefit plans subject toamortization are amortized over the average remaining service periods, which are about 9 years and 5 years,respectively, and are a component of accumulated other comprehensive income.
Long-lived assets useful lives: Useful lives of tangible and intangible assets are based on management’sestimates of the periods over which the assets will be productively utilized in the revenue-generation process orfor other useful purposes. Factors that affect the determination of lives include prior experience with similarassets, product life expectations and industry practices. The determination of useful lives dictates the period overwhich tangible and intangible long-lived assets are depreciated or amortized, typically using the straight-linemethod.
Impairment of long-lived assets: We review long-lived assets for impairment whenever events or changes incircumstances indicate that the carrying amount of an asset may not be recoverable. If such circumstances aredetermined to exist, an estimate of undiscounted future cash flows produced by the long-lived asset, or theappropriate grouping of assets, is compared to carrying value to determine whether impairment exists. For anasset that is determined to be impaired, the loss is measured based on quoted market prices in active markets, ifavailable. If quoted market prices are not available, the estimate of fair value is based on various valuationtechniques, including a discounted value of estimated future cash flows. Considerable judgment must beexercised as to determining future cash flows and their timing and, possibly, choosing business valuecomparables or selecting discount rates to use in any value computations.
Intangible assets: Business acquisitions often result in recording intangible assets. Intangible assets arerecognized at the time of an acquisition, based upon their fair value. Similar to long-lived tangible assets,intangible assets with finite lives are subject to periodic impairment reviews whenever events or changes incircumstances indicate that the carrying amount of an asset may not be recoverable. As with tangible assets,considerable judgment must be exercised. Periodic impairment reviews of intangible assets assigned an indefinitelife are required, at least annually, as well as when events or circumstances change. As with our review ofimpairment of tangible assets and goodwill, we employ significant assumptions in assessing our indefinite-livedintangible assets for impairment (primarily Calmar trademarks and trade names). An income approach (the relieffrom royalty method) is used to determine the fair values of our indefinite-lived intangible assets. Although ourestimate of fair values of the company’s indefinite-lived intangible assets under the income approach exceed therespective carrying values, different assumptions regarding projected performance and other factors could resultin significant non-cash impairment charges in the future. Based on our annual review of our indefinite-livedintangible assets in the fourth quarter of 2009, there was no indication of impairment.
Goodwill: Goodwill represents the excess of cost of an acquired business over the fair value of theidentifiable tangible and intangible assets acquired and liabilities assumed in a business combination. As withtangible and other intangible assets, periodic impairment reviews are required, at least annually, as well as whenevents or circumstances change. We review the recorded value of our goodwill annually on October 1 or sooner,if events or changes in circumstances indicate that the carrying amount may exceed fair value. As with ourreview of impairment of tangible and intangible assets, we employ significant assumptions in assessing goodwillfor impairment. These assumptions include relevant considerations of market-participant data. An incomeapproach is generally used to determine the fair values of our reporting units.
In applying the income approach in assessing goodwill for impairment, changes in assumptions couldmaterially affect the determination of fair value for a reporting unit. Although our fair value estimates of the
35
company’s reporting units under the income approach exceed the respective carrying values, differentassumptions regarding projected performance and other factors could result in significant non-cash impairmentcharges in the future. The following assumptions are key to our income approach:
• Business projections—Projections are based on three-year forecasts that are developed internally bymanagement and reviewed by the company’s Board of Directors. These projections include significantassumptions such as estimates of future revenues, profits, working capital requirements, operatingplans, costs of planned restructuring actions and capital expenditures. Assumptions surrounding macro-economic data and estimates include industry projections, inflation, foreign currency exchange ratesand costs of energy, raw materials and freight.
• Growth rates—A growth rate based on market participant data considerations is used to calculate theterminal value of a reporting unit. The growth rate is the expected rate at which a reporting unit’searnings stream is projected to grow beyond the three-year forecast period.
• Discount rates—Future cash flows are discounted at a rate that is consistent with a weighted averagecost of capital for a potential market participant. The weighted average cost of capital is an estimate ofthe overall after-tax rate of return required by equity and debt holders of a business enterprise. Thediscount rates selected for the reporting units are based on existing conditions within the respectivemarkets and reflect appropriate adjustments for potential risk premiums in those markets as well asappropriate weighting of the market cost of equity versus debt, which is developed with the assistanceof external financial advisors.
• Tax rates—Tax rates are based on estimates of the tax rates that a market participant would realize inthe respective primary markets and geographic areas in which the reporting units operate.
Based on our annual review of the recorded value of goodwill during the fourth quarter of 2009, there wasno indication of impairment. However, changes to any of the above assumptions could lead to impairment ofgoodwill in the future. See Note D and Note Q of Notes to Consolidated Financial Statements included in Part II,Item 8 for further information.
Revenue recognition: We recognize revenue at the point when title and the risk of ownership passes to thecustomer. Substantially all of our revenues are generated through product sales, and shipping terms generallyindicate when title and the risk of ownership have passed. Revenue is recognized at shipment for sales whenshipping terms are FOB (free on board) shipping point unless risk of loss is maintained under freight terms. Forsales where shipping terms are FOB destination, revenue is recognized when the goods are received by thecustomer. We provide for all allowances for estimated returns and other customer credits such as discounts andvolume rebates, when the revenue is recognized, based on historical experience, current trends and anynotification of pending returns. The customer allowances are, in many instances, subjective and are determinedwith significant management judgment and are reviewed regularly to determine the adequacy of the amounts.Changes in economic conditions, markets and customer relationships may require adjustments to theseallowances from period to period. Also included in net sales is service revenue which is recognized as the serviceis performed. Revenue is recognized for leased equipment to customers on a straight-line basis over the estimatedterm of the lease and is included in net sales of the company. In 2009 and 2008, sales of landholdings areincluded in net sales in the consolidated statements of operations to reflect the strategic view and structure of theoperations of the Community Development and Land Management segment established in 2008. For periodsprior to 2008, gains from sales of landholdings are included in other income, net in the consolidated statements ofoperations.
Income taxes: Income taxes are accounted for in accordance with the guidelines provided by the FinancialAccounting Standards Board, which recognizes deferred tax assets and liabilities based on the estimated futuretax effects of differences between the financial statement and tax basis of assets and liabilities given the enactedtax laws.
36
We evaluate the need for a deferred tax asset valuation allowance by assessing whether it is more likely thannot that the company will realize its deferred tax assets in the future. The assessment of whether or not avaluation allowance is required often requires significant judgment, including the forecast of future taxableincome and the valuation of tax planning initiatives. Adjustments to the deferred tax valuation allowance aremade to earnings in the period when such assessment is made.
The company has tax jurisdictions located in many areas of the world and is subject to audit in thesejurisdictions. Tax audits by their nature are often complex and can require several years to resolve. In thepreparation of the company’s financial statements, management exercises judgments in estimating the potentialexposure to unresolved tax matters. The company recognizes the tax benefit from an uncertain tax position if it ismore likely than not that the position is sustainable. For those tax positions that meet the more likely than notcriteria, the company records only the portion of the tax benefit that is greater than 50% likely to be realizedupon settlement with the respective taxing authority. Interest and penalties related to unrecognized tax benefitsare recorded within income tax expense in the consolidated statements of operations. While actual results couldvary, in management’s judgment, the company has adequate tax accruals with respect to the ultimate outcome ofsuch unresolved tax matters.
Each quarter, management must estimate our effective tax rate for the full year. This estimate includesassumptions about the level of income that will be achieved for the full year in both our domestic andinternational operations. The forecast of full-year earnings includes assumptions about markets in each of ourbusinesses as well as the timing of certain transactions, including forestland sales gains and restructuring charges.Should business performance or the timing of certain transactions change during the year, the level of incomeachieved may not meet the level of income estimated earlier in the year at interim periods. This change in theincome levels and mix of earnings can result in significant adjustments to the tax provision in the quarter inwhich the estimate is refined.
NEW ACCOUNTING GUIDANCE
During 2009, the company has or will adopt the below new accounting guidance as promulgated by theFinancial Accounting Standards Board.
Fair value measurements
The company adopted a new framework for measuring fair value and has provided additional disclosuresabout fair value measurements. As permitted by transition rules, the new framework for measuring fair value andthe related disclosures were adopted for all financial assets and liabilities as of January 1, 2008, and for allnon-financial assets and liabilities as of January 1, 2009. Furthermore, on June 30, 2009, the company adoptednew accounting guidance that requires disclosures about the fair value of financial instruments for interimreporting periods in addition to the existing requirement for annual financial statements. In addition, onJanuary 1, 2010, the company will adopt new accounting guidance that requires additional disclosures regardingthe different classes of assets and liabilities measured at fair value, the valuation techniques employed, theactivity in Level 3 fair value measurements, and the transfers between the levels of fair value measurements. SeeNote A of Notes to Consolidated Financial Statements included in Part II, Item 8 for disclosures of fair valuemeasurements.
Disclosures about defined benefit plan assets
On January 1, 2009, the company adopted new annual disclosure requirements regarding the plan assets ofits defined benefit pension plans. The new disclosures are effective for years ending after December 15, 2009,and will provide users of the company’s consolidated financial statements with an understanding of howinvestment allocation decisions are made, including factors that are pertinent to an understanding of investmentpolicies and strategies, major categories of plan assets, inputs and valuation techniques used to measure fair valueof plan assets, effect of fair value measurements using significant unobservable inputs on changes in plan assets
37
for the period, and significant concentrations of risk within plan assets. See Note A and Note L of Notes toConsolidated Financial Statements included in Part II, Item 8 for disclosures about defined benefit plan assets.
Accounting for business combinations
On January 1, 2009, the company adopted, as required, a revised accounting model for businesscombinations. Under the revised guidance, an acquirer is required to recognize the assets acquired, liabilitiesassumed, including those arising from contractual contingencies, any contingent consideration, and anynon-controlling interest in the acquiree at the acquisition date, measured at their fair values as of that date. Inaddition, the acquirer in a business combination achieved in stages (sometimes referred to as a step acquisition) isrequired to recognize the identifiable assets and liabilities, as well as the non-controlling interest in the acquiree,at the full amounts of their fair values. The requirement to measure the non-controlling interest in the acquiree atfair value will result in recognizing the goodwill attributable to the non-controlling interest in addition to thatattributable to the acquirer. The company has applied the revised accounting model prospectively to businesscombinations for which the acquisition date was on or after January 1, 2009. The impact of adoption did not havea material effect on the company’s consolidated financial statements as of and for the year ended December 31,2009.
Accounting for non-controlling interests
On January 1, 2009, the company adopted new accounting guidance regarding the non-controlling interestin a subsidiary and for the deconsolidation of a subsidiary. The new guidance clarified that a non-controllinginterest in a subsidiary is an ownership interest in the consolidated entity that should be reported as equity in theconsolidated financial statements. The guidance also changed the way the consolidated statement of operations ispresented by requiring consolidated net income to include the amounts, if material, attributable to both the parentand the non-controlling interest, and requires disclosure on the face of the consolidated statement of operations ofthe amount of consolidated net income attributable to the parent and to the non-controlling interest. The impactof adoption did not have a material effect on the company’s consolidated financial statements as of and for theyear ended December 31, 2009.
Disclosures about derivative instruments and hedging activities
On January 1, 2009, the company adopted new accounting guidance that expanded the disclosurerequirements for derivative instruments and hedging activities. Entities are required to provide enhanceddisclosures about (i) how and why an entity uses derivative instruments, (ii) how an entity accounts for derivativeinstruments and related hedged items, and (iii) how derivative instruments and related hedged items affect anentity’s financial position, financial performance and cash flows. See Note H of Notes to Consolidated FinancialStatements included in Part II, Item 8 for disclosures of derivative instruments and hedging activities.
Accounting for and disclosures of subsequent events
On June 30, 2009, the company adopted new accounting guidance that established general standards ofaccounting for and disclosures of events that occur after the balance sheet date but before the financial statementsare issued or are available to be issued. The new guidance sets forth the period after the balance sheet date duringwhich management of a reporting entity should evaluate events or transactions that may occur for potentialrecognition or disclosure in the financial statements, the circumstances under which an entity should recognizeevents or transactions occurring after the balance sheet date, and the disclosures that an entity should make aboutevents or transactions that occurred after the balance sheet date. The impact of adoption did not have a materialeffect on the company’s consolidated financial statements as of and for the year ended December 31, 2009. Thecompany has considered events or transactions occurring subsequent to the consolidated balance sheet datethrough February 23, 2010 (issuance date of these consolidated financial statements) for potential recognition ordisclosure in the company’s consolidated financial statements.
38
Accounting for variable interest entities
On January 1, 2010 the company will adopt new accounting guidance related to the accounting anddisclosure for variable interest entities. The new guidance provides an improved framework for identifying whichenterprise has a controlling financial interest in a variable interest entity and requires additional disclosures of anenterprise’s involvement with variable interest entities.
There were no other accounting standards issued in 2009 that had or are expected to have a material impacton the company’s financial position or results of operations.
Forward-looking Statements
Certain statements in this document and elsewhere by management of the company that are neither reportedfinancial results nor other historical information are “forward-looking statements” within the meaning of thePrivate Securities Litigation Reform Act of 1995. Such information includes, without limitation, the businessoutlook, assessment of market conditions, anticipated financial and operating results, strategies, future plans,contingencies and contemplated transactions of the company. Such forward-looking statements are notguarantees of future performance and are subject to known and unknown risks, uncertainties and other factorswhich may cause or contribute to actual results of company operations, or the performance or achievements ofeach company, or industry results, to differ materially from those expressed or implied by the forward-lookingstatements. In addition to any such risks, uncertainties and other factors discussed elsewhere herein, risks,uncertainties, and other factors that could cause or contribute to actual results differing materially from thoseexpressed or implied for the forward-looking statements include, but are not limited to, events or circumstanceswhich affect the ability of MeadWestvaco to realize improvements in operating earnings from the company’songoing cost reduction initiatives; the ability of MeadWestvaco to close announced and pending transactions,including divestitures; the reorganization of the company’s packaging business units; competitive pricing for thecompany’s products; impact from inflation on raw materials, energy and other costs; fluctuations in demand andchanges in production capacities; relative growth or decline in the United States and international economies;government policies and regulations, including, but not limited to those affecting the environment, climatechange, tax policies and the tobacco industry; the company’s continued ability to reach agreement with itsunionized employees on collective bargaining agreements; the company’s ability to execute its plans to divest orotherwise realize the greater value associated with its land holdings; adverse results in current or future litigation;currency movements; volatility and further deterioration of the capital markets; and other risk factors discussedin this Annual Report on Form 10-K and in other filings made from time to time with the SEC. MeadWestvacoundertakes no obligation to publicly update any forward-looking statement, whether as a result of newinformation, future events or otherwise. Investors are advised, however, to consult any further disclosures madeon related subjects in the company’s reports filed with the SEC.
39
Item 7A. Quantitative and qualitative disclosures about market risk
Interest rates
The company has developed a targeted mix of fixed- and variable-rate debt as part of an overall strategy tomaintain an appropriate level of exposure to interest-rate fluctuations. To efficiently manage this mix, thecompany utilizes interest-rate swap agreements. The total notional amount of interest-rate swap instruments was$250 million at December 31, 2009. There were no outstanding interest-rate swaps at December 31, 2008. SeeNote H of Notes to Consolidated Financial Statements included in Part II, Item 8 for related discussion.
Foreign currency
The company has foreign-based operations, primarily in South America, Canada, Mexico, Europe and Asia,which accounted for approximately 33% of its 2009 net sales. In addition, certain of the company’s domesticoperations have sales to foreign customers. In the conduct of its foreign operations, the company also makesinter-company sales and receives royalties and dividends denominated in many different currencies. All of thisexposes the company to the effect of changes in foreign currency exchange rates.
Flows of foreign currencies into and out of the company’s domestic operations are generally stable andregularly occurring and are recorded at fair market value in the company’s financial statements. The company’sforeign currency management policy permits it to enter into foreign currency hedges when these flows exceed athreshold, which is a function of these cash flows and forecasted annual operations. During 2009 and 2008, thecompany entered into foreign currency hedges to partially offset the foreign currency impact of these flows onoperating income. See Note H of Notes to Consolidated Financial Statements included in Part II, Item 8 forrelated discussion.
The company also issues inter-company loans to its foreign subsidiaries in their local currencies, exposing itto the effect of changes in spot exchange rates between loan issue and loan repayment dates. Generally,management uses foreign-exchange hedge contracts with terms of less than one year to hedge these exposures.When applied to the company’s derivative and other foreign currency sensitive instruments at December 31,2009, a 10% adverse change in currency rates would have about a $49 million effect on the company’s results.Although the company’s derivative and other foreign currency sensitive instruments expose it to market risk,fluctuations in the value of these instruments are mitigated by expected offsetting fluctuations in the matchedexposures.
Natural gas
In order to better predict and control the future cost of natural gas consumed at the company’s mills andplants, the company engages in financial hedging of future gas purchase prices. Gas usage is relativelypredictable month-by-month. The company hedges primarily with financial instruments that are priced based onNew York Mercantile Exchange (NYMEX) natural gas futures contracts. See Note H of Notes to ConsolidatedFinancial Statements included in Part II, Item 8 for related discussion.
40
Item 8. Financial statements and supplementary data
Index
Page
Report of Independent Registered Public Accounting Firm . . . . . . . . . . . . . . . . . . . . . . . . . . . . . . . . . . . . . . . 42
Consolidated Statements of Operations for the Years Ended December 31, 2009, 2008 and 2007 . . . . . . . . 43
Consolidated Balance Sheets at December 31, 2009 and 2008 . . . . . . . . . . . . . . . . . . . . . . . . . . . . . . . . . . . . 44
Consolidated Statements of Equity for the Years Ended December 31, 2009, 2008 and 2007 . . . . . . . . . . . . 45
Consolidated Statements of Cash Flows for the Years Ended December 31, 2009, 2008 and 2007 . . . . . . . . 46
Notes to Consolidated Financial Statements . . . . . . . . . . . . . . . . . . . . . . . . . . . . . . . . . . . . . . . . . . . . . . . . . . 47
41
Report of Independent Registered Public Accounting Firm
To the Board of Directors and Shareholders of MeadWestvaco Corporation
In our opinion, the accompanying consolidated balance sheets and the related consolidated statements ofoperations, shareholders’ equity, and cash flows present fairly, in all material respects, the financial position ofMeadWestvaco Corporation and its subsidiaries at December 31, 2009 and 2008, and the results of theiroperations and their cash flows for each of the three years in the period ended December 31, 2009 in conformitywith accounting principles generally accepted in the United States of America. Also in our opinion, the Companymaintained, in all material respects, effective internal control over financial reporting as of December 31, 2009,based on criteria established in Internal Control—Integrated Framework issued by the Committee of SponsoringOrganizations of the Treadway Commission (COSO). The Company’s management is responsible for thesefinancial statements, for maintaining effective internal control over financial reporting and for its assessment ofthe effectiveness of internal control over financial reporting, included in Management’s Report on InternalControl over Financial Reporting under Item 9A. Our responsibility is to express opinions on these financialstatements and on the Company’s internal control over financial reporting based on our integrated audits. Weconducted our audits in accordance with the standards of the Public Company Accounting Oversight Board(United States). Those standards require that we plan and perform the audits to obtain reasonable assurance aboutwhether the financial statements are free of material misstatement and whether effective internal control overfinancial reporting was maintained in all material respects. Our audits of the financial statements includedexamining, on a test basis, evidence supporting the amounts and disclosures in the financial statements, assessingthe accounting principles used and significant estimates made by management, and evaluating the overallfinancial statement presentation. Our audit of internal control over financial reporting included obtaining anunderstanding of internal control over financial reporting, assessing the risk that a material weakness exists, andtesting and evaluating the design and operating effectiveness of internal control based on the assessed risk. Ouraudits also included performing such other procedures as we considered necessary in the circumstances. Webelieve that our audits provide a reasonable basis for our opinions.
A company’s internal control over financial reporting is a process designed to provide reasonable assuranceregarding the reliability of financial reporting and the preparation of financial statements for external purposes inaccordance with generally accepted accounting principles. A company’s internal control over financial reportingincludes those policies and procedures that (i) pertain to the maintenance of records that, in reasonable detail,accurately and fairly reflect the transactions and dispositions of the assets of the company; (ii) provide reasonableassurance that transactions are recorded as necessary to permit preparation of financial statements in accordancewith generally accepted accounting principles, and that receipts and expenditures of the company are being madeonly in accordance with authorizations of management and directors of the company; and (iii) provide reasonableassurance regarding prevention or timely detection of unauthorized acquisition, use, or disposition of thecompany’s assets that could have a material effect on the financial statements.
Because of its inherent limitations, internal control over financial reporting may not prevent or detectmisstatements. Also, projections of any evaluation of effectiveness to future periods are subject to the risk thatcontrols may become inadequate because of changes in conditions, or that the degree of compliance with thepolicies or procedures may deteriorate.
/s/ PricewaterhouseCoopers LLP
PricewaterhouseCoopers LLPRichmond, VirginiaFebruary 23, 2010
42
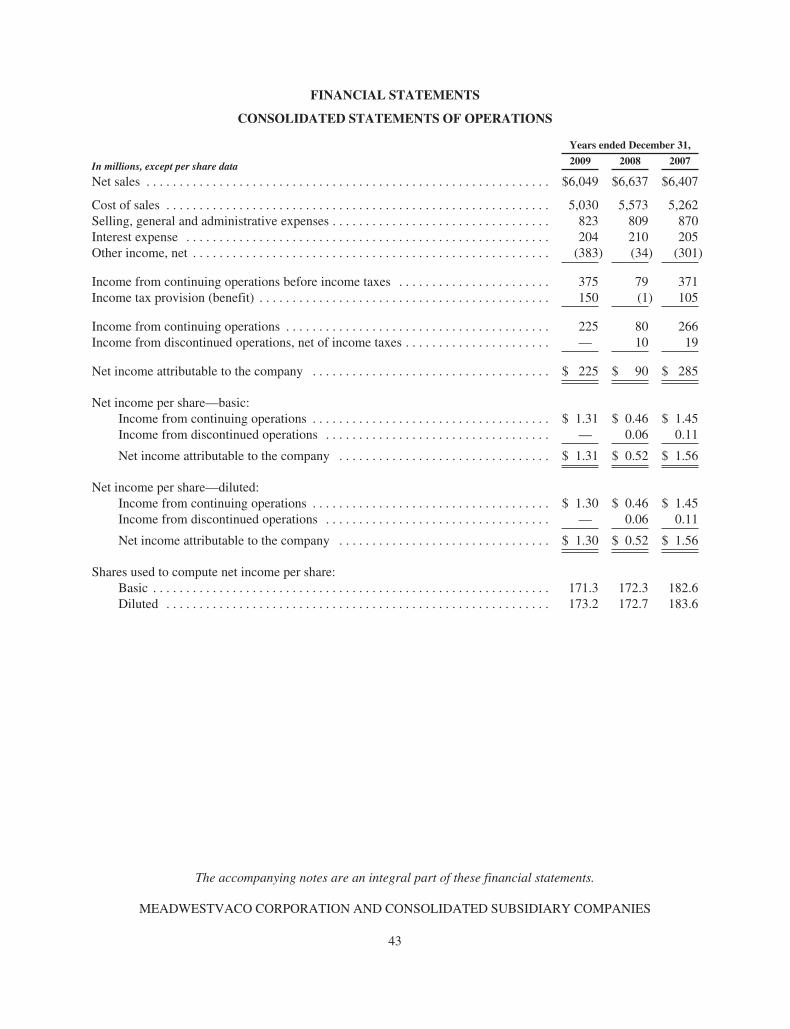
FINANCIAL STATEMENTS
CONSOLIDATED STATEMENTS OF OPERATIONS
In millions, except per share data
Years ended December 31,
2009 2008 2007
Net sales . . . . . . . . . . . . . . . . . . . . . . . . . . . . . . . . . . . . . . . . . . . . . . . . . . . . . . . . . . . . . $6,049 $6,637 $6,407
Cost of sales . . . . . . . . . . . . . . . . . . . . . . . . . . . . . . . . . . . . . . . . . . . . . . . . . . . . . . . . . . 5,030 5,573 5,262Selling, general and administrative expenses . . . . . . . . . . . . . . . . . . . . . . . . . . . . . . . . . 823 809 870Interest expense . . . . . . . . . . . . . . . . . . . . . . . . . . . . . . . . . . . . . . . . . . . . . . . . . . . . . . . 204 210 205Other income, net . . . . . . . . . . . . . . . . . . . . . . . . . . . . . . . . . . . . . . . . . . . . . . . . . . . . . . (383) (34) (301)
Income from continuing operations before income taxes . . . . . . . . . . . . . . . . . . . . . . . 375 79 371Income tax provision (benefit) . . . . . . . . . . . . . . . . . . . . . . . . . . . . . . . . . . . . . . . . . . . . 150 (1) 105
Income from continuing operations . . . . . . . . . . . . . . . . . . . . . . . . . . . . . . . . . . . . . . . . 225 80 266Income from discontinued operations, net of income taxes . . . . . . . . . . . . . . . . . . . . . . — 10 19
Net income attributable to the company . . . . . . . . . . . . . . . . . . . . . . . . . . . . . . . . . . . . $ 225 $ 90 $ 285
Net income per share—basic:Income from continuing operations . . . . . . . . . . . . . . . . . . . . . . . . . . . . . . . . . . . . $ 1.31 $ 0.46 $ 1.45Income from discontinued operations . . . . . . . . . . . . . . . . . . . . . . . . . . . . . . . . . . — 0.06 0.11
Net income attributable to the company . . . . . . . . . . . . . . . . . . . . . . . . . . . . . . . . $ 1.31 $ 0.52 $ 1.56
Net income per share—diluted:Income from continuing operations . . . . . . . . . . . . . . . . . . . . . . . . . . . . . . . . . . . . $ 1.30 $ 0.46 $ 1.45Income from discontinued operations . . . . . . . . . . . . . . . . . . . . . . . . . . . . . . . . . . — 0.06 0.11
Net income attributable to the company . . . . . . . . . . . . . . . . . . . . . . . . . . . . . . . . $ 1.30 $ 0.52 $ 1.56
Shares used to compute net income per share:Basic . . . . . . . . . . . . . . . . . . . . . . . . . . . . . . . . . . . . . . . . . . . . . . . . . . . . . . . . . . . . 171.3 172.3 182.6Diluted . . . . . . . . . . . . . . . . . . . . . . . . . . . . . . . . . . . . . . . . . . . . . . . . . . . . . . . . . . 173.2 172.7 183.6
The accompanying notes are an integral part of these financial statements.
MEADWESTVACO CORPORATION AND CONSOLIDATED SUBSIDIARY COMPANIES
43
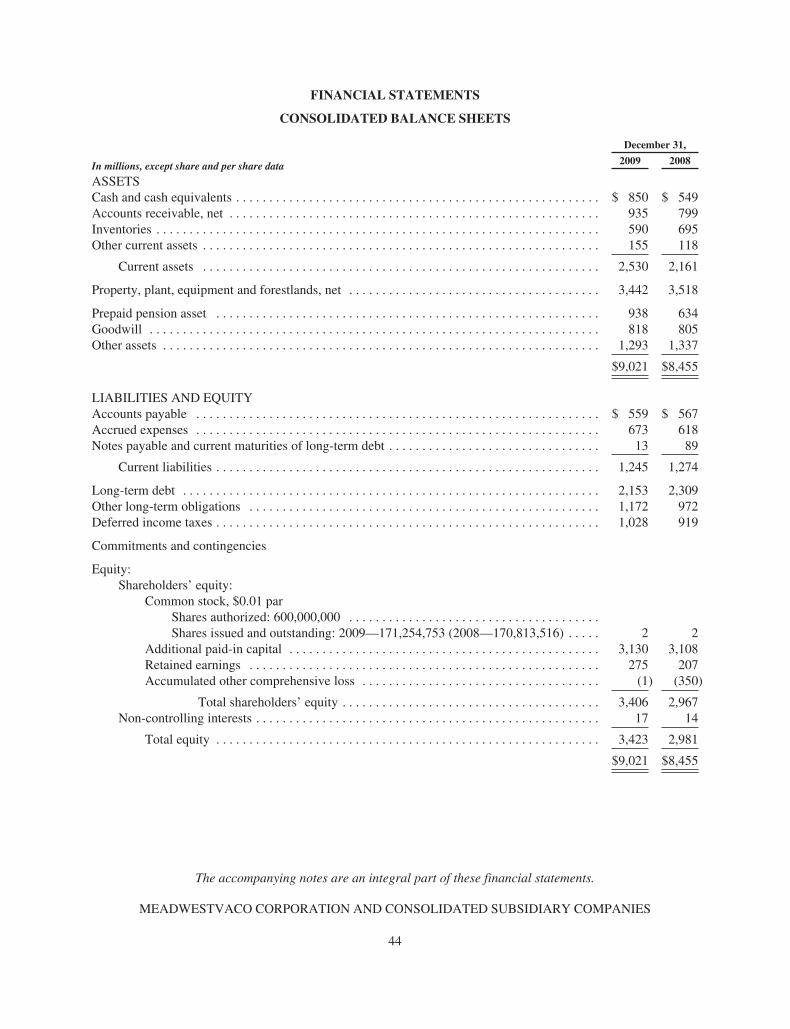
FINANCIAL STATEMENTS
CONSOLIDATED BALANCE SHEETS
In millions, except share and per share data
December 31,
2009 2008
ASSETSCash and cash equivalents . . . . . . . . . . . . . . . . . . . . . . . . . . . . . . . . . . . . . . . . . . . . . . . . . . . . . . . $ 850 $ 549Accounts receivable, net . . . . . . . . . . . . . . . . . . . . . . . . . . . . . . . . . . . . . . . . . . . . . . . . . . . . . . . . 935 799Inventories . . . . . . . . . . . . . . . . . . . . . . . . . . . . . . . . . . . . . . . . . . . . . . . . . . . . . . . . . . . . . . . . . . . 590 695Other current assets . . . . . . . . . . . . . . . . . . . . . . . . . . . . . . . . . . . . . . . . . . . . . . . . . . . . . . . . . . . . 155 118
Current assets . . . . . . . . . . . . . . . . . . . . . . . . . . . . . . . . . . . . . . . . . . . . . . . . . . . . . . . . . . . . 2,530 2,161
Property, plant, equipment and forestlands, net . . . . . . . . . . . . . . . . . . . . . . . . . . . . . . . . . . . . . . 3,442 3,518
Prepaid pension asset . . . . . . . . . . . . . . . . . . . . . . . . . . . . . . . . . . . . . . . . . . . . . . . . . . . . . . . . . . 938 634Goodwill . . . . . . . . . . . . . . . . . . . . . . . . . . . . . . . . . . . . . . . . . . . . . . . . . . . . . . . . . . . . . . . . . . . . 818 805Other assets . . . . . . . . . . . . . . . . . . . . . . . . . . . . . . . . . . . . . . . . . . . . . . . . . . . . . . . . . . . . . . . . . . 1,293 1,337
$9,021 $8,455
LIABILITIES AND EQUITYAccounts payable . . . . . . . . . . . . . . . . . . . . . . . . . . . . . . . . . . . . . . . . . . . . . . . . . . . . . . . . . . . . . $ 559 $ 567Accrued expenses . . . . . . . . . . . . . . . . . . . . . . . . . . . . . . . . . . . . . . . . . . . . . . . . . . . . . . . . . . . . . 673 618Notes payable and current maturities of long-term debt . . . . . . . . . . . . . . . . . . . . . . . . . . . . . . . . 13 89
Current liabilities . . . . . . . . . . . . . . . . . . . . . . . . . . . . . . . . . . . . . . . . . . . . . . . . . . . . . . . . . . 1,245 1,274
Long-term debt . . . . . . . . . . . . . . . . . . . . . . . . . . . . . . . . . . . . . . . . . . . . . . . . . . . . . . . . . . . . . . . 2,153 2,309Other long-term obligations . . . . . . . . . . . . . . . . . . . . . . . . . . . . . . . . . . . . . . . . . . . . . . . . . . . . . 1,172 972Deferred income taxes . . . . . . . . . . . . . . . . . . . . . . . . . . . . . . . . . . . . . . . . . . . . . . . . . . . . . . . . . . 1,028 919
Commitments and contingencies
Equity:Shareholders’ equity:
Common stock, $0.01 parShares authorized: 600,000,000 . . . . . . . . . . . . . . . . . . . . . . . . . . . . . . . . . . . . . .Shares issued and outstanding: 2009—171,254,753 (2008—170,813,516) . . . . . 2 2
Additional paid-in capital . . . . . . . . . . . . . . . . . . . . . . . . . . . . . . . . . . . . . . . . . . . . . . . 3,130 3,108Retained earnings . . . . . . . . . . . . . . . . . . . . . . . . . . . . . . . . . . . . . . . . . . . . . . . . . . . . . 275 207Accumulated other comprehensive loss . . . . . . . . . . . . . . . . . . . . . . . . . . . . . . . . . . . . (1) (350)
Total shareholders’ equity . . . . . . . . . . . . . . . . . . . . . . . . . . . . . . . . . . . . . . . 3,406 2,967Non-controlling interests . . . . . . . . . . . . . . . . . . . . . . . . . . . . . . . . . . . . . . . . . . . . . . . . . . . . 17 14
Total equity . . . . . . . . . . . . . . . . . . . . . . . . . . . . . . . . . . . . . . . . . . . . . . . . . . . . . . . . . . 3,423 2,981
$9,021 $8,455
The accompanying notes are an integral part of these financial statements.
MEADWESTVACO CORPORATION AND CONSOLIDATED SUBSIDIARY COMPANIES
44
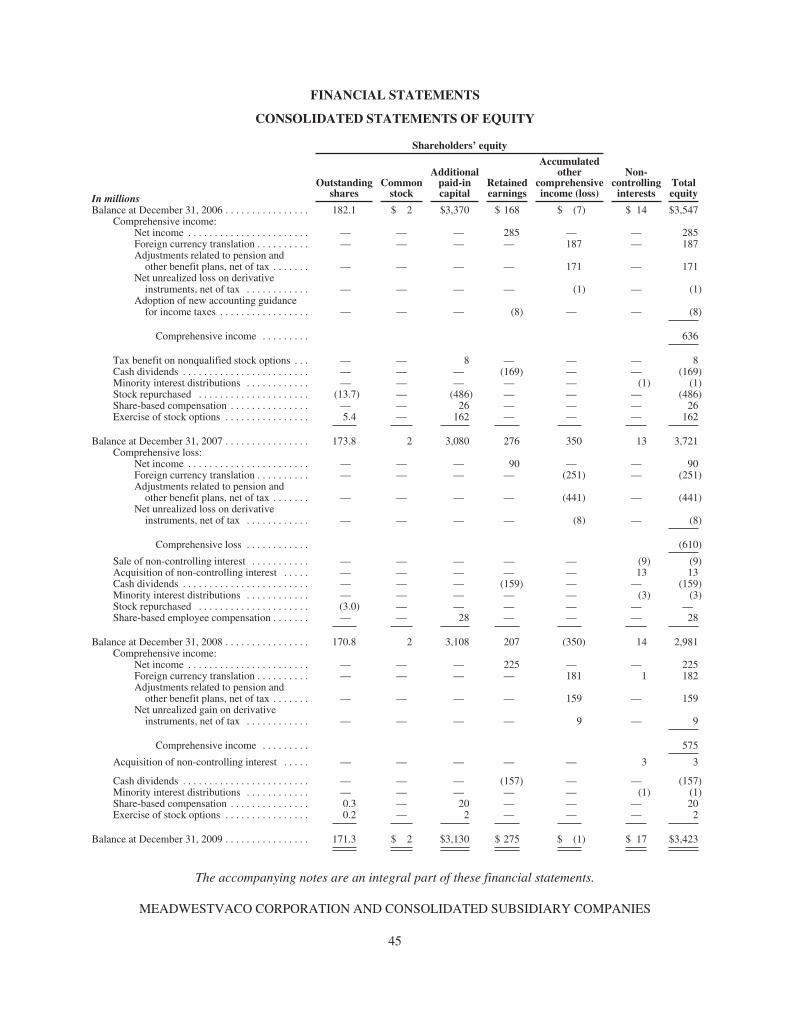
FINANCIAL STATEMENTS
CONSOLIDATED STATEMENTS OF EQUITY
In millions
Shareholders’ equity
Outstandingshares
Commonstock
Additionalpaid-incapital
Retainedearnings
Accumulatedother
comprehensiveincome (loss)
Non-controllinginterests
Totalequity
Balance at December 31, 2006 . . . . . . . . . . . . . . . . 182.1 $ 2 $3,370 $ 168 $ (7) $ 14 $3,547Comprehensive income:
Net income . . . . . . . . . . . . . . . . . . . . . . . — — — 285 — — 285Foreign currency translation . . . . . . . . . . — — — — 187 — 187Adjustments related to pension andother benefit plans, net of tax . . . . . . . — — — — 171 — 171
Net unrealized loss on derivativeinstruments, net of tax . . . . . . . . . . . . — — — — (1) — (1)
Adoption of new accounting guidancefor income taxes . . . . . . . . . . . . . . . . . — — — (8) — — (8)
Comprehensive income . . . . . . . . . 636
Tax benefit on nonqualified stock options . . . — — 8 — — — 8Cash dividends . . . . . . . . . . . . . . . . . . . . . . . . — — — (169) — — (169)Minority interest distributions . . . . . . . . . . . . — — — — — (1) (1)Stock repurchased . . . . . . . . . . . . . . . . . . . . . (13.7) — (486) — — — (486)Share-based compensation . . . . . . . . . . . . . . . — — 26 — — — 26Exercise of stock options . . . . . . . . . . . . . . . . 5.4 — 162 — — — 162
Balance at December 31, 2007 . . . . . . . . . . . . . . . . 173.8 2 3,080 276 350 13 3,721Comprehensive loss:
Net income . . . . . . . . . . . . . . . . . . . . . . . — — — 90 — — 90Foreign currency translation . . . . . . . . . . — — — — (251) — (251)Adjustments related to pension andother benefit plans, net of tax . . . . . . . — — — — (441) — (441)
Net unrealized loss on derivativeinstruments, net of tax . . . . . . . . . . . . — — — — (8) — (8)
Comprehensive loss . . . . . . . . . . . . (610)
Sale of non-controlling interest . . . . . . . . . . . — — — — — (9) (9)Acquisition of non-controlling interest . . . . . — — — — — 13 13Cash dividends . . . . . . . . . . . . . . . . . . . . . . . . — — — (159) — — (159)Minority interest distributions . . . . . . . . . . . . — — — — — (3) (3)Stock repurchased . . . . . . . . . . . . . . . . . . . . . (3.0) — — — — — —Share-based employee compensation . . . . . . . — — 28 — — — 28
Balance at December 31, 2008 . . . . . . . . . . . . . . . . 170.8 2 3,108 207 (350) 14 2,981Comprehensive income:
Net income . . . . . . . . . . . . . . . . . . . . . . . — — — 225 — — 225Foreign currency translation . . . . . . . . . . — — — — 181 1 182Adjustments related to pension andother benefit plans, net of tax . . . . . . . — — — — 159 — 159
Net unrealized gain on derivativeinstruments, net of tax . . . . . . . . . . . . — — — — 9 — 9
Comprehensive income . . . . . . . . . 575
Acquisition of non-controlling interest . . . . . — — — — — 3 3
Cash dividends . . . . . . . . . . . . . . . . . . . . . . . . — — — (157) — — (157)Minority interest distributions . . . . . . . . . . . . — — — — — (1) (1)Share-based compensation . . . . . . . . . . . . . . . 0.3 — 20 — — — 20Exercise of stock options . . . . . . . . . . . . . . . . 0.2 — 2 — — — 2
Balance at December 31, 2009 . . . . . . . . . . . . . . . . 171.3 $ 2 $3,130 $ 275 $ (1) $ 17 $3,423
The accompanying notes are an integral part of these financial statements.
MEADWESTVACO CORPORATION AND CONSOLIDATED SUBSIDIARY COMPANIES
45
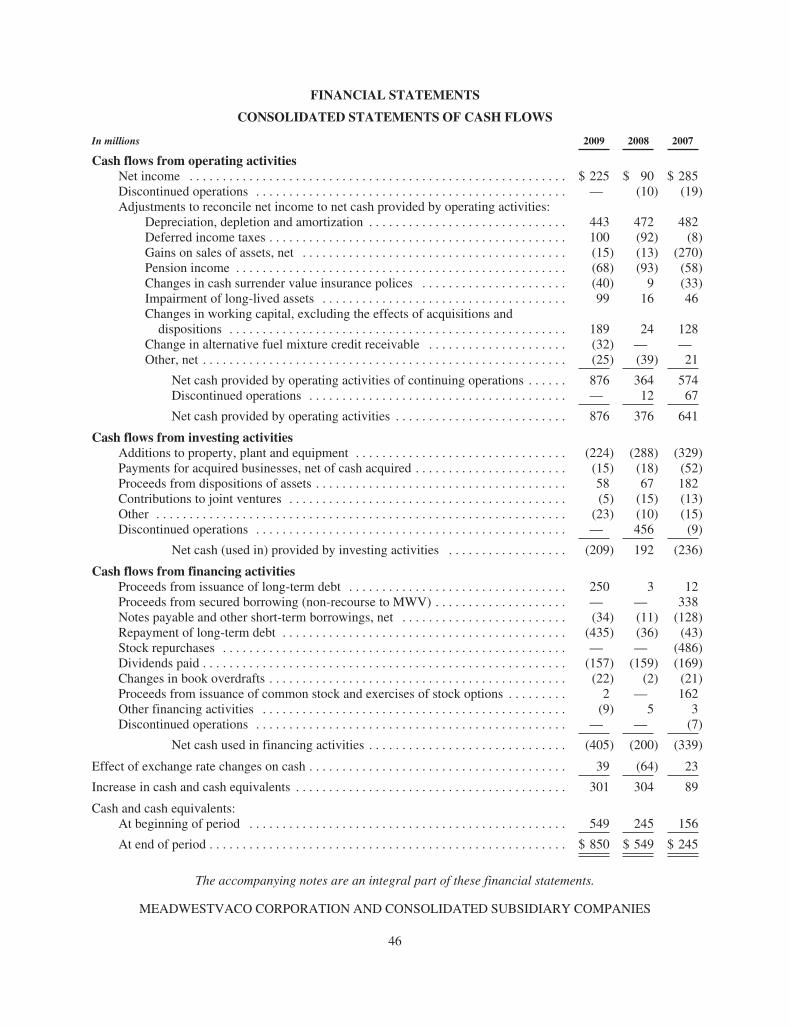
FINANCIAL STATEMENTS
CONSOLIDATED STATEMENTS OF CASH FLOWS
In millions 2009 2008 2007
Cash flows from operating activitiesNet income . . . . . . . . . . . . . . . . . . . . . . . . . . . . . . . . . . . . . . . . . . . . . . . . . . . . . . . . . $ 225 $ 90 $ 285Discontinued operations . . . . . . . . . . . . . . . . . . . . . . . . . . . . . . . . . . . . . . . . . . . . . . . — (10) (19)Adjustments to reconcile net income to net cash provided by operating activities:
Depreciation, depletion and amortization . . . . . . . . . . . . . . . . . . . . . . . . . . . . . . 443 472 482Deferred income taxes . . . . . . . . . . . . . . . . . . . . . . . . . . . . . . . . . . . . . . . . . . . . . 100 (92) (8)Gains on sales of assets, net . . . . . . . . . . . . . . . . . . . . . . . . . . . . . . . . . . . . . . . . (15) (13) (270)Pension income . . . . . . . . . . . . . . . . . . . . . . . . . . . . . . . . . . . . . . . . . . . . . . . . . . (68) (93) (58)Changes in cash surrender value insurance polices . . . . . . . . . . . . . . . . . . . . . . (40) 9 (33)Impairment of long-lived assets . . . . . . . . . . . . . . . . . . . . . . . . . . . . . . . . . . . . . 99 16 46Changes in working capital, excluding the effects of acquisitions anddispositions . . . . . . . . . . . . . . . . . . . . . . . . . . . . . . . . . . . . . . . . . . . . . . . . . . . 189 24 128
Change in alternative fuel mixture credit receivable . . . . . . . . . . . . . . . . . . . . . (32) — —Other, net . . . . . . . . . . . . . . . . . . . . . . . . . . . . . . . . . . . . . . . . . . . . . . . . . . . . . . . (25) (39) 21
Net cash provided by operating activities of continuing operations . . . . . . 876 364 574Discontinued operations . . . . . . . . . . . . . . . . . . . . . . . . . . . . . . . . . . . . . . . — 12 67
Net cash provided by operating activities . . . . . . . . . . . . . . . . . . . . . . . . . . 876 376 641
Cash flows from investing activitiesAdditions to property, plant and equipment . . . . . . . . . . . . . . . . . . . . . . . . . . . . . . . . (224) (288) (329)Payments for acquired businesses, net of cash acquired . . . . . . . . . . . . . . . . . . . . . . . (15) (18) (52)Proceeds from dispositions of assets . . . . . . . . . . . . . . . . . . . . . . . . . . . . . . . . . . . . . . 58 67 182Contributions to joint ventures . . . . . . . . . . . . . . . . . . . . . . . . . . . . . . . . . . . . . . . . . . (5) (15) (13)Other . . . . . . . . . . . . . . . . . . . . . . . . . . . . . . . . . . . . . . . . . . . . . . . . . . . . . . . . . . . . . . (23) (10) (15)Discontinued operations . . . . . . . . . . . . . . . . . . . . . . . . . . . . . . . . . . . . . . . . . . . . . . . — 456 (9)
Net cash (used in) provided by investing activities . . . . . . . . . . . . . . . . . . (209) 192 (236)
Cash flows from financing activitiesProceeds from issuance of long-term debt . . . . . . . . . . . . . . . . . . . . . . . . . . . . . . . . . 250 3 12Proceeds from secured borrowing (non-recourse to MWV) . . . . . . . . . . . . . . . . . . . . — — 338Notes payable and other short-term borrowings, net . . . . . . . . . . . . . . . . . . . . . . . . . (34) (11) (128)Repayment of long-term debt . . . . . . . . . . . . . . . . . . . . . . . . . . . . . . . . . . . . . . . . . . . (435) (36) (43)Stock repurchases . . . . . . . . . . . . . . . . . . . . . . . . . . . . . . . . . . . . . . . . . . . . . . . . . . . . — — (486)Dividends paid . . . . . . . . . . . . . . . . . . . . . . . . . . . . . . . . . . . . . . . . . . . . . . . . . . . . . . . (157) (159) (169)Changes in book overdrafts . . . . . . . . . . . . . . . . . . . . . . . . . . . . . . . . . . . . . . . . . . . . . (22) (2) (21)Proceeds from issuance of common stock and exercises of stock options . . . . . . . . . 2 — 162Other financing activities . . . . . . . . . . . . . . . . . . . . . . . . . . . . . . . . . . . . . . . . . . . . . . (9) 5 3Discontinued operations . . . . . . . . . . . . . . . . . . . . . . . . . . . . . . . . . . . . . . . . . . . . . . . — — (7)
Net cash used in financing activities . . . . . . . . . . . . . . . . . . . . . . . . . . . . . . (405) (200) (339)
Effect of exchange rate changes on cash . . . . . . . . . . . . . . . . . . . . . . . . . . . . . . . . . . . . . . . 39 (64) 23
Increase in cash and cash equivalents . . . . . . . . . . . . . . . . . . . . . . . . . . . . . . . . . . . . . . . . . 301 304 89
Cash and cash equivalents:At beginning of period . . . . . . . . . . . . . . . . . . . . . . . . . . . . . . . . . . . . . . . . . . . . . . . . 549 245 156
At end of period . . . . . . . . . . . . . . . . . . . . . . . . . . . . . . . . . . . . . . . . . . . . . . . . . . . . . . $ 850 $ 549 $ 245
The accompanying notes are an integral part of these financial statements.
MEADWESTVACO CORPORATION AND CONSOLIDATED SUBSIDIARY COMPANIES
46
NOTES TO CONSOLIDATED FINANCIAL STATEMENTS
Summary of significant accounting policies
Basis of consolidation and preparation of financial statements: The consolidated financial statementsinclude all majority-owned or controlled entities of MeadWestvaco Corporation (“MeadWestvaco”, “MWV”, orthe “company”), and all significant inter-company transactions are eliminated. MWV’s business segments are(i) Packaging Resources, (ii) Consumer Solutions, (iii) Consumer & Office Products, (iv) Specialty Chemicals,and (v) Community Development and Land Management.
Estimates and assumptions: The preparation of financial statements in accordance with generally acceptedaccounting principles requires management to make estimates and assumptions that affect the reported amountsof some assets and liabilities and, in some instances, the reported amounts of revenues and expenses during thereporting period. Actual results could differ from these estimates.
Translation of foreign currencies: The local currency is the functional currency for substantially all of thecompany’s significant operations outside the U.S. The assets and liabilities of the company’s foreign subsidiariesare translated into U.S. dollars using period-end exchange rates, and adjustments resulting from these financialstatement translations are included in accumulated other comprehensive income or loss in the consolidatedbalance sheets. Revenues and expenses are translated at average rates prevailing during the period.
Cash equivalents: Highly liquid securities with an original maturity of three months or less are considered tobe cash equivalents.
Accounts receivable and allowance for doubtful accounts: Trade accounts receivable are recorded at theinvoice amount and generally do not bear interest. The allowance for doubtful accounts is the company’s bestestimate of the amount of probable loss in the existing accounts receivable. The company determines theallowance based on historical write-off experience by business. Past due balances over a specified amount arereviewed individually for collectibility. Account balances are charged off against the allowance when it isprobable that the receivable will not be recovered.
Inventories: Inventories are valued at the lower of cost or market. Cost is determined using the last-in,first-out method for substantially all raw materials, finished goods and production materials of U.S.manufacturing operations. Cost of all other inventories, including stores and supplies inventories and inventoriesof non-U.S. manufacturing operations, is determined by the first-in, first-out or average cost methods.
Property, plant, equipment and forestlands: Owned assets are recorded at cost. Also included in the cost ofthese assets is interest on funds borrowed during the construction period. When assets are sold, retired ordisposed of, their cost and related accumulated depreciation are removed from the accounts and any resultinggain or loss is reflected in cost of sales. Gains and losses on sales of corporate real estate are recorded in otherincome, net. Costs of renewals and betterments of properties are capitalized; costs of maintenance and repairs arecharged to expense. Costs of reforestation of forestlands are capitalized. Reforestation costs include the costs ofseedlings, site preparation, planting of seedlings and early-stage fertilization.
Depreciation and depletion: The cost of plant and equipment is depreciated, utilizing the straight-linemethod, over the estimated useful lives of the assets, which range from 20 to 40 years for buildings and 5 to 30years for machinery and equipment. Timber is depleted as timber is cut at rates determined annually based on therelationship of undepleted timber costs to the estimated volume of recoverable timber. Timber volumes used incalculating depletion rates are based upon merchantable timber volumes at a specific point in time. The depletionrates for company-owned land do not include an estimate of either future reforestation costs associated with astand’s final harvest or future volume in connection with replanting of a stand subsequent to the final harvest.
47
NOTES TO CONSOLIDATED FINANCIAL STATEMENTS—(Continued)
Impairment of long-lived assets: The company periodically evaluates whether current events orcircumstances indicate that the carrying value of its long-lived assets, including intangible assets with finite lives,to be held and used may not be recoverable. If such circumstances are determined to exist, an estimate ofundiscounted future cash flows produced by the long-lived asset, or the appropriate grouping of assets, iscompared to carrying value to determine whether impairment exists.
If an asset is determined to be impaired, the loss is measured based on quoted market prices in activemarkets, if available. If quoted market prices are not available, the estimate of fair value is based on variousvaluation techniques, including a discounted value of estimated future cash flows. The company reports an assetto be disposed of at the lower of its carrying value or its estimated net realizable value.
Intangible assets assigned indefinite lives are to be tested at least annually or more often if events or changesin circumstances indicate that the fair value of an intangible asset is below its carrying value. The fair values ofthe company’s indefinite-lived intangible assets (primarily Calmar trademarks and trade names) are estimatedusing an income approach (the relief from royalty method). Although the estimate of the fair values of thecompany’s indefinite-lived intangible assets under the income approach exceed the respective carrying values,different assumptions regarding projected performance and other factors could result in significant non-cashimpairment charges in the future. Based on the company’s annual review of the indefinite-lived intangible assetsin the fourth quarter of 2009, there was no indication of impairment.
Goodwill: Goodwill represents the excess of cost of an acquired business over the fair value of theidentifiable tangible and intangible assets acquired and liabilities assumed in a business combination. Thecompany reviews the recorded value of goodwill at least annually on October 1, or sooner if events or changes incircumstances indicate that the fair value of a reporting unit is below its carrying value. Goodwill is required tobe tested for impairment using a two-step process. The first step is to identify a potential impairment and thesecond step is to measure the amount of the impairment loss, if any. Goodwill is deemed to be impaired if thecarrying amount of a reporting unit’s goodwill exceeds its estimated fair value. Goodwill has been allocated tothe company’s respective reporting units based on its nature and synergies expected to be achieved. The fairvalue of each reporting unit is estimated primarily using an income approach, specifically the discounted cashflow method. The company employs significant assumptions in evaluating its goodwill for impairment. Theseassumptions include relevant considerations of market-participant data.
In applying the income approach in assessing goodwill for impairment, changes in assumptions couldmaterially affect the determination of fair value for a reporting unit. Although the fair value estimates of thecompany’s reporting units under the income approach exceed the respective carrying values, differentassumptions regarding projected performance and other factors could result in significant non-cash impairmentcharges in the future. The following assumptions are key to the company’s income approach:
• Business projections—Projections are based on three-year forecasts that are developed internally bymanagement and reviewed by the company’s Board of Directors. These projections include significantassumptions such as estimates of future revenues, profits, working capital requirements, operatingplans, costs of planned restructuring actions and capital expenditures. Assumptions surrounding macro-economic data and estimates include industry projections, inflation, foreign currency exchange ratesand costs of energy, raw materials and freight.
• Growth rates—A growth rate based on market participant data considerations is used to calculate theterminal value of a reporting unit. The growth rate is the expected rate at which a reporting unit’searnings stream is projected to grow beyond the three-year forecast period.
• Discount rates—Future cash flows are discounted at a rate that is consistent with a weighted averagecost of capital for a potential market participant. The weighted average cost of capital is an estimate ofthe overall after-tax rate of return required by equity and debt holders of a business enterprise. The
48
NOTES TO CONSOLIDATED FINANCIAL STATEMENTS—(Continued)
discount rates selected for the reporting units are based on existing conditions within the respectivemarkets and reflect appropriate adjustments for potential risk premiums in those markets as well asappropriate weighting of the market cost of equity versus debt, which is developed with the assistanceof external financial advisors.
• Tax rates—Tax rates are based on estimates of the tax rates that a market participant would realize inthe respective primary markets and geographic areas in which the reporting units operate.
Based on management’s annual evaluation of the recorded value of goodwill during the fourth quarter of2009, there was no indication of impairment. However, changes to any of the above assumptions could lead toimpairment of goodwill in the future. See Note D and Note Q for further information.
Other assets: Capitalized software for internal use, equipment leased to customers and other amortizableand indefinite-lived intangible assets are included in other assets. Capitalized software and other amortizableintangibles are amortized using the straight-line and cash flows methods over their estimated useful lives of 3 to21 years. Equipment leased to customers is amortized using the sum-of-the-years-digits method over theestimated useful life of the machine, generally 10 years. Revenue is recognized for the leased equipment on astraight-line basis over the life of the lease and is included in net sales. The company records softwaredevelopment costs in accordance with the accounting guidance provided by the Financial Accounting StandardsBoard. See Note D and Note E for further information.
Financial instruments: The company utilizes well-defined financial derivatives in the normal course of itsoperations as a means to manage some of its interest rate, foreign currency and commodity risks. All derivativeinstruments are required to be recorded in the consolidated balance sheets as assets or liabilities, measured at fairvalue. The fair value estimates are based on relevant market information, including market rates and prices. If thederivative is designated as a fair-value hedge, the changes in the fair value of the derivative and of the hedgeditem attributable to the hedged risk are recognized in earnings. If the derivative is designated as a cash-flowhedge, the effective portion of the change in the fair value of the derivative is recorded in accumulated othercomprehensive income or loss and is recognized in the consolidated statements of operations when the hedgeditem affects earnings. Ineffective portions of changes in the fair value of cash-flow hedges are recognized inearnings. If a derivative is not designated as a qualifying hedge, changes in fair value are recognized in earnings.See Note H for further information.
Environmental and legal liabilities: Environmental expenditures that increase useful lives of assets arecapitalized, while other environmental expenditures are expensed. Liabilities are recorded when remedial effortsare probable and the costs can be reasonably estimated. The company recognizes a liability for other legalcontingencies when a loss is probable and reasonably estimable. Liabilities recorded for claims are limited topending cases based on the company’s historical experience, consultation with outside counsel and consultationwith an actuarial specialist concerning the feasibility of reasonably estimating liabilities associated with claimsthat may arise in the future. The company recognizes insurance recoveries when collection is reasonably assured.See Note P for further information.
Asset retirement obligations: The company has certain conditional and unconditional asset retirementobligations associated with owned or leased property, plant and equipment, including surface impoundments,asbestos, and water supply wells. The company records a liability for the fair value of an asset retirementobligation when incurred if the fair value of the liability can be reasonably estimated. Management does not havesufficient information to estimate the fair value of certain obligations, primarily associated with surfaceimpoundments and asbestos, because the settlement date or range of potential settlement dates have not beenspecified and information is not available to apply expected present value techniques. Subsequent to initialmeasurement, the company recognizes changes in the amounts of the obligations, as necessary, resulting from thepassage of time and revisions to either the timing or amount of estimated cash flows.
49
NOTES TO CONSOLIDATED FINANCIAL STATEMENTS—(Continued)
Revenue recognition: The company recognizes revenues at the point when title and the risk of ownershippasses to the customer. Substantially all of the company’s revenues are generated through product sales andshipping terms generally indicate when title and the risk of ownership have passed. Revenue is recognized atshipment for sales where shipping terms are FOB (free on board) shipping point unless risk of loss is maintainedunder freight terms. For sales where shipping terms are FOB destination, revenue is recognized when the goodsare received by the customer. The company provides allowances for estimated returns and other customer creditssuch as discounts and volume rebates, when the revenue is recognized, based on historical experience, currenttrends and any notification of pending returns. Also included in net sales is service revenue which is recognizedas the service is performed. Revenue is recognized for leased equipment to customers on a straight-line basisover the estimated term of the lease and is included in net sales of the company. In 2009 and 2008, sales oflandholdings are included in net sales in the consolidated statements of operations to reflect the strategic viewand structure of the operations of the Community Development and Land Management segment established in2008. For periods prior to 2008, gains from sales of landholdings are included in other income, net in theconsolidated statements of operations.
Shipping and handling costs: Shipping and handling costs are classified as a component of cost of sales.Amounts billed to a customer in a sales transaction related to shipping and handling are classified as revenue.
Research and development: Included in cost of sales and selling, general and administrative expenses areexpenditures for research and development of $44 million, $61 million and $62 million for the years endedDecember 31, 2009, 2008 and 2007, respectively, which were expensed as incurred.
Income taxes: Deferred income taxes are recorded for temporary differences between financial statementcarrying amounts and the tax basis of assets and liabilities. Deferred tax assets and liabilities reflect the enactedtax rates in effect for the years the differences are expected to reverse. The company evaluates the need for adeferred tax asset valuation allowance by assessing whether it is more likely than not that it will realize itsdeferred tax assets in the future.
The company has tax jurisdictions located in many areas of the world and is subject to audit in thesejurisdictions. Tax audits by their nature are often complex and can require several years to resolve. In thepreparation of the company’s financial statements, management exercises judgments in estimating the potentialexposure to unresolved tax matters. The company recognizes the tax benefit from an uncertain tax position if it ismore likely than not that the position is sustainable. For those tax positions that meet the more likely than notcriteria, the company records only the portion of the tax benefit that is greater than 50% likely to be realizedupon settlement with the respective taxing authority. Interest and penalties related to unrecognized tax benefitsare recorded within income tax expense in the consolidated statements of operations. While actual results couldvary, in management’s judgment, the company has adequate tax accruals with respect to the ultimate outcome ofsuch unresolved tax matters.
The company recognizes interest and penalties related to unrecognized tax benefits in income taxes in theconsolidated statements of operations.
Share-based compensation: The company records compensation expense for graded and cliff vestingawards on a straight-line basis over the vesting period, which is generally three years. The company uses the“long-haul” method to determine the pool of tax benefits or deficiencies resulting from tax deductions related toawards of equity instruments that exceed or are less than the cumulative compensation cost for those instrumentsrecognized for financial reporting. Substantially all compensation expense related to share-based awards isrecorded as a component of selling, general and administrative expenses in the consolidated statements ofoperations. For stock-settled awards, the company issues previously authorized new shares. See Note J for furtherdetail on share-based compensation.
50
NOTES TO CONSOLIDATED FINANCIAL STATEMENTS—(Continued)
Net income per share: Basic net income per share for all the periods presented has been calculated using thecompany’s weighted average shares outstanding. In computing diluted net income per share, incremental sharesissuable upon the assumed exercise of stock options and other share-based compensation awards have beenadded to weighted average shares outstanding, if dilutive. For the years ended December 31, 2009, 2008, and2007, 8.0 million, 9.0 million and 2.1 million equity awards, respectively, were excluded from the calculation ofweighted average shares outstanding, as the exercise price per share was greater than the average market value,resulting in an anti-dilutive effect on diluted earnings per share.
Related party transactions: The company has certain related party transactions in the ordinary course ofbusiness that are insignificant.
Discontinued operations: Certain prior period amounts have been reclassified in the consolidated financialstatements to conform to the 2008 presentation of discontinued operations for the company’s North Charleston,South Carolina kraft paper mill and related assets (collectively, the “Kraft business”), previously included in thePackaging Resources segment. On July 1, 2008, the company completed the sale of the Kraft business for netcash proceeds of $466 million. See Note Q for additional information.
New accounting guidance
During 2009, the company has or will adopt the below new accounting guidance as promulgated by theFinancial Accounting Standards Board.
Fair value measurements
The company adopted a new framework for measuring fair value and has provided additional disclosuresabout fair value measurements. As permitted by transition rules, the new framework for measuring fair value andthe related disclosures were adopted for all financial assets and liabilities as of January 1, 2008, and for allnon-financial assets and liabilities as of January 1, 2009. Furthermore, on June 30, 2009, the company adoptednew accounting guidance that requires disclosures about the fair value of financial instruments for interimreporting periods in addition to the existing requirement for annual financial statements. In addition, onJanuary 1, 2010, the company will adopt new accounting guidance that requires additional disclosures regardingthe different classes of assets and liabilities measured at fair value, the valuation techniques employed, theactivity in Level 3 fair value measurements, and the transfers between the levels of fair value measurements. SeeNote A for disclosures of fair value measurements.
Disclosures about defined benefit plan assets
On January 1, 2009, the company adopted new annual disclosure requirements regarding the plan assets ofits defined benefit pension plans. The new disclosures are effective for years ending after December 15, 2009,and will provide users of the company’s consolidated financial statements with an understanding of howinvestment allocation decisions are made, including factors that are pertinent to an understanding of investmentpolicies and strategies, major categories of plan assets, inputs and valuation techniques used to measure fair valueof plan assets, effect of fair value measurements using significant unobservable inputs on changes in plan assetsfor the period, and significant concentrations of risk within plan assets. See Notes A and L for disclosures aboutdefined benefit plan assets.
Accounting for business combinations
On January 1, 2009, the company adopted, as required, a revised accounting model for businesscombinations. Under the revised guidance, an acquirer is required to recognize the assets acquired, liabilitiesassumed, including those arising from contractual contingencies, any contingent consideration, and anynon-controlling interest in the acquiree at the acquisition date, measured at their fair values as of that date. In
51
NOTES TO CONSOLIDATED FINANCIAL STATEMENTS—(Continued)
addition, the acquirer in a business combination achieved in stages (sometimes referred to as a step acquisition) isrequired to recognize the identifiable assets and liabilities, as well as the non-controlling interest in the acquiree,at the full amounts of their fair values. The requirement to measure the non-controlling interest in the acquiree atfair value will result in recognizing the goodwill attributable to the non-controlling interest in addition to thatattributable to the acquirer. The company has applied the revised accounting model prospectively to businesscombinations for which the acquisition date was on or after January 1, 2009. The impact of adoption did not havea material effect on the company’s consolidated financial statements as of and for the year ended December 31,2009.
Accounting for non-controlling interests
On January 1, 2009, the company adopted new accounting guidance regarding the non-controlling interestin a subsidiary and for the deconsolidation of a subsidiary. The new guidance clarified that a non-controllinginterest in a subsidiary is an ownership interest in the consolidated entity that should be reported as equity in theconsolidated financial statements. The guidance also changed the way the consolidated statement of operations ispresented by requiring consolidated net income to include the amounts, if material, attributable to both the parentand the non-controlling interest, and requires disclosure on the face of the consolidated statement of operations ofthe amount of consolidated net income attributable to the parent and to the non-controlling interest. The impactof adoption did not have a material effect on the company’s consolidated financial statements as of and for theyear ended December 31, 2009.
Disclosures about derivative instruments and hedging activities
On January 1, 2009, the company adopted new accounting guidance that expanded the disclosurerequirements for derivative instruments and hedging activities. Entities are required to provide enhanceddisclosures about (i) how and why an entity uses derivative instruments, (ii) how an entity accounts for derivativeinstruments and related hedged items, and (iii) how derivative instruments and related hedged items affect anentity’s financial position, financial performance and cash flows. See Note H for disclosures of derivativeinstruments and hedging activities.
Accounting for and disclosures of subsequent events
On June 30, 2009, the company adopted new accounting guidance that established general standards ofaccounting for and disclosures of events that occur after the balance sheet date but before the financial statementsare issued or are available to be issued. The new guidance sets forth the period after the balance sheet date duringwhich management of a reporting entity should evaluate events or transactions that may occur for potentialrecognition or disclosure in the financial statements, the circumstances under which an entity should recognizeevents or transactions occurring after the balance sheet date, and the disclosures that an entity should make aboutevents or transactions that occurred after the balance sheet date. The impact of adoption did not have a materialeffect on the company’s consolidated financial statements as of and for the year ended December 31, 2009. Thecompany has considered events or transactions occurring subsequent to the consolidated balance sheet datethrough February 23, 2010 (issuance date of these consolidated financial statements) for potential recognition ordisclosure in the company’s consolidated financial statements.
Accounting for variable interest entities
On January 1, 2010 the company will adopt new accounting guidance related to the accounting anddisclosure for variable interest entities. The new guidance provides an improved framework for identifying whichenterprise has a controlling financial interest in a variable interest entity and requires additional disclosures of anenterprise’s involvement with variable interest entities.
52
NOTES TO CONSOLIDATED FINANCIAL STATEMENTS—(Continued)
A. Fair value measurements
The following information is presented for assets and liabilities that are recorded in the consolidated balancesheet at fair value at December 31, 2009, measured on a recurring and non-recurring basis:
In millions December 31, 2009Level1 (1) Level 2 (2) Level 3 (3)
Recurring fair value measurements:Derivatives-assets . . . . . . . . . . . . . . . . . . . . . . . . . . . . . . . . . . $ 1 $— $ 1 $—Derivatives-liabilities . . . . . . . . . . . . . . . . . . . . . . . . . . . . . . . (23) — (23) —Cash equivalents . . . . . . . . . . . . . . . . . . . . . . . . . . . . . . . . . . . 670 670 — —
Pension plan assets:Asset backed securities . . . . . . . . . . . . . . . . . . . . . . . . . . $ 20 $— $ 19 $ 1Equity investments . . . . . . . . . . . . . . . . . . . . . . . . . . . . . 751 707 43 1Preferred stock . . . . . . . . . . . . . . . . . . . . . . . . . . . . . . . . 2 2 — —Government securities . . . . . . . . . . . . . . . . . . . . . . . . . . . 702 — 702 —Corporate debt investments . . . . . . . . . . . . . . . . . . . . . . . 548 — 536 12Partnerships and joint ventures . . . . . . . . . . . . . . . . . . . . 104 — — 104Real estate . . . . . . . . . . . . . . . . . . . . . . . . . . . . . . . . . . . . 45 — — 45Common collective trust . . . . . . . . . . . . . . . . . . . . . . . . . 1,125 — 1,125 —Registered investment companies . . . . . . . . . . . . . . . . . . 55 — 55 —103-12 investment entities . . . . . . . . . . . . . . . . . . . . . . . 114 — 114 —Other pension (payables) receivables . . . . . . . . . . . . . . . (4) (32) 7 21
Total pension plan assets . . . . . . . . . . . . . . . . . . . . . $3,462 $677 $2,601 $184
Non-recurring fair value measurements:Long-lived assets held and used . . . . . . . . . . . . . . . . . . . . . . . $ 1 $— $ — $ 1Long-lived assets held for sale . . . . . . . . . . . . . . . . . . . . . . . . 8 — — 8
(1) Quoted prices in active markets for identical assets.(2) Quoted prices for similar assets and liabilities in active markets.(3) Significant unobservable inputs.
The following information is presented for those assets measured at fair value on a recurring basis usingsignificant unobservable inputs (Level 3) at December 31, 2009:
In millions
Assetbackedsecurities
Equityinvestments
Governmentsecurities
Corporatedebt
investments
Partnershipsand jointventures
Realestate
Otherpension
receivablesand
payables Total
December 31, 2008 . . . $ 1 $— $ 40 $ 49 $133 $ 61 $ 282 $ 566Purchases . . . . . . . 1 2 — 4 19 6 4 36Sales . . . . . . . . . . (1) (1) (11) (27) (37) (1) (209) (287)Realized gains(losses) . . . . . . — — (1) (3) (10) — 208 194
Unrealized gains(losses) . . . . . . — — 2 4 (1) (21) (264) (280)
Transfers in (out)of Level 3 . . . . — — (30) (15) — — — (45)
December 31, 2009 . . . $ 1 $ 1 $— $ 12 $104 $ 45 $ 21 $ 184
53
NOTES TO CONSOLIDATED FINANCIAL STATEMENTS—(Continued)
The fair values of the pension plan assets were determined using a market approach based on quoted pricesin active markets for identical or similar assets or where there were no observable market inputs an incomeapproach based on estimated investment returns and cash flows.
Long-lived assets held and used with a carrying value of $81 million were written down to their estimatedfair value of $1 million, resulting in an impairment charge of $80 million for the year ended December 31, 2009.In addition, long-lived assets held for sale with a carrying value of $27 million were written down to theirestimated fair value of $8 million, resulting in an impairment charge of $19 million for the year endedDecember 31, 2009. Of these impairment charges totaling $99 million, $96 million is included in cost of salesand $3 million is included in selling, general and administrative expenses. A combination of a market approachbased on market participant inputs and an income approach based on estimates of future cash flows was used todetermine the fair values of the above long-lived assets.
At December 31, 2009, the book value of financial instruments included in debt is $2.2 billion and the fairvalue is estimated to be $2.3 billion. The difference between book value and fair value is derived from thedifference between the period-end market interest rate and the stated rate for the company’s fixed-rate, long-termdebt. The company has estimated the fair value of financial instruments based upon quoted market prices for thesame or similar issues or on the current interest rates available to the company for debt of similar terms andmaturities.
B. Current assets
Cash equivalents of $670 million and $381 million at December 31, 2009 and 2008, respectively, are valuedat cost, which approximates fair value. As of December 31, 2009 and 2008, the majority of the company’s cashequivalents were invested in U.S. government securities. Trade receivables have been reduced by an allowancefor doubtful accounts of $27 million and $19 million at December 31, 2009 and 2008, respectively. Receivablesalso include $138 million and $60 million from sources other than trade at December 31, 2009 and 2008,respectively. Inventories at December 31, 2009 and 2008 are comprised of:
December 31,
In millions 2009 2008
Raw materials . . . . . . . . . . . . . . . . . . . . . . . . . . . . . . . . . . . . . . . . . . . . . . . . . . . . . . . . . $144 $174Production materials, stores and supplies . . . . . . . . . . . . . . . . . . . . . . . . . . . . . . . . . . . . 83 90Finished and in-process goods . . . . . . . . . . . . . . . . . . . . . . . . . . . . . . . . . . . . . . . . . . . . 363 431
$590 $695
Approximately 56% and 58% of inventories at December 31, 2009 and 2008, respectively, are valued usingthe last-in, first-out (“LIFO”) method. If inventories had been valued at current cost, they would have been $756million and $841 million at December 31, 2009 and 2008, respectively. The effect of a LIFO layer decrements in2009 was an increase of $0.03 to earnings per share for the year ended December 31 2009. The effects of LIFOlayer decrements were not significant to the company’s consolidated statements of operations for the years endedDecember 31, 2008 and 2007.
54
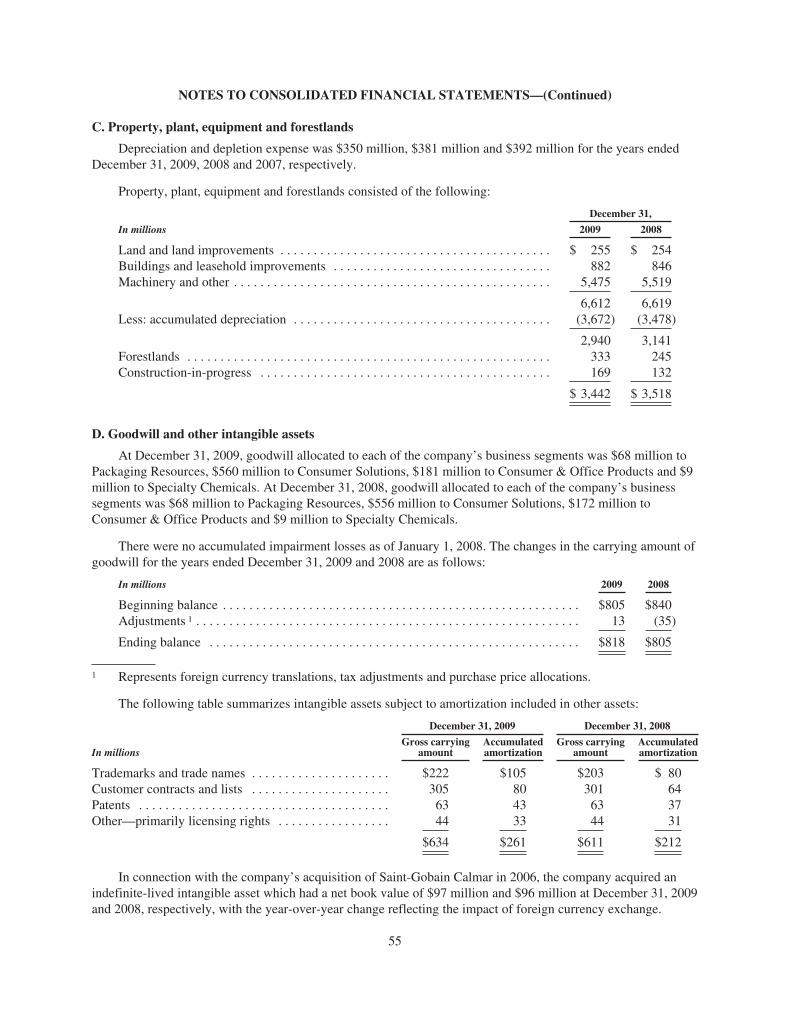
NOTES TO CONSOLIDATED FINANCIAL STATEMENTS—(Continued)
C. Property, plant, equipment and forestlands
Depreciation and depletion expense was $350 million, $381 million and $392 million for the years endedDecember 31, 2009, 2008 and 2007, respectively.
Property, plant, equipment and forestlands consisted of the following:
December 31,
In millions 2009 2008
Land and land improvements . . . . . . . . . . . . . . . . . . . . . . . . . . . . . . . . . . . . . . . . . $ 255 $ 254Buildings and leasehold improvements . . . . . . . . . . . . . . . . . . . . . . . . . . . . . . . . . 882 846Machinery and other . . . . . . . . . . . . . . . . . . . . . . . . . . . . . . . . . . . . . . . . . . . . . . . . 5,475 5,519
6,612 6,619Less: accumulated depreciation . . . . . . . . . . . . . . . . . . . . . . . . . . . . . . . . . . . . . . . (3,672) (3,478)
2,940 3,141Forestlands . . . . . . . . . . . . . . . . . . . . . . . . . . . . . . . . . . . . . . . . . . . . . . . . . . . . . . . 333 245Construction-in-progress . . . . . . . . . . . . . . . . . . . . . . . . . . . . . . . . . . . . . . . . . . . . 169 132
$ 3,442 $ 3,518
D. Goodwill and other intangible assets
At December 31, 2009, goodwill allocated to each of the company’s business segments was $68 million toPackaging Resources, $560 million to Consumer Solutions, $181 million to Consumer & Office Products and $9million to Specialty Chemicals. At December 31, 2008, goodwill allocated to each of the company’s businesssegments was $68 million to Packaging Resources, $556 million to Consumer Solutions, $172 million toConsumer & Office Products and $9 million to Specialty Chemicals.
There were no accumulated impairment losses as of January 1, 2008. The changes in the carrying amount ofgoodwill for the years ended December 31, 2009 and 2008 are as follows:
In millions 2009 2008
Beginning balance . . . . . . . . . . . . . . . . . . . . . . . . . . . . . . . . . . . . . . . . . . . . . . . . . . . . . . $805 $840Adjustments 1 . . . . . . . . . . . . . . . . . . . . . . . . . . . . . . . . . . . . . . . . . . . . . . . . . . . . . . . . . . 13 (35)
Ending balance . . . . . . . . . . . . . . . . . . . . . . . . . . . . . . . . . . . . . . . . . . . . . . . . . . . . . . . . $818 $805
1 Represents foreign currency translations, tax adjustments and purchase price allocations.
The following table summarizes intangible assets subject to amortization included in other assets:
December 31, 2009 December 31, 2008
In millionsGross carrying
amountAccumulatedamortization
Gross carryingamount
Accumulatedamortization
Trademarks and trade names . . . . . . . . . . . . . . . . . . . . . $222 $105 $203 $ 80Customer contracts and lists . . . . . . . . . . . . . . . . . . . . . 305 80 301 64Patents . . . . . . . . . . . . . . . . . . . . . . . . . . . . . . . . . . . . . . 63 43 63 37Other—primarily licensing rights . . . . . . . . . . . . . . . . . 44 33 44 31
$634 $261 $611 $212
In connection with the company’s acquisition of Saint-Gobain Calmar in 2006, the company acquired anindefinite-lived intangible asset which had a net book value of $97 million and $96 million at December 31, 2009and 2008, respectively, with the year-over-year change reflecting the impact of foreign currency exchange.
55
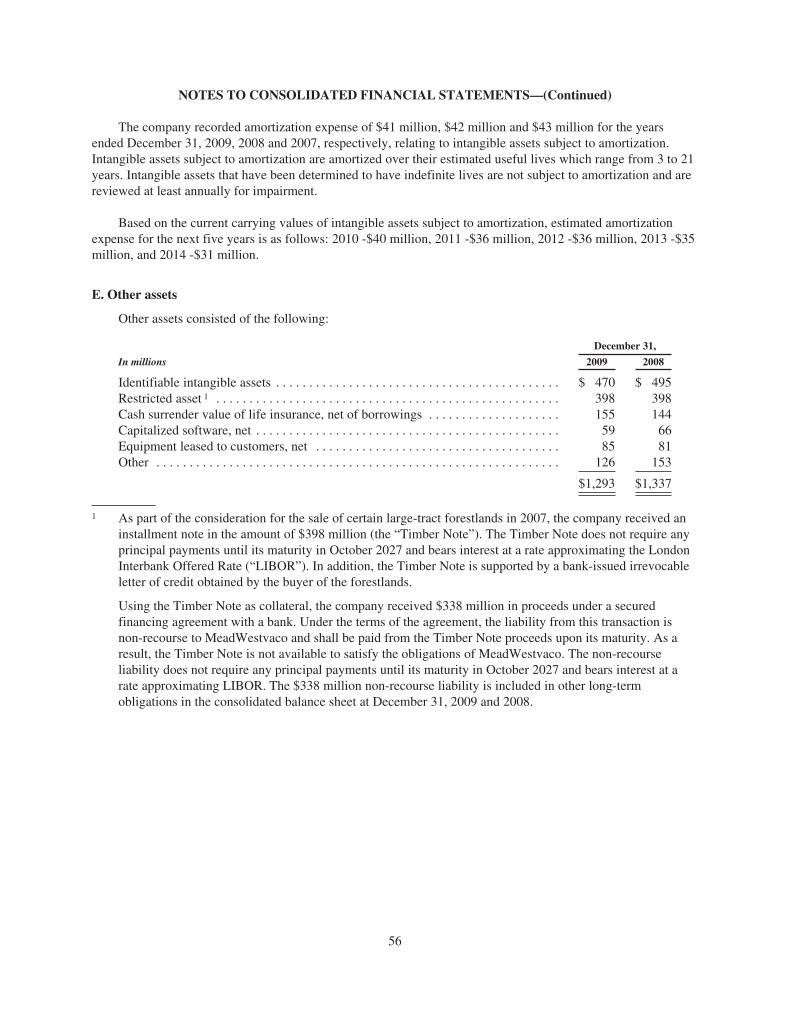
NOTES TO CONSOLIDATED FINANCIAL STATEMENTS—(Continued)
The company recorded amortization expense of $41 million, $42 million and $43 million for the yearsended December 31, 2009, 2008 and 2007, respectively, relating to intangible assets subject to amortization.Intangible assets subject to amortization are amortized over their estimated useful lives which range from 3 to 21years. Intangible assets that have been determined to have indefinite lives are not subject to amortization and arereviewed at least annually for impairment.
Based on the current carrying values of intangible assets subject to amortization, estimated amortizationexpense for the next five years is as follows: 2010 -$40 million, 2011 -$36 million, 2012 -$36 million, 2013 -$35million, and 2014 -$31 million.
E. Other assets
Other assets consisted of the following:
December 31,
In millions 2009 2008
Identifiable intangible assets . . . . . . . . . . . . . . . . . . . . . . . . . . . . . . . . . . . . . . . . . . . $ 470 $ 495Restricted asset 1 . . . . . . . . . . . . . . . . . . . . . . . . . . . . . . . . . . . . . . . . . . . . . . . . . . . . 398 398Cash surrender value of life insurance, net of borrowings . . . . . . . . . . . . . . . . . . . . 155 144Capitalized software, net . . . . . . . . . . . . . . . . . . . . . . . . . . . . . . . . . . . . . . . . . . . . . . 59 66Equipment leased to customers, net . . . . . . . . . . . . . . . . . . . . . . . . . . . . . . . . . . . . . 85 81Other . . . . . . . . . . . . . . . . . . . . . . . . . . . . . . . . . . . . . . . . . . . . . . . . . . . . . . . . . . . . . 126 153
$1,293 $1,337
1 As part of the consideration for the sale of certain large-tract forestlands in 2007, the company received aninstallment note in the amount of $398 million (the “Timber Note”). The Timber Note does not require anyprincipal payments until its maturity in October 2027 and bears interest at a rate approximating the LondonInterbank Offered Rate (“LIBOR”). In addition, the Timber Note is supported by a bank-issued irrevocableletter of credit obtained by the buyer of the forestlands.
Using the Timber Note as collateral, the company received $338 million in proceeds under a securedfinancing agreement with a bank. Under the terms of the agreement, the liability from this transaction isnon-recourse to MeadWestvaco and shall be paid from the Timber Note proceeds upon its maturity. As aresult, the Timber Note is not available to satisfy the obligations of MeadWestvaco. The non-recourseliability does not require any principal payments until its maturity in October 2027 and bears interest at arate approximating LIBOR. The $338 million non-recourse liability is included in other long-termobligations in the consolidated balance sheet at December 31, 2009 and 2008.
56
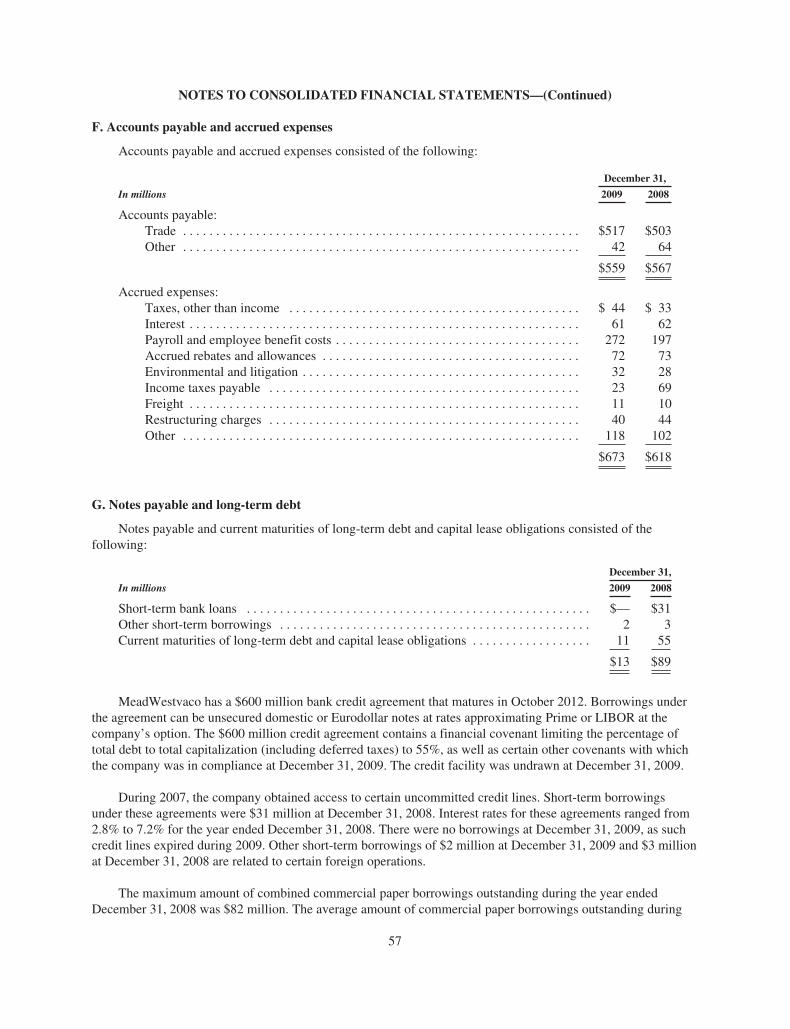
NOTES TO CONSOLIDATED FINANCIAL STATEMENTS—(Continued)
F. Accounts payable and accrued expenses
Accounts payable and accrued expenses consisted of the following:
December 31,
In millions 2009 2008
Accounts payable:Trade . . . . . . . . . . . . . . . . . . . . . . . . . . . . . . . . . . . . . . . . . . . . . . . . . . . . . . . . . . . . $517 $503Other . . . . . . . . . . . . . . . . . . . . . . . . . . . . . . . . . . . . . . . . . . . . . . . . . . . . . . . . . . . . 42 64
$559 $567
Accrued expenses:Taxes, other than income . . . . . . . . . . . . . . . . . . . . . . . . . . . . . . . . . . . . . . . . . . . . $ 44 $ 33Interest . . . . . . . . . . . . . . . . . . . . . . . . . . . . . . . . . . . . . . . . . . . . . . . . . . . . . . . . . . . 61 62Payroll and employee benefit costs . . . . . . . . . . . . . . . . . . . . . . . . . . . . . . . . . . . . . 272 197Accrued rebates and allowances . . . . . . . . . . . . . . . . . . . . . . . . . . . . . . . . . . . . . . . 72 73Environmental and litigation . . . . . . . . . . . . . . . . . . . . . . . . . . . . . . . . . . . . . . . . . . 32 28Income taxes payable . . . . . . . . . . . . . . . . . . . . . . . . . . . . . . . . . . . . . . . . . . . . . . . 23 69Freight . . . . . . . . . . . . . . . . . . . . . . . . . . . . . . . . . . . . . . . . . . . . . . . . . . . . . . . . . . . 11 10Restructuring charges . . . . . . . . . . . . . . . . . . . . . . . . . . . . . . . . . . . . . . . . . . . . . . . 40 44Other . . . . . . . . . . . . . . . . . . . . . . . . . . . . . . . . . . . . . . . . . . . . . . . . . . . . . . . . . . . . 118 102
$673 $618
G. Notes payable and long-term debt
Notes payable and current maturities of long-term debt and capital lease obligations consisted of thefollowing:
December 31,
In millions 2009 2008
Short-term bank loans . . . . . . . . . . . . . . . . . . . . . . . . . . . . . . . . . . . . . . . . . . . . . . . . . . . . $— $31Other short-term borrowings . . . . . . . . . . . . . . . . . . . . . . . . . . . . . . . . . . . . . . . . . . . . . . . 2 3Current maturities of long-term debt and capital lease obligations . . . . . . . . . . . . . . . . . . 11 55
$13 $89
MeadWestvaco has a $600 million bank credit agreement that matures in October 2012. Borrowings underthe agreement can be unsecured domestic or Eurodollar notes at rates approximating Prime or LIBOR at thecompany’s option. The $600 million credit agreement contains a financial covenant limiting the percentage oftotal debt to total capitalization (including deferred taxes) to 55%, as well as certain other covenants with whichthe company was in compliance at December 31, 2009. The credit facility was undrawn at December 31, 2009.
During 2007, the company obtained access to certain uncommitted credit lines. Short-term borrowingsunder these agreements were $31 million at December 31, 2008. Interest rates for these agreements ranged from2.8% to 7.2% for the year ended December 31, 2008. There were no borrowings at December 31, 2009, as suchcredit lines expired during 2009. Other short-term borrowings of $2 million at December 31, 2009 and $3 millionat December 31, 2008 are related to certain foreign operations.
The maximum amount of combined commercial paper borrowings outstanding during the year endedDecember 31, 2008 was $82 million. The average amount of commercial paper borrowings outstanding during
57
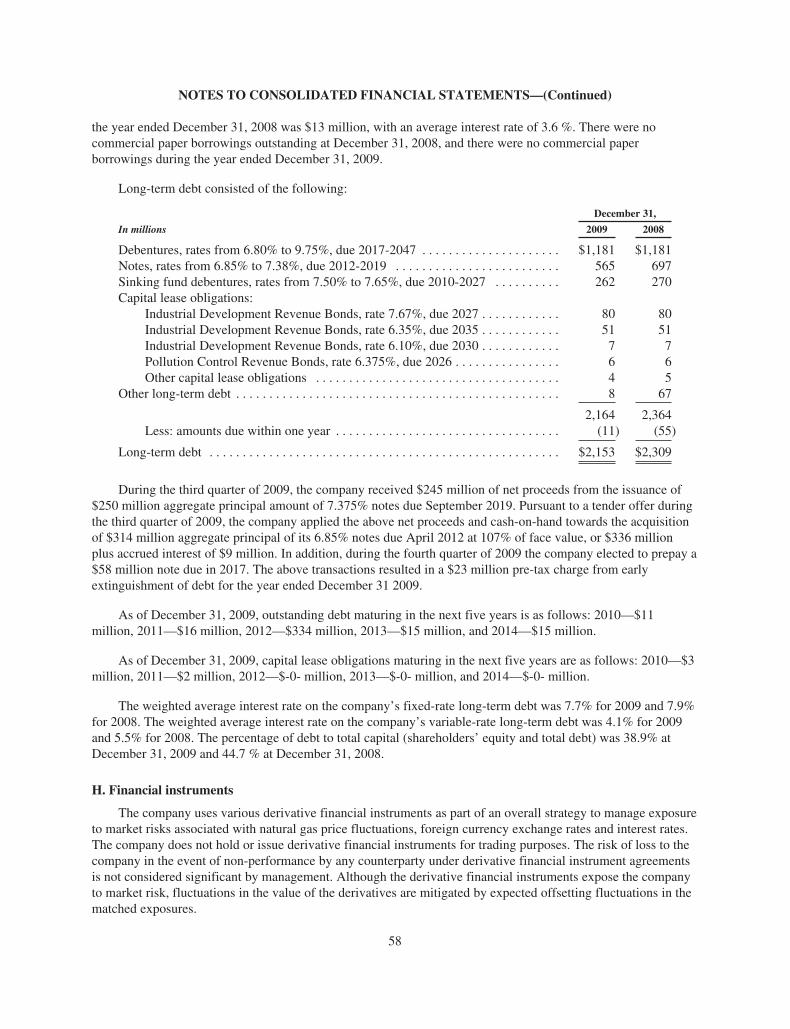
NOTES TO CONSOLIDATED FINANCIAL STATEMENTS—(Continued)
the year ended December 31, 2008 was $13 million, with an average interest rate of 3.6 %. There were nocommercial paper borrowings outstanding at December 31, 2008, and there were no commercial paperborrowings during the year ended December 31, 2009.
Long-term debt consisted of the following:
December 31,
In millions 2009 2008
Debentures, rates from 6.80% to 9.75%, due 2017-2047 . . . . . . . . . . . . . . . . . . . . . $1,181 $1,181Notes, rates from 6.85% to 7.38%, due 2012-2019 . . . . . . . . . . . . . . . . . . . . . . . . . 565 697Sinking fund debentures, rates from 7.50% to 7.65%, due 2010-2027 . . . . . . . . . . 262 270Capital lease obligations:
Industrial Development Revenue Bonds, rate 7.67%, due 2027 . . . . . . . . . . . . 80 80Industrial Development Revenue Bonds, rate 6.35%, due 2035 . . . . . . . . . . . . 51 51Industrial Development Revenue Bonds, rate 6.10%, due 2030 . . . . . . . . . . . . 7 7Pollution Control Revenue Bonds, rate 6.375%, due 2026 . . . . . . . . . . . . . . . . 6 6Other capital lease obligations . . . . . . . . . . . . . . . . . . . . . . . . . . . . . . . . . . . . . 4 5
Other long-term debt . . . . . . . . . . . . . . . . . . . . . . . . . . . . . . . . . . . . . . . . . . . . . . . . . 8 67
2,164 2,364Less: amounts due within one year . . . . . . . . . . . . . . . . . . . . . . . . . . . . . . . . . . (11) (55)
Long-term debt . . . . . . . . . . . . . . . . . . . . . . . . . . . . . . . . . . . . . . . . . . . . . . . . . . . . . $2,153 $2,309
During the third quarter of 2009, the company received $245 million of net proceeds from the issuance of$250 million aggregate principal amount of 7.375% notes due September 2019. Pursuant to a tender offer duringthe third quarter of 2009, the company applied the above net proceeds and cash-on-hand towards the acquisitionof $314 million aggregate principal of its 6.85% notes due April 2012 at 107% of face value, or $336 millionplus accrued interest of $9 million. In addition, during the fourth quarter of 2009 the company elected to prepay a$58 million note due in 2017. The above transactions resulted in a $23 million pre-tax charge from earlyextinguishment of debt for the year ended December 31 2009.
As of December 31, 2009, outstanding debt maturing in the next five years is as follows: 2010—$11million, 2011—$16 million, 2012—$334 million, 2013—$15 million, and 2014—$15 million.
As of December 31, 2009, capital lease obligations maturing in the next five years are as follows: 2010—$3million, 2011—$2 million, 2012—$-0- million, 2013—$-0- million, and 2014—$-0- million.
The weighted average interest rate on the company’s fixed-rate long-term debt was 7.7% for 2009 and 7.9%for 2008. The weighted average interest rate on the company’s variable-rate long-term debt was 4.1% for 2009and 5.5% for 2008. The percentage of debt to total capital (shareholders’ equity and total debt) was 38.9% atDecember 31, 2009 and 44.7 % at December 31, 2008.
H. Financial instruments
The company uses various derivative financial instruments as part of an overall strategy to manage exposureto market risks associated with natural gas price fluctuations, foreign currency exchange rates and interest rates.The company does not hold or issue derivative financial instruments for trading purposes. The risk of loss to thecompany in the event of non-performance by any counterparty under derivative financial instrument agreementsis not considered significant by management. Although the derivative financial instruments expose the companyto market risk, fluctuations in the value of the derivatives are mitigated by expected offsetting fluctuations in thematched exposures.
58
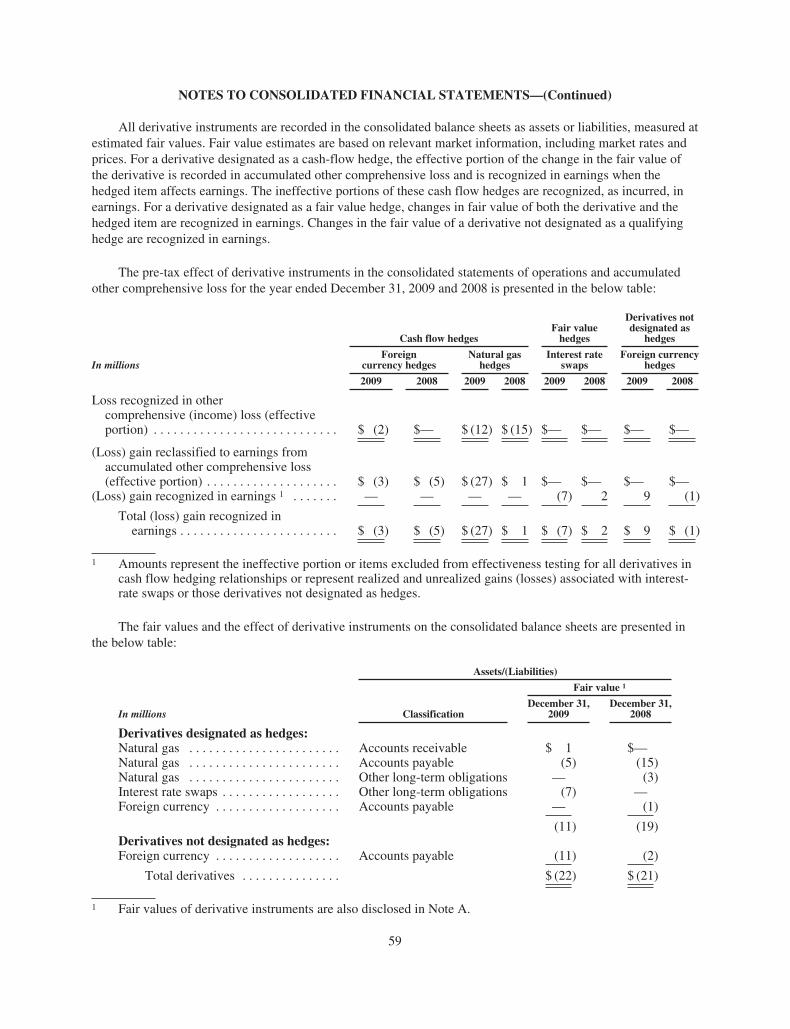
NOTES TO CONSOLIDATED FINANCIAL STATEMENTS—(Continued)
All derivative instruments are recorded in the consolidated balance sheets as assets or liabilities, measured atestimated fair values. Fair value estimates are based on relevant market information, including market rates andprices. For a derivative designated as a cash-flow hedge, the effective portion of the change in the fair value ofthe derivative is recorded in accumulated other comprehensive loss and is recognized in earnings when thehedged item affects earnings. The ineffective portions of these cash flow hedges are recognized, as incurred, inearnings. For a derivative designated as a fair value hedge, changes in fair value of both the derivative and thehedged item are recognized in earnings. Changes in the fair value of a derivative not designated as a qualifyinghedge are recognized in earnings.
The pre-tax effect of derivative instruments in the consolidated statements of operations and accumulatedother comprehensive loss for the year ended December 31, 2009 and 2008 is presented in the below table:
Cash flow hedgesFair valuehedges
Derivatives notdesignated as
hedges
In millionsForeign
currency hedgesNatural gas
hedgesInterest rate
swapsForeign currency
hedges
2009 2008 2009 2008 2009 2008 2009 2008
Loss recognized in othercomprehensive (income) loss (effectiveportion) . . . . . . . . . . . . . . . . . . . . . . . . . . . . $ (2) $— $ (12) $ (15) $— $— $— $—
(Loss) gain reclassified to earnings fromaccumulated other comprehensive loss(effective portion) . . . . . . . . . . . . . . . . . . . . $ (3) $ (5) $ (27) $ 1 $— $— $— $—
(Loss) gain recognized in earnings 1 . . . . . . . — — — — (7) 2 9 (1)
Total (loss) gain recognized inearnings . . . . . . . . . . . . . . . . . . . . . . . . $ (3) $ (5) $ (27) $ 1 $ (7) $ 2 $ 9 $ (1)
1 Amounts represent the ineffective portion or items excluded from effectiveness testing for all derivatives incash flow hedging relationships or represent realized and unrealized gains (losses) associated with interest-rate swaps or those derivatives not designated as hedges.
The fair values and the effect of derivative instruments on the consolidated balance sheets are presented inthe below table:
Assets/(Liabilities)
Fair value 1
In millions ClassificationDecember 31,
2009December 31,
2008
Derivatives designated as hedges:Natural gas . . . . . . . . . . . . . . . . . . . . . . . Accounts receivable $ 1 $—Natural gas . . . . . . . . . . . . . . . . . . . . . . . Accounts payable (5) (15)Natural gas . . . . . . . . . . . . . . . . . . . . . . . Other long-term obligations — (3)Interest rate swaps . . . . . . . . . . . . . . . . . . Other long-term obligations (7) —Foreign currency . . . . . . . . . . . . . . . . . . . Accounts payable — (1)
(11) (19)Derivatives not designated as hedges:Foreign currency . . . . . . . . . . . . . . . . . . . Accounts payable (11) (2)
Total derivatives . . . . . . . . . . . . . . . $ (22) $ (21)
1 Fair values of derivative instruments are also disclosed in Note A.
59
NOTES TO CONSOLIDATED FINANCIAL STATEMENTS—(Continued)
Natural gas
In order to better predict and manage the cash flows of natural gas consumed at certain of the company’smanufacturing facilities, the company engages in financial hedging of future gas purchase prices. Natural gasusage is relatively predictable month-by-month. The company hedges primarily with financial instruments thatare priced based on New York Mercantile Exchange (NYMEX) natural gas futures contracts. The notional valueof these contracts at December 31, 2009 and 2008 was $27 million and $61 million, respectively, and hedgedconsumption of 4 million and 7 million British Thermal Units of natural gas, respectively. The company does nothedge basis (the effect of varying delivery points or locations) or transportation (the cost to transport the naturalgas from the delivery point to a company location) under these transactions.
Unrealized gains and losses on contracts maturing in future months are recorded in accumulated othercomprehensive loss and are charged or credited to earnings for the ineffective portion of the hedge. Once acontract matures, the company has a realized gain or loss on the contract up to the quantities of natural gas in theforward swap agreements for that particular period, which are charged or credited to earnings when the relatedhedged item affects earnings. The ineffective portion of these cash flow hedges, as well as realized hedge gainsand losses, are recorded within cost of sales. The estimated pre-tax loss to be recognized in earnings during thenext twelve months is $4 million. As of December 31, 2009, the maximum remaining term of existing hedges istwo years. For the years ended December 31, 2009 and 2008, no gains or losses were recognized in earnings dueto the probability that forecasted transactions will not occur.
Foreign currency
The company uses foreign currency forward contracts to manage foreign currency exchange risks associatedwith certain short-term foreign inter-company loans, certain foreign cash deposits, certain foreign currency salesand purchases of its global operations, and certain foreign sales by its U.S. operations. These contracts are usedto hedge the variability of exchange rates on the company’s cash flows and cash deposits.
Forward contracts related to certain inter-company loans and foreign cash deposits are short term in durationand are not designated as hedging instruments. The total notional amount of these foreign currency forwardcontracts was $427 million and $170 million at December 31, 2009 and 2008, respectively. Gains and lossesrelated to these forward contracts are included in other income, net.
Other forward contracts, which are used to reduce the foreign currency exposure related to certain foreignand inter-company sales and are for terms of up to one year, are designated as cash flow hedges. For thesehedges, realized gains and losses are recorded in net sales concurrent with the recognition of the hedged sales.The ineffective portion of these hedges is also recorded in net sales. The total notional amount of these foreigncurrency forward contracts was $63 million and $78 million at December 31, 2009 and 2008, respectively. Theestimated pre-tax loss to be recognized in earnings during the next twelve months is not expected to besignificant. As of December 31, 2009, the maximum remaining term of existing hedges is twelve months. For theyears ended December 31, 2009 and 2008, no amounts of gains or losses were recognized in earnings due to theprobability that forecasted transactions will not occur.
Interest rates
The company has developed a targeted mix of fixed- and variable-rate debt as part of an overall strategy tomaintain an appropriate level of exposure to interest-rate fluctuations. To efficiently manage this mix, thecompany utilizes interest-rate swap agreements. The total notional amount of interest-rate swap instruments was$250 million at December 31, 2009. There were no outstanding interest-rate swaps at December 31, 2008. Forthe year ended December 31, 2009, the interest-rate swaps were an effective hedge and, therefore, required nocharge to earnings due to ineffectiveness. For these fair value hedges, changes in fair value of both the hedgeinstruments and hedged items are recorded in interest expense.
60
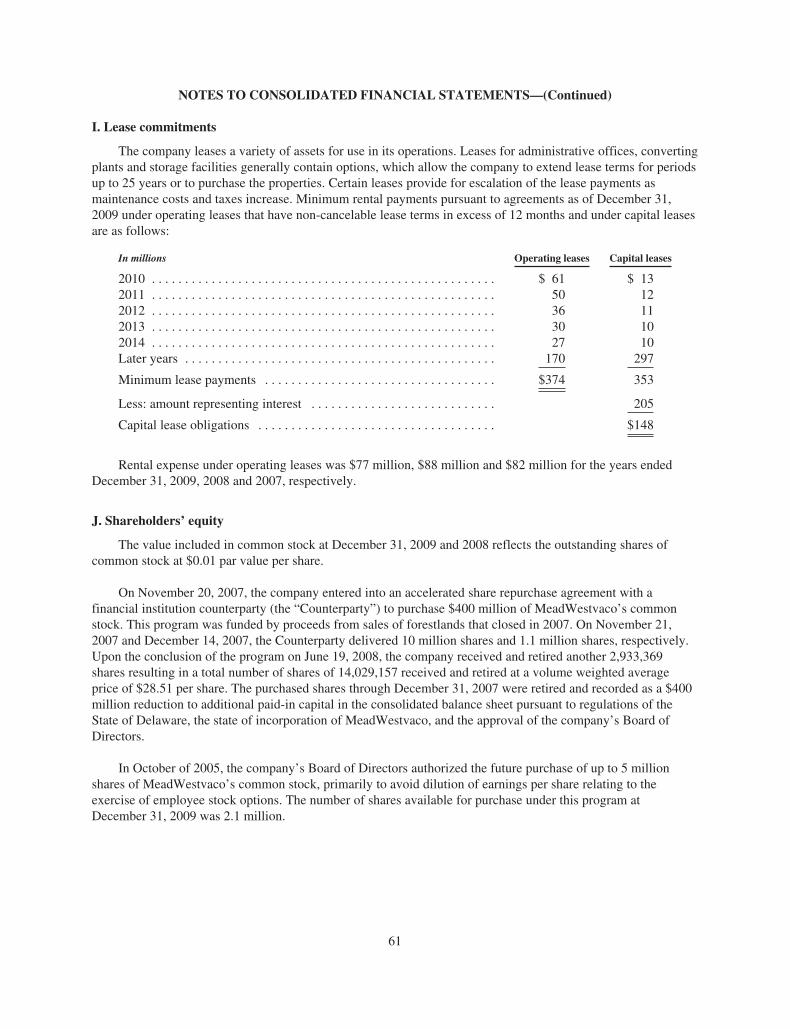
NOTES TO CONSOLIDATED FINANCIAL STATEMENTS—(Continued)
I. Lease commitments
The company leases a variety of assets for use in its operations. Leases for administrative offices, convertingplants and storage facilities generally contain options, which allow the company to extend lease terms for periodsup to 25 years or to purchase the properties. Certain leases provide for escalation of the lease payments asmaintenance costs and taxes increase. Minimum rental payments pursuant to agreements as of December 31,2009 under operating leases that have non-cancelable lease terms in excess of 12 months and under capital leasesare as follows:
In millions Operating leases Capital leases
2010 . . . . . . . . . . . . . . . . . . . . . . . . . . . . . . . . . . . . . . . . . . . . . . . . . . . . $ 61 $ 132011 . . . . . . . . . . . . . . . . . . . . . . . . . . . . . . . . . . . . . . . . . . . . . . . . . . . . 50 122012 . . . . . . . . . . . . . . . . . . . . . . . . . . . . . . . . . . . . . . . . . . . . . . . . . . . . 36 112013 . . . . . . . . . . . . . . . . . . . . . . . . . . . . . . . . . . . . . . . . . . . . . . . . . . . . 30 102014 . . . . . . . . . . . . . . . . . . . . . . . . . . . . . . . . . . . . . . . . . . . . . . . . . . . . 27 10Later years . . . . . . . . . . . . . . . . . . . . . . . . . . . . . . . . . . . . . . . . . . . . . . . 170 297
Minimum lease payments . . . . . . . . . . . . . . . . . . . . . . . . . . . . . . . . . . . $374 353
Less: amount representing interest . . . . . . . . . . . . . . . . . . . . . . . . . . . . 205
Capital lease obligations . . . . . . . . . . . . . . . . . . . . . . . . . . . . . . . . . . . . $148
Rental expense under operating leases was $77 million, $88 million and $82 million for the years endedDecember 31, 2009, 2008 and 2007, respectively.
J. Shareholders’ equity
The value included in common stock at December 31, 2009 and 2008 reflects the outstanding shares ofcommon stock at $0.01 par value per share.
On November 20, 2007, the company entered into an accelerated share repurchase agreement with afinancial institution counterparty (the “Counterparty”) to purchase $400 million of MeadWestvaco’s commonstock. This program was funded by proceeds from sales of forestlands that closed in 2007. On November 21,2007 and December 14, 2007, the Counterparty delivered 10 million shares and 1.1 million shares, respectively.Upon the conclusion of the program on June 19, 2008, the company received and retired another 2,933,369shares resulting in a total number of shares of 14,029,157 received and retired at a volume weighted averageprice of $28.51 per share. The purchased shares through December 31, 2007 were retired and recorded as a $400million reduction to additional paid-in capital in the consolidated balance sheet pursuant to regulations of theState of Delaware, the state of incorporation of MeadWestvaco, and the approval of the company’s Board ofDirectors.
In October of 2005, the company’s Board of Directors authorized the future purchase of up to 5 millionshares of MeadWestvaco’s common stock, primarily to avoid dilution of earnings per share relating to theexercise of employee stock options. The number of shares available for purchase under this program atDecember 31, 2009 was 2.1 million.
61
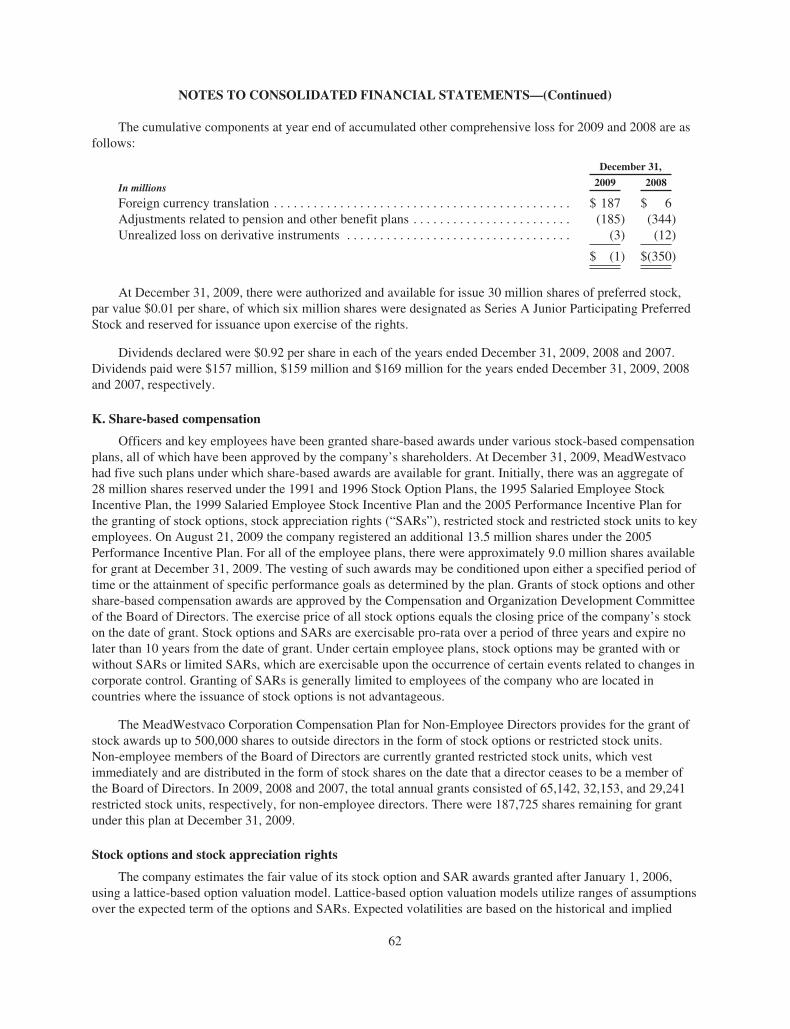
NOTES TO CONSOLIDATED FINANCIAL STATEMENTS—(Continued)
The cumulative components at year end of accumulated other comprehensive loss for 2009 and 2008 are asfollows:
In millions
December 31,
2009 2008
Foreign currency translation . . . . . . . . . . . . . . . . . . . . . . . . . . . . . . . . . . . . . . . . . . . . . $ 187 $ 6Adjustments related to pension and other benefit plans . . . . . . . . . . . . . . . . . . . . . . . . (185) (344)Unrealized loss on derivative instruments . . . . . . . . . . . . . . . . . . . . . . . . . . . . . . . . . . (3) (12)
$ (1) $(350)
At December 31, 2009, there were authorized and available for issue 30 million shares of preferred stock,par value $0.01 per share, of which six million shares were designated as Series A Junior Participating PreferredStock and reserved for issuance upon exercise of the rights.
Dividends declared were $0.92 per share in each of the years ended December 31, 2009, 2008 and 2007.Dividends paid were $157 million, $159 million and $169 million for the years ended December 31, 2009, 2008and 2007, respectively.
K. Share-based compensation
Officers and key employees have been granted share-based awards under various stock-based compensationplans, all of which have been approved by the company’s shareholders. At December 31, 2009, MeadWestvacohad five such plans under which share-based awards are available for grant. Initially, there was an aggregate of28 million shares reserved under the 1991 and 1996 Stock Option Plans, the 1995 Salaried Employee StockIncentive Plan, the 1999 Salaried Employee Stock Incentive Plan and the 2005 Performance Incentive Plan forthe granting of stock options, stock appreciation rights (“SARs”), restricted stock and restricted stock units to keyemployees. On August 21, 2009 the company registered an additional 13.5 million shares under the 2005Performance Incentive Plan. For all of the employee plans, there were approximately 9.0 million shares availablefor grant at December 31, 2009. The vesting of such awards may be conditioned upon either a specified period oftime or the attainment of specific performance goals as determined by the plan. Grants of stock options and othershare-based compensation awards are approved by the Compensation and Organization Development Committeeof the Board of Directors. The exercise price of all stock options equals the closing price of the company’s stockon the date of grant. Stock options and SARs are exercisable pro-rata over a period of three years and expire nolater than 10 years from the date of grant. Under certain employee plans, stock options may be granted with orwithout SARs or limited SARs, which are exercisable upon the occurrence of certain events related to changes incorporate control. Granting of SARs is generally limited to employees of the company who are located incountries where the issuance of stock options is not advantageous.
The MeadWestvaco Corporation Compensation Plan for Non-Employee Directors provides for the grant ofstock awards up to 500,000 shares to outside directors in the form of stock options or restricted stock units.Non-employee members of the Board of Directors are currently granted restricted stock units, which vestimmediately and are distributed in the form of stock shares on the date that a director ceases to be a member ofthe Board of Directors. In 2009, 2008 and 2007, the total annual grants consisted of 65,142, 32,153, and 29,241restricted stock units, respectively, for non-employee directors. There were 187,725 shares remaining for grantunder this plan at December 31, 2009.
Stock options and stock appreciation rights
The company estimates the fair value of its stock option and SAR awards granted after January 1, 2006,using a lattice-based option valuation model. Lattice-based option valuation models utilize ranges of assumptionsover the expected term of the options and SARs. Expected volatilities are based on the historical and implied
62
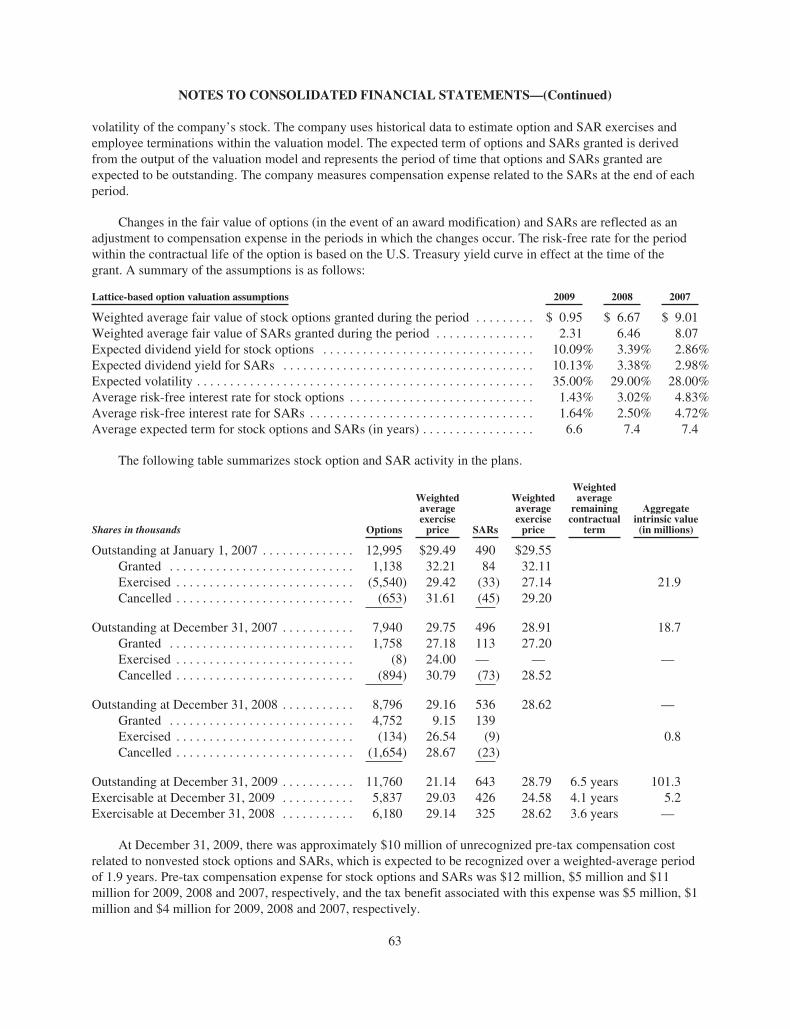
NOTES TO CONSOLIDATED FINANCIAL STATEMENTS—(Continued)
volatility of the company’s stock. The company uses historical data to estimate option and SAR exercises andemployee terminations within the valuation model. The expected term of options and SARs granted is derivedfrom the output of the valuation model and represents the period of time that options and SARs granted areexpected to be outstanding. The company measures compensation expense related to the SARs at the end of eachperiod.
Changes in the fair value of options (in the event of an award modification) and SARs are reflected as anadjustment to compensation expense in the periods in which the changes occur. The risk-free rate for the periodwithin the contractual life of the option is based on the U.S. Treasury yield curve in effect at the time of thegrant. A summary of the assumptions is as follows:
Lattice-based option valuation assumptions 2009 2008 2007
Weighted average fair value of stock options granted during the period . . . . . . . . . $ 0.95 $ 6.67 $ 9.01Weighted average fair value of SARs granted during the period . . . . . . . . . . . . . . . 2.31 6.46 8.07Expected dividend yield for stock options . . . . . . . . . . . . . . . . . . . . . . . . . . . . . . . . 10.09% 3.39% 2.86%Expected dividend yield for SARs . . . . . . . . . . . . . . . . . . . . . . . . . . . . . . . . . . . . . . 10.13% 3.38% 2.98%Expected volatility . . . . . . . . . . . . . . . . . . . . . . . . . . . . . . . . . . . . . . . . . . . . . . . . . . . 35.00% 29.00% 28.00%Average risk-free interest rate for stock options . . . . . . . . . . . . . . . . . . . . . . . . . . . . 1.43% 3.02% 4.83%Average risk-free interest rate for SARs . . . . . . . . . . . . . . . . . . . . . . . . . . . . . . . . . . 1.64% 2.50% 4.72%Average expected term for stock options and SARs (in years) . . . . . . . . . . . . . . . . . 6.6 7.4 7.4
The following table summarizes stock option and SAR activity in the plans.
Shares in thousands Options
Weightedaverageexerciseprice SARs
Weightedaverageexerciseprice
Weightedaverage
remainingcontractual
term
Aggregateintrinsic value(in millions)
Outstanding at January 1, 2007 . . . . . . . . . . . . . . 12,995 $29.49 490 $29.55Granted . . . . . . . . . . . . . . . . . . . . . . . . . . . . 1,138 32.21 84 32.11Exercised . . . . . . . . . . . . . . . . . . . . . . . . . . . (5,540) 29.42 (33) 27.14 21.9Cancelled . . . . . . . . . . . . . . . . . . . . . . . . . . . (653) 31.61 (45) 29.20
Outstanding at December 31, 2007 . . . . . . . . . . . 7,940 29.75 496 28.91 18.7Granted . . . . . . . . . . . . . . . . . . . . . . . . . . . . 1,758 27.18 113 27.20Exercised . . . . . . . . . . . . . . . . . . . . . . . . . . . (8) 24.00 — — —Cancelled . . . . . . . . . . . . . . . . . . . . . . . . . . . (894) 30.79 (73) 28.52
Outstanding at December 31, 2008 . . . . . . . . . . . 8,796 29.16 536 28.62 —Granted . . . . . . . . . . . . . . . . . . . . . . . . . . . . 4,752 9.15 139Exercised . . . . . . . . . . . . . . . . . . . . . . . . . . . (134) 26.54 (9) 0.8Cancelled . . . . . . . . . . . . . . . . . . . . . . . . . . . (1,654) 28.67 (23)
Outstanding at December 31, 2009 . . . . . . . . . . . 11,760 21.14 643 28.79 6.5 years 101.3Exercisable at December 31, 2009 . . . . . . . . . . . 5,837 29.03 426 24.58 4.1 years 5.2Exercisable at December 31, 2008 . . . . . . . . . . . 6,180 29.14 325 28.62 3.6 years —
At December 31, 2009, there was approximately $10 million of unrecognized pre-tax compensation costrelated to nonvested stock options and SARs, which is expected to be recognized over a weighted-average periodof 1.9 years. Pre-tax compensation expense for stock options and SARs was $12 million, $5 million and $11million for 2009, 2008 and 2007, respectively, and the tax benefit associated with this expense was $5 million, $1million and $4 million for 2009, 2008 and 2007, respectively.
63
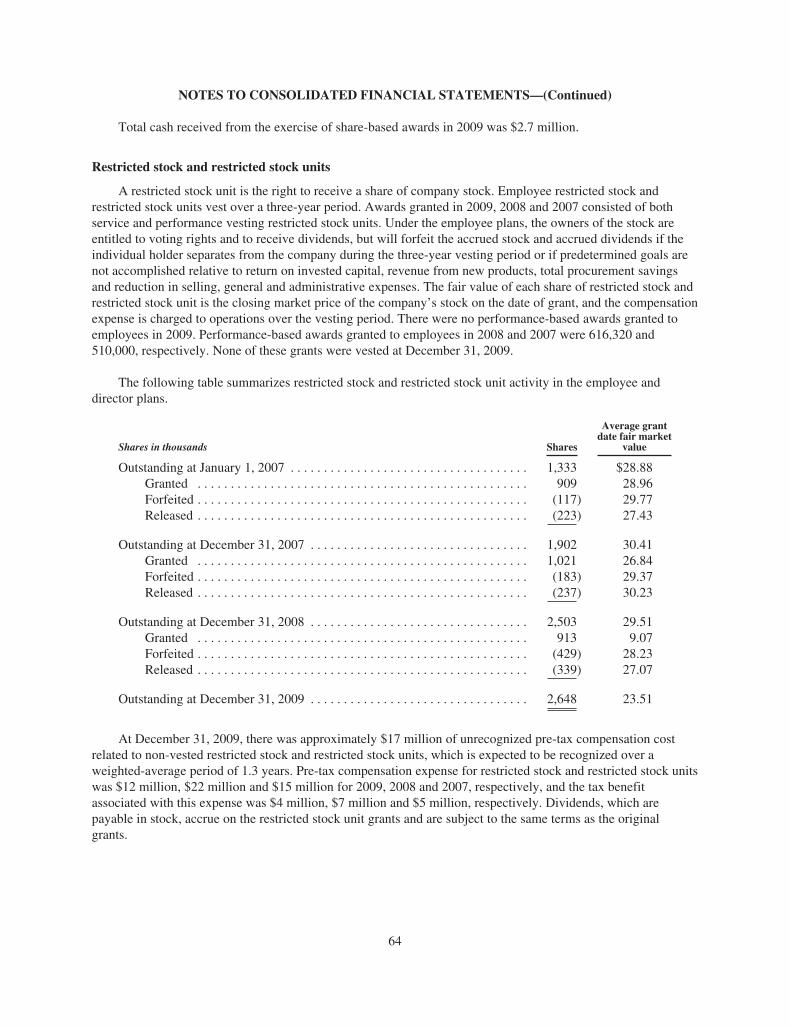
NOTES TO CONSOLIDATED FINANCIAL STATEMENTS—(Continued)
Total cash received from the exercise of share-based awards in 2009 was $2.7 million.
Restricted stock and restricted stock units
A restricted stock unit is the right to receive a share of company stock. Employee restricted stock andrestricted stock units vest over a three-year period. Awards granted in 2009, 2008 and 2007 consisted of bothservice and performance vesting restricted stock units. Under the employee plans, the owners of the stock areentitled to voting rights and to receive dividends, but will forfeit the accrued stock and accrued dividends if theindividual holder separates from the company during the three-year vesting period or if predetermined goals arenot accomplished relative to return on invested capital, revenue from new products, total procurement savingsand reduction in selling, general and administrative expenses. The fair value of each share of restricted stock andrestricted stock unit is the closing market price of the company’s stock on the date of grant, and the compensationexpense is charged to operations over the vesting period. There were no performance-based awards granted toemployees in 2009. Performance-based awards granted to employees in 2008 and 2007 were 616,320 and510,000, respectively. None of these grants were vested at December 31, 2009.
The following table summarizes restricted stock and restricted stock unit activity in the employee anddirector plans.
Shares in thousands Shares
Average grantdate fair market
value
Outstanding at January 1, 2007 . . . . . . . . . . . . . . . . . . . . . . . . . . . . . . . . . . . . 1,333 $28.88Granted . . . . . . . . . . . . . . . . . . . . . . . . . . . . . . . . . . . . . . . . . . . . . . . . . . 909 28.96Forfeited . . . . . . . . . . . . . . . . . . . . . . . . . . . . . . . . . . . . . . . . . . . . . . . . . . (117) 29.77Released . . . . . . . . . . . . . . . . . . . . . . . . . . . . . . . . . . . . . . . . . . . . . . . . . . (223) 27.43
Outstanding at December 31, 2007 . . . . . . . . . . . . . . . . . . . . . . . . . . . . . . . . . 1,902 30.41Granted . . . . . . . . . . . . . . . . . . . . . . . . . . . . . . . . . . . . . . . . . . . . . . . . . . 1,021 26.84Forfeited . . . . . . . . . . . . . . . . . . . . . . . . . . . . . . . . . . . . . . . . . . . . . . . . . . (183) 29.37Released . . . . . . . . . . . . . . . . . . . . . . . . . . . . . . . . . . . . . . . . . . . . . . . . . . (237) 30.23
Outstanding at December 31, 2008 . . . . . . . . . . . . . . . . . . . . . . . . . . . . . . . . . 2,503 29.51Granted . . . . . . . . . . . . . . . . . . . . . . . . . . . . . . . . . . . . . . . . . . . . . . . . . . 913 9.07Forfeited . . . . . . . . . . . . . . . . . . . . . . . . . . . . . . . . . . . . . . . . . . . . . . . . . . (429) 28.23Released . . . . . . . . . . . . . . . . . . . . . . . . . . . . . . . . . . . . . . . . . . . . . . . . . . (339) 27.07
Outstanding at December 31, 2009 . . . . . . . . . . . . . . . . . . . . . . . . . . . . . . . . . 2,648 23.51
At December 31, 2009, there was approximately $17 million of unrecognized pre-tax compensation costrelated to non-vested restricted stock and restricted stock units, which is expected to be recognized over aweighted-average period of 1.3 years. Pre-tax compensation expense for restricted stock and restricted stock unitswas $12 million, $22 million and $15 million for 2009, 2008 and 2007, respectively, and the tax benefitassociated with this expense was $4 million, $7 million and $5 million, respectively. Dividends, which arepayable in stock, accrue on the restricted stock unit grants and are subject to the same terms as the originalgrants.
64
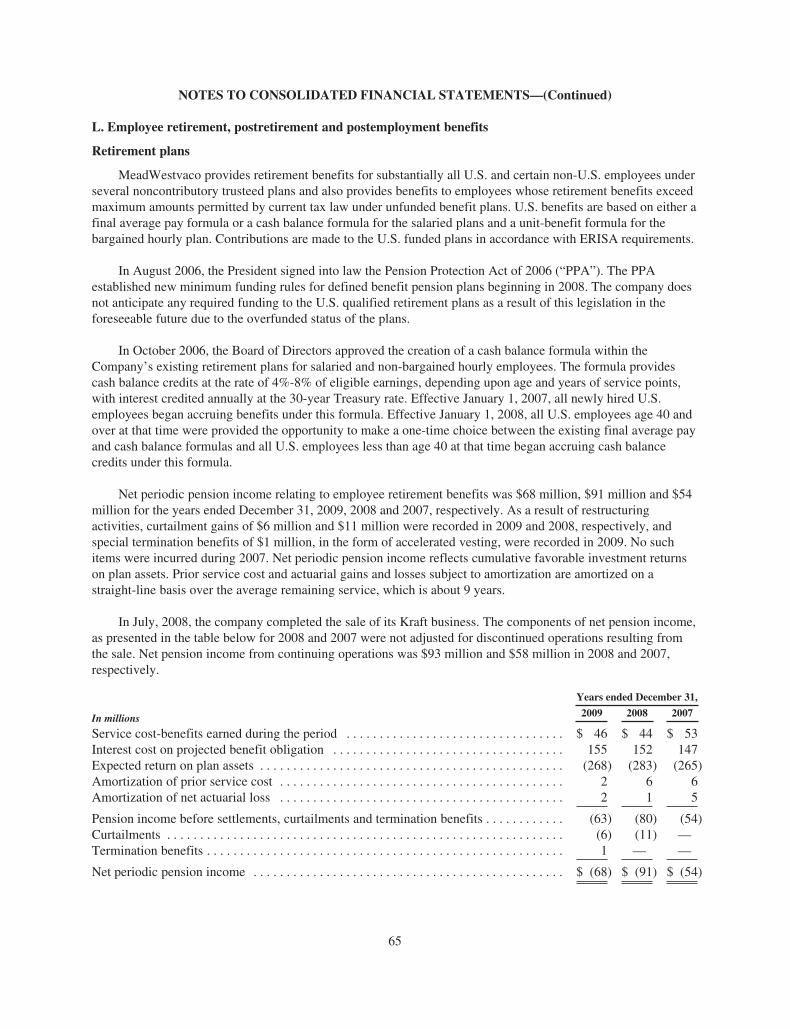
NOTES TO CONSOLIDATED FINANCIAL STATEMENTS—(Continued)
L. Employee retirement, postretirement and postemployment benefits
Retirement plans
MeadWestvaco provides retirement benefits for substantially all U.S. and certain non-U.S. employees underseveral noncontributory trusteed plans and also provides benefits to employees whose retirement benefits exceedmaximum amounts permitted by current tax law under unfunded benefit plans. U.S. benefits are based on either afinal average pay formula or a cash balance formula for the salaried plans and a unit-benefit formula for thebargained hourly plan. Contributions are made to the U.S. funded plans in accordance with ERISA requirements.
In August 2006, the President signed into law the Pension Protection Act of 2006 (“PPA”). The PPAestablished new minimum funding rules for defined benefit pension plans beginning in 2008. The company doesnot anticipate any required funding to the U.S. qualified retirement plans as a result of this legislation in theforeseeable future due to the overfunded status of the plans.
In October 2006, the Board of Directors approved the creation of a cash balance formula within theCompany’s existing retirement plans for salaried and non-bargained hourly employees. The formula providescash balance credits at the rate of 4%-8% of eligible earnings, depending upon age and years of service points,with interest credited annually at the 30-year Treasury rate. Effective January 1, 2007, all newly hired U.S.employees began accruing benefits under this formula. Effective January 1, 2008, all U.S. employees age 40 andover at that time were provided the opportunity to make a one-time choice between the existing final average payand cash balance formulas and all U.S. employees less than age 40 at that time began accruing cash balancecredits under this formula.
Net periodic pension income relating to employee retirement benefits was $68 million, $91 million and $54million for the years ended December 31, 2009, 2008 and 2007, respectively. As a result of restructuringactivities, curtailment gains of $6 million and $11 million were recorded in 2009 and 2008, respectively, andspecial termination benefits of $1 million, in the form of accelerated vesting, were recorded in 2009. No suchitems were incurred during 2007. Net periodic pension income reflects cumulative favorable investment returnson plan assets. Prior service cost and actuarial gains and losses subject to amortization are amortized on astraight-line basis over the average remaining service, which is about 9 years.
In July, 2008, the company completed the sale of its Kraft business. The components of net pension income,as presented in the table below for 2008 and 2007 were not adjusted for discontinued operations resulting fromthe sale. Net pension income from continuing operations was $93 million and $58 million in 2008 and 2007,respectively.
In millions
Years ended December 31,
2009 2008 2007
Service cost-benefits earned during the period . . . . . . . . . . . . . . . . . . . . . . . . . . . . . . . . . $ 46 $ 44 $ 53Interest cost on projected benefit obligation . . . . . . . . . . . . . . . . . . . . . . . . . . . . . . . . . . . 155 152 147Expected return on plan assets . . . . . . . . . . . . . . . . . . . . . . . . . . . . . . . . . . . . . . . . . . . . . . (268) (283) (265)Amortization of prior service cost . . . . . . . . . . . . . . . . . . . . . . . . . . . . . . . . . . . . . . . . . . . 2 6 6Amortization of net actuarial loss . . . . . . . . . . . . . . . . . . . . . . . . . . . . . . . . . . . . . . . . . . . 2 1 5
Pension income before settlements, curtailments and termination benefits . . . . . . . . . . . . (63) (80) (54)Curtailments . . . . . . . . . . . . . . . . . . . . . . . . . . . . . . . . . . . . . . . . . . . . . . . . . . . . . . . . . . . . (6) (11) —Termination benefits . . . . . . . . . . . . . . . . . . . . . . . . . . . . . . . . . . . . . . . . . . . . . . . . . . . . . . 1 — —
Net periodic pension income . . . . . . . . . . . . . . . . . . . . . . . . . . . . . . . . . . . . . . . . . . . . . . . $ (68) $ (91) $ (54)
65
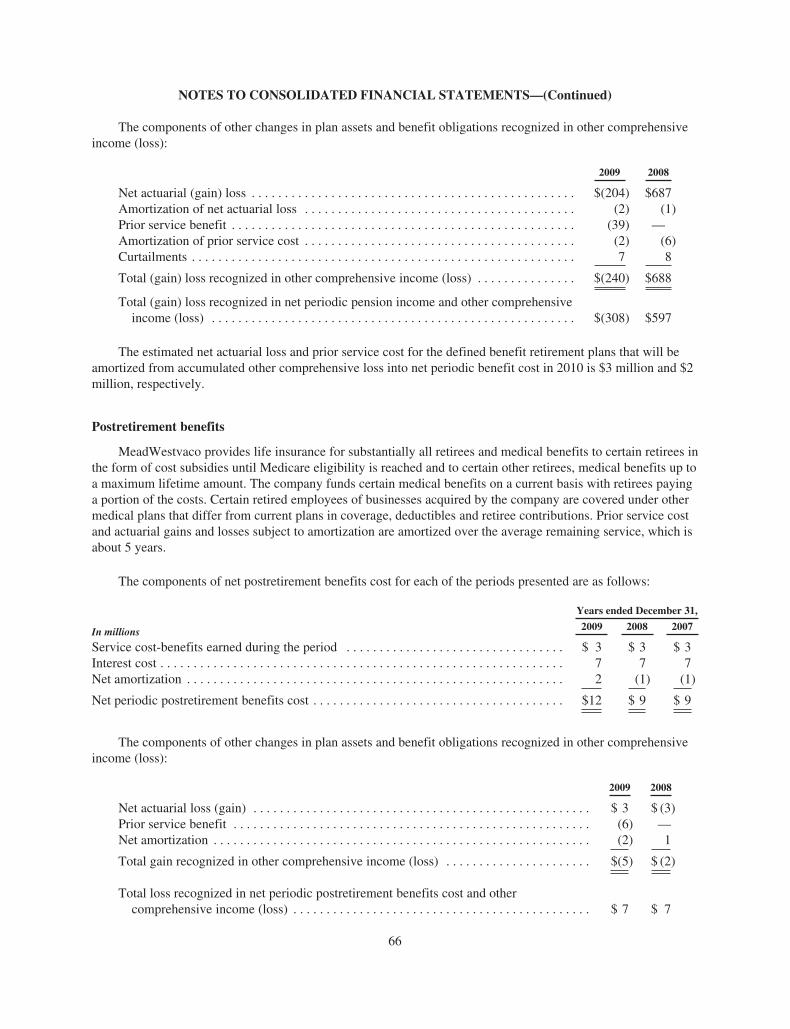
NOTES TO CONSOLIDATED FINANCIAL STATEMENTS—(Continued)
The components of other changes in plan assets and benefit obligations recognized in other comprehensiveincome (loss):
2009 2008
Net actuarial (gain) loss . . . . . . . . . . . . . . . . . . . . . . . . . . . . . . . . . . . . . . . . . . . . . . . . . $(204) $687Amortization of net actuarial loss . . . . . . . . . . . . . . . . . . . . . . . . . . . . . . . . . . . . . . . . . (2) (1)Prior service benefit . . . . . . . . . . . . . . . . . . . . . . . . . . . . . . . . . . . . . . . . . . . . . . . . . . . . (39) —Amortization of prior service cost . . . . . . . . . . . . . . . . . . . . . . . . . . . . . . . . . . . . . . . . . (2) (6)Curtailments . . . . . . . . . . . . . . . . . . . . . . . . . . . . . . . . . . . . . . . . . . . . . . . . . . . . . . . . . . 7 8
Total (gain) loss recognized in other comprehensive income (loss) . . . . . . . . . . . . . . . $(240) $688
Total (gain) loss recognized in net periodic pension income and other comprehensiveincome (loss) . . . . . . . . . . . . . . . . . . . . . . . . . . . . . . . . . . . . . . . . . . . . . . . . . . . . . . . $(308) $597
The estimated net actuarial loss and prior service cost for the defined benefit retirement plans that will beamortized from accumulated other comprehensive loss into net periodic benefit cost in 2010 is $3 million and $2million, respectively.
Postretirement benefits
MeadWestvaco provides life insurance for substantially all retirees and medical benefits to certain retirees inthe form of cost subsidies until Medicare eligibility is reached and to certain other retirees, medical benefits up toa maximum lifetime amount. The company funds certain medical benefits on a current basis with retirees payinga portion of the costs. Certain retired employees of businesses acquired by the company are covered under othermedical plans that differ from current plans in coverage, deductibles and retiree contributions. Prior service costand actuarial gains and losses subject to amortization are amortized over the average remaining service, which isabout 5 years.
The components of net postretirement benefits cost for each of the periods presented are as follows:
In millions
Years ended December 31,
2009 2008 2007
Service cost-benefits earned during the period . . . . . . . . . . . . . . . . . . . . . . . . . . . . . . . . . $ 3 $ 3 $ 3Interest cost . . . . . . . . . . . . . . . . . . . . . . . . . . . . . . . . . . . . . . . . . . . . . . . . . . . . . . . . . . . . . 7 7 7Net amortization . . . . . . . . . . . . . . . . . . . . . . . . . . . . . . . . . . . . . . . . . . . . . . . . . . . . . . . . . 2 (1) (1)
Net periodic postretirement benefits cost . . . . . . . . . . . . . . . . . . . . . . . . . . . . . . . . . . . . . . $12 $ 9 $ 9
The components of other changes in plan assets and benefit obligations recognized in other comprehensiveincome (loss):
2009 2008
Net actuarial loss (gain) . . . . . . . . . . . . . . . . . . . . . . . . . . . . . . . . . . . . . . . . . . . . . . . . . . . $ 3 $ (3)Prior service benefit . . . . . . . . . . . . . . . . . . . . . . . . . . . . . . . . . . . . . . . . . . . . . . . . . . . . . . (6) —Net amortization . . . . . . . . . . . . . . . . . . . . . . . . . . . . . . . . . . . . . . . . . . . . . . . . . . . . . . . . . (2) 1
Total gain recognized in other comprehensive income (loss) . . . . . . . . . . . . . . . . . . . . . . $(5) $ (2)
Total loss recognized in net periodic postretirement benefits cost and othercomprehensive income (loss) . . . . . . . . . . . . . . . . . . . . . . . . . . . . . . . . . . . . . . . . . . . . . $ 7 $ 7
66
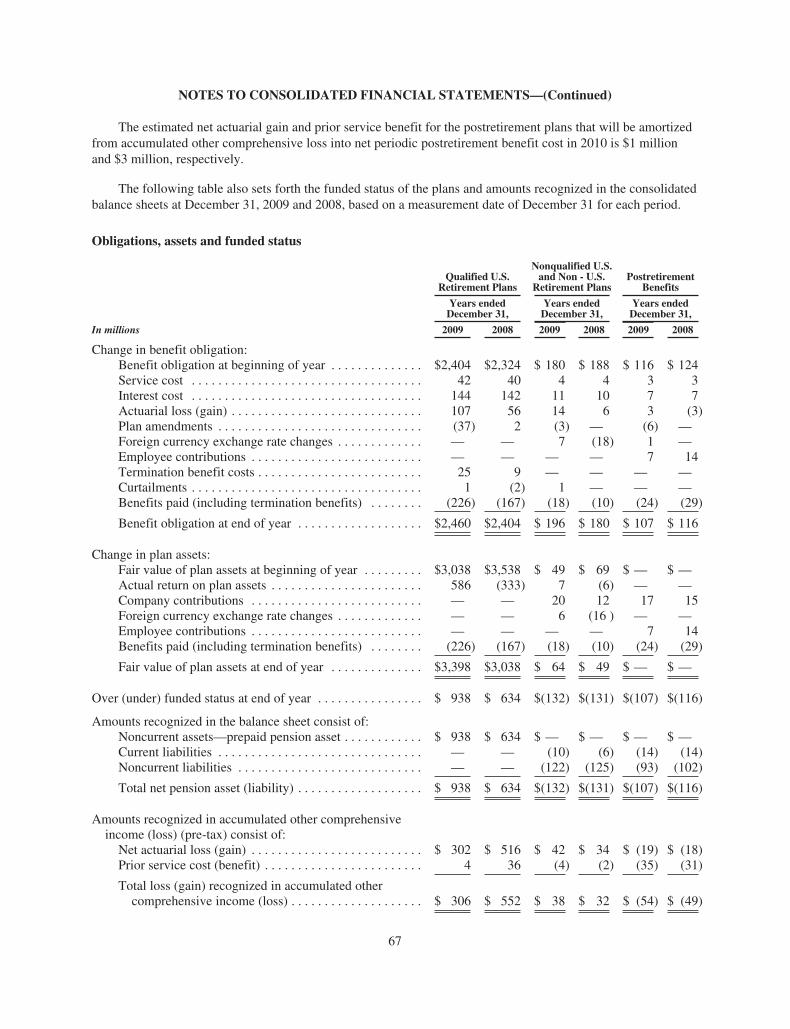
NOTES TO CONSOLIDATED FINANCIAL STATEMENTS—(Continued)
The estimated net actuarial gain and prior service benefit for the postretirement plans that will be amortizedfrom accumulated other comprehensive loss into net periodic postretirement benefit cost in 2010 is $1 millionand $3 million, respectively.
The following table also sets forth the funded status of the plans and amounts recognized in the consolidatedbalance sheets at December 31, 2009 and 2008, based on a measurement date of December 31 for each period.
Obligations, assets and funded status
Qualified U.S.Retirement Plans
Nonqualified U.S.and Non - U.S.
Retirement PlansPostretirement
Benefits
Years endedDecember 31,
Years endedDecember 31,
Years endedDecember 31,
In millions 2009 2008 2009 2008 2009 2008
Change in benefit obligation:Benefit obligation at beginning of year . . . . . . . . . . . . . . $2,404 $2,324 $ 180 $ 188 $ 116 $ 124Service cost . . . . . . . . . . . . . . . . . . . . . . . . . . . . . . . . . . . 42 40 4 4 3 3Interest cost . . . . . . . . . . . . . . . . . . . . . . . . . . . . . . . . . . . 144 142 11 10 7 7Actuarial loss (gain) . . . . . . . . . . . . . . . . . . . . . . . . . . . . . 107 56 14 6 3 (3)Plan amendments . . . . . . . . . . . . . . . . . . . . . . . . . . . . . . . (37) 2 (3) — (6) —Foreign currency exchange rate changes . . . . . . . . . . . . . — — 7 (18) 1 —Employee contributions . . . . . . . . . . . . . . . . . . . . . . . . . . — — — — 7 14Termination benefit costs . . . . . . . . . . . . . . . . . . . . . . . . . 25 9 — — — —Curtailments . . . . . . . . . . . . . . . . . . . . . . . . . . . . . . . . . . . 1 (2) 1 — — —Benefits paid (including termination benefits) . . . . . . . . (226) (167) (18) (10) (24) (29)
Benefit obligation at end of year . . . . . . . . . . . . . . . . . . . $2,460 $2,404 $ 196 $ 180 $ 107 $ 116
Change in plan assets:Fair value of plan assets at beginning of year . . . . . . . . . $3,038 $3,538 $ 49 $ 69 $ — $ —Actual return on plan assets . . . . . . . . . . . . . . . . . . . . . . . 586 (333) 7 (6) — —Company contributions . . . . . . . . . . . . . . . . . . . . . . . . . . — — 20 12 17 15Foreign currency exchange rate changes . . . . . . . . . . . . . — — 6 (16 ) — —Employee contributions . . . . . . . . . . . . . . . . . . . . . . . . . . — — — — 7 14Benefits paid (including termination benefits) . . . . . . . . (226) (167) (18) (10) (24) (29)
Fair value of plan assets at end of year . . . . . . . . . . . . . . $3,398 $3,038 $ 64 $ 49 $ — $ —
Over (under) funded status at end of year . . . . . . . . . . . . . . . . $ 938 $ 634 $(132) $(131) $(107) $(116)
Amounts recognized in the balance sheet consist of:Noncurrent assets—prepaid pension asset . . . . . . . . . . . . $ 938 $ 634 $ — $ — $ — $ —Current liabilities . . . . . . . . . . . . . . . . . . . . . . . . . . . . . . . — — (10) (6) (14) (14)Noncurrent liabilities . . . . . . . . . . . . . . . . . . . . . . . . . . . . — — (122) (125) (93) (102)
Total net pension asset (liability) . . . . . . . . . . . . . . . . . . . $ 938 $ 634 $(132) $(131) $(107) $(116)
Amounts recognized in accumulated other comprehensiveincome (loss) (pre-tax) consist of:Net actuarial loss (gain) . . . . . . . . . . . . . . . . . . . . . . . . . . $ 302 $ 516 $ 42 $ 34 $ (19) $ (18)Prior service cost (benefit) . . . . . . . . . . . . . . . . . . . . . . . . 4 36 (4) (2) (35) (31)
Total loss (gain) recognized in accumulated othercomprehensive income (loss) . . . . . . . . . . . . . . . . . . . . $ 306 $ 552 $ 38 $ 32 $ (54) $ (49)
67
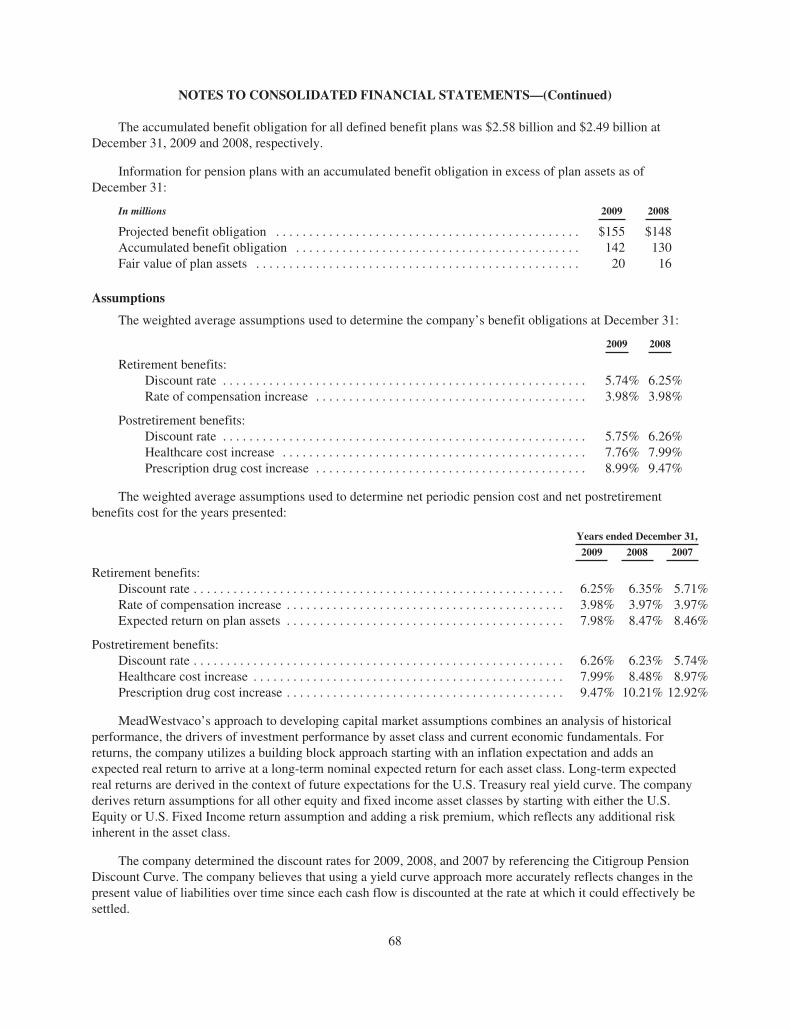
NOTES TO CONSOLIDATED FINANCIAL STATEMENTS—(Continued)
The accumulated benefit obligation for all defined benefit plans was $2.58 billion and $2.49 billion atDecember 31, 2009 and 2008, respectively.
Information for pension plans with an accumulated benefit obligation in excess of plan assets as ofDecember 31:
In millions 2009 2008
Projected benefit obligation . . . . . . . . . . . . . . . . . . . . . . . . . . . . . . . . . . . . . . . . . . . . . . $155 $148Accumulated benefit obligation . . . . . . . . . . . . . . . . . . . . . . . . . . . . . . . . . . . . . . . . . . . 142 130Fair value of plan assets . . . . . . . . . . . . . . . . . . . . . . . . . . . . . . . . . . . . . . . . . . . . . . . . . 20 16
Assumptions
The weighted average assumptions used to determine the company’s benefit obligations at December 31:
2009 2008
Retirement benefits:Discount rate . . . . . . . . . . . . . . . . . . . . . . . . . . . . . . . . . . . . . . . . . . . . . . . . . . . . . . . 5.74% 6.25%Rate of compensation increase . . . . . . . . . . . . . . . . . . . . . . . . . . . . . . . . . . . . . . . . . 3.98% 3.98%
Postretirement benefits:Discount rate . . . . . . . . . . . . . . . . . . . . . . . . . . . . . . . . . . . . . . . . . . . . . . . . . . . . . . . 5.75% 6.26%Healthcare cost increase . . . . . . . . . . . . . . . . . . . . . . . . . . . . . . . . . . . . . . . . . . . . . . 7.76% 7.99%Prescription drug cost increase . . . . . . . . . . . . . . . . . . . . . . . . . . . . . . . . . . . . . . . . . 8.99% 9.47%
The weighted average assumptions used to determine net periodic pension cost and net postretirementbenefits cost for the years presented:
Years ended December 31,
2009 2008 2007
Retirement benefits:Discount rate . . . . . . . . . . . . . . . . . . . . . . . . . . . . . . . . . . . . . . . . . . . . . . . . . . . . . . . . 6.25% 6.35% 5.71%Rate of compensation increase . . . . . . . . . . . . . . . . . . . . . . . . . . . . . . . . . . . . . . . . . . 3.98% 3.97% 3.97%Expected return on plan assets . . . . . . . . . . . . . . . . . . . . . . . . . . . . . . . . . . . . . . . . . . 7.98% 8.47% 8.46%
Postretirement benefits:Discount rate . . . . . . . . . . . . . . . . . . . . . . . . . . . . . . . . . . . . . . . . . . . . . . . . . . . . . . . . 6.26% 6.23% 5.74%Healthcare cost increase . . . . . . . . . . . . . . . . . . . . . . . . . . . . . . . . . . . . . . . . . . . . . . . 7.99% 8.48% 8.97%Prescription drug cost increase . . . . . . . . . . . . . . . . . . . . . . . . . . . . . . . . . . . . . . . . . . 9.47% 10.21% 12.92%
MeadWestvaco’s approach to developing capital market assumptions combines an analysis of historicalperformance, the drivers of investment performance by asset class and current economic fundamentals. Forreturns, the company utilizes a building block approach starting with an inflation expectation and adds anexpected real return to arrive at a long-term nominal expected return for each asset class. Long-term expectedreal returns are derived in the context of future expectations for the U.S. Treasury real yield curve. The companyderives return assumptions for all other equity and fixed income asset classes by starting with either the U.S.Equity or U.S. Fixed Income return assumption and adding a risk premium, which reflects any additional riskinherent in the asset class.
The company determined the discount rates for 2009, 2008, and 2007 by referencing the Citigroup PensionDiscount Curve. The company believes that using a yield curve approach more accurately reflects changes in thepresent value of liabilities over time since each cash flow is discounted at the rate at which it could effectively besettled.
68
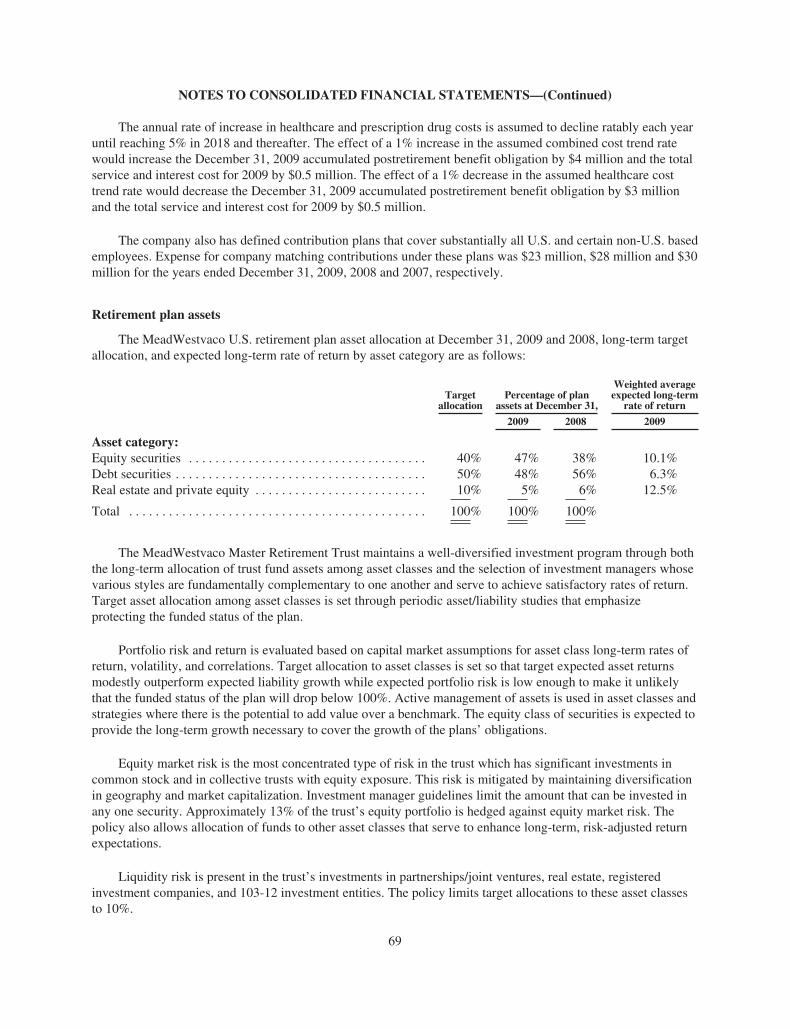
NOTES TO CONSOLIDATED FINANCIAL STATEMENTS—(Continued)
The annual rate of increase in healthcare and prescription drug costs is assumed to decline ratably each yearuntil reaching 5% in 2018 and thereafter. The effect of a 1% increase in the assumed combined cost trend ratewould increase the December 31, 2009 accumulated postretirement benefit obligation by $4 million and the totalservice and interest cost for 2009 by $0.5 million. The effect of a 1% decrease in the assumed healthcare costtrend rate would decrease the December 31, 2009 accumulated postretirement benefit obligation by $3 millionand the total service and interest cost for 2009 by $0.5 million.
The company also has defined contribution plans that cover substantially all U.S. and certain non-U.S. basedemployees. Expense for company matching contributions under these plans was $23 million, $28 million and $30million for the years ended December 31, 2009, 2008 and 2007, respectively.
Retirement plan assets
The MeadWestvaco U.S. retirement plan asset allocation at December 31, 2009 and 2008, long-term targetallocation, and expected long-term rate of return by asset category are as follows:
Targetallocation
Percentage of planassets at December 31,
Weighted averageexpected long-term
rate of return
2009 2008 2009
Asset category:Equity securities . . . . . . . . . . . . . . . . . . . . . . . . . . . . . . . . . . . . 40% 47% 38% 10.1%Debt securities . . . . . . . . . . . . . . . . . . . . . . . . . . . . . . . . . . . . . . 50% 48% 56% 6.3%Real estate and private equity . . . . . . . . . . . . . . . . . . . . . . . . . . 10% 5% 6% 12.5%
Total . . . . . . . . . . . . . . . . . . . . . . . . . . . . . . . . . . . . . . . . . . . . . 100% 100% 100%
The MeadWestvaco Master Retirement Trust maintains a well-diversified investment program through boththe long-term allocation of trust fund assets among asset classes and the selection of investment managers whosevarious styles are fundamentally complementary to one another and serve to achieve satisfactory rates of return.Target asset allocation among asset classes is set through periodic asset/liability studies that emphasizeprotecting the funded status of the plan.
Portfolio risk and return is evaluated based on capital market assumptions for asset class long-term rates ofreturn, volatility, and correlations. Target allocation to asset classes is set so that target expected asset returnsmodestly outperform expected liability growth while expected portfolio risk is low enough to make it unlikelythat the funded status of the plan will drop below 100%. Active management of assets is used in asset classes andstrategies where there is the potential to add value over a benchmark. The equity class of securities is expected toprovide the long-term growth necessary to cover the growth of the plans’ obligations.
Equity market risk is the most concentrated type of risk in the trust which has significant investments incommon stock and in collective trusts with equity exposure. This risk is mitigated by maintaining diversificationin geography and market capitalization. Investment manager guidelines limit the amount that can be invested inany one security. Approximately 13% of the trust’s equity portfolio is hedged against equity market risk. Thepolicy also allows allocation of funds to other asset classes that serve to enhance long-term, risk-adjusted returnexpectations.
Liquidity risk is present in the trust’s investments in partnerships/joint ventures, real estate, registeredinvestment companies, and 103-12 investment entities. The policy limits target allocations to these asset classesto 10%.
69
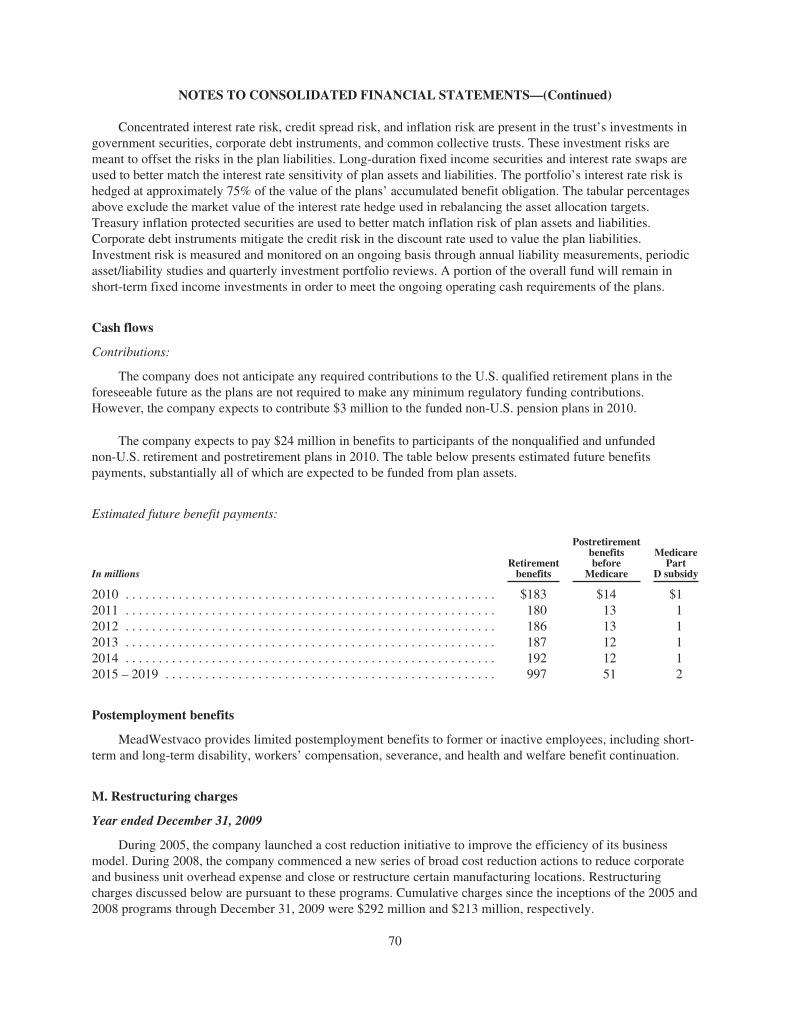
NOTES TO CONSOLIDATED FINANCIAL STATEMENTS—(Continued)
Concentrated interest rate risk, credit spread risk, and inflation risk are present in the trust’s investments ingovernment securities, corporate debt instruments, and common collective trusts. These investment risks aremeant to offset the risks in the plan liabilities. Long-duration fixed income securities and interest rate swaps areused to better match the interest rate sensitivity of plan assets and liabilities. The portfolio’s interest rate risk ishedged at approximately 75% of the value of the plans’ accumulated benefit obligation. The tabular percentagesabove exclude the market value of the interest rate hedge used in rebalancing the asset allocation targets.Treasury inflation protected securities are used to better match inflation risk of plan assets and liabilities.Corporate debt instruments mitigate the credit risk in the discount rate used to value the plan liabilities.Investment risk is measured and monitored on an ongoing basis through annual liability measurements, periodicasset/liability studies and quarterly investment portfolio reviews. A portion of the overall fund will remain inshort-term fixed income investments in order to meet the ongoing operating cash requirements of the plans.
Cash flows
Contributions:
The company does not anticipate any required contributions to the U.S. qualified retirement plans in theforeseeable future as the plans are not required to make any minimum regulatory funding contributions.However, the company expects to contribute $3 million to the funded non-U.S. pension plans in 2010.
The company expects to pay $24 million in benefits to participants of the nonqualified and unfundednon-U.S. retirement and postretirement plans in 2010. The table below presents estimated future benefitspayments, substantially all of which are expected to be funded from plan assets.
Estimated future benefit payments:
In millionsRetirementbenefits
Postretirementbenefitsbefore
Medicare
MedicarePart
D subsidy
2010 . . . . . . . . . . . . . . . . . . . . . . . . . . . . . . . . . . . . . . . . . . . . . . . . . . . . . . . . $183 $14 $12011 . . . . . . . . . . . . . . . . . . . . . . . . . . . . . . . . . . . . . . . . . . . . . . . . . . . . . . . . 180 13 12012 . . . . . . . . . . . . . . . . . . . . . . . . . . . . . . . . . . . . . . . . . . . . . . . . . . . . . . . . 186 13 12013 . . . . . . . . . . . . . . . . . . . . . . . . . . . . . . . . . . . . . . . . . . . . . . . . . . . . . . . . 187 12 12014 . . . . . . . . . . . . . . . . . . . . . . . . . . . . . . . . . . . . . . . . . . . . . . . . . . . . . . . . 192 12 12015 – 2019 . . . . . . . . . . . . . . . . . . . . . . . . . . . . . . . . . . . . . . . . . . . . . . . . . . 997 51 2
Postemployment benefits
MeadWestvaco provides limited postemployment benefits to former or inactive employees, including short-term and long-term disability, workers’ compensation, severance, and health and welfare benefit continuation.
M. Restructuring charges
Year ended December 31, 2009
During 2005, the company launched a cost reduction initiative to improve the efficiency of its businessmodel. During 2008, the company commenced a new series of broad cost reduction actions to reduce corporateand business unit overhead expense and close or restructure certain manufacturing locations. Restructuringcharges discussed below are pursuant to these programs. Cumulative charges since the inceptions of the 2005 and2008 programs through December 31, 2009 were $292 million and $213 million, respectively.
70
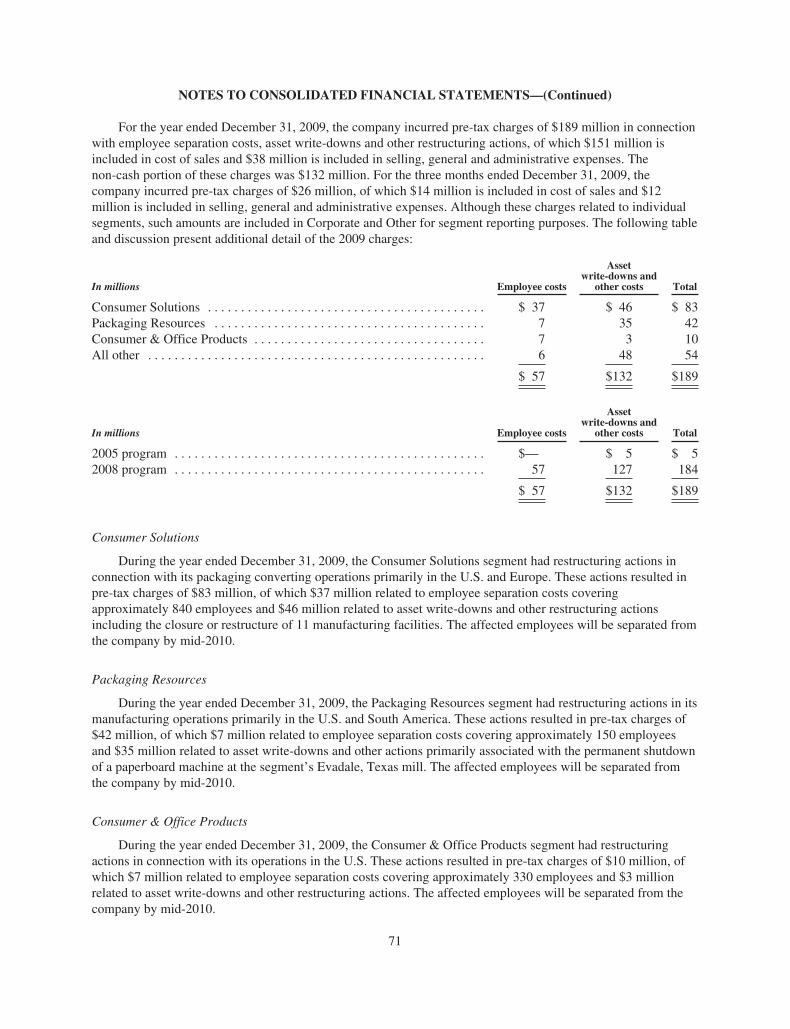
NOTES TO CONSOLIDATED FINANCIAL STATEMENTS—(Continued)
For the year ended December 31, 2009, the company incurred pre-tax charges of $189 million in connectionwith employee separation costs, asset write-downs and other restructuring actions, of which $151 million isincluded in cost of sales and $38 million is included in selling, general and administrative expenses. Thenon-cash portion of these charges was $132 million. For the three months ended December 31, 2009, thecompany incurred pre-tax charges of $26 million, of which $14 million is included in cost of sales and $12million is included in selling, general and administrative expenses. Although these charges related to individualsegments, such amounts are included in Corporate and Other for segment reporting purposes. The following tableand discussion present additional detail of the 2009 charges:
In millions Employee costs
Assetwrite-downs and
other costs Total
Consumer Solutions . . . . . . . . . . . . . . . . . . . . . . . . . . . . . . . . . . . . . . . . . . $ 37 $ 46 $ 83Packaging Resources . . . . . . . . . . . . . . . . . . . . . . . . . . . . . . . . . . . . . . . . . 7 35 42Consumer & Office Products . . . . . . . . . . . . . . . . . . . . . . . . . . . . . . . . . . . 7 3 10All other . . . . . . . . . . . . . . . . . . . . . . . . . . . . . . . . . . . . . . . . . . . . . . . . . . . 6 48 54
$ 57 $132 $189
In millions Employee costs
Assetwrite-downs and
other costs Total
2005 program . . . . . . . . . . . . . . . . . . . . . . . . . . . . . . . . . . . . . . . . . . . . . . . $— $ 5 $ 52008 program . . . . . . . . . . . . . . . . . . . . . . . . . . . . . . . . . . . . . . . . . . . . . . . 57 127 184
$ 57 $132 $189
Consumer Solutions
During the year ended December 31, 2009, the Consumer Solutions segment had restructuring actions inconnection with its packaging converting operations primarily in the U.S. and Europe. These actions resulted inpre-tax charges of $83 million, of which $37 million related to employee separation costs coveringapproximately 840 employees and $46 million related to asset write-downs and other restructuring actionsincluding the closure or restructure of 11 manufacturing facilities. The affected employees will be separated fromthe company by mid-2010.
Packaging Resources
During the year ended December 31, 2009, the Packaging Resources segment had restructuring actions in itsmanufacturing operations primarily in the U.S. and South America. These actions resulted in pre-tax charges of$42 million, of which $7 million related to employee separation costs covering approximately 150 employeesand $35 million related to asset write-downs and other actions primarily associated with the permanent shutdownof a paperboard machine at the segment’s Evadale, Texas mill. The affected employees will be separated fromthe company by mid-2010.
Consumer & Office Products
During the year ended December 31, 2009, the Consumer & Office Products segment had restructuringactions in connection with its operations in the U.S. These actions resulted in pre-tax charges of $10 million, ofwhich $7 million related to employee separation costs covering approximately 330 employees and $3 millionrelated to asset write-downs and other restructuring actions. The affected employees will be separated from thecompany by mid-2010.
71
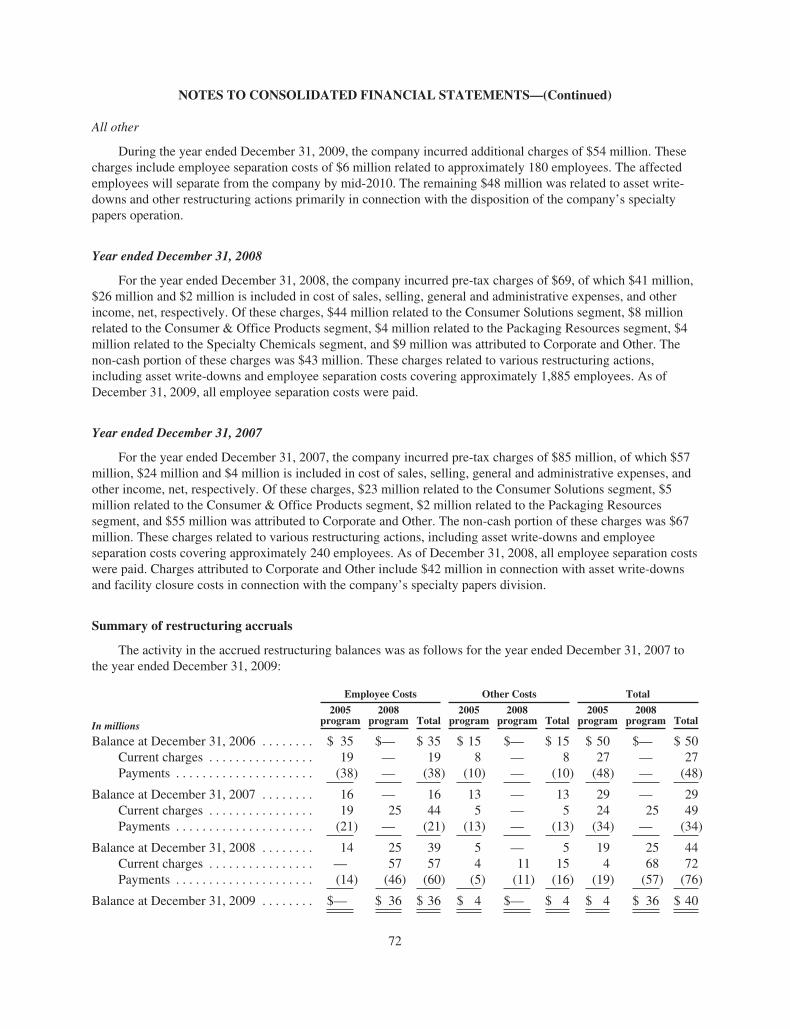
NOTES TO CONSOLIDATED FINANCIAL STATEMENTS—(Continued)
All other
During the year ended December 31, 2009, the company incurred additional charges of $54 million. Thesecharges include employee separation costs of $6 million related to approximately 180 employees. The affectedemployees will separate from the company by mid-2010. The remaining $48 million was related to asset write-downs and other restructuring actions primarily in connection with the disposition of the company’s specialtypapers operation.
Year ended December 31, 2008
For the year ended December 31, 2008, the company incurred pre-tax charges of $69, of which $41 million,$26 million and $2 million is included in cost of sales, selling, general and administrative expenses, and otherincome, net, respectively. Of these charges, $44 million related to the Consumer Solutions segment, $8 millionrelated to the Consumer & Office Products segment, $4 million related to the Packaging Resources segment, $4million related to the Specialty Chemicals segment, and $9 million was attributed to Corporate and Other. Thenon-cash portion of these charges was $43 million. These charges related to various restructuring actions,including asset write-downs and employee separation costs covering approximately 1,885 employees. As ofDecember 31, 2009, all employee separation costs were paid.
Year ended December 31, 2007
For the year ended December 31, 2007, the company incurred pre-tax charges of $85 million, of which $57million, $24 million and $4 million is included in cost of sales, selling, general and administrative expenses, andother income, net, respectively. Of these charges, $23 million related to the Consumer Solutions segment, $5million related to the Consumer & Office Products segment, $2 million related to the Packaging Resourcessegment, and $55 million was attributed to Corporate and Other. The non-cash portion of these charges was $67million. These charges related to various restructuring actions, including asset write-downs and employeeseparation costs covering approximately 240 employees. As of December 31, 2008, all employee separation costswere paid. Charges attributed to Corporate and Other include $42 million in connection with asset write-downsand facility closure costs in connection with the company’s specialty papers division.
Summary of restructuring accruals
The activity in the accrued restructuring balances was as follows for the year ended December 31, 2007 tothe year ended December 31, 2009:
In millions
Employee Costs Other Costs Total
2005program
2008program Total
2005program
2008program Total
2005program
2008program Total
Balance at December 31, 2006 . . . . . . . . $ 35 $— $ 35 $ 15 $— $ 15 $ 50 $— $ 50Current charges . . . . . . . . . . . . . . . . 19 — 19 8 — 8 27 — 27Payments . . . . . . . . . . . . . . . . . . . . . (38) — (38) (10) — (10) (48) — (48)
Balance at December 31, 2007 . . . . . . . . 16 — 16 13 — 13 29 — 29Current charges . . . . . . . . . . . . . . . . 19 25 44 5 — 5 24 25 49Payments . . . . . . . . . . . . . . . . . . . . . (21) — (21) (13) — (13) (34) — (34)
Balance at December 31, 2008 . . . . . . . . 14 25 39 5 — 5 19 25 44Current charges . . . . . . . . . . . . . . . . — 57 57 4 11 15 4 68 72Payments . . . . . . . . . . . . . . . . . . . . . (14) (46) (60) (5) (11) (16) (19) (57) (76)
Balance at December 31, 2009 . . . . . . . . $— $ 36 $ 36 $ 4 $— $ 4 $ 4 $ 36 $ 40
72
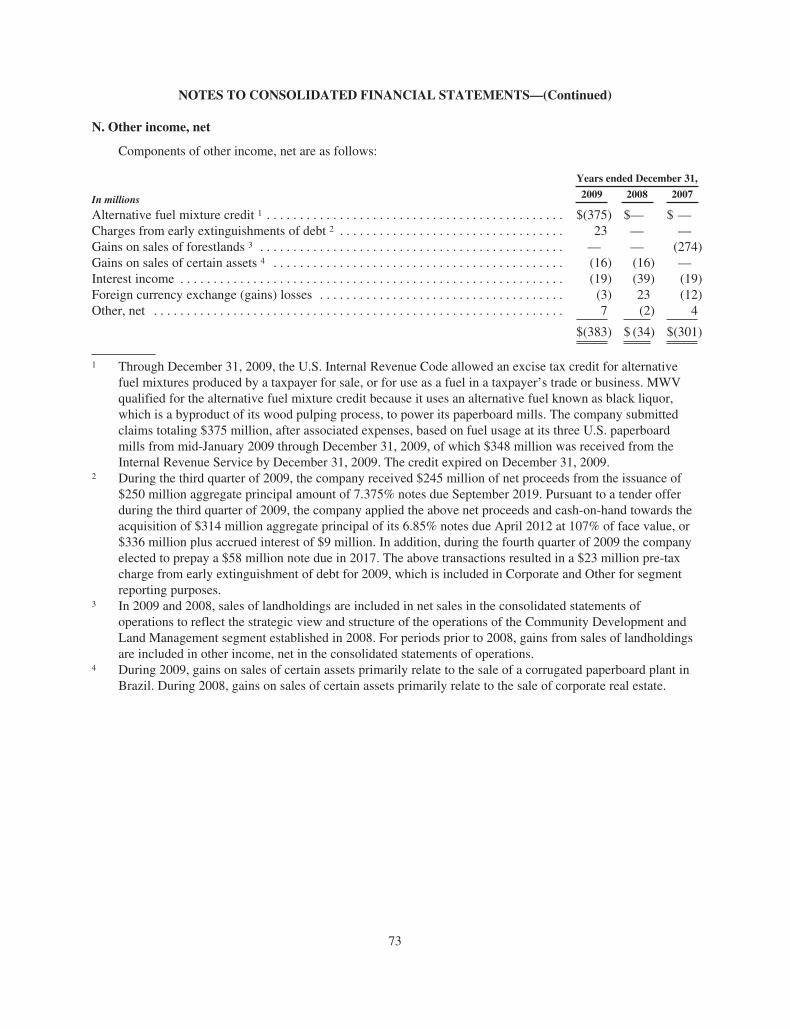
NOTES TO CONSOLIDATED FINANCIAL STATEMENTS—(Continued)
N. Other income, net
Components of other income, net are as follows:
In millions
Years ended December 31,
2009 2008 2007
Alternative fuel mixture credit 1 . . . . . . . . . . . . . . . . . . . . . . . . . . . . . . . . . . . . . . . . . . . . . $(375) $— $ —Charges from early extinguishments of debt 2 . . . . . . . . . . . . . . . . . . . . . . . . . . . . . . . . . . 23 — —Gains on sales of forestlands 3 . . . . . . . . . . . . . . . . . . . . . . . . . . . . . . . . . . . . . . . . . . . . . . — — (274)Gains on sales of certain assets 4 . . . . . . . . . . . . . . . . . . . . . . . . . . . . . . . . . . . . . . . . . . . . (16) (16) —Interest income . . . . . . . . . . . . . . . . . . . . . . . . . . . . . . . . . . . . . . . . . . . . . . . . . . . . . . . . . . (19) (39) (19)Foreign currency exchange (gains) losses . . . . . . . . . . . . . . . . . . . . . . . . . . . . . . . . . . . . . (3) 23 (12)Other, net . . . . . . . . . . . . . . . . . . . . . . . . . . . . . . . . . . . . . . . . . . . . . . . . . . . . . . . . . . . . . . 7 (2) 4
$(383) $ (34) $(301)
1 Through December 31, 2009, the U.S. Internal Revenue Code allowed an excise tax credit for alternativefuel mixtures produced by a taxpayer for sale, or for use as a fuel in a taxpayer’s trade or business. MWVqualified for the alternative fuel mixture credit because it uses an alternative fuel known as black liquor,which is a byproduct of its wood pulping process, to power its paperboard mills. The company submittedclaims totaling $375 million, after associated expenses, based on fuel usage at its three U.S. paperboardmills from mid-January 2009 through December 31, 2009, of which $348 million was received from theInternal Revenue Service by December 31, 2009. The credit expired on December 31, 2009.
2 During the third quarter of 2009, the company received $245 million of net proceeds from the issuance of$250 million aggregate principal amount of 7.375% notes due September 2019. Pursuant to a tender offerduring the third quarter of 2009, the company applied the above net proceeds and cash-on-hand towards theacquisition of $314 million aggregate principal of its 6.85% notes due April 2012 at 107% of face value, or$336 million plus accrued interest of $9 million. In addition, during the fourth quarter of 2009 the companyelected to prepay a $58 million note due in 2017. The above transactions resulted in a $23 million pre-taxcharge from early extinguishment of debt for 2009, which is included in Corporate and Other for segmentreporting purposes.
3 In 2009 and 2008, sales of landholdings are included in net sales in the consolidated statements ofoperations to reflect the strategic view and structure of the operations of the Community Development andLand Management segment established in 2008. For periods prior to 2008, gains from sales of landholdingsare included in other income, net in the consolidated statements of operations.
4 During 2009, gains on sales of certain assets primarily relate to the sale of a corrugated paperboard plant inBrazil. During 2008, gains on sales of certain assets primarily relate to the sale of corporate real estate.
73
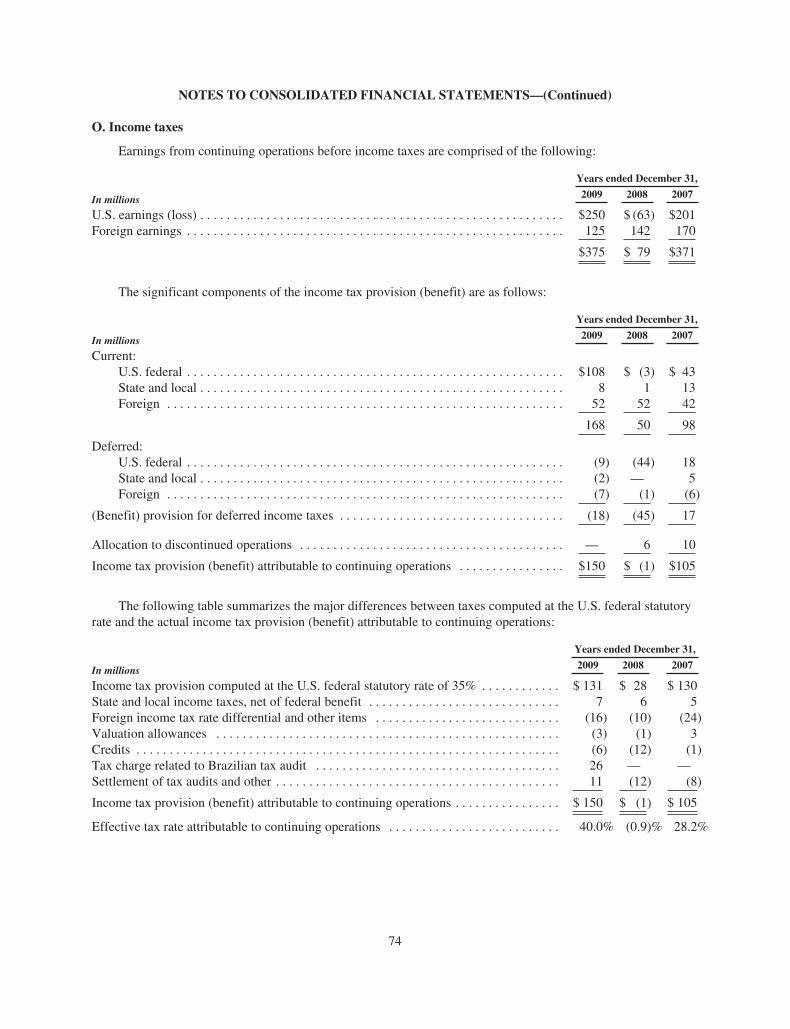
NOTES TO CONSOLIDATED FINANCIAL STATEMENTS—(Continued)
O. Income taxes
Earnings from continuing operations before income taxes are comprised of the following:
In millions
Years ended December 31,
2009 2008 2007
U.S. earnings (loss) . . . . . . . . . . . . . . . . . . . . . . . . . . . . . . . . . . . . . . . . . . . . . . . . . . . . . . . $250 $ (63) $201Foreign earnings . . . . . . . . . . . . . . . . . . . . . . . . . . . . . . . . . . . . . . . . . . . . . . . . . . . . . . . . . 125 142 170
$375 $ 79 $371
The significant components of the income tax provision (benefit) are as follows:
In millions
Years ended December 31,
2009 2008 2007
Current:U.S. federal . . . . . . . . . . . . . . . . . . . . . . . . . . . . . . . . . . . . . . . . . . . . . . . . . . . . . . . . . $108 $ (3) $ 43State and local . . . . . . . . . . . . . . . . . . . . . . . . . . . . . . . . . . . . . . . . . . . . . . . . . . . . . . . 8 1 13Foreign . . . . . . . . . . . . . . . . . . . . . . . . . . . . . . . . . . . . . . . . . . . . . . . . . . . . . . . . . . . . 52 52 42
168 50 98
Deferred:U.S. federal . . . . . . . . . . . . . . . . . . . . . . . . . . . . . . . . . . . . . . . . . . . . . . . . . . . . . . . . . (9) (44) 18State and local . . . . . . . . . . . . . . . . . . . . . . . . . . . . . . . . . . . . . . . . . . . . . . . . . . . . . . . (2) — 5Foreign . . . . . . . . . . . . . . . . . . . . . . . . . . . . . . . . . . . . . . . . . . . . . . . . . . . . . . . . . . . . (7) (1) (6)
(Benefit) provision for deferred income taxes . . . . . . . . . . . . . . . . . . . . . . . . . . . . . . . . . . (18) (45) 17
Allocation to discontinued operations . . . . . . . . . . . . . . . . . . . . . . . . . . . . . . . . . . . . . . . . — 6 10
Income tax provision (benefit) attributable to continuing operations . . . . . . . . . . . . . . . . $150 $ (1) $105
The following table summarizes the major differences between taxes computed at the U.S. federal statutoryrate and the actual income tax provision (benefit) attributable to continuing operations:
In millions
Years ended December 31,
2009 2008 2007
Income tax provision computed at the U.S. federal statutory rate of 35% . . . . . . . . . . . . $ 131 $ 28 $ 130State and local income taxes, net of federal benefit . . . . . . . . . . . . . . . . . . . . . . . . . . . . . 7 6 5Foreign income tax rate differential and other items . . . . . . . . . . . . . . . . . . . . . . . . . . . . (16) (10) (24)Valuation allowances . . . . . . . . . . . . . . . . . . . . . . . . . . . . . . . . . . . . . . . . . . . . . . . . . . . . (3) (1) 3Credits . . . . . . . . . . . . . . . . . . . . . . . . . . . . . . . . . . . . . . . . . . . . . . . . . . . . . . . . . . . . . . . . (6) (12) (1)Tax charge related to Brazilian tax audit . . . . . . . . . . . . . . . . . . . . . . . . . . . . . . . . . . . . . 26 — —Settlement of tax audits and other . . . . . . . . . . . . . . . . . . . . . . . . . . . . . . . . . . . . . . . . . . . 11 (12) (8)
Income tax provision (benefit) attributable to continuing operations . . . . . . . . . . . . . . . . $ 150 $ (1) $ 105
Effective tax rate attributable to continuing operations . . . . . . . . . . . . . . . . . . . . . . . . . . 40.0% (0.9)% 28.2%
74
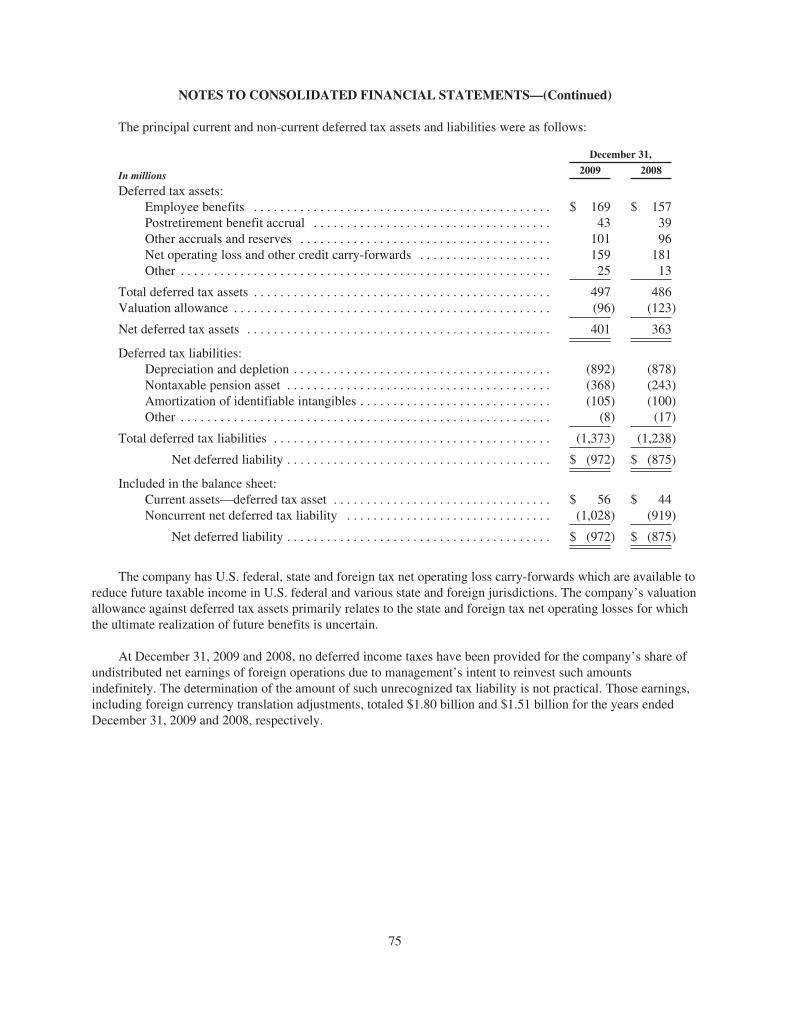
NOTES TO CONSOLIDATED FINANCIAL STATEMENTS—(Continued)
The principal current and non-current deferred tax assets and liabilities were as follows:
In millions
December 31,
2009 2008
Deferred tax assets:Employee benefits . . . . . . . . . . . . . . . . . . . . . . . . . . . . . . . . . . . . . . . . . . . . . $ 169 $ 157Postretirement benefit accrual . . . . . . . . . . . . . . . . . . . . . . . . . . . . . . . . . . . . 43 39Other accruals and reserves . . . . . . . . . . . . . . . . . . . . . . . . . . . . . . . . . . . . . . 101 96Net operating loss and other credit carry-forwards . . . . . . . . . . . . . . . . . . . . 159 181Other . . . . . . . . . . . . . . . . . . . . . . . . . . . . . . . . . . . . . . . . . . . . . . . . . . . . . . . . 25 13
Total deferred tax assets . . . . . . . . . . . . . . . . . . . . . . . . . . . . . . . . . . . . . . . . . . . . . 497 486Valuation allowance . . . . . . . . . . . . . . . . . . . . . . . . . . . . . . . . . . . . . . . . . . . . . . . . (96) (123)
Net deferred tax assets . . . . . . . . . . . . . . . . . . . . . . . . . . . . . . . . . . . . . . . . . . . . . . 401 363
Deferred tax liabilities:Depreciation and depletion . . . . . . . . . . . . . . . . . . . . . . . . . . . . . . . . . . . . . . . (892) (878)Nontaxable pension asset . . . . . . . . . . . . . . . . . . . . . . . . . . . . . . . . . . . . . . . . (368) (243)Amortization of identifiable intangibles . . . . . . . . . . . . . . . . . . . . . . . . . . . . . (105) (100)Other . . . . . . . . . . . . . . . . . . . . . . . . . . . . . . . . . . . . . . . . . . . . . . . . . . . . . . . . (8) (17)
Total deferred tax liabilities . . . . . . . . . . . . . . . . . . . . . . . . . . . . . . . . . . . . . . . . . . (1,373) (1,238)
Net deferred liability . . . . . . . . . . . . . . . . . . . . . . . . . . . . . . . . . . . . . . . . $ (972) $ (875)
Included in the balance sheet:Current assets—deferred tax asset . . . . . . . . . . . . . . . . . . . . . . . . . . . . . . . . . $ 56 $ 44Noncurrent net deferred tax liability . . . . . . . . . . . . . . . . . . . . . . . . . . . . . . . (1,028) (919)
Net deferred liability . . . . . . . . . . . . . . . . . . . . . . . . . . . . . . . . . . . . . . . . $ (972) $ (875)
The company has U.S. federal, state and foreign tax net operating loss carry-forwards which are available toreduce future taxable income in U.S. federal and various state and foreign jurisdictions. The company’s valuationallowance against deferred tax assets primarily relates to the state and foreign tax net operating losses for whichthe ultimate realization of future benefits is uncertain.
At December 31, 2009 and 2008, no deferred income taxes have been provided for the company’s share ofundistributed net earnings of foreign operations due to management’s intent to reinvest such amountsindefinitely. The determination of the amount of such unrecognized tax liability is not practical. Those earnings,including foreign currency translation adjustments, totaled $1.80 billion and $1.51 billion for the years endedDecember 31, 2009 and 2008, respectively.
75

NOTES TO CONSOLIDATED FINANCIAL STATEMENTS—(Continued)
As a result of the adoptions of new accounting guidance for unrecognized tax benefits on January 1, 2007,the company reduced opening retained earnings by $8 million. A reconciliation of the beginning and endingamounts of unrecognized tax benefits is as follows for the years ended December 31, 2009, 2008 and 2007 (inmillions):
Balance at January 1, 2007 . . . . . . . . . . . . . . . . . . . . . . . . . . . . . . . . . . . . . . . . . . . . $ 186Additions based on tax positions related to the current year . . . . . . . . . . . . . . 14Additions for tax positions of prior years . . . . . . . . . . . . . . . . . . . . . . . . . . . . . 28Reductions for tax positions of prior years . . . . . . . . . . . . . . . . . . . . . . . . . . . . (15)Reductions for tax positions due to lapse of statute . . . . . . . . . . . . . . . . . . . . . (2)Settlements . . . . . . . . . . . . . . . . . . . . . . . . . . . . . . . . . . . . . . . . . . . . . . . . . . . . (64)Foreign currency translation . . . . . . . . . . . . . . . . . . . . . . . . . . . . . . . . . . . . . . . 4
Balance at December 31, 2007 . . . . . . . . . . . . . . . . . . . . . . . . . . . . . . . . . . . . . . . . . 151Additions based on tax positions related to the current year . . . . . . . . . . . . . . 11Additions for tax positions of prior years . . . . . . . . . . . . . . . . . . . . . . . . . . . . . 21Reductions for tax positions of prior years . . . . . . . . . . . . . . . . . . . . . . . . . . . . (19)Reductions for tax positions due to lapse of statute . . . . . . . . . . . . . . . . . . . . . (7)Settlements . . . . . . . . . . . . . . . . . . . . . . . . . . . . . . . . . . . . . . . . . . . . . . . . . . . . (25)Foreign currency translation . . . . . . . . . . . . . . . . . . . . . . . . . . . . . . . . . . . . . . . (5)
Balance at December 31, 2008 . . . . . . . . . . . . . . . . . . . . . . . . . . . . . . . . . . . . . . . . . 127Additions based on tax positions related to the current year . . . . . . . . . . . . . . 153Additions for tax positions of prior years . . . . . . . . . . . . . . . . . . . . . . . . . . . . . 33Reductions for tax positions of prior years . . . . . . . . . . . . . . . . . . . . . . . . . . . . (7)Reductions for tax positions due to lapse of statute . . . . . . . . . . . . . . . . . . . . . (1)Settlements . . . . . . . . . . . . . . . . . . . . . . . . . . . . . . . . . . . . . . . . . . . . . . . . . . . . (21)Foreign currency translation . . . . . . . . . . . . . . . . . . . . . . . . . . . . . . . . . . . . . . . 13
Balance at December 31, 2009 . . . . . . . . . . . . . . . . . . . . . . . . . . . . . . . . . . . . . . . . . $ 297
The company has operations in many areas of the world and is subject, at times, to tax audits in thesejurisdictions. These tax audits by their nature are complex and can require several years to resolve. The finalresolution of any such tax audits could result in either a reduction in the company’s accruals or an increase in itsincome tax provision, both of which could have an impact on the results of operations in any given period. Witha few exceptions, the company is no longer subject to U.S. federal, state and local, or foreign income taxexaminations by tax authorities for years prior to 2004. The company regularly evaluates, assesses and adjuststhese accruals in light of changing facts and circumstances, which could cause the effective tax rate to fluctuatefrom period to period. Of the total $297 million liability for unrecognized tax benefits at December 31, 2009,$248 million could impact the company’s effective tax rate in future periods. The remaining balance of thisliability would be adjusted through the consolidated balance sheet without impacting the company’s effective taxrate.
The Internal Revenue Service examination for tax years 2004-2006 is expected to close in 2010.Management does not anticipate any potential settlement for tax years 2004-2006 to result in a material change tothe company’s financial position. In addition, the company is in advanced stages of audits in certain foreignjurisdictions and certain domestic states. Based on the resolution of the various audits mentioned above, it isreasonably possible that the balance of unrecognized tax benefits may change by $13 million to $63 millionduring 2010.
The company recognizes interest and penalties accrued related to unrecognized tax benefits in income taxexpense in the consolidated statements of operations. During the years ended December 31, 2009, 2008 and
76
NOTES TO CONSOLIDATED FINANCIAL STATEMENTS—(Continued)
2007, the company recognized interest and penalties totaling $27 million, $3 million and $16 million. Thecompany accrued $83 million and $43 million for the payment of interest and penalties at December 31, 2009and 2008, respectively.
Approximately $96 million of deferred income tax expense and $245 million of deferred income taxbenefits were provided for in components of other comprehensive income during the years ended December 31,2009 and 2008, respectively.
P. Environmental and legal matters
The company has been notified by the U.S. Environmental Protection Agency or by various state or localgovernments that it may be liable under federal environmental laws or under applicable state or local laws withrespect to the cleanup of hazardous substances at sites previously operated or used by the company. The company iscurrently named as a potentially responsible party (“PRP”), or has received third-party requests for contributionunder the Comprehensive Environmental Response, Compensation and Liability Act (“CERCLA”) and similar stateor local laws with respect to numerous sites. There are other sites which may contain contamination or which maybe potential Superfund sites, but for which MeadWestvaco has not received any notice or claim. The potentialliability for all these sites will depend upon several factors, including the extent of contamination, the method ofremediation, insurance coverage and contribution by other PRPs. The company regularly evaluates its potentialliability at these various sites. At December 31, 2009, MeadWestvaco had recorded liabilities of approximately $24million for estimated potential cleanup costs based upon its close monitoring of ongoing activities and its pastexperience with these matters. The company believes that it is reasonably possible that costs associated with thesesites may exceed amounts of recorded liabilities by an amount that could range from an insignificant amount to asmuch as $10 million. This estimate is less certain than the estimate upon which the environmental liabilities werebased. After consulting with legal counsel and after considering established liabilities, it is our judgment that theresolution of pending litigation and proceedings is not expected to have a material adverse effect on the company’sconsolidated financial condition or liquidity. In any given period or periods, however, it is possible suchproceedings or matters could have a material effect on the results of operations.
As with numerous other large industrial companies, the company has been named a defendant in asbestos-related personal injury litigation. Typically, these suits also name many other corporate defendants. To date, thecosts resulting from the litigation, including settlement costs, have not been significant. As of December 31,2009, there were approximately 560 lawsuits. Management believes that the company has substantialindemnification protection and insurance coverage, subject to applicable deductibles and policy limits, withrespect to asbestos claims. The company has valid defenses to these claims and intends to continue to defendthem vigorously. Additionally, based on its historical experience in asbestos cases and an analysis of the currentcases, the company believes that it has adequate amounts accrued for potential settlements and judgments inasbestos-related litigation. At December 31, 2009, the company had recorded litigation liabilities ofapproximately $19 million, a significant portion of which relates to asbestos. Should the volume of litigationgrow substantially, it is possible that the company could incur significant costs resolving these cases. Afterconsulting with legal counsel and after considering established liabilities, it is our judgment that the resolution ofpending litigation and proceedings is not expected to have a material adverse effect on the company’sconsolidated financial condition or liquidity. In any given period or periods, however, it is possible suchproceedings or matters could have a material effect on the results of operations.
MeadWestvaco is involved in various other litigation and administrative proceedings arising in the normalcourse of business. Although the ultimate outcome of such matters cannot be predicted with certainty,management does not believe that the currently expected outcome of any matter, lawsuit or claim that is pendingor threatened, or all of them combined, will have a material adverse effect on the company’s consolidatedfinancial condition or liquidity. In any given period or periods, however, it is possible such proceedings ormatters could have a material effect on the results of operations.
77
NOTES TO CONSOLIDATED FINANCIAL STATEMENTS—(Continued)
Q. Acquisitions and dispositions
2009 acquisitions
During 2009, the company acquired a provider of branded consumer products in Brazil to augment itsschool and office supplies business. The purchase price of this acquisition including direct transaction costs was$15 million. The total purchase price was allocated based on the fair values of the assets acquired and liabilitiesassumed. The results of operations for this acquisition are included in the Consumer & Office Products segment.This acquisition did not have a material effect on the company’s consolidated financial statements and as such,pro forma results for this acquisition are not presented.
2008 acquisitions
During 2008, acquisitions were made in North America and India to enhance the company’s performancechemical and consumer and office products businesses, strengthen the company’s capabilities in the pharmaceuticaland beverage packaging markets, and expand the company’s presence in emerging markets. The aggregate purchaseprice of these acquisitions including direct transaction costs was $18 million. These acquisitions resulted in $16million of identifiable intangible assets that will be amortized over a weighted-average amortization period of 6years with the remainder allocated to fixed assets and working capital items. For all acquisitions, the total purchaseprice was allocated based on the fair values of the assets acquired and liabilities assumed. The purchase priceallocations associated with these acquisitions were complete at December 31, 2008. Results of operations for theseacquisitions are included in the consolidated financial statements periods subsequent to their acquisition dates andare included in the Consumer & Office Products, Consumer Solutions, and Packaging Resources segments. Theseacquisitions did not have a material effect on the company’s consolidated financial statements and as such, proforma results for these acquisitions are not presented.
2007 acquisitions
During the third quarter of 2007, the company acquired two manufacturers of high-quality, innovativedispensing and sprayer systems to strengthen the company’s dispensing and spraying systems business. Theaggregate purchase price of these acquisitions was $52 million and resulted in $17 million of identifiableintangible assets that will be amortized over their estimated useful lives of 3 to 16 years, and goodwill of $24million with the remainder allocated to fixed assets and working capital items. For both acquisitions, the totalpurchase price was allocated based on the fair values of the assets acquired and liabilities assumed. The amountof goodwill was determined by comparing the total cash purchase price to the total fair values of the assetsacquired and liabilities assumed. Approximately $2 million of goodwill resulting from these transactions isdeductible for tax purposes. The amount paid for these acquisitions that resulted in goodwill was primarily due tothese businesses providing the company with new technologies and increased access to customers in growing andimportant end markets. The technologies from these acquisitions will be integrated with the company’s NorthAmerican, European and Asian production facilities to extend the company’s growth in critical markets such aspersonal care and home and garden. Results of operations for these acquisitions are included in the consolidatedfinancial statements periods subsequent to their acquisition dates and are included in the Consumer Solutionssegment. These acquisitions did not have a material effect on the company’s consolidated financial statementsand as such, pro forma results for these acquisitions are not presented.
Dispositions
On July 1, 2008, the company completed the sale of its Kraft business for net cash proceeds of $466 million.The sale resulted in a pre-tax gain of $13 million ($8 million after-tax) in the third quarter of 2008. For 2008, theafter-tax gain on sale, as well as the after-tax operating results of the Kraft business, is being reported as incomefrom discontinued operations in the consolidated statements of operations. Prior period amounts have been recaston a comparable basis. The results of operations and assets and liabilities of the Kraft business were previouslyincluded in the Packaging Resources segment.
78
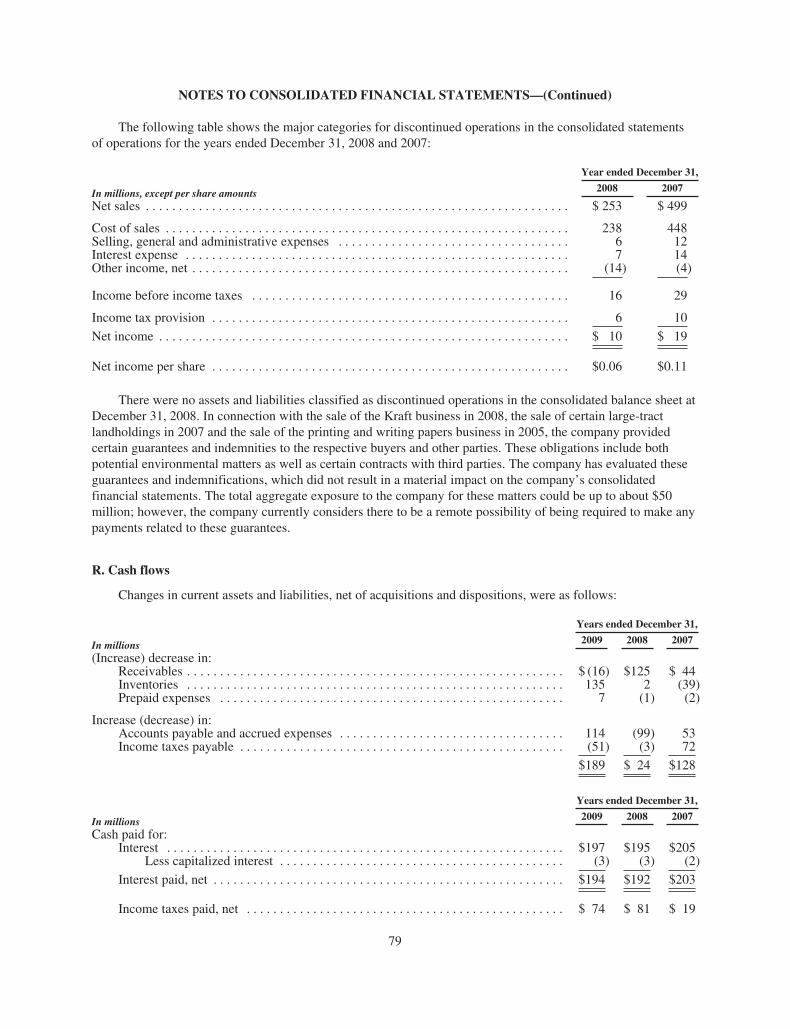
NOTES TO CONSOLIDATED FINANCIAL STATEMENTS—(Continued)
The following table shows the major categories for discontinued operations in the consolidated statementsof operations for the years ended December 31, 2008 and 2007:
In millions, except per share amounts
Year ended December 31,
2008 2007
Net sales . . . . . . . . . . . . . . . . . . . . . . . . . . . . . . . . . . . . . . . . . . . . . . . . . . . . . . . . . . . . . . . . $ 253 $ 499
Cost of sales . . . . . . . . . . . . . . . . . . . . . . . . . . . . . . . . . . . . . . . . . . . . . . . . . . . . . . . . . . . . . 238 448Selling, general and administrative expenses . . . . . . . . . . . . . . . . . . . . . . . . . . . . . . . . . . . 6 12Interest expense . . . . . . . . . . . . . . . . . . . . . . . . . . . . . . . . . . . . . . . . . . . . . . . . . . . . . . . . . . 7 14Other income, net . . . . . . . . . . . . . . . . . . . . . . . . . . . . . . . . . . . . . . . . . . . . . . . . . . . . . . . . . (14) (4)
Income before income taxes . . . . . . . . . . . . . . . . . . . . . . . . . . . . . . . . . . . . . . . . . . . . . . . . 16 29
Income tax provision . . . . . . . . . . . . . . . . . . . . . . . . . . . . . . . . . . . . . . . . . . . . . . . . . . . . . . 6 10
Net income . . . . . . . . . . . . . . . . . . . . . . . . . . . . . . . . . . . . . . . . . . . . . . . . . . . . . . . . . . . . . . $ 10 $ 19
Net income per share . . . . . . . . . . . . . . . . . . . . . . . . . . . . . . . . . . . . . . . . . . . . . . . . . . . . . . $0.06 $0.11
There were no assets and liabilities classified as discontinued operations in the consolidated balance sheet atDecember 31, 2008. In connection with the sale of the Kraft business in 2008, the sale of certain large-tractlandholdings in 2007 and the sale of the printing and writing papers business in 2005, the company providedcertain guarantees and indemnities to the respective buyers and other parties. These obligations include bothpotential environmental matters as well as certain contracts with third parties. The company has evaluated theseguarantees and indemnifications, which did not result in a material impact on the company’s consolidatedfinancial statements. The total aggregate exposure to the company for these matters could be up to about $50million; however, the company currently considers there to be a remote possibility of being required to make anypayments related to these guarantees.
R. Cash flows
Changes in current assets and liabilities, net of acquisitions and dispositions, were as follows:
In millions
Years ended December 31,
2009 2008 2007
(Increase) decrease in:Receivables . . . . . . . . . . . . . . . . . . . . . . . . . . . . . . . . . . . . . . . . . . . . . . . . . . . . . . . . . $ (16) $125 $ 44Inventories . . . . . . . . . . . . . . . . . . . . . . . . . . . . . . . . . . . . . . . . . . . . . . . . . . . . . . . . . 135 2 (39)Prepaid expenses . . . . . . . . . . . . . . . . . . . . . . . . . . . . . . . . . . . . . . . . . . . . . . . . . . . . 7 (1) (2)
Increase (decrease) in:Accounts payable and accrued expenses . . . . . . . . . . . . . . . . . . . . . . . . . . . . . . . . . . 114 (99) 53Income taxes payable . . . . . . . . . . . . . . . . . . . . . . . . . . . . . . . . . . . . . . . . . . . . . . . . . (51) (3) 72
$189 $ 24 $128
In millions
Years ended December 31,
2009 2008 2007
Cash paid for:Interest . . . . . . . . . . . . . . . . . . . . . . . . . . . . . . . . . . . . . . . . . . . . . . . . . . . . . . . . . . . . $197 $195 $205
Less capitalized interest . . . . . . . . . . . . . . . . . . . . . . . . . . . . . . . . . . . . . . . . . . . (3) (3) (2)
Interest paid, net . . . . . . . . . . . . . . . . . . . . . . . . . . . . . . . . . . . . . . . . . . . . . . . . . . . . . $194 $192 $203
Income taxes paid, net . . . . . . . . . . . . . . . . . . . . . . . . . . . . . . . . . . . . . . . . . . . . . . . . $ 74 $ 81 $ 19
79
NOTES TO CONSOLIDATED FINANCIAL STATEMENTS—(Continued)
In connection with the sale of certain large-tract forestlands in 2007, the company received a $398 millionlong-term installment note which does not require any principal payments until its maturity in May 2027. SeeNote C and Note E for related discussion.
S. Business segment information
MWV’s business segments are (i) Packaging Resources, (ii) Consumer Solutions, (iii) Consumer & OfficeProducts, (iv) Specialty Chemicals, and (v) Community Development and Land Management.
The Packaging Resources segment produces bleached paperboard (“SBS”), Coated Natural Kraft®
paperboard (“CNK®”) and linerboard. This segment’s paperboard products are manufactured at three millslocated in the U.S. and two mills located in Brazil. SBS is used for packaging high-value consumer products inmarkets such as pharmaceuticals, personal care, beauty, tobacco, and beverage and food service. CNK® is usedfor a range of packaging applications, the largest of which for MWV is multi-pack beverage packaging.Linerboard is used in the manufacture of corrugated boxes and other containers.
The Consumer Solutions segment designs and produces multi-pack cartons and packaging systems primarilyfor the global beverage take-home market and packaging for the global tobacco market. In addition, this segmentoffers a full range of converting and consumer packaging solutions including printed plastic packaging andinjection-molded products used for personal care, beauty, and pharmaceutical products; dispensing and sprayersystems for personal care, beauty, healthcare, fragrance and home and garden markets; and packaging for mediaproducts such as DVDs, CDs, video games and software. Paperboard and plastic are converted into packagingproducts at plants located in North America, South America, Europe and Asia. In addition, this segment has apharmaceutical packaging contract with a mass-merchant, and manufactures equipment that is leased or sold toits beverage and dairy customers to package their products.
The Consumer & Office Products segment manufactures, sources, markets and distributes school and officeproducts, time-management products and envelopes in North America and Brazil through both retail andcommercial channels. MWV produces many of the leading brand names in school supplies, time-managementand commercial office products, including AMCAL, ® AT-A-GLANCE, ® Cambridge, ® COLUMBIAN, ®
Day Runner, ® Five Star, ® Mead ® and Trapper Keeper. ®
The Specialty Chemicals segment manufactures, markets and distributes specialty chemicals derived fromsawdust and other byproducts of the papermaking process in North America, South America and Asia. Productsinclude activated carbon used in emission control systems for automobiles and trucks, as well as for water andfood purification applications, and performance chemicals used in printing inks, asphalt paving, adhesives andlubricants for the agricultural, paper and petroleum industries.
The Community Development and Land Management segment is responsible for maximizing the value ofthe company’s landholdings in North America. Operations of the segment include real estate development,forestry operations and leasing activities. Real estate development includes (i) selling non-core forestlandsprimarily for recreational and residential uses, (ii) entitling and improving high-value tracts through jointventures and other ownership arrangements, and (iii) master planning select landholdings. Forestry operationsinclude growing and harvesting softwood and hardwood on the company’s forestlands for external consumptionand for use by the company’s mill-based business. Leasing activities include fees from third parties undertakingmineral extraction operations, as well as fees from recreational leases on the company’s forestlands.
Corporate and Other includes corporate support staff services and related assets and liabilities, includingmerger-related goodwill, and the company’s specialty papers operation which was sold in the fourth quarter of2009. The results include income and expense items not directly associated with ongoing segment operations,
80
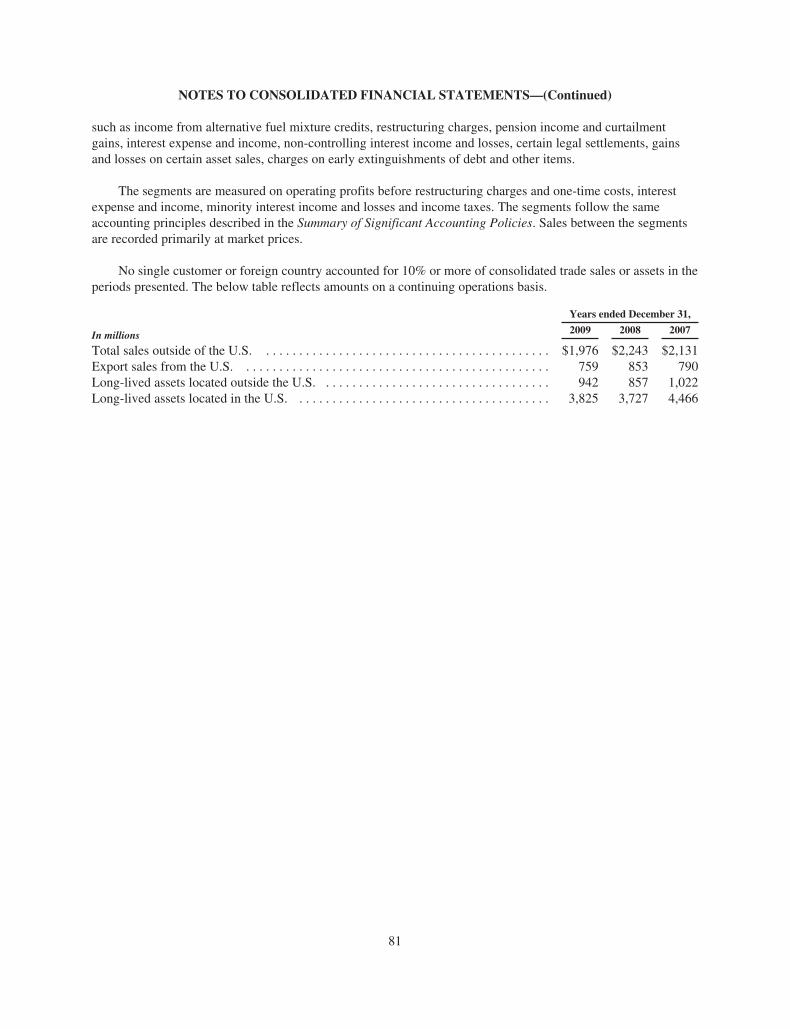
NOTES TO CONSOLIDATED FINANCIAL STATEMENTS—(Continued)
such as income from alternative fuel mixture credits, restructuring charges, pension income and curtailmentgains, interest expense and income, non-controlling interest income and losses, certain legal settlements, gainsand losses on certain asset sales, charges on early extinguishments of debt and other items.
The segments are measured on operating profits before restructuring charges and one-time costs, interestexpense and income, minority interest income and losses and income taxes. The segments follow the sameaccounting principles described in the Summary of Significant Accounting Policies. Sales between the segmentsare recorded primarily at market prices.
No single customer or foreign country accounted for 10% or more of consolidated trade sales or assets in theperiods presented. The below table reflects amounts on a continuing operations basis.
In millions
Years ended December 31,
2009 2008 2007
Total sales outside of the U.S. . . . . . . . . . . . . . . . . . . . . . . . . . . . . . . . . . . . . . . . . . . . $1,976 $2,243 $2,131Export sales from the U.S. . . . . . . . . . . . . . . . . . . . . . . . . . . . . . . . . . . . . . . . . . . . . . . 759 853 790Long-lived assets located outside the U.S. . . . . . . . . . . . . . . . . . . . . . . . . . . . . . . . . . . 942 857 1,022Long-lived assets located in the U.S. . . . . . . . . . . . . . . . . . . . . . . . . . . . . . . . . . . . . . . 3,825 3,727 4,466
81
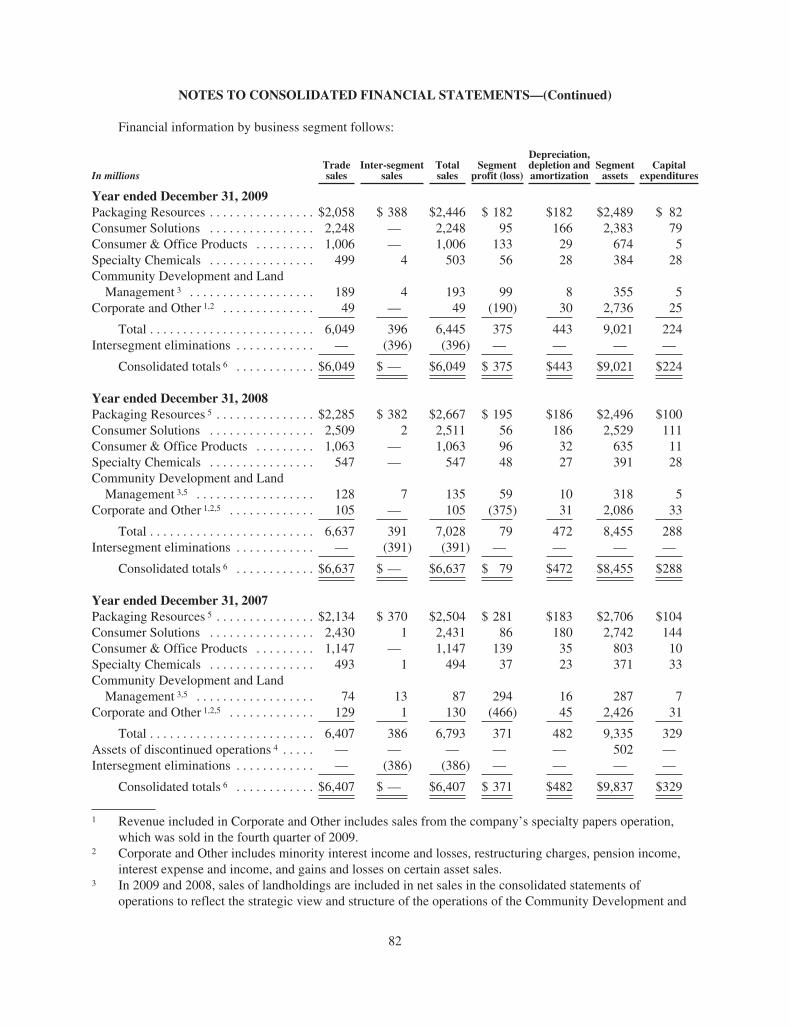
NOTES TO CONSOLIDATED FINANCIAL STATEMENTS—(Continued)
Financial information by business segment follows:
In millionsTradesales
Inter-segmentsales
Totalsales
Segmentprofit (loss)
Depreciation,depletion andamortization
Segmentassets
Capitalexpenditures
Year ended December 31, 2009Packaging Resources . . . . . . . . . . . . . . . . $2,058 $ 388 $2,446 $ 182 $182 $2,489 $ 82Consumer Solutions . . . . . . . . . . . . . . . . 2,248 — 2,248 95 166 2,383 79Consumer & Office Products . . . . . . . . . 1,006 — 1,006 133 29 674 5Specialty Chemicals . . . . . . . . . . . . . . . . 499 4 503 56 28 384 28Community Development and LandManagement 3 . . . . . . . . . . . . . . . . . . . 189 4 193 99 8 355 5
Corporate and Other 1,2 . . . . . . . . . . . . . . 49 — 49 (190) 30 2,736 25
Total . . . . . . . . . . . . . . . . . . . . . . . . . 6,049 396 6,445 375 443 9,021 224Intersegment eliminations . . . . . . . . . . . . — (396) (396) — — — —
Consolidated totals 6 . . . . . . . . . . . . $6,049 $ — $6,049 $ 375 $443 $9,021 $224
Year ended December 31, 2008Packaging Resources 5 . . . . . . . . . . . . . . . $2,285 $ 382 $2,667 $ 195 $186 $2,496 $100Consumer Solutions . . . . . . . . . . . . . . . . 2,509 2 2,511 56 186 2,529 111Consumer & Office Products . . . . . . . . . 1,063 — 1,063 96 32 635 11Specialty Chemicals . . . . . . . . . . . . . . . . 547 — 547 48 27 391 28Community Development and LandManagement 3,5 . . . . . . . . . . . . . . . . . . 128 7 135 59 10 318 5
Corporate and Other 1,2,5 . . . . . . . . . . . . . 105 — 105 (375) 31 2,086 33
Total . . . . . . . . . . . . . . . . . . . . . . . . . 6,637 391 7,028 79 472 8,455 288Intersegment eliminations . . . . . . . . . . . . — (391) (391) — — — —
Consolidated totals 6 . . . . . . . . . . . . $6,637 $ — $6,637 $ 79 $472 $8,455 $288
Year ended December 31, 2007Packaging Resources 5 . . . . . . . . . . . . . . . $2,134 $ 370 $2,504 $ 281 $183 $2,706 $104Consumer Solutions . . . . . . . . . . . . . . . . 2,430 1 2,431 86 180 2,742 144Consumer & Office Products . . . . . . . . . 1,147 — 1,147 139 35 803 10Specialty Chemicals . . . . . . . . . . . . . . . . 493 1 494 37 23 371 33Community Development and LandManagement 3,5 . . . . . . . . . . . . . . . . . . 74 13 87 294 16 287 7
Corporate and Other 1,2,5 . . . . . . . . . . . . . 129 1 130 (466) 45 2,426 31
Total . . . . . . . . . . . . . . . . . . . . . . . . . 6,407 386 6,793 371 482 9,335 329Assets of discontinued operations 4 . . . . . — — — — — 502 —Intersegment eliminations . . . . . . . . . . . . — (386) (386) — — — —
Consolidated totals 6 . . . . . . . . . . . . $6,407 $ — $6,407 $ 371 $482 $9,837 $329
1 Revenue included in Corporate and Other includes sales from the company’s specialty papers operation,which was sold in the fourth quarter of 2009.
2 Corporate and Other includes minority interest income and losses, restructuring charges, pension income,interest expense and income, and gains and losses on certain asset sales.
3 In 2009 and 2008, sales of landholdings are included in net sales in the consolidated statements ofoperations to reflect the strategic view and structure of the operations of the Community Development and
82
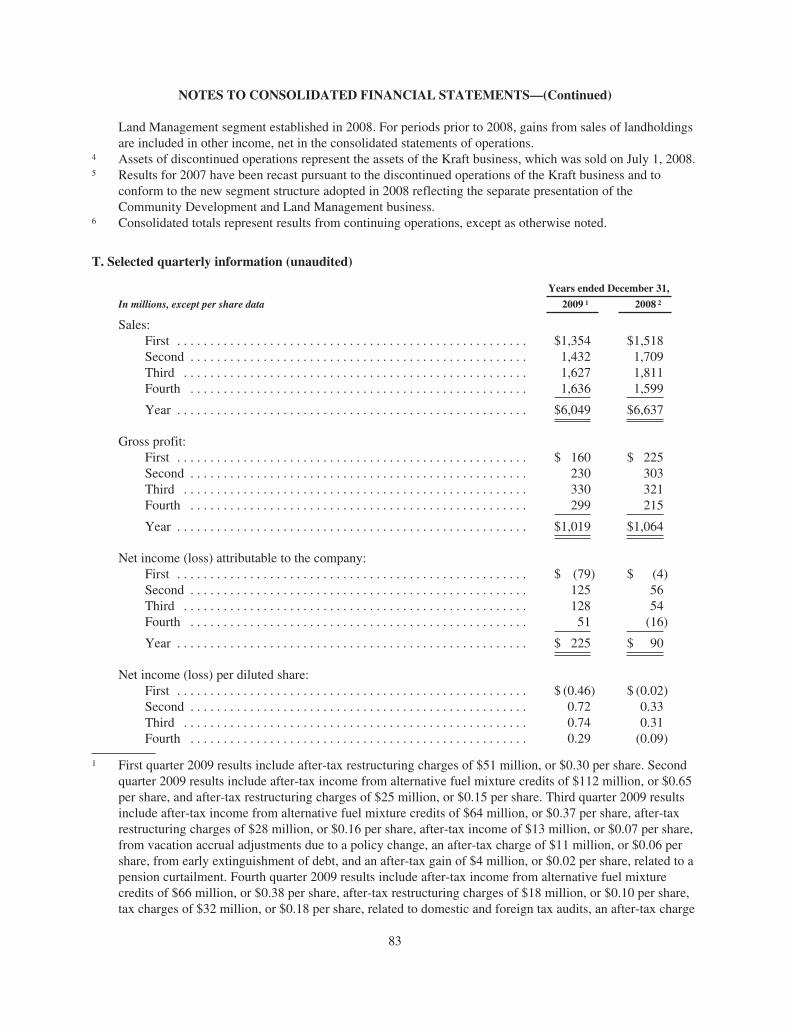
NOTES TO CONSOLIDATED FINANCIAL STATEMENTS—(Continued)
Land Management segment established in 2008. For periods prior to 2008, gains from sales of landholdingsare included in other income, net in the consolidated statements of operations.
4 Assets of discontinued operations represent the assets of the Kraft business, which was sold on July 1, 2008.5 Results for 2007 have been recast pursuant to the discontinued operations of the Kraft business and to
conform to the new segment structure adopted in 2008 reflecting the separate presentation of theCommunity Development and Land Management business.
6 Consolidated totals represent results from continuing operations, except as otherwise noted.
T. Selected quarterly information (unaudited)
Years ended December 31,
In millions, except per share data 2009 1 2008 2
Sales:First . . . . . . . . . . . . . . . . . . . . . . . . . . . . . . . . . . . . . . . . . . . . . . . . . . . . . $1,354 $1,518Second . . . . . . . . . . . . . . . . . . . . . . . . . . . . . . . . . . . . . . . . . . . . . . . . . . . 1,432 1,709Third . . . . . . . . . . . . . . . . . . . . . . . . . . . . . . . . . . . . . . . . . . . . . . . . . . . . 1,627 1,811Fourth . . . . . . . . . . . . . . . . . . . . . . . . . . . . . . . . . . . . . . . . . . . . . . . . . . . 1,636 1,599
Year . . . . . . . . . . . . . . . . . . . . . . . . . . . . . . . . . . . . . . . . . . . . . . . . . . . . . $6,049 $6,637
Gross profit:First . . . . . . . . . . . . . . . . . . . . . . . . . . . . . . . . . . . . . . . . . . . . . . . . . . . . . $ 160 $ 225Second . . . . . . . . . . . . . . . . . . . . . . . . . . . . . . . . . . . . . . . . . . . . . . . . . . . 230 303Third . . . . . . . . . . . . . . . . . . . . . . . . . . . . . . . . . . . . . . . . . . . . . . . . . . . . 330 321Fourth . . . . . . . . . . . . . . . . . . . . . . . . . . . . . . . . . . . . . . . . . . . . . . . . . . . 299 215
Year . . . . . . . . . . . . . . . . . . . . . . . . . . . . . . . . . . . . . . . . . . . . . . . . . . . . . $1,019 $1,064
Net income (loss) attributable to the company:First . . . . . . . . . . . . . . . . . . . . . . . . . . . . . . . . . . . . . . . . . . . . . . . . . . . . . $ (79) $ (4)Second . . . . . . . . . . . . . . . . . . . . . . . . . . . . . . . . . . . . . . . . . . . . . . . . . . . 125 56Third . . . . . . . . . . . . . . . . . . . . . . . . . . . . . . . . . . . . . . . . . . . . . . . . . . . . 128 54Fourth . . . . . . . . . . . . . . . . . . . . . . . . . . . . . . . . . . . . . . . . . . . . . . . . . . . 51 (16)
Year . . . . . . . . . . . . . . . . . . . . . . . . . . . . . . . . . . . . . . . . . . . . . . . . . . . . . $ 225 $ 90
Net income (loss) per diluted share:First . . . . . . . . . . . . . . . . . . . . . . . . . . . . . . . . . . . . . . . . . . . . . . . . . . . . . $ (0.46) $ (0.02)Second . . . . . . . . . . . . . . . . . . . . . . . . . . . . . . . . . . . . . . . . . . . . . . . . . . . 0.72 0.33Third . . . . . . . . . . . . . . . . . . . . . . . . . . . . . . . . . . . . . . . . . . . . . . . . . . . . 0.74 0.31Fourth . . . . . . . . . . . . . . . . . . . . . . . . . . . . . . . . . . . . . . . . . . . . . . . . . . . 0.29 (0.09)
1 First quarter 2009 results include after-tax restructuring charges of $51 million, or $0.30 per share. Secondquarter 2009 results include after-tax income from alternative fuel mixture credits of $112 million, or $0.65per share, and after-tax restructuring charges of $25 million, or $0.15 per share. Third quarter 2009 resultsinclude after-tax income from alternative fuel mixture credits of $64 million, or $0.37 per share, after-taxrestructuring charges of $28 million, or $0.16 per share, after-tax income of $13 million, or $0.07 per share,from vacation accrual adjustments due to a policy change, an after-tax charge of $11 million, or $0.06 pershare, from early extinguishment of debt, and an after-tax gain of $4 million, or $0.02 per share, related to apension curtailment. Fourth quarter 2009 results include after-tax income from alternative fuel mixturecredits of $66 million, or $0.38 per share, after-tax restructuring charges of $18 million, or $0.10 per share,tax charges of $32 million, or $0.18 per share, related to domestic and foreign tax audits, an after-tax charge
83
NOTES TO CONSOLIDATED FINANCIAL STATEMENTS—(Continued)
of $3 million, or $0.02 per share, from early extinguishment of debt, an after-tax expense of $12 million, or$0.07 per share, from a contribution to the MeadWestvaco Foundation, and after-tax gains of $12 million, or$0.06 per share, related to sales of certain assets.
2 First quarter 2008 results include after-tax restructuring charges of $5 million, or $0.03 per share, anafter-tax gain of $6 million, or $0.04 per share, related to a pension curtailment, and after-tax income fromdiscontinued operations of $4 million, or $0.02 per share. Second quarter 2008 results include after-taxrestructuring charges of $6 million, or $0.03 per share, an after-tax gain of $9 million, or $0.05 per share,related to the sale of corporate real estate, and an after-tax loss from discontinued operations of $2 million,or $0.01 per share. Third quarter 2008 results include after-tax income from discontinued operations of $8million, or $0.05 per share. Fourth quarter 2008 results include after-tax restructuring charges of $33million, or $0.19 per share.
84
Item 9. Changes in and disagreements with accountants on accounting and financial disclosure
None.
Item 9A. Controls and procedures
Management’s report on internal control over financial reporting.
Management is responsible for establishing and maintaining adequate internal control over financialreporting for the company. In order to evaluate the effectiveness of internal control over financial reporting,management has conducted an assessment, including testing, using the criteria established in Internal Control—Integrated Framework issued by the Committee of Sponsoring Organizations of the Treadway Commission(“COSO”). The company’s internal control over financial reporting, as defined in Rule 13a-15(f) under theSecurities Exchange Act of 1934 (“Exchange Act”), is a process designed to provide reasonable assuranceregarding the reliability of our financial reporting and the preparation of financial statements for externalpurposes in accordance with generally accepted accounting principles. Because of its inherent limitations,internal control over financial reporting may not prevent or detect misstatements. Also, projections of anyevaluation of effectiveness to future periods are subject to the risk that controls may become inadequate becauseof changes in conditions, or that the degree of compliance with the policies or procedures may deteriorate.
Based on our assessment, under the criteria established in Internal Control—Integrated Framework, issuedby the COSO, management has concluded that the company maintained effective internal control over financialreporting as of December 31, 2009. In addition, the effectiveness of the company’s internal control over financialreporting as of December 31, 2009 has been audited by PricewaterhouseCoopers LLP, an independent registeredpublic accounting firm, as stated in their report which appears in Part II, Item 8.
Evaluation of the company’s disclosure controls and procedures.
As of the end of the period covered by this Annual Report on Form 10-K, we evaluated the effectiveness ofour “disclosure controls and procedures” (as defined in Rule 13a-15(e) of the Exchange Act). This evaluationwas conducted under the supervision and with the participation of management, including our Chief ExecutiveOfficer (“CEO”) and Chief Financial Officer (“CFO”). Based on the evaluation of disclosure controls andprocedures, our CEO and CFO have concluded that the disclosure controls and procedures were effective andoperating to the reasonable assurance level, as of December 31, 2009, to ensure that information required to bedisclosed in the reports that we file or submit under the Securities Exchange Act of 1934 have been accumulatedand communicated to management, including our CEO and CFO, and other persons responsible for preparingsuch reports to allow timely decisions regarding required disclosure and that it is recorded, processed,summarized and reported within the time periods specified in the SEC’s rules and forms.
Changes in internal control over financial reporting.
During the fiscal year ended December 31, 2009, there was no change in our internal control over financialreporting that has materially affected, or is reasonably likely to materially effect, our internal control overfinancial reporting.
Item 9B. Other information
None.
85
Part III
Item 10. Directors, executive officers and corporate governance
Information required by this item for MeadWestvaco’s directors will be contained in MeadWestvaco’s 2010Proxy Statement, pursuant to Regulation 14A under the sections captioned “Nominees for Election as Directors,”and “Board Committees,” to be filed with the SEC on or before March 26, 2010, and is incorporated herein byreference. A portion of the information required by this item for MeadWestvaco’s executive officers is alsocontained in Part I of this report under the caption “Executive officers of the registrant.”
Item 11. Executive compensation
Information required by this item will be contained in MeadWestvaco’s 2010 Proxy Statement, pursuant toRegulation 14A under the sections captioned “Executive Compensation,” “Compensation Discussion andAnalysis,” and “Director Compensation,” to be filed with the SEC or before March 26, 2010, and is incorporatedherein by reference.
Item 12. Security ownership of certain beneficial owners and management and related stockholder matters
Information required by this item will be contained in MeadWestvaco’s 2010 Proxy Statement, pursuant toRegulation 14A under the sections captioned “Equity Compensation Plan Information,” “Ownership of Directorsand Executive Officers,” and “Ownership of Certain Beneficial Owners,” to be filed with the SEC on or beforeMarch 26, 2010, and is incorporated herein by reference.
Item 13. Certain relationships and related transactions, and director independence
Information required by this item will be contained in MeadWestvaco’s 2010 Proxy Statement, pursuant toRegulation 14A under the section captioned “Board Committees,” to be filed with the SEC on or beforeMarch 26, 2010, and is incorporated herein by reference.
Item 14. Principal accounting fees and services
Information required by this item will be contained in MeadWestvaco’s 2010 Proxy Statement, pursuant toRegulation 14A under the section captioned “Report of the Audit Committee of the Board of Directors,” to befiled with the SEC on or before March 26, 2010, and is incorporated herein by reference.
86
Part IV
Item 15. Exhibits, financial statement schedules
(a) Documents filed as part of this report:
1. Consolidated financial statements
The consolidated financial statements of MeadWestvaco Corporation and consolidated subsidiaries arelisted in the index which is included in Part II, Item 8.
2. Consolidated financial statement schedules
All financial statement schedules have been omitted because they are inapplicable, not required, or shown inthe consolidated financial statements and notes thereto contained herein.
3. Exhibits
3.1 Amended and Restated Certificate of Incorporation of the Registrant, previously filed as Exhibit 99.1to the company’s Form 8-K on May 1, 2008, and incorporated herein by reference.
3.2* Amended and Restated By-laws of the Registrant dated December, 2009.
4.1 Indenture dated as of April 2, 2002 by and among the Registrant, Westvaco Corporation, The MeadCorporation and The Bank of New York, as Trustee, previously filed as Exhibit 4(a) to the company’sForm 8-K on April 2, 2002 (SEC file number 001-31215), and incorporated herein by reference.
4.2 Form of Indenture, dated as of March 1, 1983, between Westvaco Corporation and The Bank of NewYork (formerly Irving Trust Company), as trustee, previously filed as Exhibit 2 to Westvaco’sRegistration Statement on Form 8-A on January 24, 1984 (SEC file number 001-03013), andincorporated herein by reference.
4.3 First Supplemental Indenture by and amongWestvaco Corporation, the Registrant, The Mead Corporationand The Bank of New York dated January 31, 2002, previously filed as Exhibit 4.1 to the company’s Form8-K on February 1, 2002 (SEC file number 001-31215), and incorporated herein by reference.
4.4 Second Supplemental Indenture between the Registrant and The Bank of New York dated December31, 2002, previously filed as Exhibit 4.1 to the company’s Form 8-K on January 7, 2003 (SEC filenumber 001-31215), and incorporated herein by reference.
4.5 Indenture dated as of February 1, 1993 between The Mead Corporation and The First National Bank ofChicago, as Trustee, previously filed as Exhibit 4.vv to the company’s Annual Report on Form 10-Kfor the Transition Period ended December 31, 2001, and incorporated herein by reference.
4.6 First Supplemental Indenture between The Mead Corporation, the Registrant, Westvaco Corporationand Bank One Trust Company, NA dated January 31, 2002, previously filed as Exhibit 4.3 to thecompany’s Form 8-K on February 1, 2002 (SEC file number 001-31215), and incorporated herein byreference.
4.7 Second Supplemental Indenture between MW Custom Papers, Inc. and Bank One Trust Company, NAdated December 31, 2002, previously filed as Exhibit 4.4 to the company’s Form 8-K on January 7,2003 (SEC file number 001-31215), and incorporated herein by reference.
4.8 Third Supplemental Indenture between the Registrant and Bank One Trust Company, NA datedDecember 31, 2002, previously filed as Exhibit 4.5 to the company’s Form 8-K on January 7, 2003(SEC file number 001-31215), and incorporated herein by reference.
4.9 Rights Agreement dated as of January 29, 2002 between the Registrant and The Bank of New York,previously filed as Item 2 to the company’s Form 8-A on January 29, 2002 (SEC file number 001-31215), and incorporated herein by reference.
87
4.10 Amendment to Rights Agreement dated as of December 21, 2007 between Registrant and the Bank ofNew York filed as Exhibit 4.2 to the company’s Form 8-A/A on December 26, 2007 (SEC file number001-31215), and incorporated herein by reference.
4.11* $600 Million Three-Year Credit Agreement, dated as of October 19, 2009, among the Registrant witha syndicate of commercial banks, including Citibank, N.A., as administrative agent.
4.12 Form of 7.375% Note due in 2019, previously filed as Exhibit 4.1 to the company’s Form 8-K onAugust 25, 2009, and incorporated herein by reference.
10.1+ The Mead Corporation 1991 Stock Option Plan, as amended through June 24, 1999, previously filed asExhibit 10.xxvii to the company’s Annual Report on Form 10-K for the Transition Period endedDecember 31, 2001, and incorporated herein by reference.
10.2+ The Mead Corporation 1996 Stock Option Plan, as amended through June 24, 1999 and amendedFebruary 22, 2001, previously filed as Exhibit 10.3 to Mead’s Quarterly Report on Form 10-Q for theperiod ended July 4, 1999 (SEC file number 001-02267) and Appendix 2 to Mead’s definitive proxystatement for the 2001 Annual Meeting of Shareholders, and incorporated herein by reference.
10.3+ Amendment to The Mead Corporation 1996 Stock Option Plan, effective April 23, 2002, previouslyfiled as Exhibit 10.3 to the company’s Quarterly Report on Form 10-Q for the period ended June 30,2002, and incorporated herein by reference.
10.4+ Amendment to The Mead Corporation 1996 Stock Option Plan effective January 23, 2007, aspreviously filed as Exhibit 10.4 to the company’s Annual Report on Form 10-K for the year endedDecember 31, 2007, and incorporated herein by reference.
10.5+ 1985 Supplement to The Mead Corporation Incentive Compensation Election Plan, as amendedNovember 17, 1987, and as further amended October 29, 1988; as amended effective June 24, 1998; asamended effective October 26, 2001, previously filed as Exhibit 10.xxix to the company’s AnnualReport on Form 10-K for the Transition Period ended December 31, 2001, and incorporated herein byreference.
10.6+ The Mead Corporation Supplemental Executive Retirement Plan effective January 1, 1997; asamended effective June 24, 1998; as amended effective August 28, 2001, previously filed as Exhibit10.xxxii to the company’s Annual Report on Form 10-K for the Transition Period ended December 31,2001, and incorporated herein by reference.
10.7+ Third Amendment to The Mead Corporation Supplemental Executive Retirement Plan in whichexecutive officers participate, previously filed as Exhibit 10.1 to the company’s Quarterly Report onForm 10-Q for the period ended March 30, 2002 (SEC file number 001-31215), and incorporatedherein by reference.
10.8+ Benefit Trust Agreement dated August 27, 1996 between The Mead Corporation and Key TrustCompany of Ohio, N.A.; as amended effective June 24, 1998; as amended effective October 28, 2000;as amended effective June 28, 2001; as amended August 28, 2001, previously filed as Exhibit 10.xxxivto the company’s Annual Report on Form 10-K for the Transition Period ended December 31, 2001,and incorporated herein by reference.
10.9+ The Mead Corporation Restricted Stock Plan effective December 10, 1987, as amended throughJune 24, 1999, previously filed as Exhibit 10.xxxv to the company’s Annual Report on Form 10-K forthe Transition Period ended December 31, 2001, and incorporated herein by reference.
10.10+ Amendment to The Mead Corporation Restricted Stock Plan effective January 23, 2007, as previouslyfiled as Exhibit 10.10 to the company’s Annual Report on Form 10-K for the year ended December 31,2007, and incorporated herein by reference.
10.11+ Ninth Amendment to The Mead Corporation Restricted Stock Plan, previously filed as Exhibit 10.5 tothe company’s Quarterly Report on Form 10-Q for the period ended March 31, 2002 (SEC file number001-31215), and incorporated herein by reference.
88
10.12+ The Mead Corporation Deferred Compensation Plan for Directors, as amended through October 29,1988; as amended effective June 24, 1998; as amended effective October 26, 2001, previously filed asExhibit 10.xxxvi to the company’s Annual Report on Form 10-K for the Transition Period endedDecember 31, 2001, and incorporated herein by reference.
10.13+ 1985 Supplement to The Mead Corporation Deferred Compensation Plan for Directors, as amendedthrough October 29, 1988; as amended effective June 24, 1998; as amended effective October 26,2001, previously filed as Exhibit 10.xxxvii to the company’s Annual Report on Form 10-K for theTransition Period ended December 31, 2001, and incorporated herein by reference.
10.14+ The Mead Corporation Directors Capital Accumulation Plan as Amended and Restated effectiveJanuary 1, 2000; as amended effective October 26, 2001, previously filed as Exhibit 10.xxxviii to thecompany’s Annual Report on Form 10-K for the Transition Period ended December 31, 2001, andincorporated herein by reference.
10.15+ Westvaco Corporation 1995 Salaried Employee Stock Incentive Plan, effective February 28, 1995,previously filed at Exhibit 99 to Westvaco’s Registration Statement on Form S-8 on February 28,1995, and incorporated herein by reference.
10.16+ Amendment to Westvaco Corporation 1995 Salaried Employee Stock Incentive Plan, effectiveApril 23, 2002, previously filed as Exhibit 10-2 to the company’s Quarterly Report on Form 10-Q forthe period ended June 30, 2002 (SEC file number 001-31215), and incorporated herein by reference.
10.17+ Westvaco Corporation 1999 Salaried Employee Stock Incentive Plan, effective September 17, 1999,previously filed as Appendix A to Westvaco’s definitive proxy statement for the 1999 Annual Meetingof Shareholders (SEC file number 001-03013), and incorporated herein by reference.
10.18+ Amendment to Westvaco Corporation 1999 Salaried Employee Stock Incentive Plan effective as ofApril 23, 2002, previously filed as Exhibit 10.1 to the company’s Quarterly Report on Form 10-Q forthe period ended June 30, 2002 (SEC file number 001-31215), and incorporated herein by reference.
10.19+ Amendment to Westvaco Corporation 1999 Salaried Employee Stock Incentive Plan effectiveJanuary 23, 2007, as previously filed as Exhibit 10.19 to the company’s Annual Report on Form 10-Kfor the year ended December 31, 2007, and incorporated herein by reference.
10.20+ MeadWestvaco Corporation Compensation Plan for Non-Employee Directors as Amended andRestated effective January 1, 2009 except as otherwise provided, previously filed as Exhibit 10.20 tothe company’s Annual Report on Form 10-K for the year ended December 31, 2008, and incorporatedherein by reference.
10.22 Equity and Asset Purchase Agreement dated as of January 14, 2005 between the Registrant andMaple Acquisition LLC, previously filed as Exhibit 99.1 on the company’s Form 8-K on January 21,2005, for the sale of its papers business and associated assets, and incorporated herein by reference.
10.23+ MeadWestvaco Corporation 2005 Performance Incentive Plan effective April 22, 2005 and asamended February 26, 2007 and January 1, 2009 previously filed as Exhibit 10.1 to the company’sForm 8-K on April 30, 2009, and incorporated herein by reference.
10.24+ MeadWestvaco Corporation Executive Retirement Plan, as amended and restated effective January 1,2009 except as otherwise provided, previously filed as Exhibit 10.24 to the company’s Annual Reporton Form 10-K for the year ended December 31, 2008, and incorporated herein by reference.
10.25+ MeadWestvaco Corporation Deferred Income Plan Restatement effective January 1, 2007 except asotherwise provided, previously filed as Exhibit 10.25 to the company’s Annual Report on Form 10-Kfor the year ended December 31, 2008, and incorporated herein by reference.
10.26+ MeadWestvaco Corporation Retirement Restoration Plan effective January 1, 2009, except asotherwise provided, previously filed as Exhibit 10.26 to the company’s Annual Report on Form 10-Kfor the year ended December 31, 2008, and incorporated herein by reference.
89
10.27+* MeadWestvaco Corporation Compensation Program for Non-Employee Directors effectiveJanuary 25, 2009.
10.28+ Form of Employment Agreement dated January 1, 2008, for Mark T. Watkins, as previously filed asExhibit 10.33 to the company’s Annual Report on Form 10-K for the year ended December 31, 2007,and incorporated herein by reference.
10.29 Form of Employment Agreement dated January 1, 2008, for John A. Luke, Jr., James A. Buzzard, E.Mark Rajkowski and Wendell L. Willkie, II, as previously filed as Exhibit 10.32 to the company’sAnnual Report on Form 10-K for the year ended December 31, 2007, and incorporated herein byreference.
10.30+ Amendments to The Mead Corporation Incentive Compensation Election Plan, The Mead CorporationDeferred Compensation Plan for Directors, The Mead Corporation Directors Capital AccumulationPlan, Westvaco Corporation Deferred Compensation Plan, Westvaco Corporation Savings andInvestment Restoration Plan, Westvaco Corporation Deferred Compensation Plan for Non-EmployeeOutside Directors, and Westvaco Corporation Retirement Plan for Outside Directors, previously filedas Exhibit 10.30 to the company’s Annual Report on Form 10-K for the year ended December 31,2008, and incorporated herein by reference.
10.31+ Westvaco Corporation Retirement Plan for Outside Directors, as previously filed as Exhibit 10.i to thecompany’s Annual Report on Form 10-K for the year ended October 31, 1996, and incorporated hereinby reference.
10.32+ Summary of MeadWestvaco Corporation Long-Term Incentive Plan under 2005 PerformanceIncentive Plan, as amended, previously filed as Exhibit 10.31 to the company’s Annual Report onForm 10-K for the year ended December 31, 2008, and incorporated herein by reference.
10.33+ Summary of MeadWestvaco Corporation Annual Incentive Plan under 2005 Performance IncentivePlan, as amended, previously filed as Exhibit 10.32 to the company’s Annual Report on Form 10-K forthe year ended December 31, 2008, and incorporated by reference.
10.34+* Summary of MeadWestvaco Corporation 2010 Long-Term Incentive Plan under the 2005 PerformancePlan, as amended.
10.35+* Summary of MeadWestvaco Corporation 2010 Annual Incentive Plan under the 2005 PerformanceIncentive Plan, as amended.
10.36+ Stock Option Awards in 2009—Terms and Conditions, previously filed as Exhibit 10.3 to thecompany’s Quarterly Report on Form 10-Q for the period ended March 31, 2009, and incorporatedherein by reference.
10.37+ Service Based Restricted Stock Unit Awards in 2009 – Terms and Conditions, previously filed asExhibit 10.4 to the company’s Quarterly Report on Form 10-Q for the period ended March 31, 2009,and incorporated herein by reference.
21.* Subsidiaries of the Registrant.
23.1* Consent of PricewaterhouseCoopers LLP.
31.1* Rule 13a-14(a) Certification by Chief Executive Officer.
31.2* Rule 13a-14(a) Certification by Chief Financial Officer.
32.1* Section 1350 Certification by Chief Executive Officer.
32.2* Section 1350 Certification by Chief Financial Officer.
* Filed herewith.+ Management contract or compensatory plan or arrangement.
We agree to furnish copies of other instruments defining the rights of holders of long-term debt to theCommission upon its request.
90
SIGNATURES
Pursuant to the requirements of Section 13 or 15(d) of the Securities Exchange Act of 1934, the registranthas duly caused this report to be signed on its behalf by the undersigned, thereunto duly authorized.
MEADWESTVACO CORPORATION(Registrant)
February 23, 2010/s/ E. MARK RAJKOWSKI
Name: E. Mark Rajkowski
Title: Chief Financial Officer
91
Pursuant to the requirements of the Securities Exchange Act of 1934, this report has been signed below bythe following persons on behalf of the registrant and in the capacities and on the dates indicated.
Signatures Title Date
/S/ JOHN A. LUKE, JR.John A. Luke, Jr.
Chairman of the Board of Directorsand Chief Executive Officer(Principal Executive Officer andDirector)
February 23, 2010
/S/ E. MARK RAJKOWSKI
E. Mark Rajkowski
Senior Vice President(Chief Financial Officer)
February 23, 2010
/S/ JOHN E. BANU
John E. Banu
Vice President and Controller(Principal Accounting Officer)
February 23, 2010
/S/ MICHAEL E. CAMPBELL
Michael E. Campbell
Director February 23, 2010
/S/ DR. THOMAS W. COLE, JR.Dr. Thomas W. Cole, Jr.
Director February 23, 2010
/S/ JAMES G. KAISER
James G. Kaiser
Director February 23, 2010
/S/ RICHARD B. KELSON
Richard B. Kelson
Director February 23, 2010
/S/ JAMES M. KILTS
James M. Kilts
Director February 23, 2010
/S/ SUSAN J. KROPF
Susan J. Kropf
Director February 23, 2010
/S/ DOUGLAS S. LUKEDouglas S. Luke
Director February 23, 2010
/S/ ROBERT C. MCCORMACK
Robert C. McCormack
Director February 23, 2010
/S/ TIMOTHY H. POWERS
Timothy H. Powers
Director February 23, 2010
/S/ EDWARD M. STRAWEdward M. Straw
Director February 23, 2010
/S/ JANE L. WARNER
Jane L. Warner
Director February 23, 2010
92
EXHIBIT 31.1
CERTIFICATION
I, John A. Luke, Jr. certify that:
1. I have reviewed this annual report on Form 10-K of MeadWestvaco Corporation;
2. Based on my knowledge, this report does not contain any untrue statement of a material fact or omit to statea material fact necessary to make the statements made, in light of the circumstances under which suchstatements were made, not misleading with respect to the period covered by this report;
3. Based on my knowledge, the financial statements, and other financial information included in this report,fairly present in all material respects the financial condition, results of operations and cash flows of theregistrant as of, and for, the periods presented in this report;
4. The registrant’s other certifying officer(s) and I are responsible for establishing and maintaining disclosurecontrols and procedures (as defined in Exchange Act Rules 13a-15(e) and 15d-15(e)) and internal controlover financial reporting (as defined in Exchange Act Rules 13a-15(f) and 15d-15(f)) for the registrant andhave:
(a) Designed such disclosure controls and procedures, or caused such disclosure controls and procedures tobe designed under our supervision, to ensure that material information relating to the registrant,including its consolidated subsidiaries, is made known to us by others within those entities, particularlyduring the period in which this report is being prepared;
(b) Designed such internal control over financial reporting, or caused such internal control over financialreporting to be designed under our supervision, to provide reasonable assurance regarding thereliability of financial reporting and the preparation of financial statements for external purposes inaccordance with generally accepted accounting principles;
(c) Evaluated the effectiveness of the registrant’s disclosure controls and procedures and presented in thisreport our conclusions about the effectiveness of the disclosure controls and procedures, as of the endof the period covered by this report based on such evaluation; and
(d) Disclosed in this report any change in the registrant’s internal control over financial reporting thatoccurred during the registrant’s most recent fiscal quarter (the registrant’s fourth fiscal quarter in thecase of an annual report) that has materially affected, or is reasonably likely to materially affect, theregistrant’s internal control over financial reporting; and
5. The registrant’s other certifying officer(s) and I have disclosed, based on our most recent evaluation ofinternal control over financial reporting, to the registrant’s auditors and the audit committee of theregistrant’s board of directors (or persons performing the equivalent functions):
(a) All significant deficiencies and material weaknesses in the design or operation of internal control overfinancial reporting which are reasonably likely to adversely affect the registrant’s ability to record,process, summarize and report financial information; and
(b) Any fraud, whether or not material, that involves management or other employees who have asignificant role in the registrant’s internal control over financial reporting.
Date: February 23, 2010
/s/ JOHN A. LUKE, JR.
Name: John A. Luke, Jr.
Title: Chief Executive Officer
93

[THIS PAGE INTENTIONALLY LEFT BLANK]
94
EXHIBIT 31.2
CERTIFICATION
I, E. Mark Rajkowski certify that:
1. I have reviewed this annual report on Form 10-K of MeadWestvaco Corporation;
2. Based on my knowledge, this report does not contain any untrue statement of a material fact or omit to statea material fact necessary to make the statements made, in light of the circumstances under which suchstatements were made, not misleading with respect to the period covered by this report;
3. Based on my knowledge, the financial statements, and other financial information included in this report,fairly present in all material respects the financial condition, results of operations and cash flows of theregistrant as of, and for, the periods presented in this report;
4. The registrant’s other certifying officer(s) and I are responsible for establishing and maintaining disclosurecontrols and procedures (as defined in Exchange Act Rules 13a-15(e) and 15d-15(e)) and internal controlover financial reporting (as defined in Exchange Act Rules 13a-15(f) and 15d-15(f)) for the registrant andhave:
(a) Designed such disclosure controls and procedures, or caused such disclosure controls and procedures tobe designed under our supervision, to ensure that material information relating to the registrant,including its consolidated subsidiaries, is made known to us by others within those entities, particularlyduring the period in which this report is being prepared;
(b) Designed such internal control over financial reporting, or caused such internal control over financialreporting to be designed under our supervision, to provide reasonable assurance regarding thereliability of financial reporting and the preparation of financial statements for external purposes inaccordance with generally accepted accounting principles;
(c) Evaluated the effectiveness of the registrant’s disclosure controls and procedures and presented in thisreport our conclusions about the effectiveness of the disclosure controls and procedures, as of the endof the period covered by this report based on such evaluation; and
(d) Disclosed in this report any change in the registrant’s internal control over financial reporting thatoccurred during the registrant’s most recent fiscal quarter (the registrant’s fourth fiscal quarter in thecase of an annual report) that has materially affected, or is reasonably likely to materially affect, theregistrant’s internal control over financial reporting; and
5. The registrant’s other certifying officer(s) and I have disclosed, based on our most recent evaluation ofinternal control over financial reporting, to the registrant’s auditors and the audit committee of theregistrant’s board of directors (or persons performing the equivalent functions):
(a) All significant deficiencies and material weaknesses in the design or operation of internal control overfinancial reporting which are reasonably likely to adversely affect the registrant’s ability to record,process, summarize and report financial information; and
(b) Any fraud, whether or not material, that involves management or other employees who have asignificant role in the registrant’s internal control over financial reporting.
Date: February 23, 2010
/s/ E. MARK RAJKOWSKI
Name: E. Mark Rajkowski
Title: Chief Financial Officer
95

[THIS PAGE INTENTIONALLY LEFT BLANK]
96
EXHIBIT 32.1
CERTIFICATION PURSUANT TO18 U.S.C. SECTION 1350,
AS ADOPTED PURSUANT TOSECTION 906 OF THE SARBANES-OXLEY ACT OF 2002
The undersigned hereby certifies, in his capacity as an officer of MeadWestvaco Corporation (the“Company”), for purposes of 18 U.S.C. Section 1350, as adopted pursuant to Section 906 of the Sarbanes-OxleyAct of 2002, that:
• the Annual Report of the Company on Form 10-K for the period ended December 31, 2009 fullycomplies with the requirements of Section 13(a) or 15 (d) of the Securities Exchange Act of 1934; and
• the information contained in such report fairly presents, in all material respects, the financial conditionand results of operation of the Company.
Date: February 23, 2010
/s/ JOHN A. LUKE, JR.
Name: John A. Luke, Jr.
Title: Chief Executive Officer
97
[THIS PAGE INTENTIONALLY LEFT BLANK]
98
EXHIBIT 32.2
CERTIFICATION PURSUANT TO18 U.S.C. SECTION 1350,
AS ADOPTED PURSUANT TOSECTION 906 OF THE SARBANES-OXLEY ACT OF 2002
The undersigned hereby certifies, in his capacity as an officer of MeadWestvaco Corporation (the“Company”), for purposes of 18 U.S.C. Section 1350, as adopted pursuant to Section 906 of the Sarbanes-OxleyAct of 2002, that:
• the Annual Report of the Company on Form 10-K for the period ended December 31, 2009 fullycomplies with the requirements of Section 13(a) or 15(d) of the Securities Exchange Act of 1934; and
• the information contained in such report fairly presents, in all material respects, the financial conditionand results of operation of the Company.
Date: February 23, 2010
/s/ E. MARK RAJKOWSKI
Name: E. Mark Rajkowski
Title: Chief Financial Officer
99
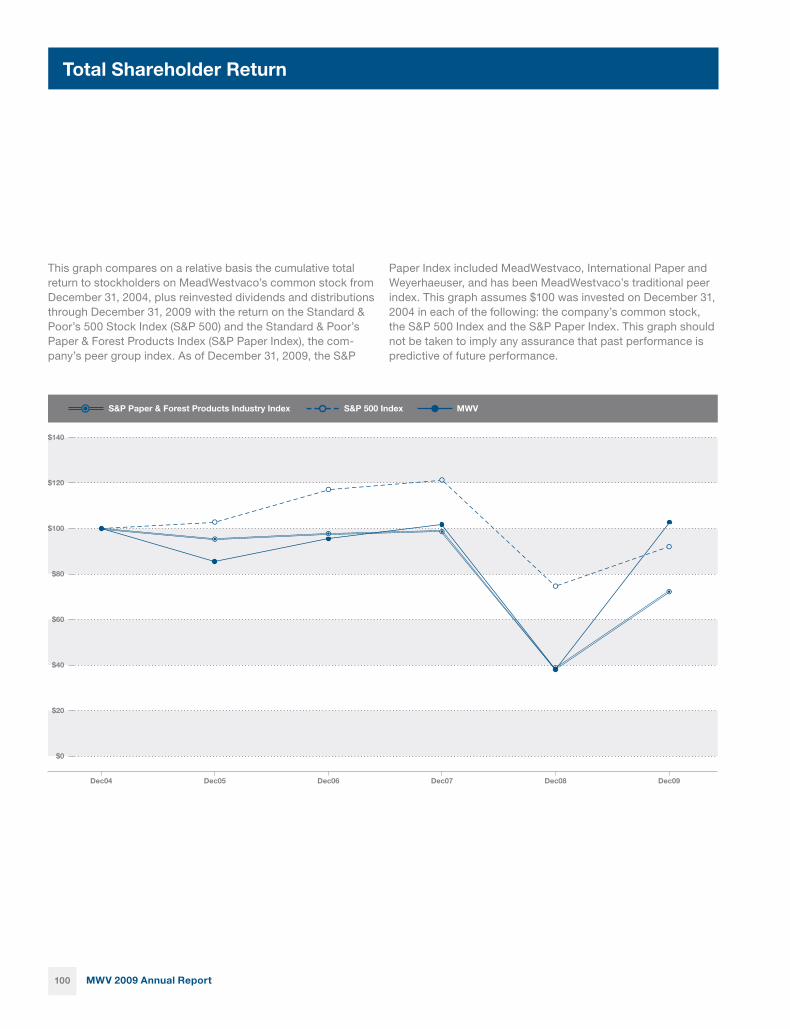
This graph compares on a relative basis the cumulative total return to stockholders on MeadWestvaco’s common stock from December 31, 2004, plus reinvested dividends and distributions through December 31, 2009 with the return on the Standard & Poor’s 500 Stock Index (S&P 500) and the Standard & Poor’s Paper & Forest Products Index (S&P Paper Index), the com-pany’s peer group index. As of December 31, 2009, the S&P
Paper Index included MeadWestvaco, International Paper and Weyerhaeuser, and has been MeadWestvaco’s traditional peer index. This graph assumes $100 was invested on December 31, 2004 in each of the following: the company’s common stock, the S&P 500 Index and the S&P Paper Index. This graph should not be taken to imply any assurance that past performance is predictive of future performance.
Dec04 Dec05 Dec06 Dec07 Dec08 Dec09
$140
$120
$100
$80
$40
$20
$60
$0
S&P Paper & Forest Products Industry Index S&P 500 Index MWV
MWV 2009 Annual Report100
Total Shareholder Return
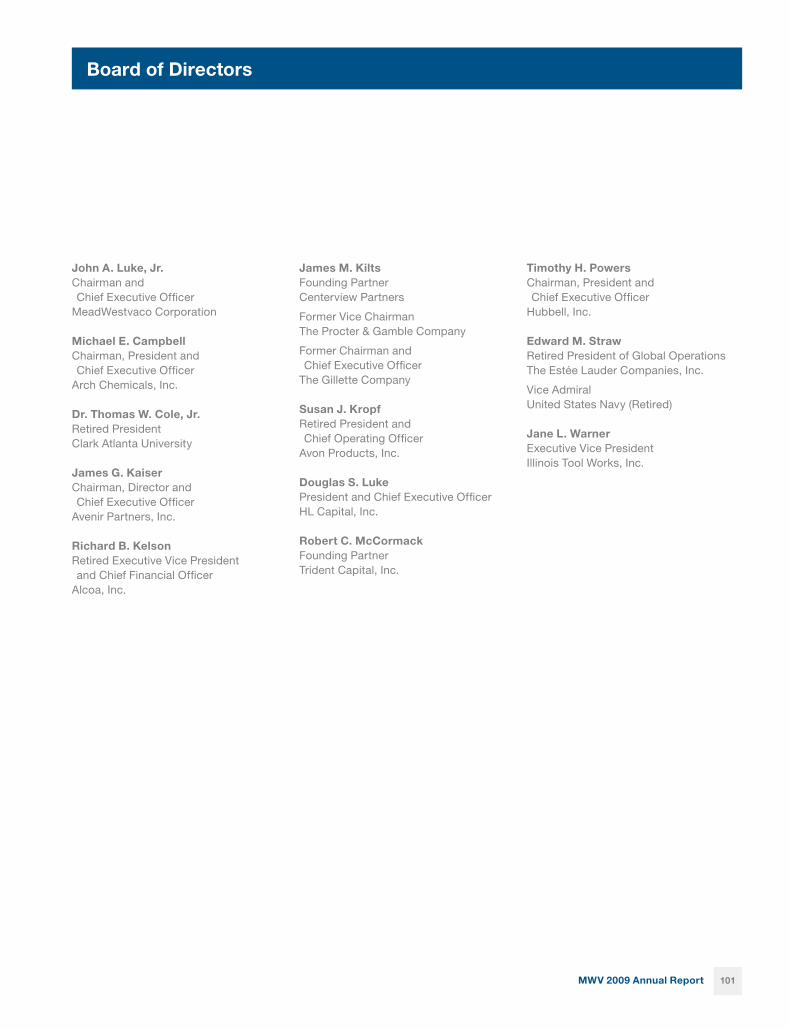
John A. Luke, Jr.Chairman andChief Executive Offi cer
MeadWestvaco Corporation
Michael E. CampbellChairman, President and Chief Executive Offi cer
Arch Chemicals, Inc.
Dr. Thomas W. Cole, Jr.Retired PresidentClark Atlanta University
James G. KaiserChairman, Director and Chief Executive Offi cer
Avenir Partners, Inc.
Richard B. KelsonRetired Executive Vice President and Chief Financial Offi cer
Alcoa, Inc.
James M. KiltsFounding PartnerCenterview Partners
Former Vice ChairmanThe Procter & Gamble Company
Former Chairman and Chief Executive Offi cer
The Gillette Company
Susan J. KropfRetired President and Chief Operating Offi cer
Avon Products, Inc.
Douglas S. LukePresident and Chief Executive Offi cerHL Capital, Inc.
Robert C. McCormackFounding PartnerTrident Capital, Inc.
Timothy H. PowersChairman, President andChief Executive Offi cer
Hubbell, Inc.
Edward M. StrawRetired President of Global OperationsThe Estée Lauder Companies, Inc.
Vice AdmiralUnited States Navy (Retired)
Jane L. WarnerExecutive Vice PresidentIllinois Tool Works, Inc.
MWV 2009 Annual Report 101
Board of Directors
Leadership Team
John A. Luke, Jr.Chairman andChief Executive Offi cer
James A. BuzzardPresident
Mark S. CrossSenior Vice President
E. Mark RajkowskiSenior Vice President andChief Financial Offi cer
Linda V. SchreinerSenior Vice President
Bruce V. ThomasSenior Vice President
Wendell L. Willkie IISenior Vice President,General Counsel andSecretary
Division / Group Leaders
Alejandro CedeñoVice PresidentGlobal Innovation
Robert A. FeeserPresidentPackaging Resources Group
Mark V. GullingPresidentGlobal Business Services
Thomas Y. JonasPresidentBeauty & Personal Care and Home & Garden
T.D. Lithgow, Ph.D.PresidentHealthcare
Neil A. McLachlanPresidentConsumer & Offi ce Products
Edward A. RosePresidentSpecialty Chemicals
Stephen R. SchergerPresidentBeverage, Media and Folding Carton Operations
Kenneth T. SeegerSenior Vice President and PresidentCommunity Development and Land Management
John C. TaylorPresidentPrimary Plastics Operations
Paulo TilkianPresidentRigesa
Corporate Offi cers
John E. BanuVice President and Controller
Robert E. BirkenholzTreasurer
John J. CarraraAssistant Secretary andAssociate General Counsel
Donna Owens CoxVice President
Peter C. DuretteVice President
Dirk J. KrouskopVice President
Ned W. MasseeVice President
Mark T. WatkinsSenior Vice President
MWV 2009 Annual Report102
MWV Management
Shareholder Information
Annual Meeting of Shareholders
The next meeting of shareholders will be held on: Monday, April 26, 2010, at 11:00 a.m.Waldorf Astoria Hotel301 Park AvenueNew York, NY 10022
Stock Exchange Listing
Symbol: MWVNew York Stock Exchange
MeadWestvaco Corporation common stock can be issued in direct registration (book entry or uncertifi cated) form. The stock is DRS (Direct Registration System) eligible.
Information Requests
Corporate SecretaryMeadWestvaco Corporation299 Park AvenueNew York, NY 10171A copy of the Company’s annual report fi led with the Securities and Exchange Commission (Form 10-K) will be furnished without charge to any shareholder upon written request to the address written above.
Telephone inquiries:+1 212 318 5714+1 800 432 9874 toll-free in the United States and Canada
Investor Relations
Please visit the MeadWestvaco Corporation Investor Relations site at http://www.meadwestvaco.com/AboutUs/InvestorRelations/index.htm. On this site you can order fi nancial documents online, send email inquiries and review additional information about the company.
Direct Purchase and Sales Plan
The BuyDIRECTSM Plan, administered by BNY Mellon, provides existing shareholders and interested fi rst-time investors a direct, convenient and affordable alternative for buying and selling MeadWestvaco shares. Contact BNY Mellon Shareowner Services for an enrollment form and brochure that describes the Plan fully.
Transfer Agent and Registrar
For BuyDIRECTSM Plan enrollment and other shareholder inquiries: MeadWestvaco Corporationc/o BNY Mellon Shareowner ServicesPO Box 358015Pittsburgh, PA 15252 8015
For BuyDIRECTSM Plan sales, liquidations, transfers, withdrawals or optional cash investments (please use bottom portion of advice or statement):MeadWestvaco Corporationc/o BNY Mellon Shareowner ServicesPO Box 358015Pittsburgh, PA 15252 8015
To send certifi cates for transfer or change of address: MeadWestvaco Corporationc/o BNY Mellon Shareowner ServicesPO Box 358015Pittsburgh, PA 15252 8015
All telephone inquiries:+1 866 455 3115 toll-free in the United States and Canada+1 201 680 6685 outside the United States and Canada
All email inquiries:[email protected]
On the Internet at:www.bnymellon.com/shareowner/isd
Design: Interbrand Printing: RR Donnelley Cover: MWV Tango® Advantage C2S 10 pt / 234 gsmPrinted on recycled paper containing 20% post-consumer recycled fi ber. © 2010 MeadWestvaco Corporation
MWV501 South 5th StreetRichmond, VA 23219-0501USA+1 804 444 1000mwv.com