Embed Size (px)
Citation preview
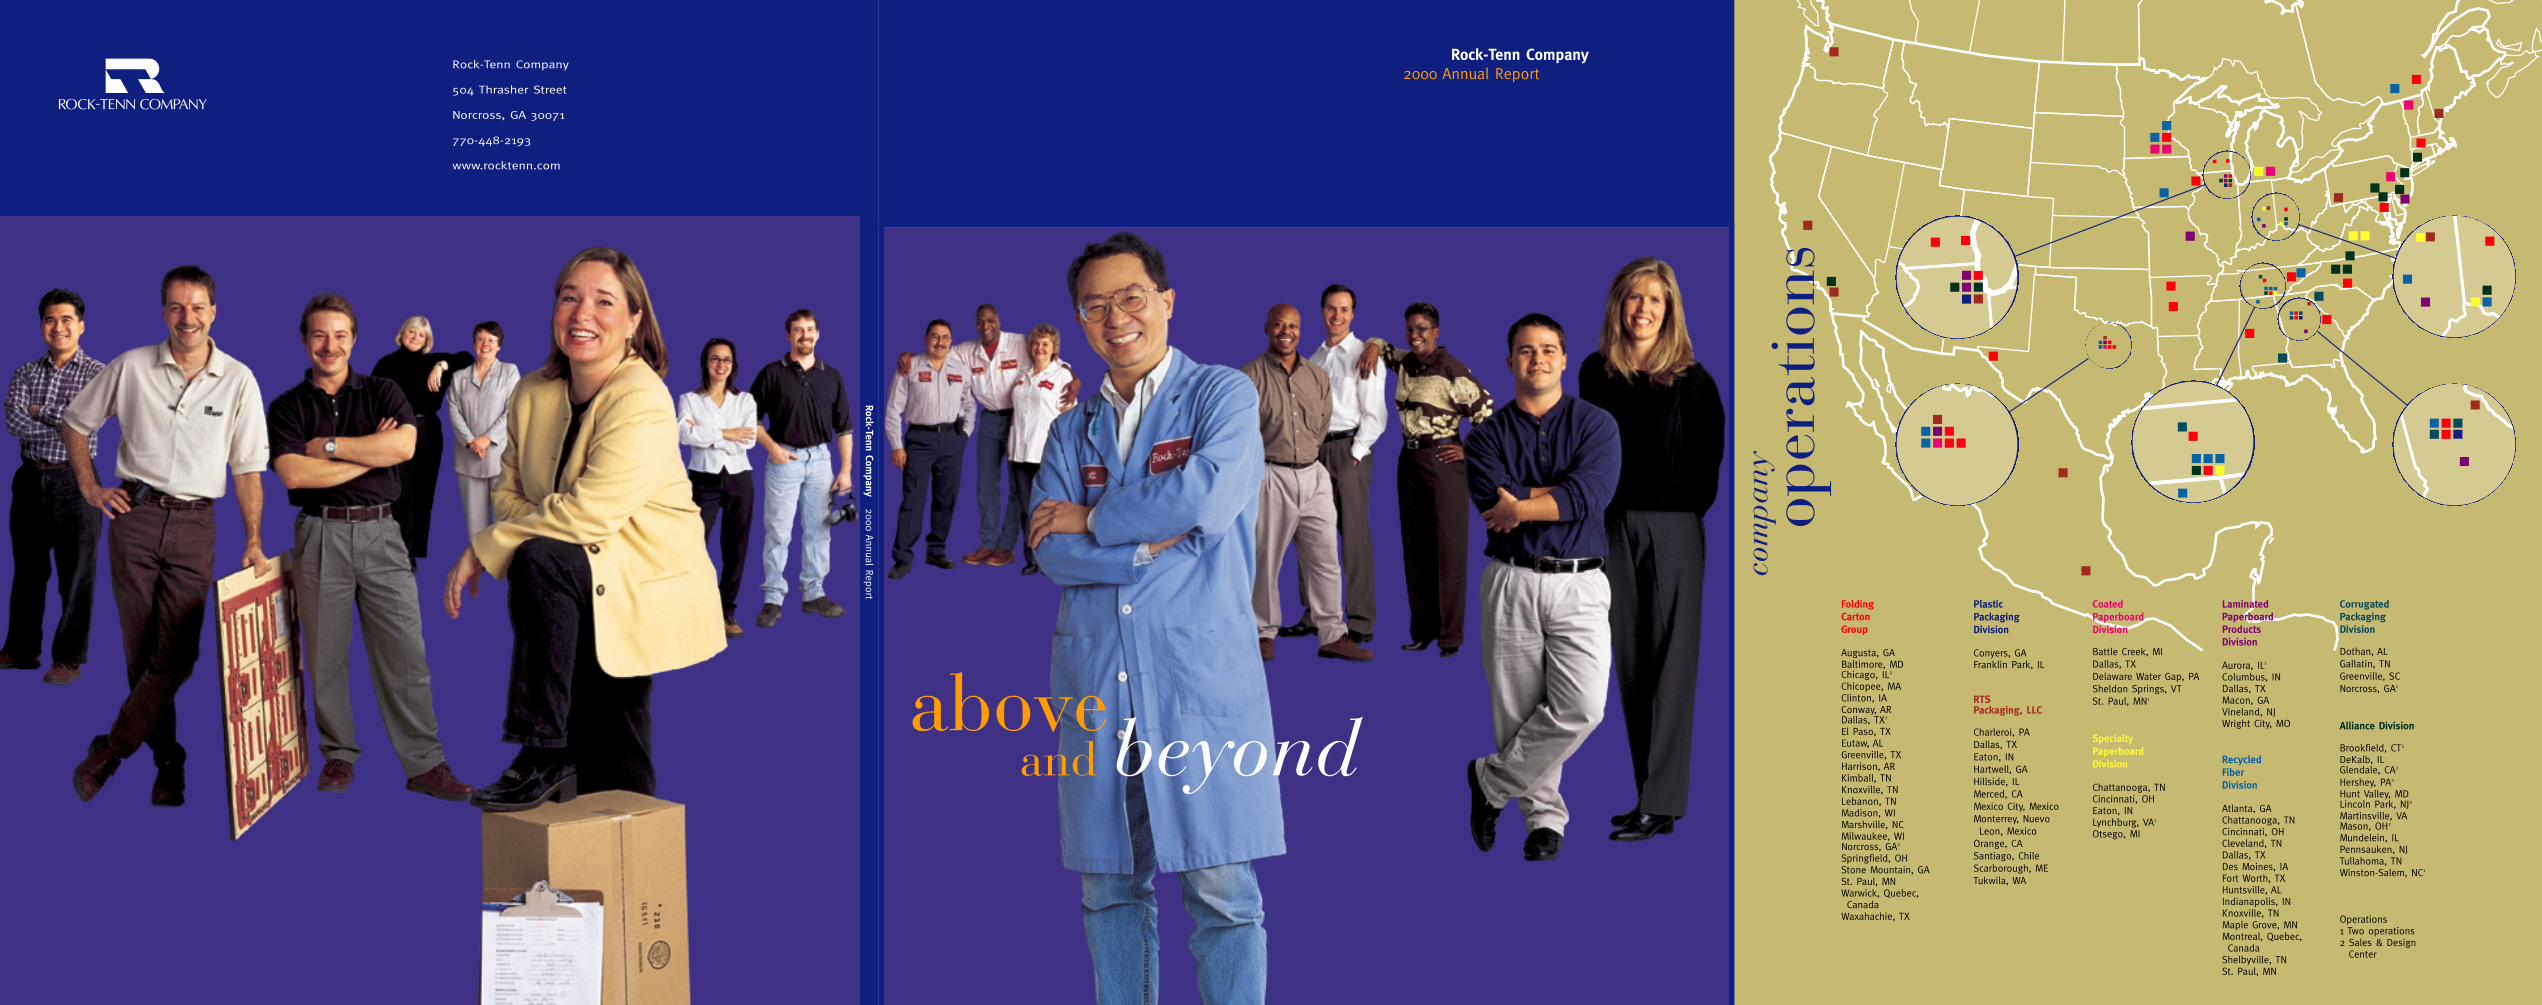
Folding CartonGroup
Augusta, GABaltimore, MDChicago, IL2
Chicopee, MAClinton, IAConway, ARDallas, TX2
El Paso, TXEutaw, ALGreenville, TXHarrison, ARKimball, TNKnoxville, TNLebanon, TNMadison, WIMarshville, NCMilwaukee, WINorcross, GA2
Springfield, OHStone Mountain, GASt. Paul, MNWarwick, Quebec, Canada
Waxahachie, TX
LaminatedPaperboardProductsDivision
Aurora, IL1
Columbus, INDallas, TXMacon, GAVineland, NJWright City, MO
RecycledFiberDivision
Atlanta, GAChattanooga, TNCincinnati, OHCleveland, TNDallas, TXDes Moines, IAFort Worth, TXHuntsville, ALIndianapolis, INKnoxville, TNMaple Grove, MNMontreal, Quebec, Canada
Shelbyville, TNSt. Paul, MN
Corrugated PackagingDivision
Dothan, ALGallatin, TNGreenville, SCNorcross, GA1
Alliance Division
Brookfield, CT2
DeKalb, ILGlendale, CA2
Hershey, PA2
Hunt Valley, MDLincoln Park, NJ2
Martinsville, VAMason, OH2
Mundelein, ILPennsauken, NJTullahoma, TNWinston-Salem, NC1
Operations1 Two operations2 Sales & Design
Center
PlasticPackaging Division
Conyers, GAFranklin Park, IL
RTS Packaging, LLC
Charleroi, PADallas, TXEaton, INHartwell, GAHillside, ILMerced, CAMexico City, MexicoMonterrey, Nuevo Leon, Mexico
Orange, CASantiago, ChileScarborough, METukwila, WA
CoatedPaperboardDivision
Battle Creek, MIDallas, TXDelaware Water Gap, PASheldon Springs, VTSt. Paul, MN1
SpecialtyPaperboardDivision
Chattanooga, TNCincinnati, OHEaton, INLynchburg, VA1
Otsego, MI
aboveand beyond
com
pany
oper
atio
ns
Rock-Tenn Company2000 Annual Report
Rock-Tenn Company
504 Thrasher Street
Norcross, GA 30071
770-448-2193
www.rocktenn.com
Rock-Tenn Company 2000 A
nnual Report
Mar
kets
Ser
ved
Co
mp
etit
ive
Stre
ng
ths
Pro
du
cts
and
Ser
vice
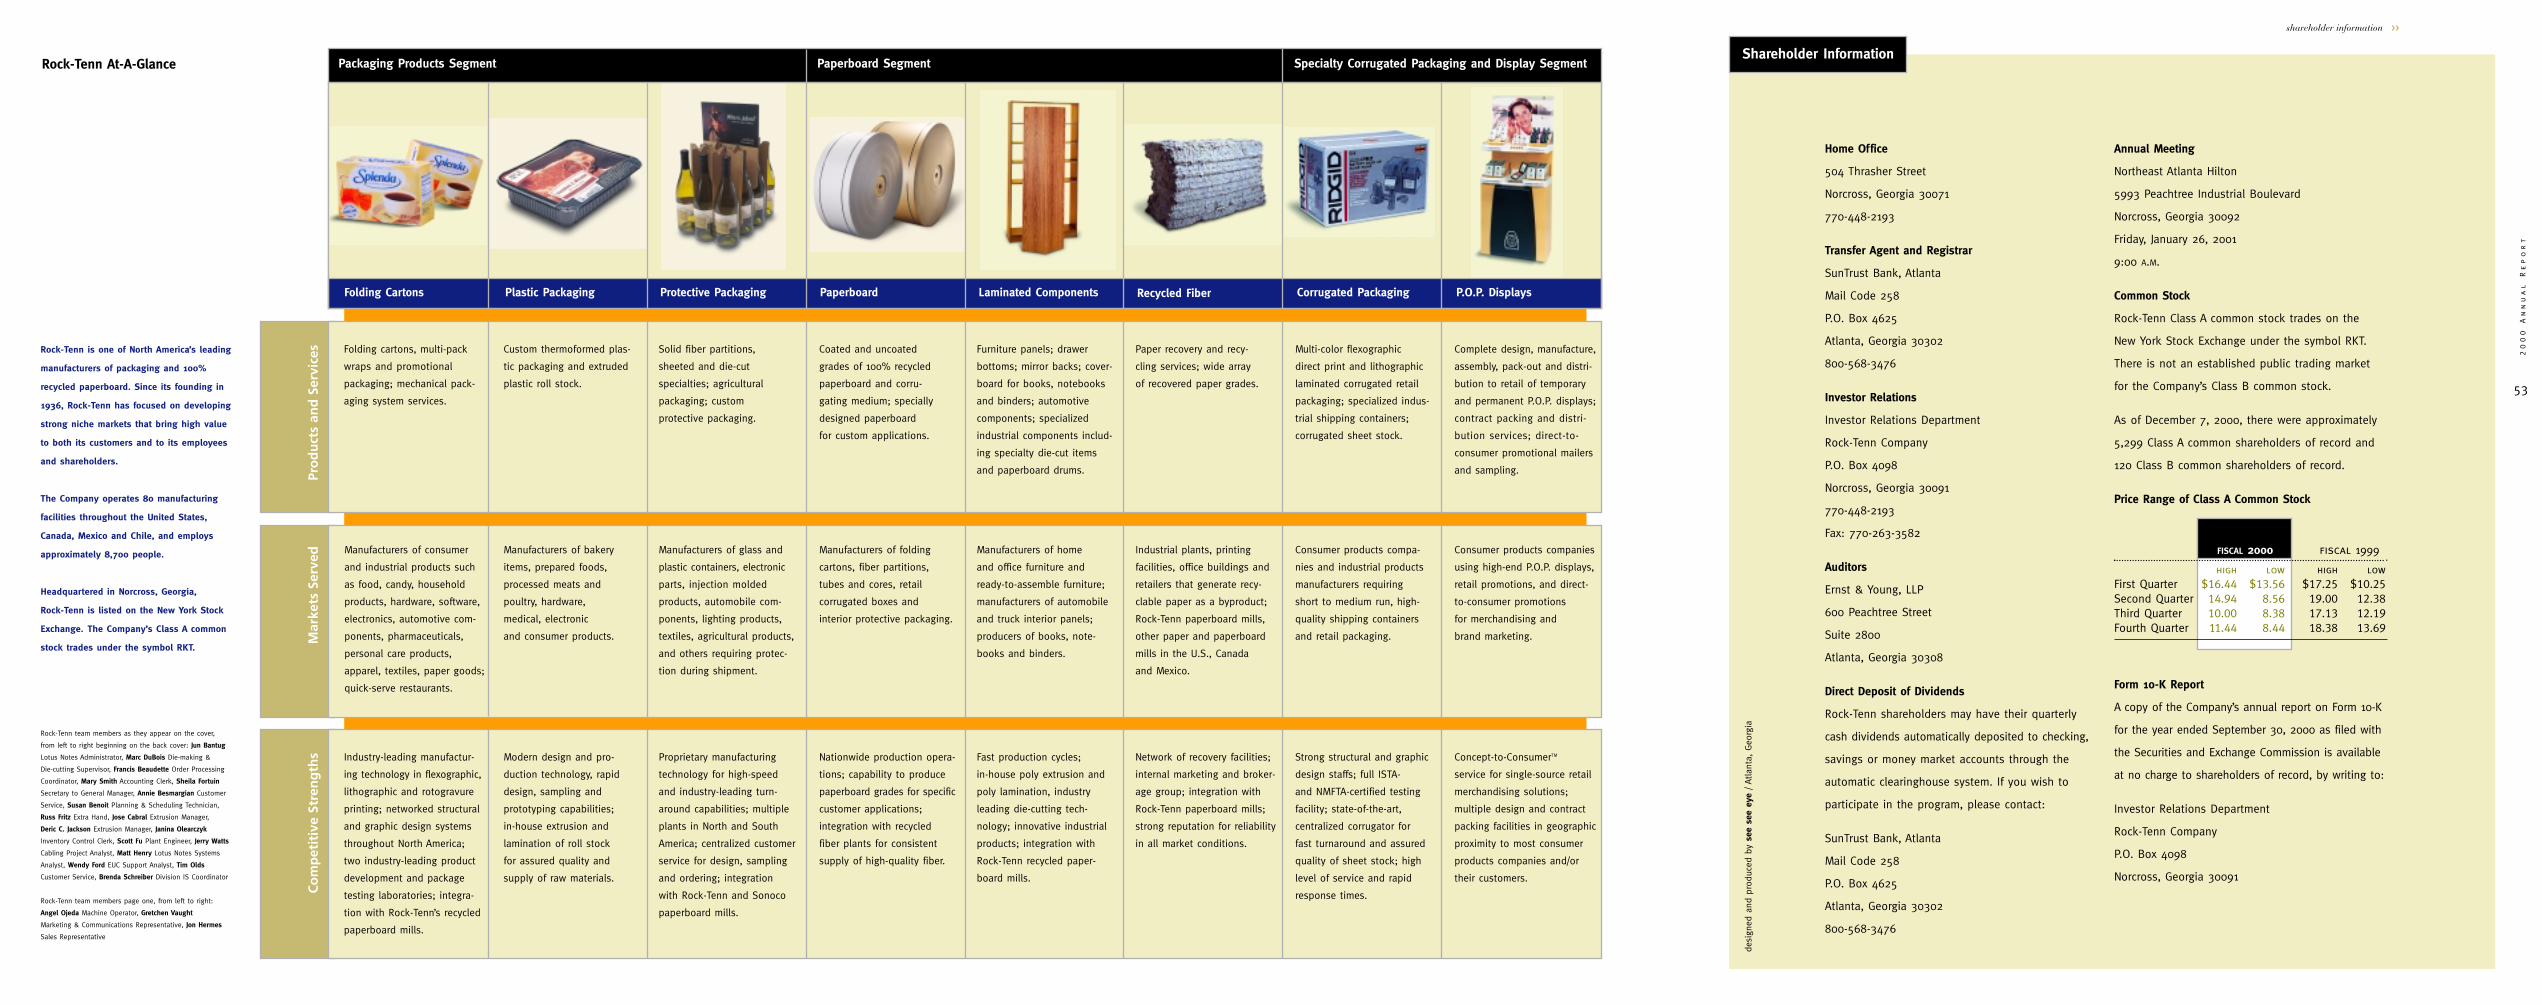
s Multi-color flexographic
direct print and lithographic
laminated corrugated retail
packaging; specialized indus-
trial shipping containers;
corrugated sheet stock.
Complete design, manufacture,
assembly, pack-out and distri-
bution to retail of temporary
and permanent P.O.P. displays;
contract packing and distri-
bution services; direct-to-
consumer promotional mailers
and sampling.
Folding cartons, multi-pack
wraps and promotional
packaging; mechanical pack-
aging system services.
Solid fiber partitions,
sheeted and die-cut
specialties; agricultural
packaging; custom
protective packaging.
Furniture panels; drawer
bottoms; mirror backs; cover-
board for books, notebooks
and binders; automotive
components; specialized
industrial components includ-
ing specialty die-cut items
and paperboard drums.
Custom thermoformed plas-
tic packaging and extruded
plastic roll stock.
Paper recovery and recy-
cling services; wide array
of recovered paper grades.
Coated and uncoated
grades of 100% recycled
paperboard and corru-
gating medium; specially
designed paperboard
for custom applications.
Consumer products compa-
nies and industrial products
manufacturers requiring
short to medium run, high-
quality shipping containers
and retail packaging.
Consumer products companies
using high-end P.O.P. displays,
retail promotions, and direct-
to-consumer promotions
for merchandising and
brand marketing.
Manufacturers of consumer
and industrial products such
as food, candy, household
products, hardware, software,
electronics, automotive com-
ponents, pharmaceuticals,
personal care products,
apparel, textiles, paper goods;
quick-serve restaurants.
Manufacturers of glass and
plastic containers, electronic
parts, injection molded
products, automobile com-
ponents, lighting products,
textiles, agricultural products,
and others requiring protec-
tion during shipment.
Manufacturers of home
and office furniture and
ready-to-assemble furniture;
manufacturers of automobile
and truck interior panels;
producers of books, note-
books and binders.
Manufacturers of bakery
items, prepared foods,
processed meats and
poultry, hardware,
medical, electronic
and consumer products.
Industrial plants, printing
facilities, office buildings and
retailers that generate recy-
clable paper as a byproduct;
Rock-Tenn paperboard mills,
other paper and paperboard
mills in the U.S., Canada
and Mexico.
Manufacturers of folding
cartons, fiber partitions,
tubes and cores, retail
corrugated boxes and
interior protective packaging.
Strong structural and graphic
design staffs; full ISTA-
and NMFTA-certified testing
facility; state-of-the-art,
centralized corrugator for
fast turnaround and assured
quality of sheet stock; high
level of service and rapid
response times.
Concept-to-ConsumerTM
service for single-source retail
merchandising solutions;
multiple design and contract
packing facilities in geographic
proximity to most consumer
products companies and/or
their customers.
Industry-leading manufactur-
ing technology in flexographic,
lithographic and rotogravure
printing; networked structural
and graphic design systems
throughout North America;
two industry-leading product
development and package
testing laboratories; integra-
tion with Rock-Tenn’s recycled
paperboard mills.
Proprietary manufacturing
technology for high-speed
and industry-leading turn-
around capabilities; multiple
plants in North and South
America; centralized customer
service for design, sampling
and ordering; integration
with Rock-Tenn and Sonoco
paperboard mills.
Fast production cycles;
in-house poly extrusion and
poly lamination, industry
leading die-cutting tech-
nology; innovative industrial
products; integration with
Rock-Tenn recycled paper-
board mills.
Modern design and pro-
duction technology, rapid
design, sampling and
prototyping capabilities;
in-house extrusion and
lamination of roll stock
for assured quality and
supply of raw materials.
Network of recovery facilities;
internal marketing and broker-
age group; integration with
Rock-Tenn paperboard mills;
strong reputation for reliability
in all market conditions.
Nationwide production opera-
tions; capability to produce
paperboard grades for specific
customer applications;
integration with recycled
fiber plants for consistent
supply of high-quality fiber.
Corrugated PackagingFolding Cartons Laminated ComponentsPaperboard Recycled FiberProtective PackagingPlastic Packaging
Specialty Corrugated Packaging and Display SegmentPackaging Products Segment Paperboard SegmentShareholder Information
53
20
00
A
nn
ua
l
Re
po
rt
shareholder information >>
Home Office
504 Thrasher Street
Norcross, Georgia 30071
770-448-2193
Transfer Agent and Registrar
SunTrust Bank, Atlanta
Mail Code 258
P.O. Box 4625
Atlanta, Georgia 30302
800-568-3476
Investor Relations
Investor Relations Department
Rock-Tenn Company
P.O. Box 4098
Norcross, Georgia 30091
770-448-2193
Fax: 770-263-3582
Auditors
Ernst & Young, LLP
600 Peachtree Street
Suite 2800
Atlanta, Georgia 30308
Direct Deposit of Dividends
Rock-Tenn shareholders may have their quarterly
cash dividends automatically deposited to checking,
savings or money market accounts through the
automatic clearinghouse system. If you wish to
participate in the program, please contact:
SunTrust Bank, Atlanta
Mail Code 258
P.O. Box 4625
Atlanta, Georgia 30302
800-568-3476
Annual Meeting
Northeast Atlanta Hilton
5993 Peachtree Industrial Boulevard
Norcross, Georgia 30092
Friday, January 26, 2001
9:00 A.M.
Common Stock
Rock-Tenn Class A common stock trades on the
New York Stock Exchange under the symbol RKT.
There is not an established public trading market
for the Company’s Class B common stock.
As of December 7, 2000, there were approximately
5,299 Class A common shareholders of record and
120 Class B common shareholders of record.
Price Range of Class A Common Stock
FISCAL 2000 fiscal 1999
high low high lowFirst Quarter $16.44 $13.56 $17.25 $10.25Second Quarter 14.94 8.56 19.00 12.38Third Quarter 10.00 8.38 17.13 12.19Fourth Quarter 11.44 8.44 18.38 13.69
Form 10-K Report
A copy of the Company’s annual report on Form 10-K
for the year ended September 30, 2000 as filed with
the Securities and Exchange Commission is available
at no charge to shareholders of record, by writing to:
Investor Relations Department
Rock-Tenn Company
P.O. Box 4098
Norcross, Georgia 30091
desi
gned
and
pro
duce
d by
see
see
eye
/ At
lant
a, G
eorg
ia
Rock-Tenn is one of North America’s leading
manufacturers of packaging and 100%
recycled paperboard. Since its founding in
1936, Rock-Tenn has focused on developing
strong niche markets that bring high value
to both its customers and to its employees
and shareholders.
The Company operates 80 manufacturing
facilities throughout the United States,
Canada, Mexico and Chile, and employs
approximately 8,700 people.
Headquartered in Norcross, Georgia,
Rock-Tenn is listed on the New York Stock
Exchange. The Company’s Class A common
stock trades under the symbol RKT.
Rock-Tenn team members as they appear on the cover,
from left to right beginning on the back cover: Jun Bantug
Lotus Notes Administrator, Marc DuBois Die-making &
Die-cutting Supervisor, Francis Beaudette Order Processing
Coordinator, Mary Smith Accounting Clerk, Sheila Fortuin
Secretary to General Manager, Annie Besmargian Customer
Service, Susan Benoit Planning & Scheduling Technician,
Russ Fritz Extra Hand, Jose Cabral Extrusion Manager,
Deric C. Jackson Extrusion Manager, Janina Olearczyk
Inventory Control Clerk, Scott Fu Plant Engineer, Jerry Watts
Cabling Project Analyst, Matt Henry Lotus Notes Systems
Analyst, Wendy Ford EUC Support Analyst, Tim Olds
Customer Service, Brenda Schreiber Division IS Coordinator
Rock-Tenn team members page one, from left to right:
Angel Ojeda Machine Operator, Gretchen Vaught
Marketing & Communications Representative, Jon Hermes
Sales Representative
P.O.P. Displays
Rock-Tenn At-A-Glance
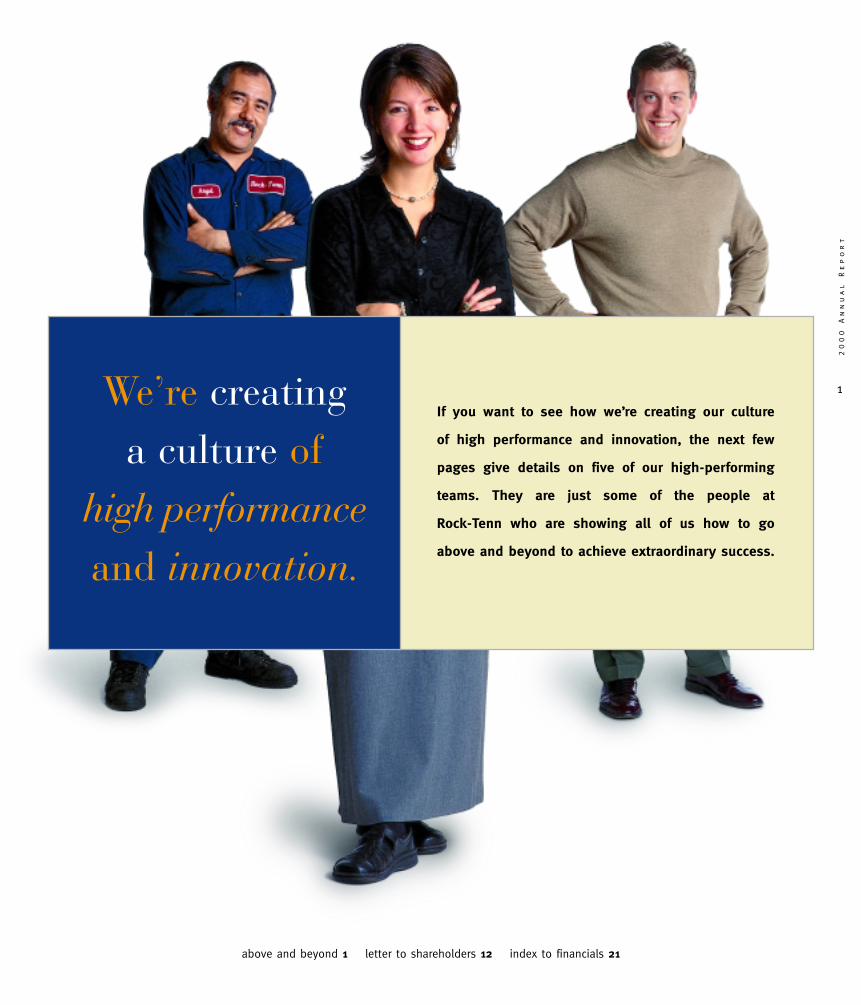
If you want to see how we’re creating our culture
of high performance and innovation, the next few
pages give details on five of our high-performing
teams. They are just some of the people at
Rock-Tenn who are showing all of us how to go
above and beyond to achieve extraordinary success.
We’re creatinga culture of
high performanceand innovation.
above and beyond 1 letter to shareholders 12 index to financials 21
1
20
00
A
nn
ua
l
Re
po
rt
2
Ro
ck
-T
en
n
Co
mp
an
y
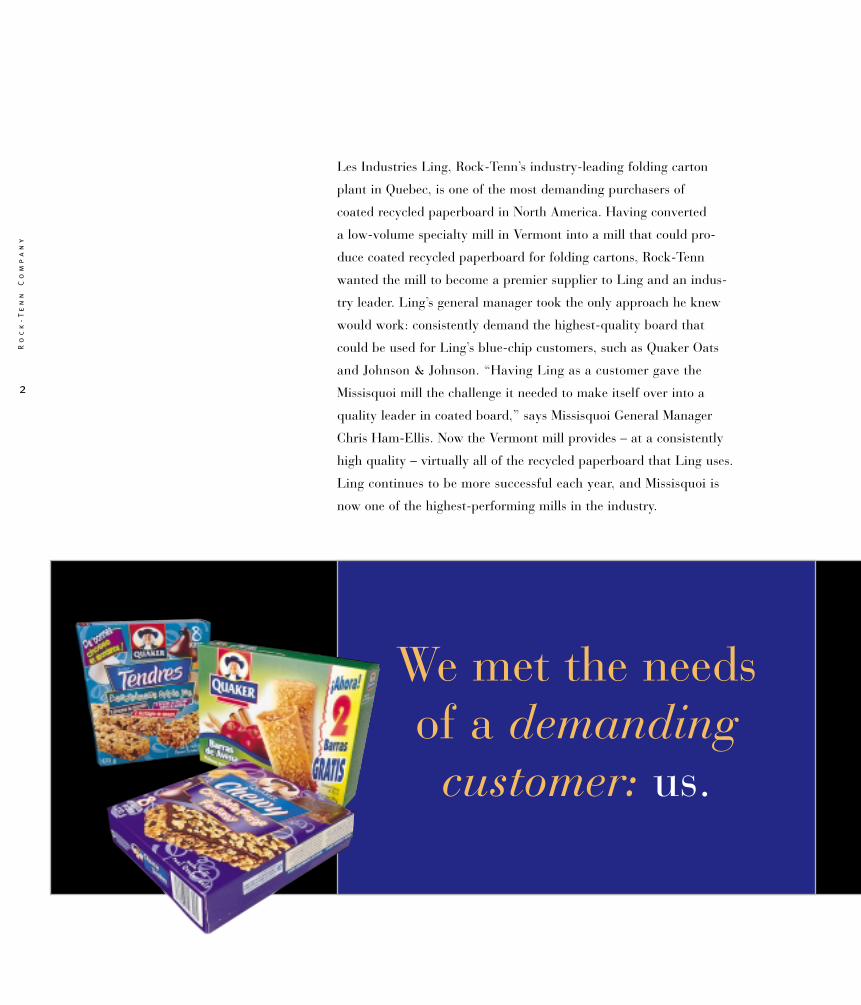
Les Industries Ling, Rock-Tenn’s industry-leading folding carton
plant in Quebec, is one of the most demanding purchasers of
coated recycled paperboard in North America. Having converted
a low-volume specialty mill in Vermont into a mill that could pro-
duce coated recycled paperboard for folding cartons, Rock-Tenn
wanted the mill to become a premier supplier to Ling and an indus-
try leader. Ling’s general manager took the only approach he knew
would work: consistently demand the highest-quality board that
could be used for Ling’s blue-chip customers, such as Quaker Oats
and Johnson & Johnson. “Having Ling as a customer gave the
Missisquoi mill the challenge it needed to make itself over into a
quality leader in coated board,” says Missisquoi General Manager
Chris Ham-Ellis. Now the Vermont mill provides – at a consistently
high quality – virtually all of the recycled paperboard that Ling uses.
Ling continues to be more successful each year, and Missisquoi is
now one of the highest-performing mills in the industry.
We met the needs of a demanding customer: us.
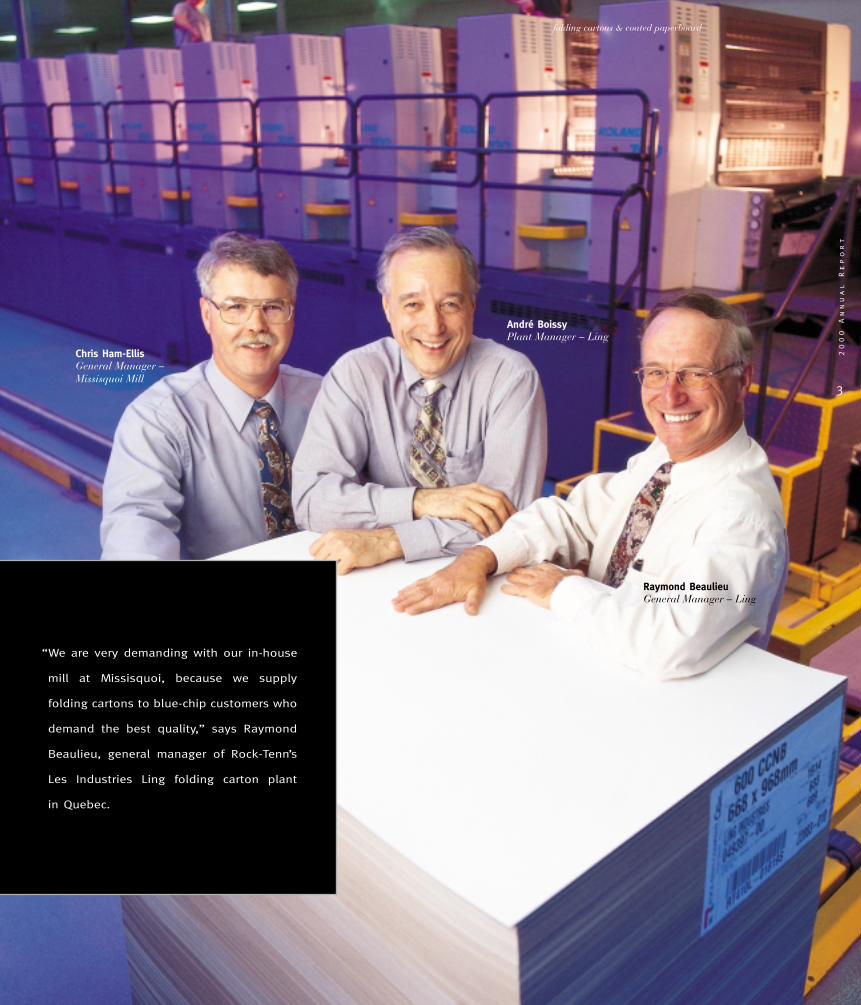
“We are very demanding with our in-house
mill at Missisquoi, because we supply
folding cartons to blue-chip customers who
demand the best quality,” says Raymond
Beaulieu, general manager of Rock-Tenn’s
Les Industries Ling folding carton plant
in Quebec.
3
20
00
A
nn
ua
l
Re
po
rt
folding cartons & coated paperboard >>
Chris Ham-EllisGeneral Manager – Missisquoi Mill
André BoissyPlant Manager – Ling
Raymond BeaulieuGeneral Manager – Ling
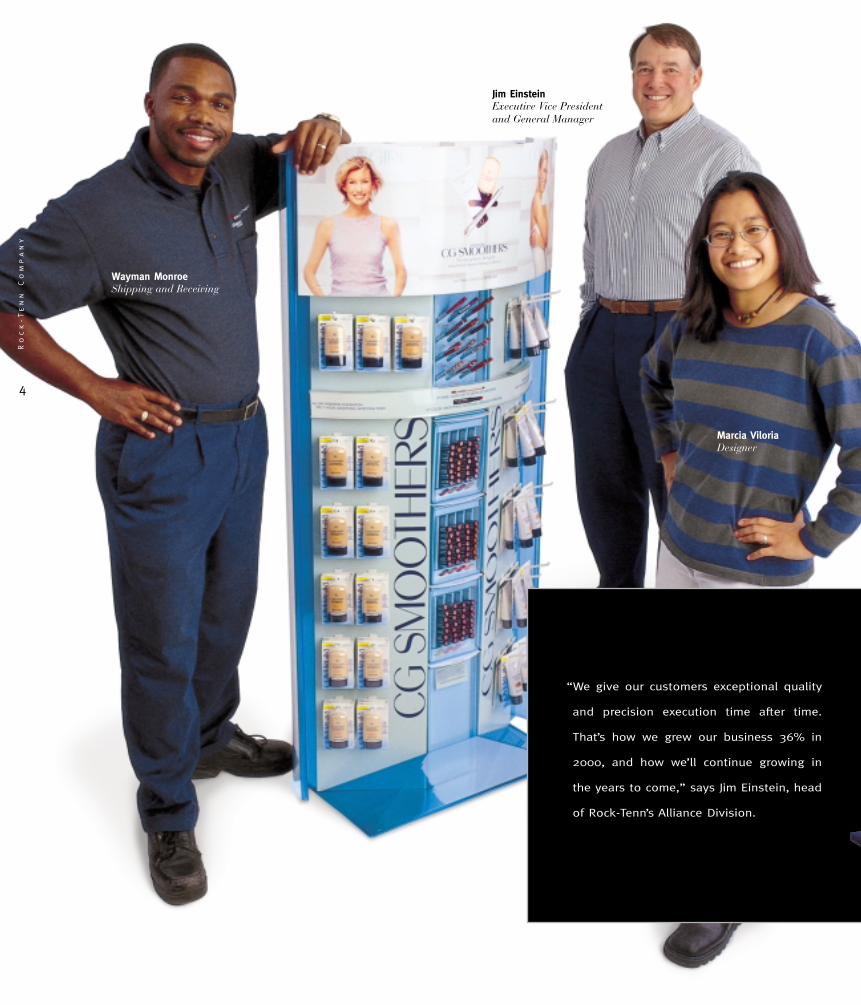
“We give our customers exceptional quality
and precision execution time after time.
That’s how we grew our business 36% in
2000, and how we’ll continue growing in
the years to come,” says Jim Einstein, head
of Rock-Tenn’s Alliance Division.
4
Ro
ck
-T
en
n
Co
mp
an
y
Jim EinsteinExecutive Vice Presidentand General Manager
Wayman MonroeShipping and Receiving
Marcia ViloriaDesigner
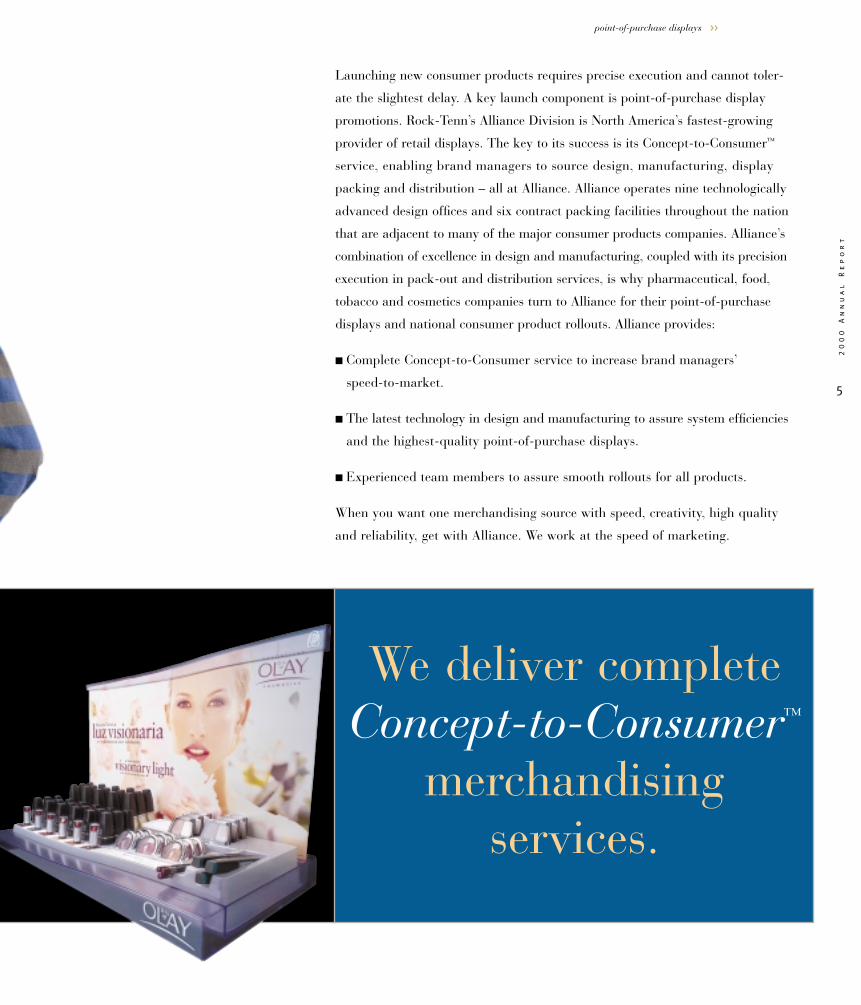
We deliver completeConcept-to-Consumer™
merchandising services.
Launching new consumer products requires precise execution and cannot toler-
ate the slightest delay. A key launch component is point-of-purchase display
promotions. Rock-Tenn’s Alliance Division is North America’s fastest-growing
provider of retail displays. The key to its success is its Concept-to-Consumer™
service, enabling brand managers to source design, manufacturing, display
packing and distribution – all at Alliance. Alliance operates nine technologically
advanced design offices and six contract packing facilities throughout the nation
that are adjacent to many of the major consumer products companies. Alliance’s
combination of excellence in design and manufacturing, coupled with its precision
execution in pack-out and distribution services, is why pharmaceutical, food,
tobacco and cosmetics companies turn to Alliance for their point-of-purchase
displays and national consumer product rollouts. Alliance provides:
■ Complete Concept-to-Consumer service to increase brand managers’
speed-to-market.
■ The latest technology in design and manufacturing to assure system efficiencies
and the highest-quality point-of-purchase displays.
■ Experienced team members to assure smooth rollouts for all products.
When you want one merchandising source with speed, creativity, high quality
and reliability, get with Alliance. We work at the speed of marketing.
5
20
00
A
nn
ua
l
Re
po
rt
point-of-purchase displays >>
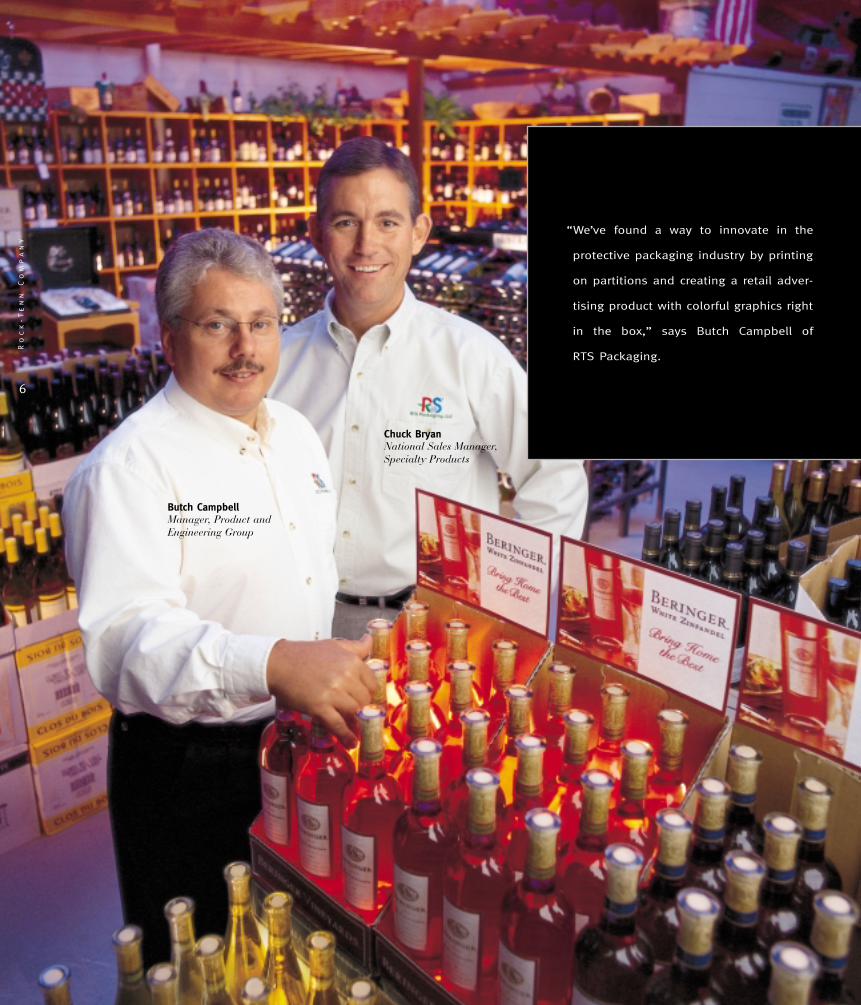
“We’ve found a way to innovate in the
protective packaging industry by printing
on partitions and creating a retail adver-
tising product with colorful graphics right
in the box,” says Butch Campbell of
RTS Packaging.
Butch CampbellManager, Product andEngineering Group
Chuck BryanNational Sales Manager,Specialty Products
6
Ro
ck
-T
en
n
Co
mp
an
y
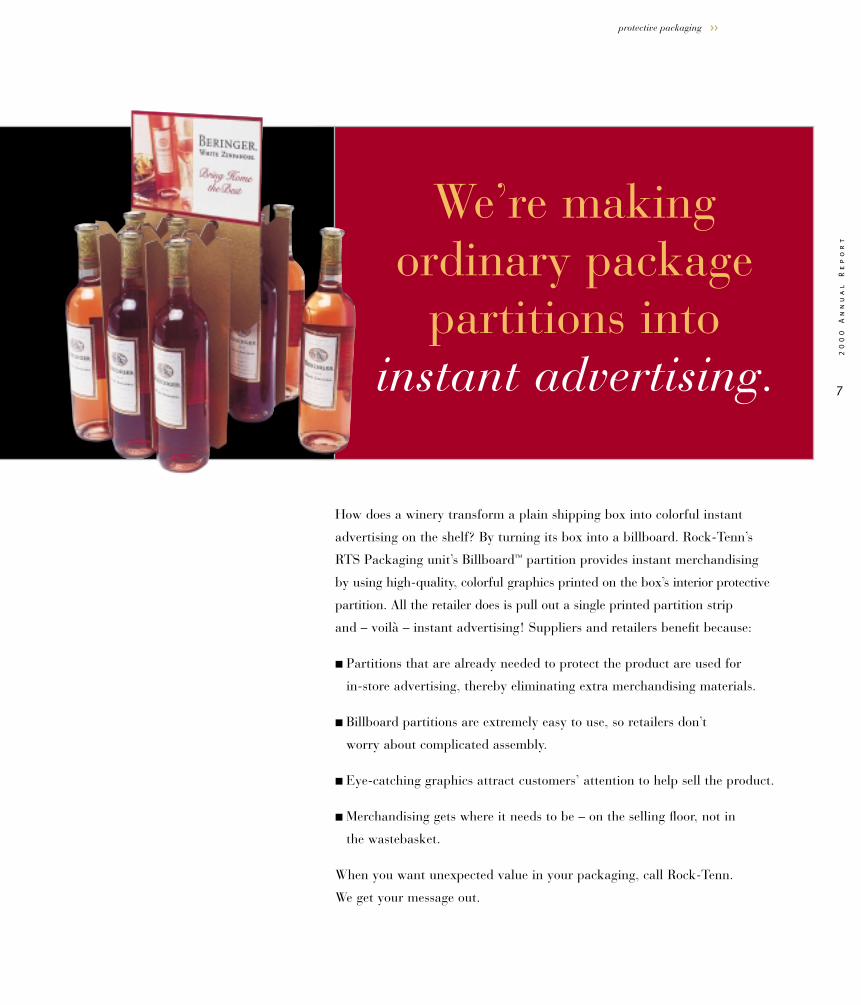
How does a winery transform a plain shipping box into colorful instant
advertising on the shelf? By turning its box into a billboard. Rock-Tenn’s
RTS Packaging unit’s Billboard™ partition provides instant merchandising
by using high-quality, colorful graphics printed on the box’s interior protective
partition. All the retailer does is pull out a single printed partition strip
and – voilà – instant advertising! Suppliers and retailers benefit because:
■ Partitions that are already needed to protect the product are used for
in-store advertising, thereby eliminating extra merchandising materials.
■ Billboard partitions are extremely easy to use, so retailers don’t
worry about complicated assembly.
■ Eye-catching graphics attract customers’ attention to help sell the product.
■ Merchandising gets where it needs to be – on the selling floor, not in
the wastebasket.
When you want unexpected value in your packaging, call Rock-Tenn.
We get your message out.
We’re making ordinary package
partitions into instant advertising. 7
20
00
A
nn
ua
l
Re
po
rt
protective packaging >>
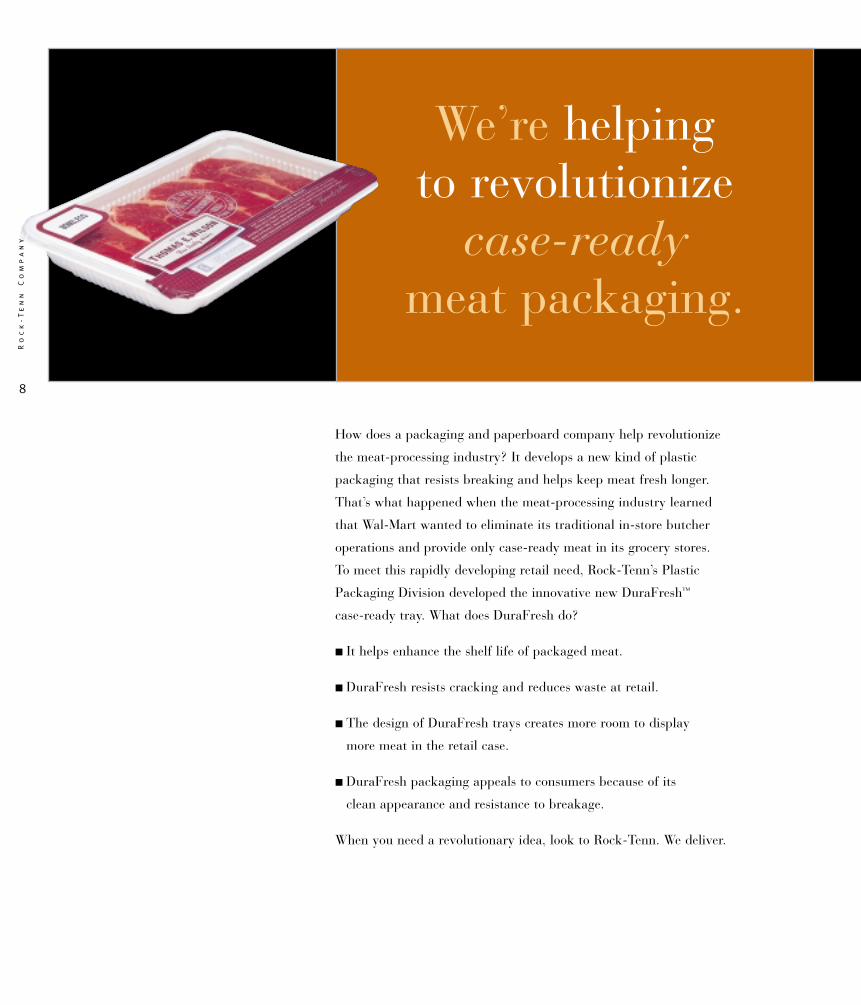
We’re helping to revolutionize
case-readymeat packaging.
How does a packaging and paperboard company help revolutionize
the meat-processing industry? It develops a new kind of plastic
packaging that resists breaking and helps keep meat fresh longer.
That’s what happened when the meat-processing industry learned
that Wal-Mart wanted to eliminate its traditional in-store butcher
operations and provide only case-ready meat in its grocery stores.
To meet this rapidly developing retail need, Rock-Tenn’s Plastic
Packaging Division developed the innovative new DuraFresh™
case-ready tray. What does DuraFresh do?
■ It helps enhance the shelf life of packaged meat.
■ DuraFresh resists cracking and reduces waste at retail.
■ The design of DuraFresh trays creates more room to display
more meat in the retail case.
■ DuraFresh packaging appeals to consumers because of its
clean appearance and resistance to breakage.
When you need a revolutionary idea, look to Rock-Tenn. We deliver.
8
Ro
ck
-T
en
n
Co
mp
an
y
plastic packaging >>
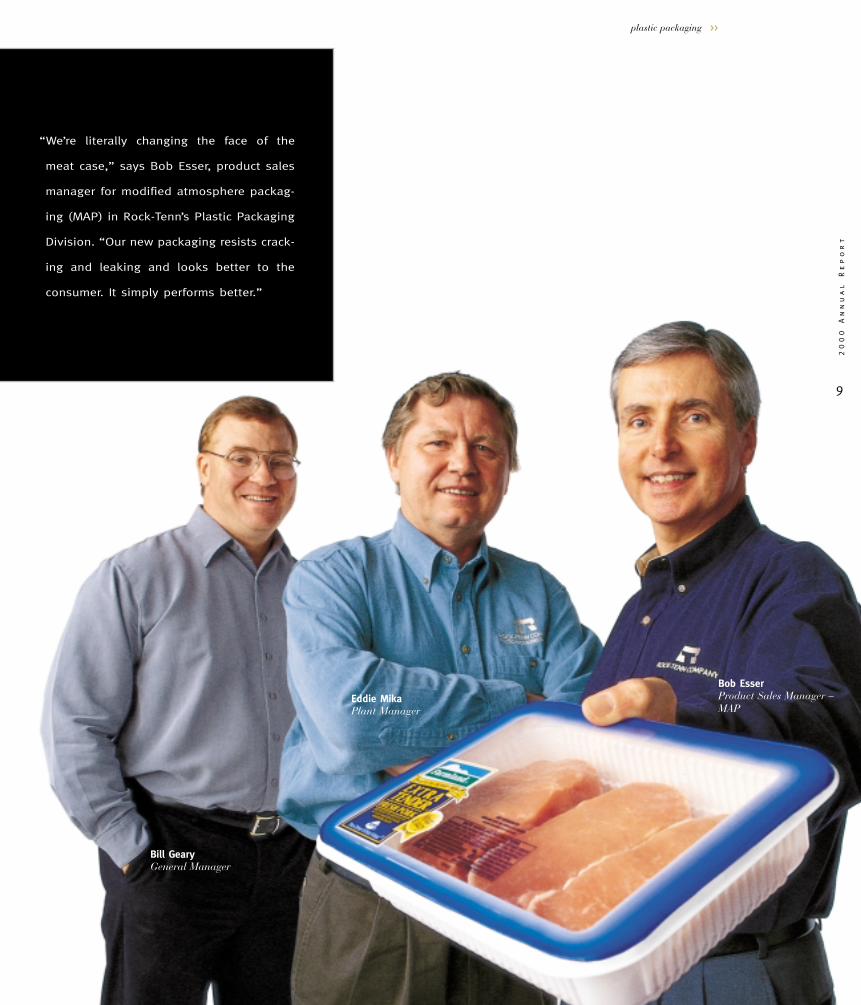
Eddie MikaPlant Manager
Bob EsserProduct Sales Manager – MAP
“We’re literally changing the face of the
meat case,” says Bob Esser, product sales
manager for modified atmosphere packag-
ing (MAP) in Rock-Tenn’s Plastic Packaging
Division. “Our new packaging resists crack-
ing and leaking and looks better to the
consumer. It simply performs better.”
Bill GearyGeneral Manager
9
20
00
A
nn
ua
l
Re
po
rt
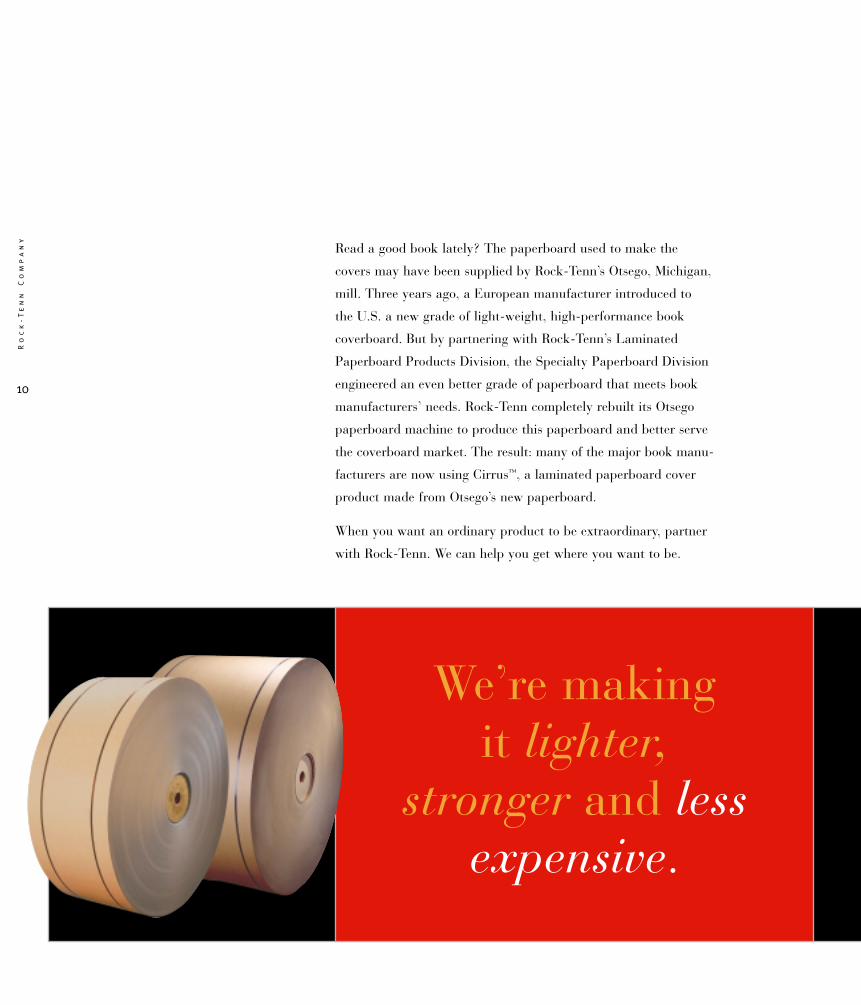
We’re making it lighter,
stronger and lessexpensive.
10
Ro
ck
-T
en
n
Co
mp
an
y
Read a good book lately? The paperboard used to make the
covers may have been supplied by Rock-Tenn’s Otsego, Michigan,
mill. Three years ago, a European manufacturer introduced to
the U.S. a new grade of light-weight, high-performance book
coverboard. But by partnering with Rock-Tenn’s Laminated
Paperboard Products Division, the Specialty Paperboard Division
engineered an even better grade of paperboard that meets book
manufacturers’ needs. Rock-Tenn completely rebuilt its Otsego
paperboard machine to produce this paperboard and better serve
the coverboard market. The result: many of the major book manu-
facturers are now using Cirrus™, a laminated paperboard cover
product made from Otsego’s new paperboard.
When you want an ordinary product to be extraordinary, partner
with Rock-Tenn. We can help you get where you want to be.
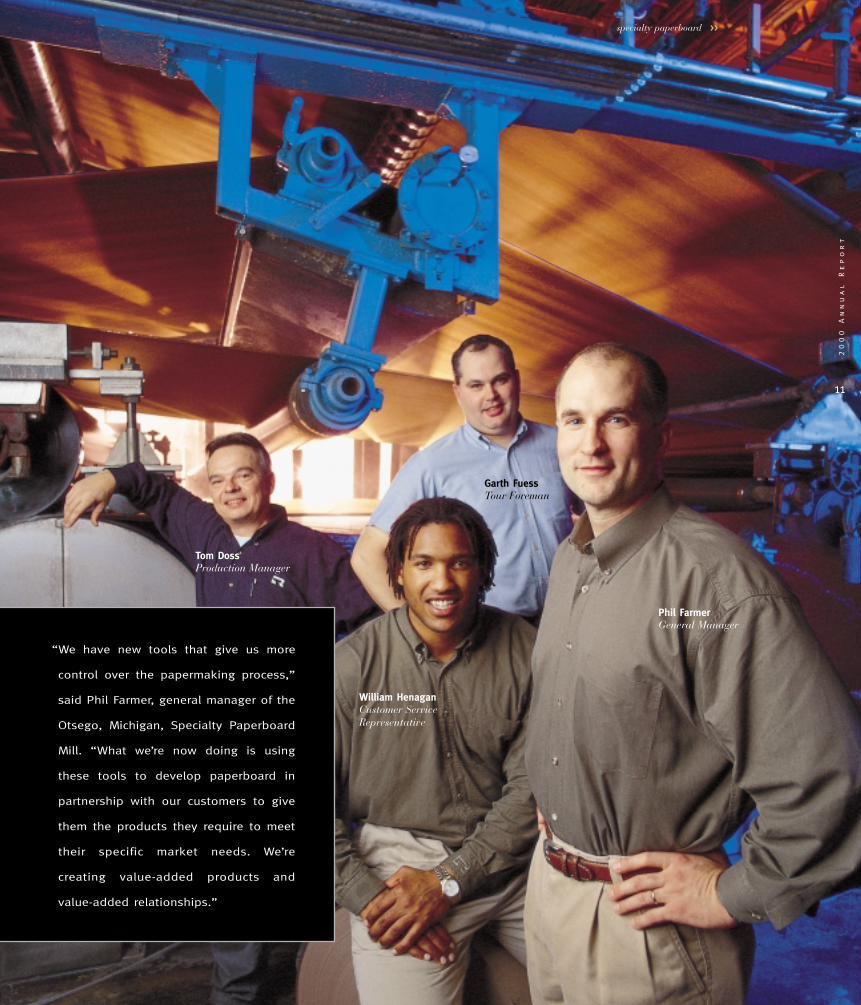
“We have new tools that give us more
control over the papermaking process,”
said Phil Farmer, general manager of the
Otsego, Michigan, Specialty Paperboard
Mill. “What we’re now doing is using
these tools to develop paperboard in
partnership with our customers to give
them the products they require to meet
their specific market needs. We’re
creating value-added products and
value-added relationships.”
11
20
00
A
nn
ua
l
Re
po
rt
specialty paperboard >>
Tom DossProduction Manager
William HenaganCustomer ServiceRepresentative
Garth FuessTour Foreman
Phil FarmerGeneral Manager
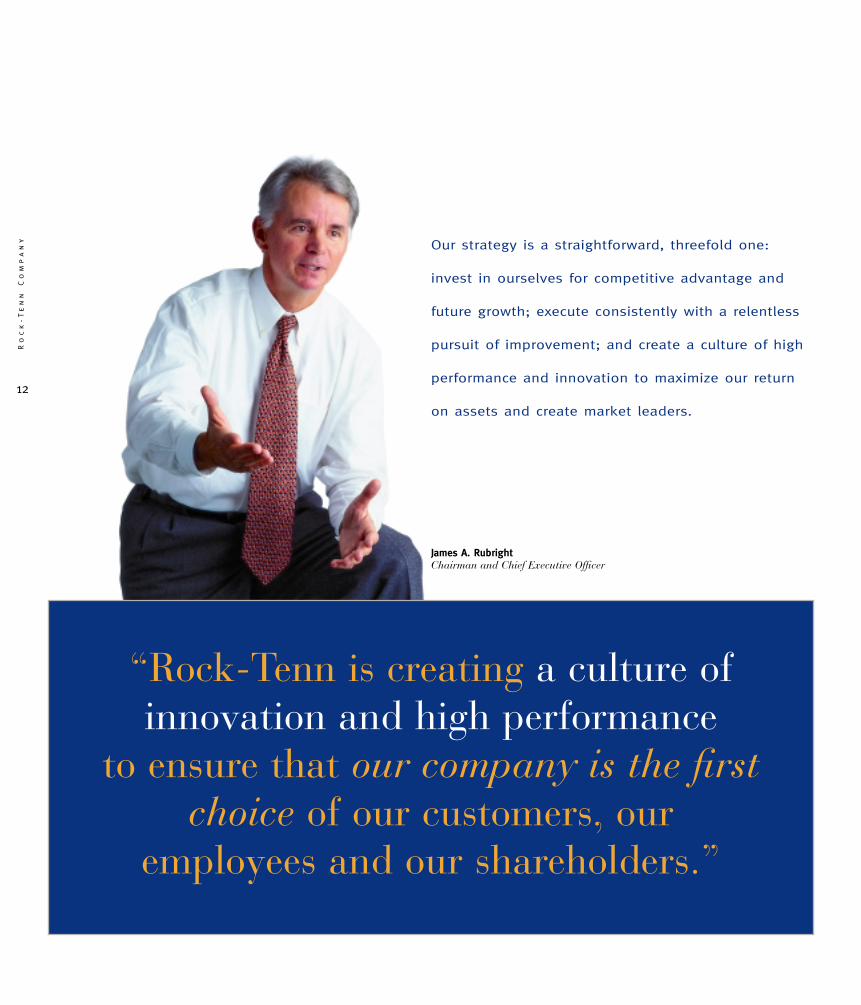
“Rock-Tenn is creating a culture of innovation and high performance
to ensure that our company is the firstchoice of our customers, our
employees and our shareholders.”
James A. RubrightChairman and Chief Executive Officer
12
Ro
ck
-T
en
n
Co
mp
an
y Our strategy is a straightforward, threefold one:
invest in ourselves for competitive advantage and
future growth; execute consistently with a relentless
pursuit of improvement; and create a culture of high
performance and innovation to maximize our return
on assets and create market leaders.
Achieving Sustainable High Performance
So, how do we achieve the kind of performance
that wins customers, attracts superior employees
and creates shareholder value? Our strategy is a
straightforward, threefold one: invest in ourselves
for competitive advantage and future growth;
execute consistently with a relentless pursuit of
improvement; and – something I’ve mentioned
earlier – create a culture of high performance
and innovation to maximize our return on assets
and create market leaders.
Invest in Ourselves
As we’ll discuss in more detail, we’ve invested
heavily in some core activities where we have
opportunities to reassert market leadership.
We’ve focused much greater attention and invest-
ment on our businesses that enjoy above-average
growth prospects, with much more than above-
average results, and we’ve restructured assets
where we could not be successful without unac-
ceptable levels of investment. We are coupling
these strategic commitments with the recognition
that performance is what matters and that superior
people drive performance. In short, we’re rebuild-
ing Rock-Tenn Company in its own former image:
a company of choice for customers and employees
with a strong economic future for our shareholders.
I joined Rock-Tenn Company
a year ago because I was
confident that the core of this
great company that I’d worked with over the years
was strong and would be a challenge and a thrill
in which to work. Over the last year I’ve traveled
broadly among our operations, from Les Industries
Ling in Warwick, Quebec, through our mill
and folding carton networks in the Midwest, the
Atlantic States and the Southeast, to our RTS
plants in Merced and Orange, California. I’ve
met with thousands of our employees and have
confirmed that within our company there are
many men and women who, in our very competi-
tive businesses, are achieving extraordinary results.
These are people who are delivering truly above-
and-beyond performance by any measure.
These high performers and the culture they
embody are capable of creating value year in and
year out because they are driven to do it. We are
making them our role models. Their accomplish-
ments are a testament to what our company can
do – and what everyone at Rock-Tenn must do if
we are to take advantage of our size and financial
strength to generate significant and sustainable
growth in our sales and profits.
Those leaders need and deserve to be part of
a company that supports and builds on their
achievements. That is the strategy we’ve set
about in the last year.
13
20
00
A
nn
ua
l
Re
po
rt
letter to shareholders >>
Dear Customers, Fellow Rock-Tenn
Employees and Shareholders:
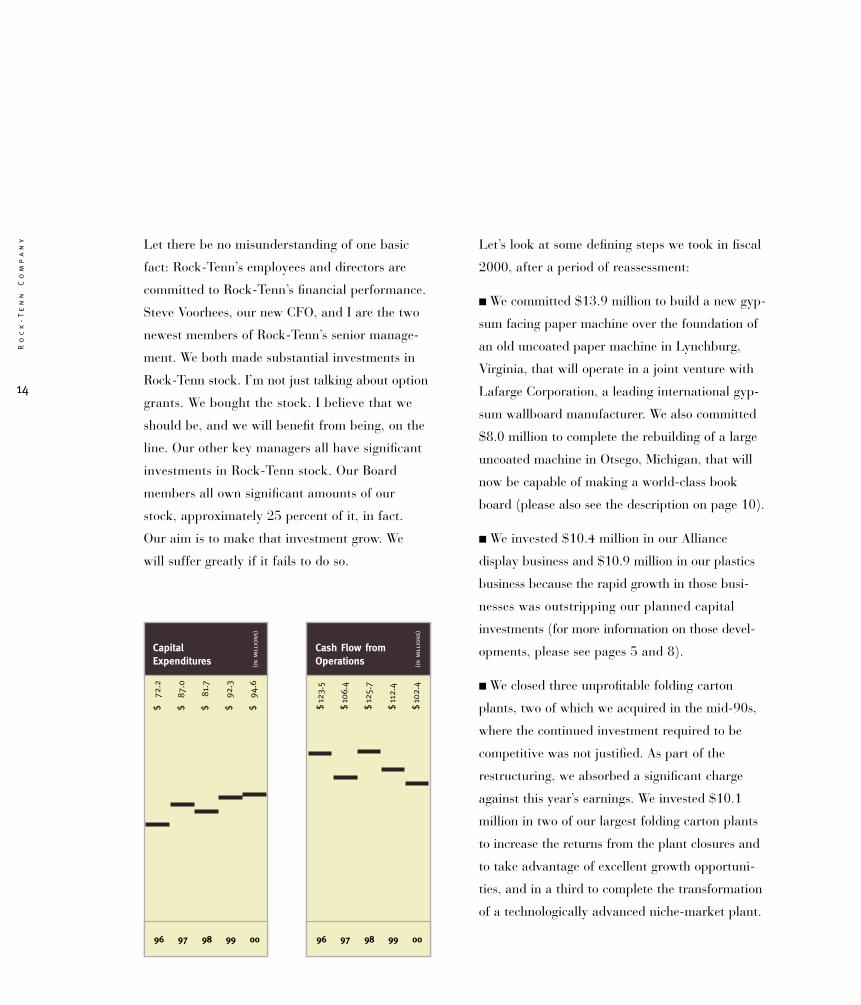
Capital Expenditures
96 97 98 99 00
(in
mil
lions
)
$72
.2
$87
.0
$81
.7
$92
.3
$94
.6Let’s look at some defining steps we took in fiscal
2000, after a period of reassessment:
■ We committed $13.9 million to build a new gyp-
sum facing paper machine over the foundation of
an old uncoated paper machine in Lynchburg,
Virginia, that will operate in a joint venture with
Lafarge Corporation, a leading international gyp-
sum wallboard manufacturer. We also committed
$8.0 million to complete the rebuilding of a large
uncoated machine in Otsego, Michigan, that will
now be capable of making a world-class book
board (please also see the description on page 10).
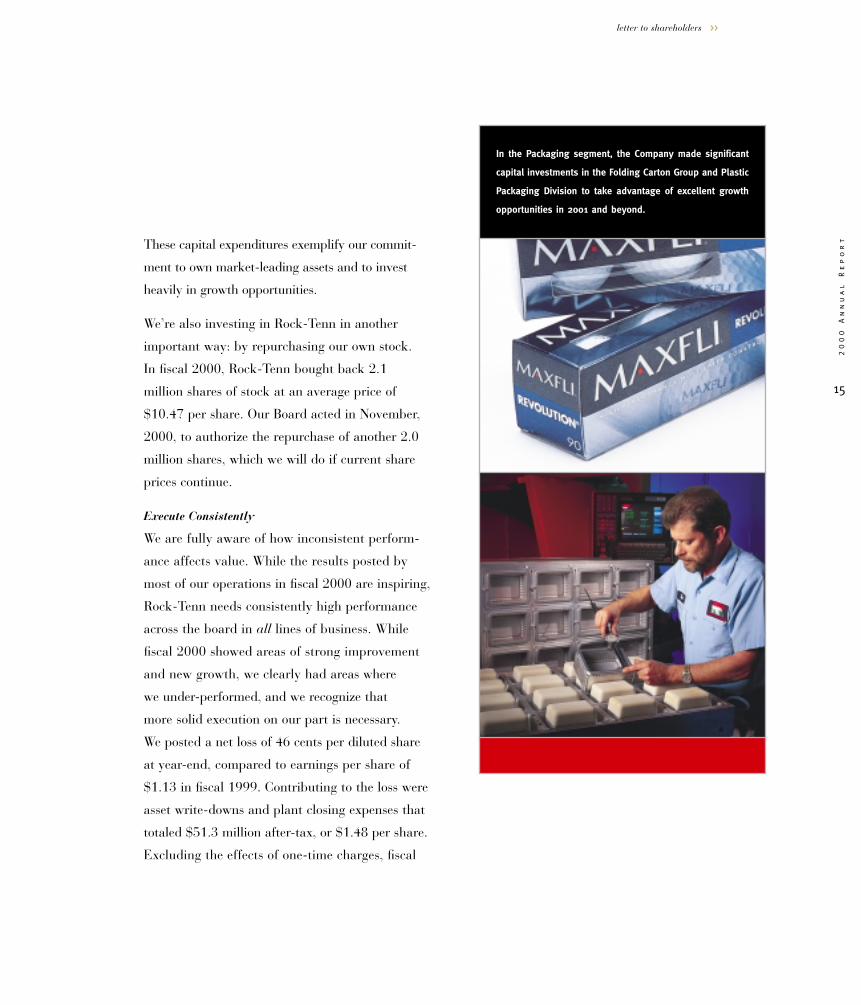
■ We invested $10.4 million in our Alliance
display business and $10.9 million in our plastics
business because the rapid growth in those busi-
nesses was outstripping our planned capital
investments (for more information on those devel-
opments, please see pages 5 and 8).
■ We closed three unprofitable folding carton
plants, two of which we acquired in the mid-90s,
where the continued investment required to be
competitive was not justified. As part of the
restructuring, we absorbed a significant charge
against this year’s earnings. We invested $10.1
million in two of our largest folding carton plants
to increase the returns from the plant closures and
to take advantage of excellent growth opportuni-
ties, and in a third to complete the transformation
of a technologically advanced niche-market plant.
Let there be no misunderstanding of one basic
fact: Rock-Tenn’s employees and directors are
committed to Rock-Tenn’s financial performance.
Steve Voorhees, our new CFO, and I are the two
newest members of Rock-Tenn’s senior manage-
ment. We both made substantial investments in
Rock-Tenn stock. I’m not just talking about option
grants. We bought the stock. I believe that we
should be, and we will benefit from being, on the
line. Our other key managers all have significant
investments in Rock-Tenn stock. Our Board
members all own significant amounts of our
stock, approximately 25 percent of it, in fact.
Our aim is to make that investment grow. We
will suffer greatly if it fails to do so.
14
Ro
ck
-T
en
n
Co
mp
an
y
Cash Flow fromOperations
96 97 98 99 00
(in
mil
lions
)
$12
3.5
$10
6.4
$12
5.7
$11
2.4
$10
2.4
letter to shareholders >>
These capital expenditures exemplify our commit-
ment to own market-leading assets and to invest
heavily in growth opportunities.
We’re also investing in Rock-Tenn in another
important way: by repurchasing our own stock.
In fiscal 2000, Rock-Tenn bought back 2.1
million shares of stock at an average price of
$10.47 per share. Our Board acted in November,
2000, to authorize the repurchase of another 2.0
million shares, which we will do if current share
prices continue.
Execute Consistently
We are fully aware of how inconsistent perform-
ance affects value. While the results posted by
most of our operations in fiscal 2000 are inspiring,
Rock-Tenn needs consistently high performance
across the board in all lines of business. While
fiscal 2000 showed areas of strong improvement
and new growth, we clearly had areas where
we under-performed, and we recognize that
more solid execution on our part is necessary.
We posted a net loss of 46 cents per diluted share
at year-end, compared to earnings per share of
$1.13 in fiscal 1999. Contributing to the loss were
asset write-downs and plant closing expenses that
totaled $51.3 million after-tax, or $1.48 per share.
Excluding the effects of one-time charges, fiscal
15
20
00
A
nn
ua
l
Re
po
rt
In the Packaging segment, the Company made significant
capital investments in the Folding Carton Group and Plastic
Packaging Division to take advantage of excellent growth
opportunities in 2001 and beyond.
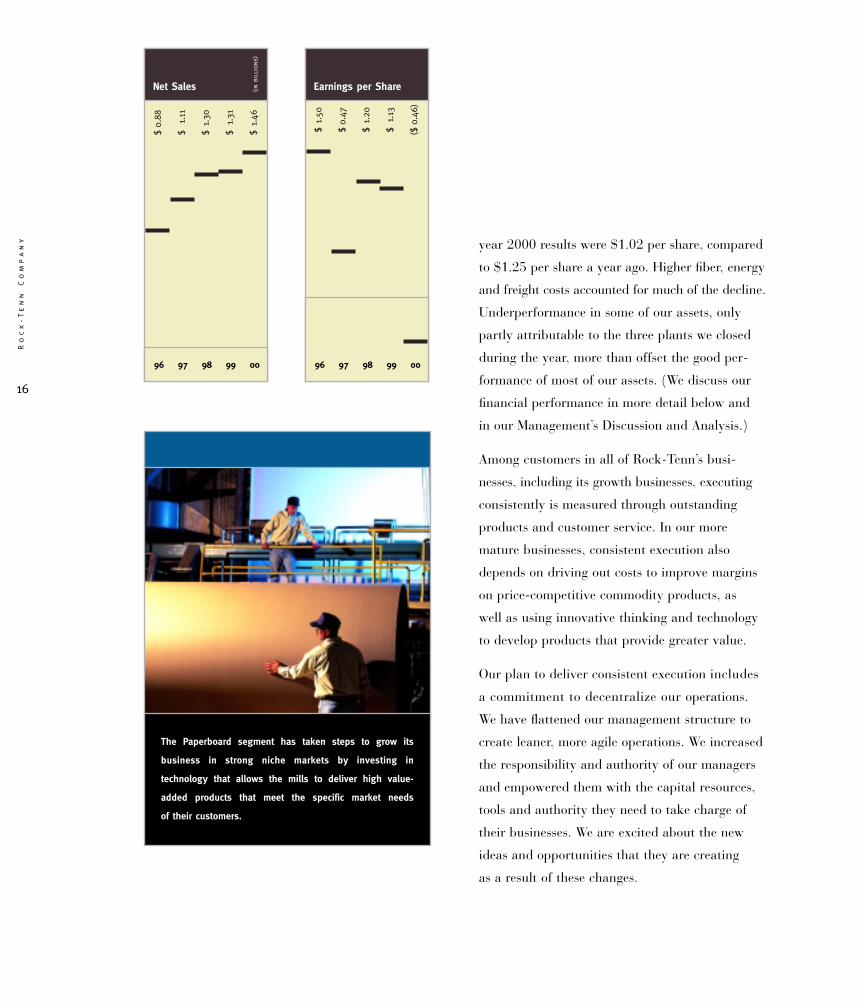
Net Sales
96 97 98 99 00
(in
bill
ions
)
16
Ro
ck
-T
en
n
Co
mp
an
y year 2000 results were $1.02 per share, compared
to $1.25 per share a year ago. Higher fiber, energy
and freight costs accounted for much of the decline.
Underperformance in some of our assets, only
partly attributable to the three plants we closed
during the year, more than offset the good per-
formance of most of our assets. (We discuss our
financial performance in more detail below and
in our Management’s Discussion and Analysis.)
Among customers in all of Rock-Tenn’s busi-
nesses, including its growth businesses, executing
consistently is measured through outstanding
products and customer service. In our more
mature businesses, consistent execution also
depends on driving out costs to improve margins
on price-competitive commodity products, as
well as using innovative thinking and technology
to develop products that provide greater value.
Our plan to deliver consistent execution includes
a commitment to decentralize our operations.
We have flattened our management structure to
create leaner, more agile operations. We increased
the responsibility and authority of our managers
and empowered them with the capital resources,
tools and authority they need to take charge of
their businesses. We are excited about the new
ideas and opportunities that they are creating
as a result of these changes.
$0.
88
$1.
11
$1.
30
$1.
31
$1.
46
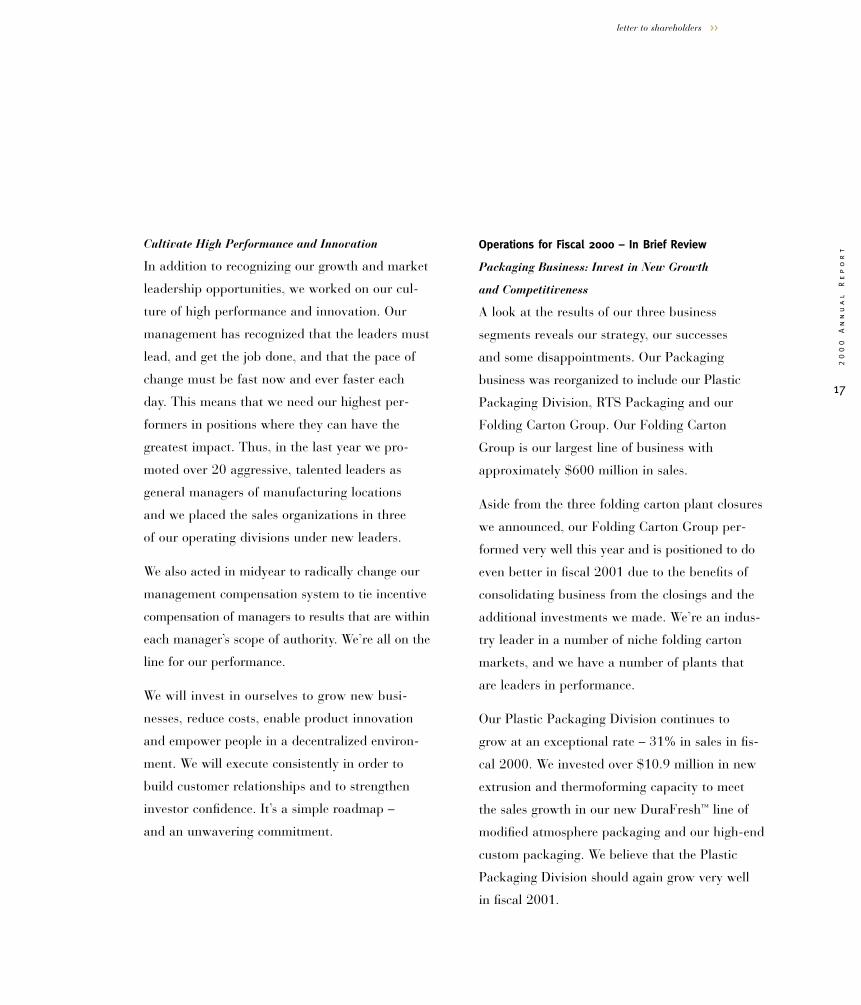
Earnings per Share
96 97 98 99 00
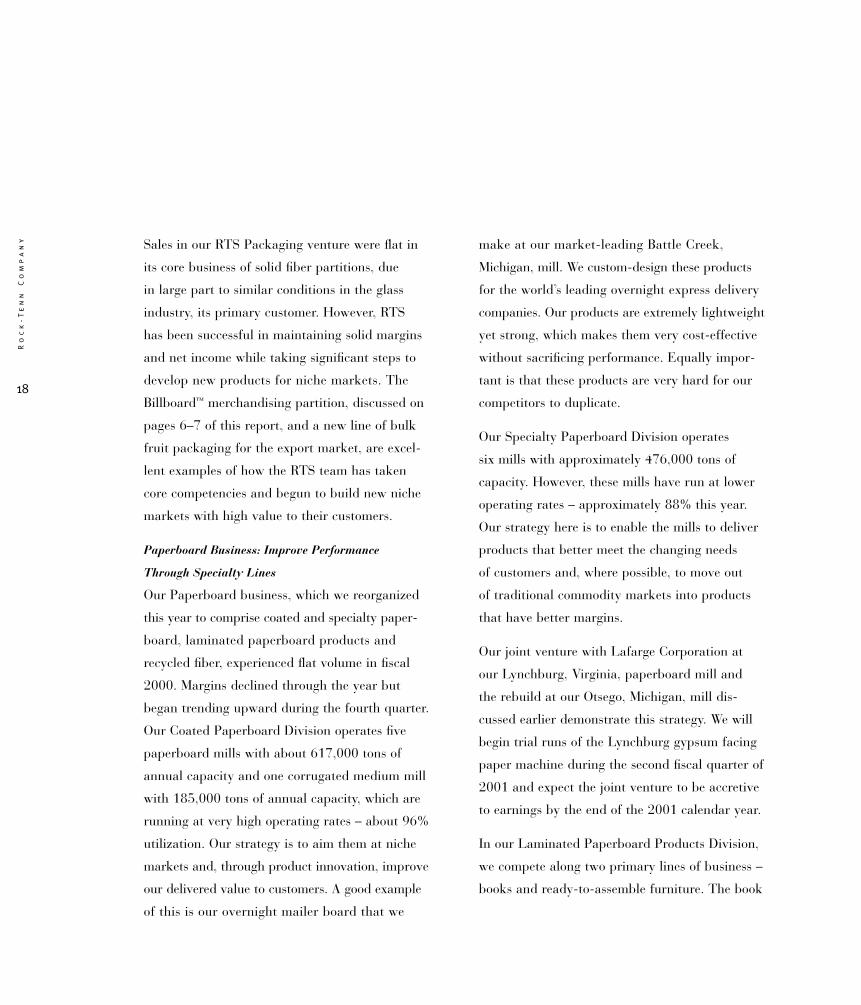
The Paperboard segment has taken steps to grow its
business in strong niche markets by investing in
technology that allows the mills to deliver high value-
added products that meet the specific market needs
of their customers.
$1.
50
$0.
47
$1.
20
$1.
13
($0.
46)
17
20
00
A
nn
ua
l
Re
po
rt
letter to shareholders >>
Cultivate High Performance and Innovation
In addition to recognizing our growth and market
leadership opportunities, we worked on our cul-
ture of high performance and innovation. Our
management has recognized that the leaders must
lead, and get the job done, and that the pace of
change must be fast now and ever faster each
day. This means that we need our highest per-
formers in positions where they can have the
greatest impact. Thus, in the last year we pro-
moted over 20 aggressive, talented leaders as
general managers of manufacturing locations
and we placed the sales organizations in three
of our operating divisions under new leaders.
We also acted in midyear to radically change our
management compensation system to tie incentive
compensation of managers to results that are within
each manager’s scope of authority. We’re all on the
line for our performance.
We will invest in ourselves to grow new busi-
nesses, reduce costs, enable product innovation
and empower people in a decentralized environ-
ment. We will execute consistently in order to
build customer relationships and to strengthen
investor confidence. It’s a simple roadmap –
and an unwavering commitment.
Operations for Fiscal 2000 – In Brief Review
Packaging Business: Invest in New Growth
and Competitiveness
A look at the results of our three business
segments reveals our strategy, our successes
and some disappointments. Our Packaging
business was reorganized to include our Plastic
Packaging Division, RTS Packaging and our
Folding Carton Group. Our Folding Carton
Group is our largest line of business with
approximately $600 million in sales.
Aside from the three folding carton plant closures
we announced, our Folding Carton Group per-
formed very well this year and is positioned to do
even better in fiscal 2001 due to the benefits of
consolidating business from the closings and the
additional investments we made. We’re an indus-
try leader in a number of niche folding carton
markets, and we have a number of plants that
are leaders in performance.
Our Plastic Packaging Division continues to
grow at an exceptional rate – 31% in sales in fis-
cal 2000. We invested over $10.9 million in new
extrusion and thermoforming capacity to meet
the sales growth in our new DuraFresh™ line of
modified atmosphere packaging and our high-end
custom packaging. We believe that the Plastic
Packaging Division should again grow very well
in fiscal 2001.
18
Ro
ck
-T
en
n
Co
mp
an
y Sales in our RTS Packaging venture were flat in
its core business of solid fiber partitions, due
in large part to similar conditions in the glass
industry, its primary customer. However, RTS
has been successful in maintaining solid margins
and net income while taking significant steps to
develop new products for niche markets. The
Billboard™ merchandising partition, discussed on
pages 6–7 of this report, and a new line of bulk
fruit packaging for the export market, are excel-
lent examples of how the RTS team has taken
core competencies and begun to build new niche
markets with high value to their customers.
Paperboard Business: Improve Performance
Through Specialty Lines
Our Paperboard business, which we reorganized
this year to comprise coated and specialty paper-
board, laminated paperboard products and
recycled fiber, experienced flat volume in fiscal
2000. Margins declined through the year but
began trending upward during the fourth quarter.
Our Coated Paperboard Division operates five
paperboard mills with about 617,000 tons of
annual capacity and one corrugated medium mill
with 185,000 tons of annual capacity, which are
running at very high operating rates – about 96%
utilization. Our strategy is to aim them at niche
markets and, through product innovation, improve
our delivered value to customers. A good example
of this is our overnight mailer board that we
make at our market-leading Battle Creek,
Michigan, mill. We custom-design these products
for the world’s leading overnight express delivery
companies. Our products are extremely lightweight
yet strong, which makes them very cost-effective
without sacrificing performance. Equally impor-
tant is that these products are very hard for our
competitors to duplicate.
Our Specialty Paperboard Division operates
six mills with approximately 476,000 tons of
capacity. However, these mills have run at lower
operating rates – approximately 88% this year.
Our strategy here is to enable the mills to deliver
products that better meet the changing needs
of customers and, where possible, to move out
of traditional commodity markets into products
that have better margins.
Our joint venture with Lafarge Corporation at
our Lynchburg, Virginia, paperboard mill and
the rebuild at our Otsego, Michigan, mill dis-
cussed earlier demonstrate this strategy. We will
begin trial runs of the Lynchburg gypsum facing
paper machine during the second fiscal quarter of
2001 and expect the joint venture to be accretive
to earnings by the end of the 2001 calendar year.
In our Laminated Paperboard Products Division,
we compete along two primary lines of business –
books and ready-to-assemble furniture. The book
19
20
00
A
nn
ua
l
Re
po
rt
letter to shareholders >>
market is both stable and extremely competitive.
The ready-to-assemble furniture market, where
we are by far the largest supplier, is also highly
competitive, but it’s growing at about 7% per
year. We’ve gone through a series of consolidations
to rationalize our operations in this business and
have taken some charges to earnings as a result,
but now believe we are in a much better position
to pursue new customers and win back those we
lost in the course of repositioning our assets.
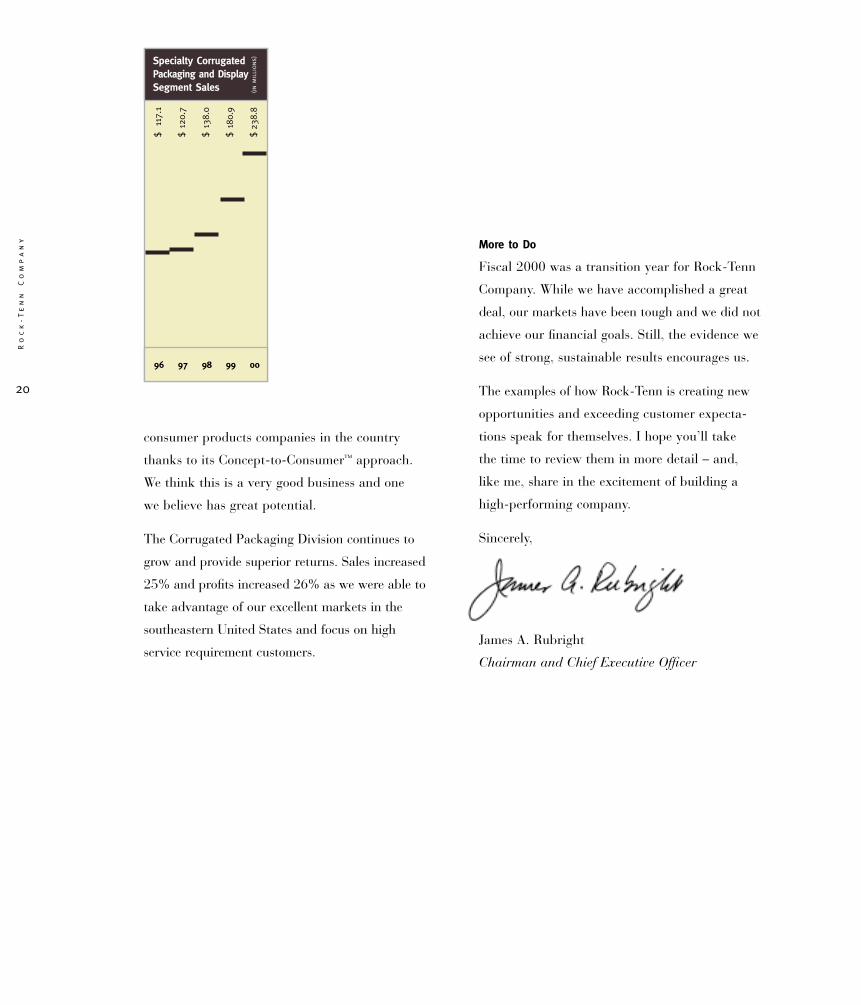
Specialty Corrugated Packaging and Display
Business: Continuing Growth
In our Specialty Corrugated Packaging and
Display business, we invested over $10.4 million
to expand our manufacturing capacity at Alliance
and to open a new contract packing facility to
serve two new major consumer products cus-
tomers. The result was a 36% increase in sales
to $152.7 million and a 25% increase in profits
at Alliance.
How are we doing so well? Certainly the market
has been strong. The point-of-purchase display
business is a $9 billion industry and has grown
5% annually since 1996. We focus on the high
value and service temporary promotional sector
of this business where we believe superior per-
formance is rewarded. Alliance has formed strong
customer relationships with some of the largest
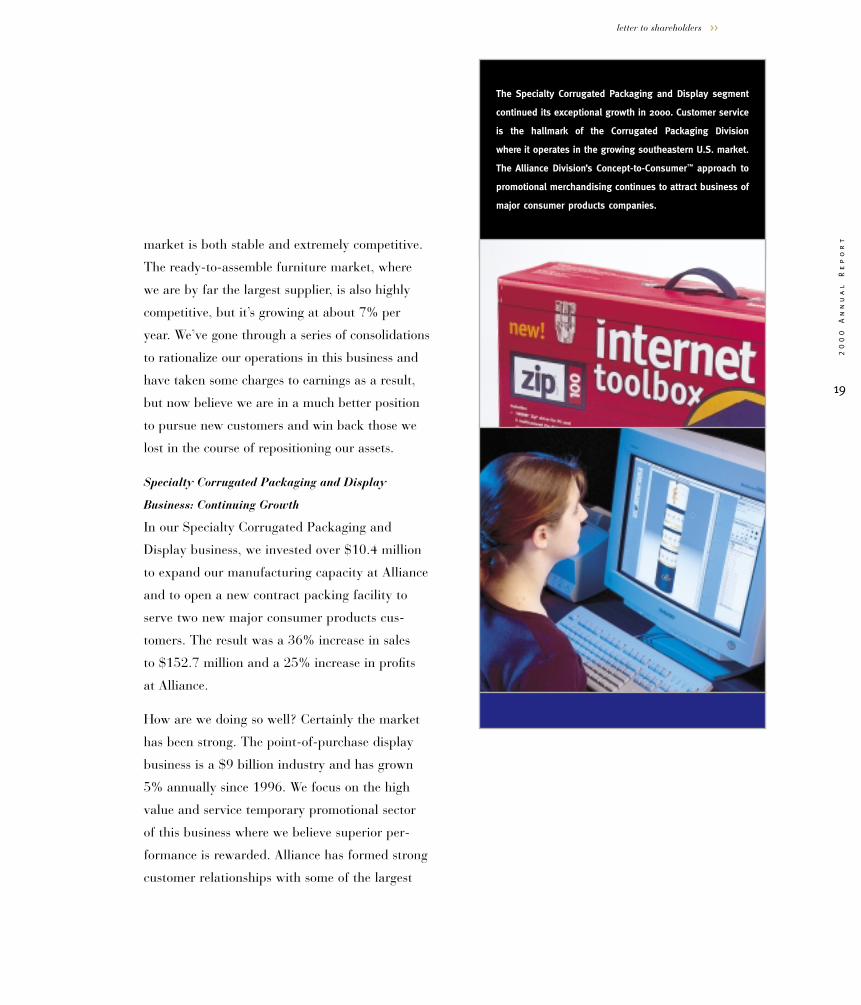
The Specialty Corrugated Packaging and Display segment
continued its exceptional growth in 2000. Customer service
is the hallmark of the Corrugated Packaging Division
where it operates in the growing southeastern U.S. market.
The Alliance Division’s Concept-to-Consumer™ approach to
promotional merchandising continues to attract business of
major consumer products companies.
20
Ro
ck
-T
en
n
Co
mp
an
y
consumer products companies in the country
thanks to its Concept-to-Consumer™ approach.
We think this is a very good business and one
we believe has great potential.
The Corrugated Packaging Division continues to
grow and provide superior returns. Sales increased
25% and profits increased 26% as we were able to
take advantage of our excellent markets in the
southeastern United States and focus on high
service requirement customers.
More to Do
Fiscal 2000 was a transition year for Rock-Tenn
Company. While we have accomplished a great
deal, our markets have been tough and we did not
achieve our financial goals. Still, the evidence we
see of strong, sustainable results encourages us.
The examples of how Rock-Tenn is creating new
opportunities and exceeding customer expecta-
tions speak for themselves. I hope you’ll take
the time to review them in more detail – and,
like me, share in the excitement of building a
high-performing company.
Sincerely,
James A. Rubright
Chairman and Chief Executive Officer
Specialty Corrugated Packaging and DisplaySegment Sales
96 97 98 99 00
(in
mil
lions
)
$11
7.1
$12
0.7
$13
8.0
$18
0.9
$23
8.8
21
20
00
A
nn
ua
l
Re
po
rt
Rock-Tenn CompanyFinancial Review
Five-Year Selected Financial and Operating Highlights 22
Management’s Discussion and Analysis ofResults of Operations and Financial Condition 23
Consolidated Statements of Operations 34
Consolidated Balance Sheets 35
Consolidated Statements of Shareholders’ Equity 36
Consolidated Statements of Cash Flows 37
Notes to Consolidated Financial Statements 38
Report of Independent Auditors 50
Management’s Statement of Responsibility for Financial Information 51
Officers and Directors 52
Shareholder Information 53
Ro
ck
-T
en
n
Co
mp
an
y
22
year ended september 30,
(in thousands, except per share amounts) 2000 1999 1998 1997(c),(d) 1996
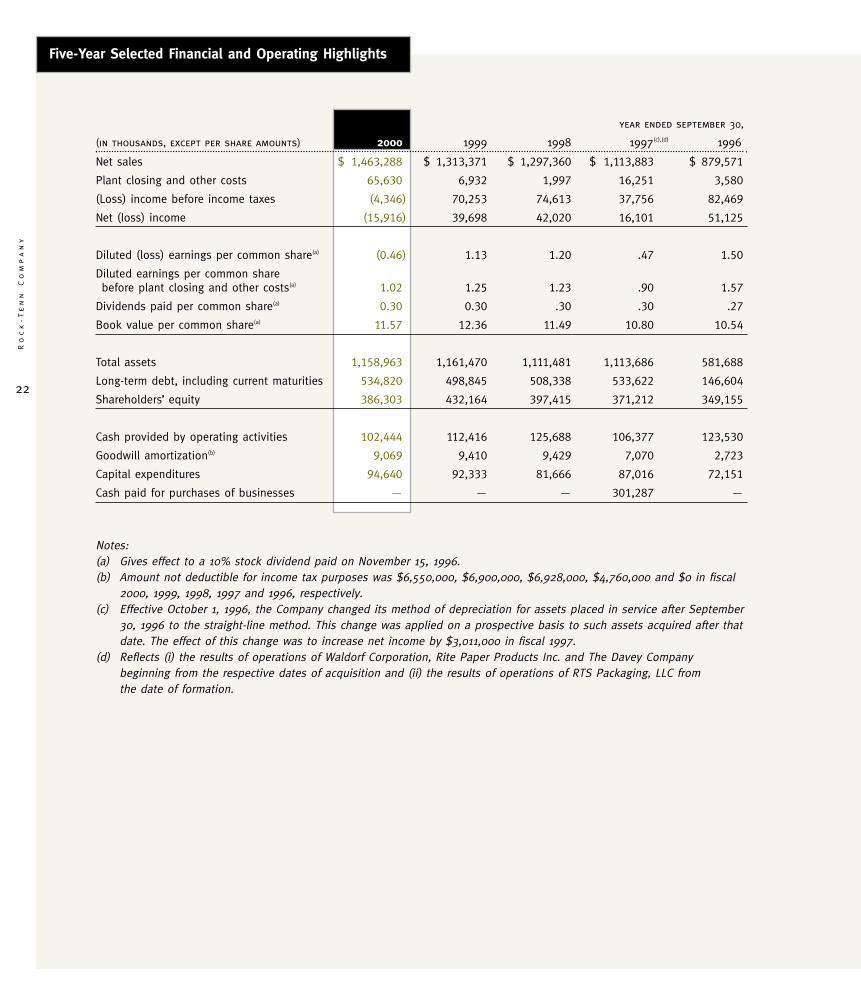
Net sales $ 1,463,288 $ 1,313,371 $ 1,297,360 $ 1,113,883 $ 879,571
Plant closing and other costs 65,630 6,932 1,997 16,251 3,580
(Loss) income before income taxes (4,346) 70,253 74,613 37,756 82,469
Net (loss) income (15,916) 39,698 42,020 16,101 51,125
Diluted (loss) earnings per common share(a) (0.46) 1.13 1.20 .47 1.50
Diluted earnings per common sharebefore plant closing and other costs(a) 1.02 1.25 1.23 .90 1.57
Dividends paid per common share(a) 0.30 0.30 .30 .30 .27
Book value per common share(a) 11.57 12.36 11.49 10.80 10.54
Total assets 1,158,963 1,161,470 1,111,481 1,113,686 581,688
Long-term debt, including current maturities 534,820 498,845 508,338 533,622 146,604
Shareholders’ equity 386,303 432,164 397,415 371,212 349,155
Cash provided by operating activities 102,444 112,416 125,688 106,377 123,530
Goodwill amortization(b) 9,069 9,410 9,429 7,070 2,723
Capital expenditures 94,640 92,333 81,666 87,016 72,151
Cash paid for purchases of businesses — — — 301,287 —
Notes:(a) Gives effect to a 10% stock dividend paid on November 15, 1996.(b) Amount not deductible for income tax purposes was $6,550,000, $6,900,000, $6,928,000, $4,760,000 and $0 in fiscal
2000, 1999, 1998, 1997 and 1996, respectively.(c) Effective October 1, 1996, the Company changed its method of depreciation for assets placed in service after September
30, 1996 to the straight-line method. This change was applied on a prospective basis to such assets acquired after thatdate. The effect of this change was to increase net income by $3,011,000 in fiscal 1997.
(d) Reflects (i) the results of operations of Waldorf Corporation, Rite Paper Products Inc. and The Davey Companybeginning from the respective dates of acquisition and (ii) the results of operations of RTS Packaging, LLC fromthe date of formation.
Five-Year Selected Financial and Operating Highlights
20
00
A
nn
ua
l
Re
po
rt
23
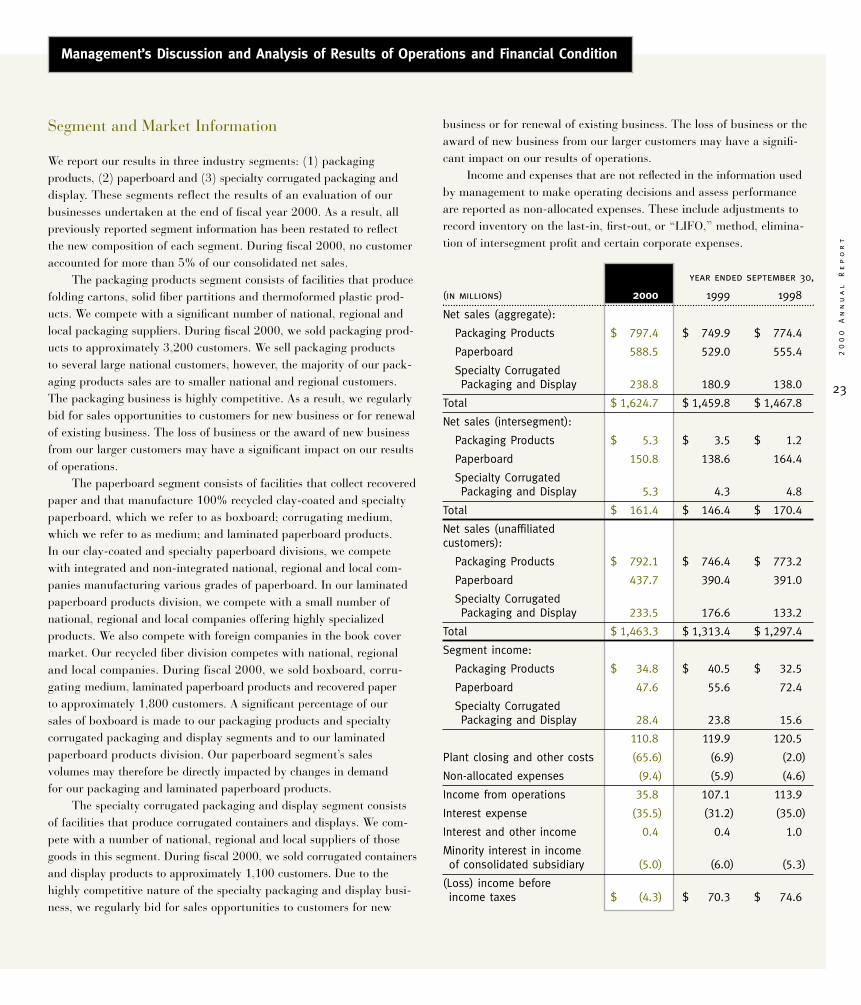
Segment and Market Information
We report our results in three industry segments: (1) packagingproducts, (2) paperboard and (3) specialty corrugated packaging anddisplay. These segments reflect the results of an evaluation of ourbusinesses undertaken at the end of fiscal year 2000. As a result, allpreviously reported segment information has been restated to reflectthe new composition of each segment. During fiscal 2000, no customeraccounted for more than 5% of our consolidated net sales.
The packaging products segment consists of facilities that producefolding cartons, solid fiber partitions and thermoformed plastic prod-ucts. We compete with a significant number of national, regional andlocal packaging suppliers. During fiscal 2000, we sold packaging prod-ucts to approximately 3,200 customers. We sell packaging productsto several large national customers, however, the majority of our pack-aging products sales are to smaller national and regional customers.The packaging business is highly competitive. As a result, we regularlybid for sales opportunities to customers for new business or for renewalof existing business. The loss of business or the award of new businessfrom our larger customers may have a significant impact on our resultsof operations.
The paperboard segment consists of facilities that collect recoveredpaper and that manufacture 100% recycled clay-coated and specialtypaperboard, which we refer to as boxboard; corrugating medium,which we refer to as medium; and laminated paperboard products.In our clay-coated and specialty paperboard divisions, we competewith integrated and non-integrated national, regional and local com-panies manufacturing various grades of paperboard. In our laminatedpaperboard products division, we compete with a small number ofnational, regional and local companies offering highly specializedproducts. We also compete with foreign companies in the book covermarket. Our recycled fiber division competes with national, regionaland local companies. During fiscal 2000, we sold boxboard, corru-gating medium, laminated paperboard products and recovered paperto approximately 1,800 customers. A significant percentage of oursales of boxboard is made to our packaging products and specialtycorrugated packaging and display segments and to our laminatedpaperboard products division. Our paperboard segment’s salesvolumes may therefore be directly impacted by changes in demandfor our packaging and laminated paperboard products.
The specialty corrugated packaging and display segment consistsof facilities that produce corrugated containers and displays. We com-pete with a number of national, regional and local suppliers of thosegoods in this segment. During fiscal 2000, we sold corrugated containersand display products to approximately 1,100 customers. Due to thehighly competitive nature of the specialty packaging and display busi-ness, we regularly bid for sales opportunities to customers for new
business or for renewal of existing business. The loss of business or the award of new business from our larger customers may have a signifi-cant impact on our results of operations.
Income and expenses that are not reflected in the information usedby management to make operating decisions and assess performanceare reported as non-allocated expenses. These include adjustments torecord inventory on the last-in, first-out, or “LIFO,” method, elimina-tion of intersegment profit and certain corporate expenses.
year ended september 30,
(in millions) 2000 1999 1998
Net sales (aggregate):
Packaging Products $ 797.4 $ 749.9 $ 774.4
Paperboard 588.5 529.0 555.4
Specialty Corrugated Packaging and Display 238.8 180.9 138.0
Total $ 1,624.7 $ 1,459.8 $ 1,467.8
Net sales (intersegment):
Packaging Products $ 5.3 $ 3.5 $ 1.2
Paperboard 150.8 138.6 164.4
Specialty Corrugated Packaging and Display 5.3 4.3 4.8
Total $ 161.4 $ 146.4 $ 170.4
Net sales (unaffiliated customers):
Packaging Products $ 792.1 $ 746.4 $ 773.2
Paperboard 437.7 390.4 391.0
Specialty Corrugated Packaging and Display 233.5 176.6 133.2
Total $ 1,463.3 $ 1,313.4 $ 1,297.4
Segment income:
Packaging Products $ 34.8 $ 40.5 $ 32.5
Paperboard 47.6 55.6 72.4
Specialty Corrugated Packaging and Display 28.4 23.8 15.6
110.8 119.9 120.5
Plant closing and other costs (65.6) (6.9) (2.0)
Non-allocated expenses (9.4) (5.9) (4.6)
Income from operations 35.8 107.1 113.9
Interest expense (35.5) (31.2) (35.0)
Interest and other income 0.4 0.4 1.0
Minority interest in income of consolidated subsidiary (5.0) (6.0) (5.3)
(Loss) income before income taxes $ (4.3) $ 70.3 $ 74.6
Management’s Discussion and Analysis of Results of Operations and Financial Condition
Management’s Discussion and Analysis
Ro
ck
-T
en
n
Co
mp
an
y
24
Results of Operations
We provide quarterly information in the following tables to assist inevaluating trends in our results of operations. For additional discussionof quarterly information, see our quarterly reports on Form 10-Q filedwith the Securities and Exchange Commission.
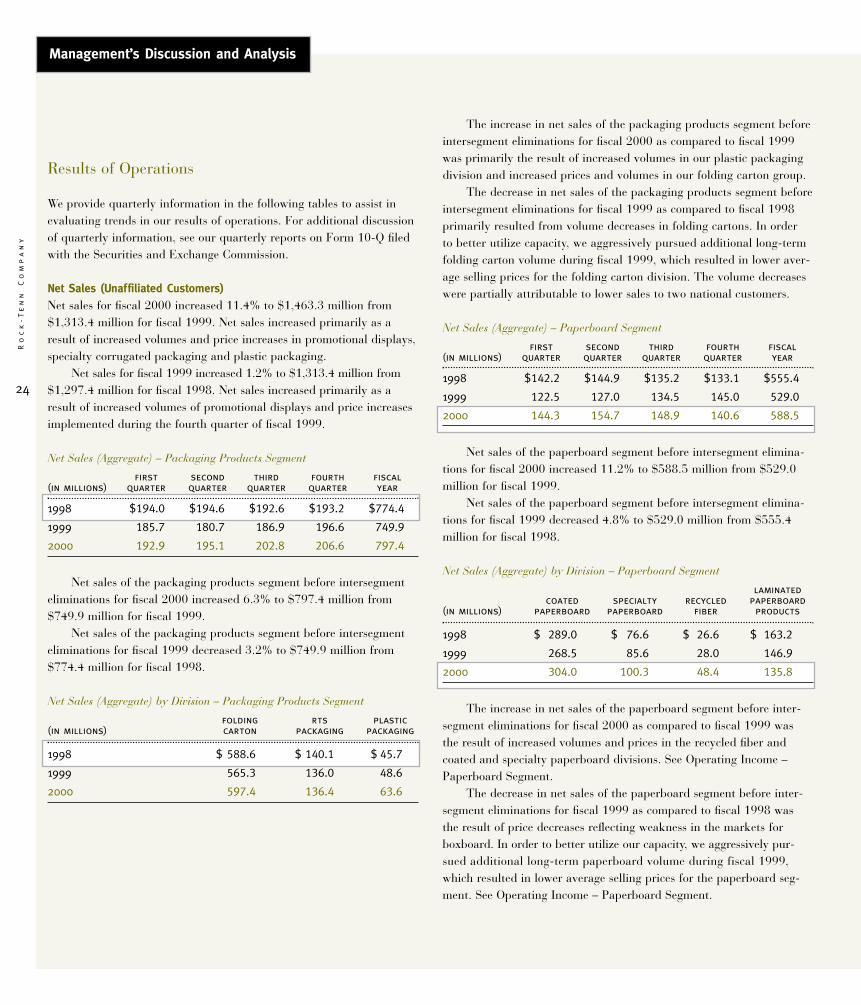
Net Sales (Unaffiliated Customers) Net sales for fiscal 2000 increased 11.4% to $1,463.3 million from$1,313.4 million for fiscal 1999. Net sales increased primarily as aresult of increased volumes and price increases in promotional displays,specialty corrugated packaging and plastic packaging.
Net sales for fiscal 1999 increased 1.2% to $1,313.4 million from$1,297.4 million for fiscal 1998. Net sales increased primarily as aresult of increased volumes of promotional displays and price increasesimplemented during the fourth quarter of fiscal 1999.
Net Sales (Aggregate) – Packaging Products Segment
first second third fourth fiscal(in millions) quarter quarter quarter quarter year
1998 $194.0 $194.6 $192.6 $193.2 $774.4
1999 185.7 180.7 186.9 196.6 749.9
2000 192.9 195.1 202.8 206.6 797.4
Net sales of the packaging products segment before intersegmenteliminations for fiscal 2000 increased 6.3% to $797.4 million from$749.9 million for fiscal 1999.
Net sales of the packaging products segment before intersegmenteliminations for fiscal 1999 decreased 3.2% to $749.9 million from$774.4 million for fiscal 1998.
Net Sales (Aggregate) by Division – Packaging Products Segment
folding rts plastic(in millions) carton packaging packaging
1998 $ 588.6 $ 140.1 $ 45.7
1999 565.3 136.0 48.6
2000 597.4 136.4 63.6
The increase in net sales of the packaging products segment beforeintersegment eliminations for fiscal 2000 as compared to fiscal 1999was primarily the result of increased volumes in our plastic packagingdivision and increased prices and volumes in our folding carton group.
The decrease in net sales of the packaging products segment beforeintersegment eliminations for fiscal 1999 as compared to fiscal 1998primarily resulted from volume decreases in folding cartons. In orderto better utilize capacity, we aggressively pursued additional long-termfolding carton volume during fiscal 1999, which resulted in lower aver-age selling prices for the folding carton division. The volume decreaseswere partially attributable to lower sales to two national customers.
Net Sales (Aggregate) – Paperboard Segment
first second third fourth fiscal(in millions) quarter quarter quarter quarter year
1998 $142.2 $144.9 $135.2 $133.1 $555.4
1999 122.5 127.0 134.5 145.0 529.0
2000 144.3 154.7 148.9 140.6 588.5
Net sales of the paperboard segment before intersegment elimina-tions for fiscal 2000 increased 11.2% to $588.5 million from $529.0million for fiscal 1999.
Net sales of the paperboard segment before intersegment elimina-tions for fiscal 1999 decreased 4.8% to $529.0 million from $555.4million for fiscal 1998.
Net Sales (Aggregate) by Division – Paperboard Segment
laminatedcoated specialty recycled paperboard
(in millions) paperboard paperboard fiber products
1998 $ 289.0 $ 76.6 $ 26.6 $ 163.2
1999 268.5 85.6 28.0 146.9
2000 304.0 100.3 48.4 135.8
The increase in net sales of the paperboard segment before inter-segment eliminations for fiscal 2000 as compared to fiscal 1999 wasthe result of increased volumes and prices in the recycled fiber andcoated and specialty paperboard divisions. See Operating Income –Paperboard Segment.
The decrease in net sales of the paperboard segment before inter-segment eliminations for fiscal 1999 as compared to fiscal 1998 wasthe result of price decreases reflecting weakness in the markets forboxboard. In order to better utilize our capacity, we aggressively pur-sued additional long-term paperboard volume during fiscal 1999,which resulted in lower average selling prices for the paperboard seg-ment. See Operating Income – Paperboard Segment.
management’s discussion and analysis >>
20
00
A
nn
ua
l
Re
po
rt
25
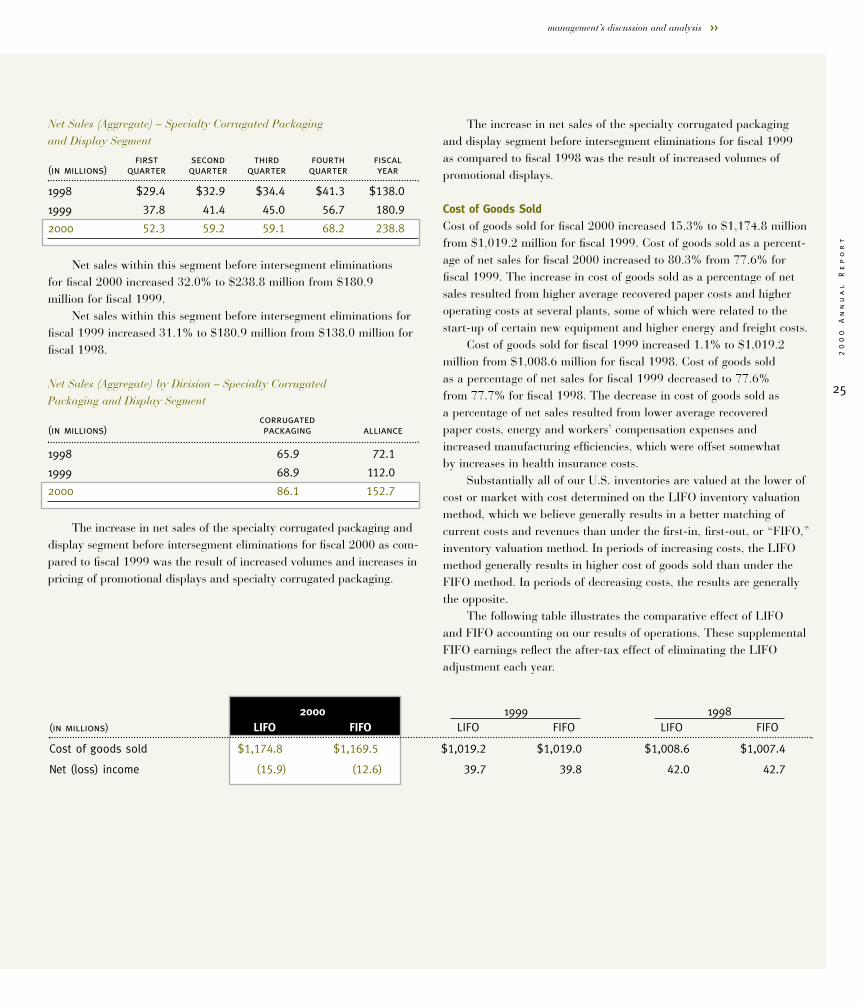
Net Sales (Aggregate) – Specialty Corrugated Packagingand Display Segment
first second third fourth fiscal(in millions) quarter quarter quarter quarter year
1998 $29.4 $32.9 $34.4 $41.3 $138.0
1999 37.8 41.4 45.0 56.7 180.9
2000 52.3 59.2 59.1 68.2 238.8
Net sales within this segment before intersegment eliminationsfor fiscal 2000 increased 32.0% to $238.8 million from $180.9 million for fiscal 1999.
Net sales within this segment before intersegment eliminations forfiscal 1999 increased 31.1% to $180.9 million from $138.0 million forfiscal 1998.
Net Sales (Aggregate) by Division – Specialty Corrugated Packaging and Display Segment
corrugated(in millions) packaging alliance
1998 65.9 72.1
1999 68.9 112.0
2000 86.1 152.7
The increase in net sales of the specialty corrugated packaging anddisplay segment before intersegment eliminations for fiscal 2000 as com-pared to fiscal 1999 was the result of increased volumes and increases inpricing of promotional displays and specialty corrugated packaging.
The increase in net sales of the specialty corrugated packagingand display segment before intersegment eliminations for fiscal 1999as compared to fiscal 1998 was the result of increased volumes ofpromotional displays.
Cost of Goods Sold Cost of goods sold for fiscal 2000 increased 15.3% to $1,174.8 millionfrom $1,019.2 million for fiscal 1999. Cost of goods sold as a percent-age of net sales for fiscal 2000 increased to 80.3% from 77.6% forfiscal 1999. The increase in cost of goods sold as a percentage of netsales resulted from higher average recovered paper costs and higheroperating costs at several plants, some of which were related to thestart-up of certain new equipment and higher energy and freight costs.
Cost of goods sold for fiscal 1999 increased 1.1% to $1,019.2million from $1,008.6 million for fiscal 1998. Cost of goods soldas a percentage of net sales for fiscal 1999 decreased to 77.6%from 77.7% for fiscal 1998. The decrease in cost of goods sold as a percentage of net sales resulted from lower average recoveredpaper costs, energy and workers’ compensation expenses andincreased manufacturing efficiencies, which were offset somewhatby increases in health insurance costs.
Substantially all of our U.S. inventories are valued at the lower ofcost or market with cost determined on the LIFO inventory valuationmethod, which we believe generally results in a better matching ofcurrent costs and revenues than under the first-in, first-out, or “FIFO,”inventory valuation method. In periods of increasing costs, the LIFOmethod generally results in higher cost of goods sold than under theFIFO method. In periods of decreasing costs, the results are generallythe opposite.
The following table illustrates the comparative effect of LIFOand FIFO accounting on our results of operations. These supplementalFIFO earnings reflect the after-tax effect of eliminating the LIFOadjustment each year.
2000 1999 1998(in millions) LIFO FIFO LIFO FIFO LIFO FIFO
Cost of goods sold $1,174.8 $1,169.5 $1,019.2 $1,019.0 $1,008.6 $1,007.4
Net (loss) income (15.9) (12.6) 39.7 39.8 42.0 42.7
Management’s Discussion and Analysis
Ro
ck
-T
en
n
Co
mp
an
y
26
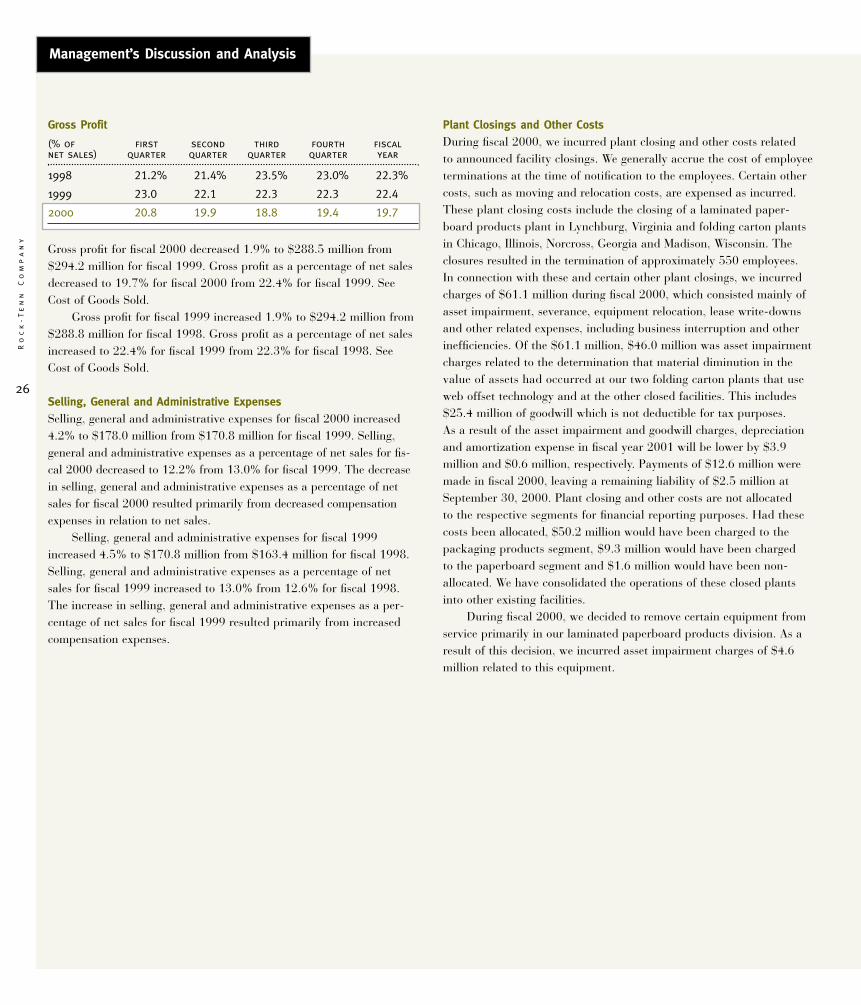
Gross Profit
(% of first second third fourth fiscalnet sales) quarter quarter quarter quarter year
1998 21.2% 21.4% 23.5% 23.0% 22.3%
1999 23.0 22.1 22.3 22.3 22.4
2000 20.8 19.9 18.8 19.4 19.7
Gross profit for fiscal 2000 decreased 1.9% to $288.5 million from$294.2 million for fiscal 1999. Gross profit as a percentage of net salesdecreased to 19.7% for fiscal 2000 from 22.4% for fiscal 1999. SeeCost of Goods Sold.
Gross profit for fiscal 1999 increased 1.9% to $294.2 million from$288.8 million for fiscal 1998. Gross profit as a percentage of net salesincreased to 22.4% for fiscal 1999 from 22.3% for fiscal 1998. SeeCost of Goods Sold.
Selling, General and Administrative ExpensesSelling, general and administrative expenses for fiscal 2000 increased4.2% to $178.0 million from $170.8 million for fiscal 1999. Selling,general and administrative expenses as a percentage of net sales for fis-cal 2000 decreased to 12.2% from 13.0% for fiscal 1999. The decreasein selling, general and administrative expenses as a percentage of netsales for fiscal 2000 resulted primarily from decreased compensationexpenses in relation to net sales.
Selling, general and administrative expenses for fiscal 1999increased 4.5% to $170.8 million from $163.4 million for fiscal 1998.Selling, general and administrative expenses as a percentage of netsales for fiscal 1999 increased to 13.0% from 12.6% for fiscal 1998.The increase in selling, general and administrative expenses as a per-centage of net sales for fiscal 1999 resulted primarily from increasedcompensation expenses.
Plant Closings and Other Costs During fiscal 2000, we incurred plant closing and other costs relatedto announced facility closings. We generally accrue the cost of employeeterminations at the time of notification to the employees. Certain othercosts, such as moving and relocation costs, are expensed as incurred.These plant closing costs include the closing of a laminated paper-board products plant in Lynchburg, Virginia and folding carton plantsin Chicago, Illinois, Norcross, Georgia and Madison, Wisconsin. Theclosures resulted in the termination of approximately 550 employees.In connection with these and certain other plant closings, we incurredcharges of $61.1 million during fiscal 2000, which consisted mainly ofasset impairment, severance, equipment relocation, lease write-downsand other related expenses, including business interruption and otherinefficiencies. Of the $61.1 million, $46.0 million was asset impairmentcharges related to the determination that material diminution in thevalue of assets had occurred at our two folding carton plants that useweb offset technology and at the other closed facilities. This includes$25.4 million of goodwill which is not deductible for tax purposes. As a result of the asset impairment and goodwill charges, depreciationand amortization expense in fiscal year 2001 will be lower by $3.9million and $0.6 million, respectively. Payments of $12.6 million weremade in fiscal 2000, leaving a remaining liability of $2.5 million atSeptember 30, 2000. Plant closing and other costs are not allocatedto the respective segments for financial reporting purposes. Had thesecosts been allocated, $50.2 million would have been charged to thepackaging products segment, $9.3 million would have been chargedto the paperboard segment and $1.6 million would have been non-allocated. We have consolidated the operations of these closed plantsinto other existing facilities.
During fiscal 2000, we decided to remove certain equipment fromservice primarily in our laminated paperboard products division. As aresult of this decision, we incurred asset impairment charges of $4.6million related to this equipment.
management’s discussion and analysis >>
20
00
A
nn
ua
l
Re
po
rt
27
During fiscal 1999, we closed a folding carton plant in Taylorsville,North Carolina, a laminated paperboard products operation in Otsego,Michigan and an uncoated papermill serving our coverboard convertingoperations in Jersey City, New Jersey. The closures resulted in the ter-mination of approximately 280 employees. In connection with theseclosings, we incurred charges of $6.3 million during fiscal 1999, whichconsisted mainly of severance, equipment relocation, expected losses onthe disposition of the facility and related expenses. We made paymentsof $0.3 million and $4.1 million in fiscal 2000 and 1999, respectively,incurred losses of $0.2 million and $0.8 million in connection withthe disposal of inventory and other assets during fiscal 2000 and 1999,respectively, made an adjustment of $0.1 million to reduce the liabilityduring fiscal 2000 and reduced the carrying value of the Jersey Cityfacility by $1.0 million during fiscal 1999, leaving a nominal remainingliability at September 30, 2000. Plant closing and other costs are notallocated to the respective segments for financial reporting purposes.Had these costs been allocated, $3.9 million would have been chargedto the paperboard segment in fiscal 1999 and $2.4 million of expensewould have been charged to the packaging products segment in fiscal1999. We have consolidated the operations of these closed plants intoother existing facilities.
During fiscal 1998, we began implementing certain cost reductioninitiatives designed to reduce overhead and production costs and improveoperating efficiency. In connection with these cost reduction initiatives,we terminated approximately 40 employees and recorded $0.6 millionand $2.0 million of costs related to these terminations during fiscal1999 and 1998, respectively. We made payments of approximately$0.5 million, $1.2 million and a nominal amount during fiscal 2000,1999 and 1998, respectively, related to these terminations and madean adjustment to reduce the liability by $0.3 million during fiscal 2000.The remaining liability at September 30, 2000 is approximately $0.5million, which is expected to be paid during fiscal 2001.
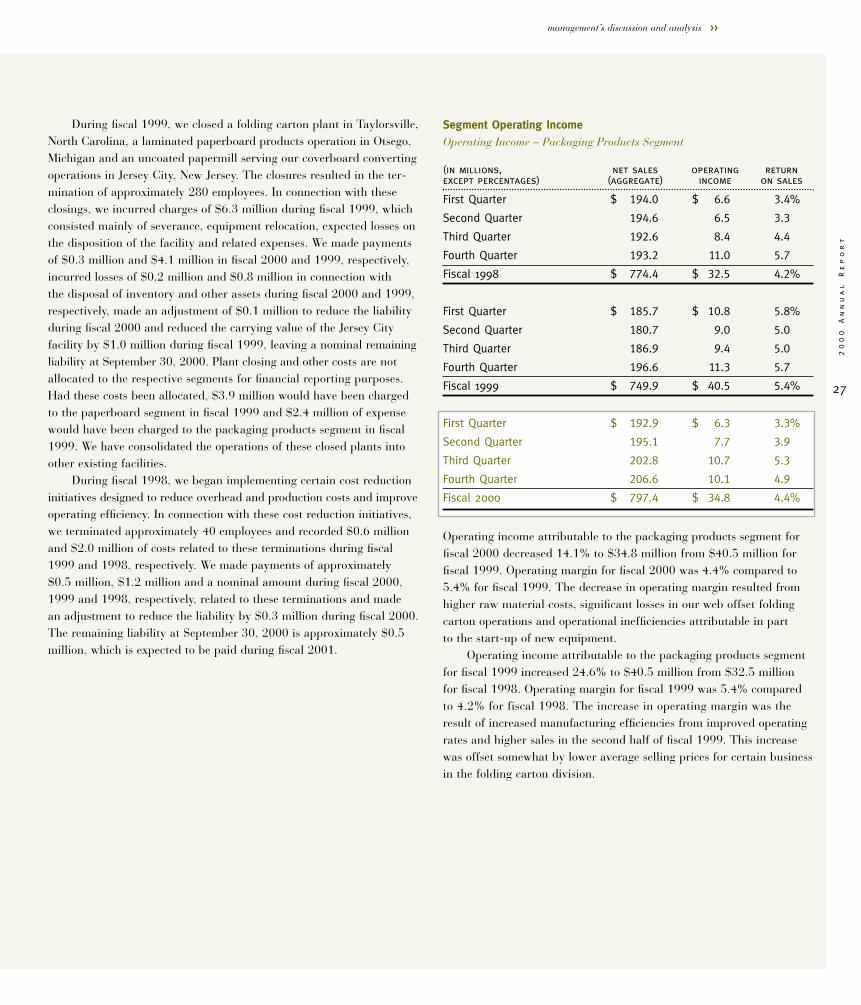
Segment Operating IncomeOperating Income – Packaging Products Segment
(in millions, net sales operating returnexcept percentages) (aggregate) income on sales
First Quarter $ 194.0 $ 6.6 3.4%
Second Quarter 194.6 6.5 3.3
Third Quarter 192.6 8.4 4.4
Fourth Quarter 193.2 11.0 5.7
Fiscal 1998 $ 774.4 $ 32.5 4.2%
First Quarter $ 185.7 $ 10.8 5.8%
Second Quarter 180.7 9.0 5.0
Third Quarter 186.9 9.4 5.0
Fourth Quarter 196.6 11.3 5.7
Fiscal 1999 $ 749.9 $ 40.5 5.4%
First Quarter $ 192.9 $ 6.3 3.3%
Second Quarter 195.1 7.7 3.9
Third Quarter 202.8 10.7 5.3
Fourth Quarter 206.6 10.1 4.9
Fiscal 2000 $ 797.4 $ 34.8 4.4%
Operating income attributable to the packaging products segment forfiscal 2000 decreased 14.1% to $34.8 million from $40.5 million forfiscal 1999. Operating margin for fiscal 2000 was 4.4% compared to5.4% for fiscal 1999. The decrease in operating margin resulted fromhigher raw material costs, significant losses in our web offset foldingcarton operations and operational inefficiencies attributable in partto the start-up of new equipment.
Operating income attributable to the packaging products segmentfor fiscal 1999 increased 24.6% to $40.5 million from $32.5 millionfor fiscal 1998. Operating margin for fiscal 1999 was 5.4% comparedto 4.2% for fiscal 1998. The increase in operating margin was theresult of increased manufacturing efficiencies from improved operatingrates and higher sales in the second half of fiscal 1999. This increasewas offset somewhat by lower average selling prices for certain businessin the folding carton division.
Management’s Discussion and Analysis
Ro
ck
-T
en
n
Co
mp
an
y
28
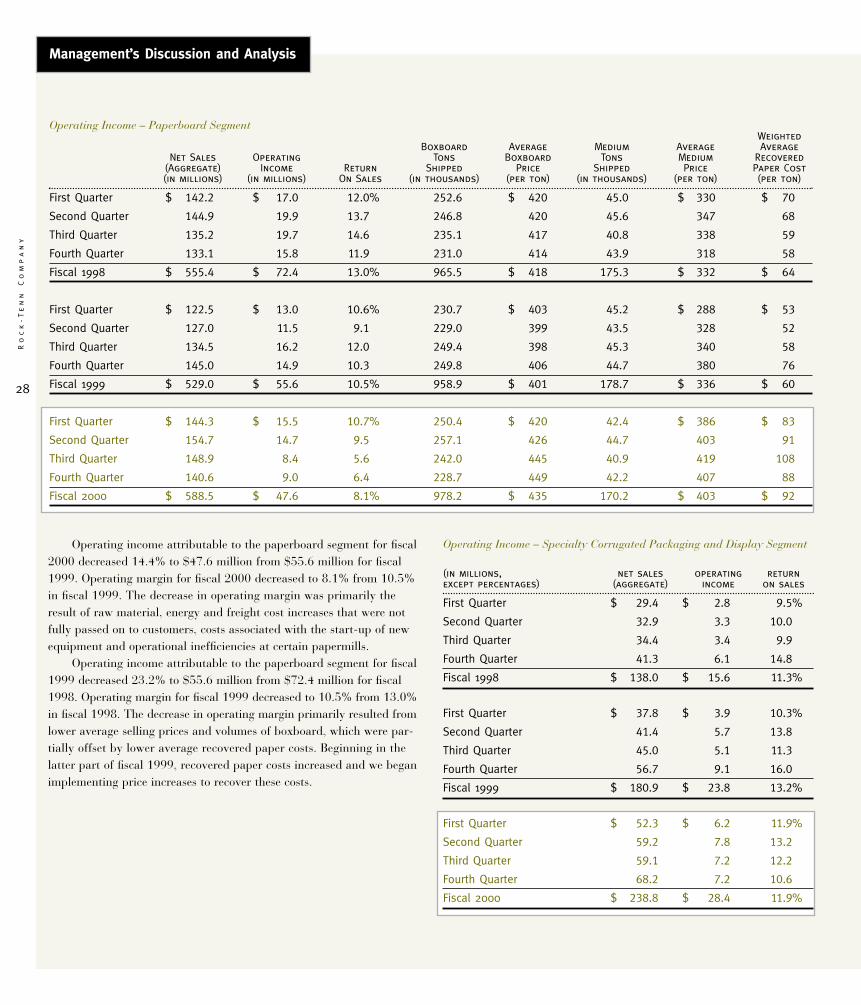
Operating income attributable to the paperboard segment for fiscal2000 decreased 14.4% to $47.6 million from $55.6 million for fiscal1999. Operating margin for fiscal 2000 decreased to 8.1% from 10.5%in fiscal 1999. The decrease in operating margin was primarily theresult of raw material, energy and freight cost increases that were notfully passed on to customers, costs associated with the start-up of newequipment and operational inefficiencies at certain papermills.
Operating income attributable to the paperboard segment for fiscal1999 decreased 23.2% to $55.6 million from $72.4 million for fiscal1998. Operating margin for fiscal 1999 decreased to 10.5% from 13.0%in fiscal 1998. The decrease in operating margin primarily resulted fromlower average selling prices and volumes of boxboard, which were par-tially offset by lower average recovered paper costs. Beginning in thelatter part of fiscal 1999, recovered paper costs increased and we beganimplementing price increases to recover these costs.
Operating Income – Specialty Corrugated Packaging and Display Segment
(in millions, net sales operating returnexcept percentages) (aggregate) income on sales
First Quarter $ 29.4 $ 2.8 9.5%
Second Quarter 32.9 3.3 10.0
Third Quarter 34.4 3.4 9.9
Fourth Quarter 41.3 6.1 14.8
Fiscal 1998 $ 138.0 $ 15.6 11.3%
First Quarter $ 37.8 $ 3.9 10.3%
Second Quarter 41.4 5.7 13.8
Third Quarter 45.0 5.1 11.3
Fourth Quarter 56.7 9.1 16.0
Fiscal 1999 $ 180.9 $ 23.8 13.2%
First Quarter $ 52.3 $ 6.2 11.9%
Second Quarter 59.2 7.8 13.2
Third Quarter 59.1 7.2 12.2
Fourth Quarter 68.2 7.2 10.6
Fiscal 2000 $ 238.8 $ 28.4 11.9%
Operating Income – Paperboard SegmentWeighted
Boxboard Average Medium Average AverageNet Sales Operating Tons Boxboard Tons Medium Recovered
(Aggregate) Income Return Shipped Price Shipped Price Paper Cost(in millions) (in millions) On Sales (in thousands) (per ton) (in thousands) (per ton) (per ton)
First Quarter $ 142.2 $ 17.0 12.0% 252.6 $ 420 45.0 $ 330 $ 70
Second Quarter 144.9 19.9 13.7 246.8 420 45.6 347 68
Third Quarter 135.2 19.7 14.6 235.1 417 40.8 338 59
Fourth Quarter 133.1 15.8 11.9 231.0 414 43.9 318 58
Fiscal 1998 $ 555.4 $ 72.4 13.0% 965.5 $ 418 175.3 $ 332 $ 64
First Quarter $ 122.5 $ 13.0 10.6% 230.7 $ 403 45.2 $ 288 $ 53
Second Quarter 127.0 11.5 9.1 229.0 399 43.5 328 52
Third Quarter 134.5 16.2 12.0 249.4 398 45.3 340 58
Fourth Quarter 145.0 14.9 10.3 249.8 406 44.7 380 76
Fiscal 1999 $ 529.0 $ 55.6 10.5% 958.9 $ 401 178.7 $ 336 $ 60
First Quarter $ 144.3 $ 15.5 10.7% 250.4 $ 420 42.4 $ 386 $ 83
Second Quarter 154.7 14.7 9.5 257.1 426 44.7 403 91
Third Quarter 148.9 8.4 5.6 242.0 445 40.9 419 108
Fourth Quarter 140.6 9.0 6.4 228.7 449 42.2 407 88
Fiscal 2000 $ 588.5 $ 47.6 8.1% 978.2 $ 435 170.2 $ 403 $ 92
management’s discussion and analysis >>
20
00
A
nn
ua
l
Re
po
rt
29
Operating income attributable to this segment for fiscal 2000increased 19.3% to $28.4 million from $23.8 million for fiscal 1999.Operating margin for fiscal 2000 decreased to 11.9% from 13.2% infiscal 1999. The decrease in operating margin was primarily the resultof higher raw material costs.
Operating income attributable to this segment for fiscal 1999increased 52.6% to $23.8 million from $15.6 million for fiscal 1998.Operating margin for fiscal 1999 increased to 13.2% from 11.3% infiscal 1998. The increase in operating margin was primarily the resultof lower raw material costs.
Interest ExpenseInterest expense for fiscal 2000 increased to $35.5 million from $31.2million for fiscal 1999 and decreased to $31.2 million for fiscal 1999from $35.0 million for fiscal 1998. The increase for fiscal 2000 primarilyresulted from an increase in the average outstanding borrowings andhigher interest rates. The decrease in fiscal 1999 primarily resulted froma decrease in average outstanding borrowings and lower interest rates.
Provision for Income TaxesProvision for income taxes for fiscal 2000 decreased to $11.6 millionfrom $30.6 million for fiscal 1999. Provision for income taxes forfiscal 1999 decreased to $30.6 million from $32.6 million for fiscal1998. Excluding the effect of the $25.4 million non-cash write-offduring fiscal 2000 of the goodwill associated with the impairmentof assets at two facilities acquired in the Waldorf acquisition, whichis non-deductible for tax purposes, the Company’s effective tax rateincreased to 54.9% for fiscal 2000 compared to 43.5% for fiscal 1999and decreased to 43.5% for fiscal 1999 compared to 43.7% for fiscal1998. The increase in the effective tax rate in fiscal 2000 was primarilydue to higher non-tax deductible goodwill amortization as a percentageof pre-tax net income. The decrease in the effective tax rate in fiscal1999 primarily resulted from a decrease in our effective state tax rate.
Net (Loss) Income and Diluted (Loss) Earnings Per Common ShareNet loss for fiscal 2000 was $15.9 million compared to net income of$39.7 million for fiscal 1999. Net loss as a percentage of net sales was1.1% for fiscal 2000 compared to net income as a percentage of netsales of 3.0% for fiscal 1999. Diluted loss per share for fiscal 2000 was$0.46 compared to diluted earnings per share of $1.13 for fiscal 1999.
Net income for fiscal 1999 decreased 5.5% to $39.7 million from$42.0 million for fiscal 1998. Net income as a percentage of net salesdecreased to 3.0% for fiscal 1999 from 3.2% for fiscal 1998. Dilutedearnings per share for fiscal 1999 decreased to $1.13 from $1.20 forfiscal 1998.
Market Risk-Sensitive Instruments and Positions
We are exposed to market risk from changes in interest rates, foreignexchange rates and commodity prices. To mitigate these risks, we enterinto various hedging transactions. The sensitivity analyses presentedbelow do not consider the effect of possible adverse changes in theeconomy generally, nor do they consider additional actions manage-ment may take to mitigate its exposure to such changes.
Derivative InstrumentsWe enter into a variety of derivative transactions. Generally, wedesignate at inception that derivatives hedge risks associated withspecific assets, liabilities or future commitments and monitor eachderivative to determine if it remains an effective hedge. The effective-ness of the derivative as a hedge is based on a high correlation betweenchanges in its value and changes in value of the underlying hedged item.We include in operations amounts received or paid when the underlyingtransaction settles. We do not enter into or hold derivatives for tradingor speculative purposes.
We use interest rate cap agreements and interest rate swap agree-ments to manage synthetically the interest rate characteristics of aportion of our outstanding debt and to limit our exposure to risinginterest rates. Amounts to be received or paid as a result of interestrate cap agreements and interest rate swap agreements are accruedand recognized as an adjustment to interest expense related to thedesignated debt. The cost of purchasing interest rate caps is amortizedto interest expense ratably during the life of the agreement. Gains orlosses on terminations of interest rate swap agreements are deferred andamortized as an adjustment to interest expense of the related debt instru-ment over the remaining term of the original contract life of terminatedswap agreements. In the event of the early extinguishment of a designateddebt obligation, any realized or unrealized gain or loss from the swapwould be recognized in income at the time of the extinguishment.
We use forward contracts to limit our exposure to fluctuations inCanadian foreign currency rates with respect to our receivables denomi-nated in Canadian dollars. The forward contracts are settled monthlyand resulting gains or losses are recognized at the time of settlement.
We use commodity swap agreements to limit our exposure tofalling selling prices and rising raw material costs for a portion of ourrecycled corrugating medium and recycled fiber businesses. Amountsto be received or paid as a result of these swap agreements are recog-nized in the period in which the related sale is made.
Interest RateWe are exposed to changes in interest rates, primarily as a result of ourshort-term and long-term debt with both fixed and floating interest rates.We use interest rate agreements to effectively cap the LIBOR rate on
Management’s Discussion and Analysis
Ro
ck
-T
en
n
Co
mp
an
y
30
portions of the amount outstanding under our revolving credit facility.If market interest rates averaged 1.0% more than actual rates in 2000,our interest expense after considering the effects of interest rate swapand cap agreements would have increased, and income before taxeswould have decreased, by approximately $4.7 million. Comparatively,if market interest rates averaged 1.0% more than actual rates in fiscal1999, our interest expense, after considering the effects of interest rateswap and cap agreements, would have increased, and income beforetaxes would have decreased by approximately $3.0 million. Theseamounts are determined by considering the impact of the hypotheticalinterest rates on our borrowing costs and interest rate swap and capagreements. These analyses do not consider the effects of the reducedlevel of overall economic activity that could exist in such an environ-ment. As of September 30, 2000, we had one cap agreement, expiringOctober 7, 2000, and no swap agreements in place.
Foreign CurrencyWe are exposed to changes in foreign currency rates with respectto our foreign currency-denominated operating revenues and expenses.We use forward contracts to limit exposure to fluctuations in Canadianforeign currency rates, our largest exposure to foreign currency rates.For fiscal 2000, a uniform 10.0% strengthening in the value of thedollar relative to the currency in which our sales are denominatedwould have resulted in an increase in gross profit of $0.6 million forfiscal 2000. Comparatively, for fiscal 1999, a uniform 10.0% strength-ening in the value of the dollar relative to the currency in which oursales are denominated would have resulted in an increase in grossprofit of $0.4 million for fiscal 1999. This calculation assumes thateach exchange rate would change in the same direction relative tothe U.S. dollar.
In addition to the direct effect of changes in exchange rates on thedollar value of the resulting sales, changes in exchange rates also affectthe volume of sales or the foreign currency sales price as competitors’products become more or less attractive. Our sensitivity analysis of theeffects of changes in foreign currency exchange rates does not factor ina potential change in sales levels or local currency prices.
CommoditiesWe sell recycled medium to various customers. The principal raw mate-rial used in the production of medium is old corrugated containers, or“OCC.” Medium prices and OCC costs fluctuate widely due to changingmarket forces. As a result, we use swap agreements to limit our expo-sure to falling selling prices and rising raw material costs of a portionof our recycled medium and recycled fiber businesses. We estimate market risk as a hypothetical 10.0% decrease in selling prices or a10% increase in raw material costs. Based on 2000 medium sales prices,such a decrease would have resulted in lower sales of $2.9 million dur-ing fiscal 2000 including the effect of our swaps on medium prices.Based on 2000 OCC costs, such an increase would have resulted inhigher costs of purchases of $0.9 million during fiscal 2000.
In 1999, we estimated market risk as a hypothetical 10% increasein selling prices or a 10% decrease in raw material costs. Based on 1999medium sales prices, such an increase would have resulted in lower salesof $1.7 million during fiscal 1999 because of our swaps on mediumprices. Based on 1999 OCC costs, such a decrease would have resultedin higher costs of purchases of $0.7 million during fiscal 1999 becauseof our swaps on OCC costs.
We purchase and sell a variety of commodities that are not subjectto derivative commodity instruments, including OCC, paperboard andrecovered paper. Fluctuations in market prices of these commoditiescould have a material effect on our results of operations. Such fluctua-tions are not reflected in the results above.
Liquidity and Capital Resources
Working Capital and Capital ExpendituresWe have funded our working capital requirements and capital expendi-tures from net cash provided by operating activities, borrowings underterm notes and bank credit facilities and proceeds received in connec-tion with the issuance of industrial revenue bonds and debt and equitysecurities. During fiscal 2000, we replaced our revolving credit agreementwith a new five-year agreement that terminates in fiscal 2005, underwhich we have aggregate borrowing availability of $450.0 million. AtSeptember 30, 2000, we had $393.0 million outstanding under ourrevolving credit facility. Cash and cash equivalents, $5.4 million atSeptember 30, 2000, increased from $4.5 million at September 30, 1999.
management’s discussion and analysis >>
20
00
A
nn
ua
l
Re
po
rt
31
Net cash provided by operating activities for fiscal 2000 was $102.4million compared to $112.4 million for fiscal 1999. This decrease wasprimarily the result of decreased earnings before depreciation and amor-tization and a larger change in operating assets and liabilities duringfiscal 2000 than fiscal 1999. Net cash used for financing activities aggre-gated $0.1 million for fiscal 2000 and consisted primarily of purchasesof common stock and quarterly dividend payments, offset by additionalborrowings under our revolving credit facility. Net cash used for financingactivities aggregated $22.8 million for fiscal 1999 and consisted prima-rily of repayments of debt and quarterly dividend payments. Net cashused for investing activities was $101.3 million for fiscal 2000 com-pared to $91.2 million for fiscal 1999 and consisted primarily of capitalexpenditures in both years.
Net cash provided by operating activities for fiscal 1999 was$112.4 million compared to $125.7 million for fiscal 1998. Thisdecrease primarily resulted from a larger change in operating assetsand liabilities during fiscal 1999 than fiscal 1998. Net cash usedfor financing activities aggregated $22.8 million for fiscal 1999 andconsisted primarily of repayments of debt and quarterly dividendpayments. Net cash used for financing activities aggregated $44.7million for fiscal 1998 and consisted primarily of repayments of debtand quarterly dividend payments. Net cash used for investing activitieswas $91.2 million for fiscal 1999 compared to $78.4 million for fiscal1998 and consisted primarily of capital expenditures in both years.
Our capital expenditures aggregated $94.6 million for fiscal 2000.We expanded our operations through an ongoing capital improvementsprogram and management’s efforts to optimize the productive outputof our manufacturing facilities. In addition, we also redeployed capitalby closing certain manufacturing facilities and, in some cases, movingmanufacturing equipment to other locations. Our capital improvementsprogram during fiscal 2000 included investments in the following: a newgypsum facing paper machine in Lynchburg, Virginia; rebuilding of alarge uncoated machine by adding a new wet end to the mill in Otsego,Michigan; adding extrusion and thermoforming capacity to our Plasticsdivision; and building additional capacity and opening a new contractpacking facility in our Alliance division.
We currently estimate that our capital expenditures will aggregateapproximately $90.0 million in fiscal 2001, including our investmentin our Seven Hills joint venture. We intend to use these expendituresfor the purchase and upgrading of machinery and equipment and forbuilding expansions and improvements. We anticipate that we will beable to fund our capital expenditures, interest payments, stock repur-chases, dividends and working capital needs for the foreseeable futurefrom cash generated from operations, borrowings under our revolvingcredit facility, proceeds from the issuance of debt or equity securities orother additional long-term debt financing.
Joint VentureOn February 18, 2000, we formed a joint venture with LafargeCorporation to produce gypsum paperboard liner for Lafarge’sU.S. drywall manufacturing plants. The joint venture, Seven HillsPaperboard, LLC, owns and will operate a paperboard machinelocated at our Lynchburg, Virginia manufacturing site. We have con-tributed a portion of our existing Lynchburg assets to the venture,which will manufacture gypsum paperboard liner using Lafarge’s state-of-the-art proprietary processes. As of September 30, 2000,we have contributed cash of $7.1 million for purposes of rebuildingthe paperboard machine, and we anticipate contributing an additional$6.8 million to the venture over the next several quarters. Lafargeowns 51% and we own 49% of the joint venture.
Stock Repurchase ProgramDuring fiscal 2000, the Board of Directors amended our stock repur-chase plan to allow for the repurchase from time to time prior to July31, 2003 of up to 2.0 million shares of Class A common stock in openmarket transactions on the New York Stock Exchange or in privatetransactions. In addition, the Board authorized the repurchase fromtime to time of shares of Class B common stock in private transactions,including repurchases pursuant to certain first-offer rights containedin our Restated and Amended Articles of Incorporation, provided thatthe aggregate number of shares of Class A and Class B common stockpurchased after approval of this amended plan may not exceed 2.0million shares. During fiscal 2000, we repurchased 1.6 million sharesof Class A common stock and no Class B common stock under ouramended plan. Under previously authorized plans, we repurchased0.5 million, zero and 0.3 million shares of Class A common stockduring fiscal 2000, 1999 and 1998, respectively.
Year 2000
During 1999, we completed all readiness work towards the Year 2000issue. We have not experienced any material problems resulting fromYear 2000 issues, either with our internal computer systems or theproducts or services supplied by third parties.
Expenditures for Environmental Compliance
We are subject to various federal, state, local and foreign environmentallaws and regulations, including those regulating the discharge, storage,handling and disposal of a variety of substances. These laws and regu-lations include, among others, the Comprehensive EnvironmentalResponse, Compensation and Liability Act, which we refer to asCERCLA, the Clean Air Act (as amended in 1990), the Clean WaterAct, the Resource Conservation and Recovery Act (including amend-ments relating to underground tanks) and the Toxic Substances ControlAct. These environmental regulatory programs are primarily adminis-tered by the U.S. Environmental Protection Agency. In addition, somestates in which we operate have adopted equivalent or more stringentenvironmental laws and regulations or have enacted their own parallelenvironmental programs, which are enforced through various stateadministrative agencies.
We do not believe that future compliance with these environmentallaws and regulations will have a material adverse effect on our resultsof operations, financial condition or cash flows. However, environmentallaws and regulations are becoming increasingly stringent. Consequently,our compliance and remediation costs could increase materially. Inaddition, we cannot currently assess with certainty the impact that thefuture emissions standards and enforcement practices under the 1990amendments to the Clean Air Act will have on our operations or capitalexpenditure requirements. However, we believe that any such impact orcapital expenditures will not have a material adverse effect on our resultsof operations, financial condition or cash flows.
We estimate that we will spend $1.0 to $2.0 million for capitalexpenditures during fiscal year 2001 in connection with mattersrelating to environmental compliance.
In addition, we may choose to modify or replace the coal-firedboilers at two of our facilities in order to operate cost effectively whilecomplying with emissions regulations under the Clean Air Act. Weestimate these improvements will cost approximately $9.0 million.
We have been identified as a potentially responsible party, whichwe refer to as a PRP, at eight active “superfund” sites pursuant toCERCLA or comparable state statutes. No remediation costs or alloca-tions have been determined with respect to such sites other than coststhat were not material to us. Based upon currently available informa-tion and the opinions of our environmental compliance managers andgeneral counsel, although there can be no assurance, we believe thatany liability we may have at any site will not have a material adverseeffect on our results of operations, financial condition or cash flows.
On February 9, 1999, we received a letter from the MichiganDepartment of Environmental Quality, which we refer to as MDEQ,in which the MDEQ alleges that we are in violation of the MichiganNatural Resources and Environmental Protection Act, as well as thefacility’s wastewater discharge permit at one of our Michigan facilities.The letter alleges that we exceeded several numerical limitations forchemical parameters outlined in the wastewater permit and violatedother wastewater discharge criteria. The MDEQ further alleges thatwe are liable for contamination contained on the facility property aswell as for contributing contamination to the Kalamazoo River site.The letter requests that we commit, in the form of a binding agreement,to undertake the necessary and appropriate response activities andresponse actions to address contamination in both areas. We have agreedto enter into an administrative consent order pursuant to which improve-ments will be made to the facility’s wastewater treatment system andwe will pay a $75,000 fine for the alleged violations. We have alsoagreed to pay an additional $30,000 for past and future oversightcosts incurred by the State of Michigan. Once the final order has beenexecuted, we expect to pay this additional amount in three equal pay-ments over the next three years. The cost of making upgrades to theprocess waste system and wastewater treatment systems is estimatedto be approximately $1,000,000. Nothing contained in the order willconstitute an admission of liability or any factual finding, allegationor legal conclusion on our part. The order is expected to be completedduring the first quarter of fiscal 2001.
Ro
ck
-T
en
n
Co
mp
an
y
32
Management’s Discussion and Analysis
management’s discussion and analysis >>
20
00
A
nn
ua
l
Re
po
rt
33
New Accounting Standards
In June 1998, the Financial Accounting Standards Board issuedStatement of Financial Accounting Standards No. 133 (“SFAS 133”),“Accounting for Derivative Instruments and Hedging Activities.” Thisstatement requires the fair value of derivatives to be recorded as assetsor liabilities. Gains or losses resulting from changes in the fair valuesof derivatives would be accounted for currently in earnings or compre-hensive income depending on the purpose of the derivatives and whetherthey qualify for hedge accounting treatment. SFAS 133 is required tobe adopted in the first quarter of fiscal 2001. The adoption of SFAS133 will result in an insignificant charge, net of tax, from a cumulativeeffect of a change in accounting principle, and a $7.8 million decreasein shareholders’ equity in our financial statements for the quarter end-ing December 31, 2000.
In December 1999, the Securities and Exchange Commissionreleased Staff Accounting Bulletin No. 101 (“SAB 101”), “RevenueRecognition.” This bulletin provides guidance on the recognition,presentation and disclosure of revenue in financial statements. Thisbulletin will be effective in fiscal 2001. We do not anticipate that SAB101 will have a material impact on our consolidated financial statements.
Forward-Looking Statements
Statements herein regarding, among other things, estimated capitalexpenditures for fiscal 2001 and expected expenditures for environmentalcompliance, constitute forward-looking statements within the meaningof the Securities Act of 1933 and the Securities Exchange Act of 1934.Such statements are subject to certain risks and uncertainties that couldcause actual amounts to differ materially from those projected. Withrespect to these forward-looking statements, management has madeassumptions regarding, among other things, the amount and timingof expected capital expenditures, the estimated cost of compliance withenvironmental laws, the expected resolution of various pending envi-ronmental matters and competitive conditions in our businesses andgeneral economic conditions. These forward-looking statements aresubject to certain risks including, among others, that the amount ofcapital expenditures has been underestimated and that the impact onour results of those capital expenditures has been overestimated; thecost of compliance with environmental laws has been underestimated;and expected outcomes of various pending environmental matters areinaccurate. In addition, our performance in future periods is subject toother risks including, among others, decreases in demand for our prod-ucts, increases in raw material costs, fluctuations in selling prices andadverse changes in general market and industry conditions. We believethese estimates are reasonable; however, undue reliance should not beplaced on such estimates, which are based on current expectations.
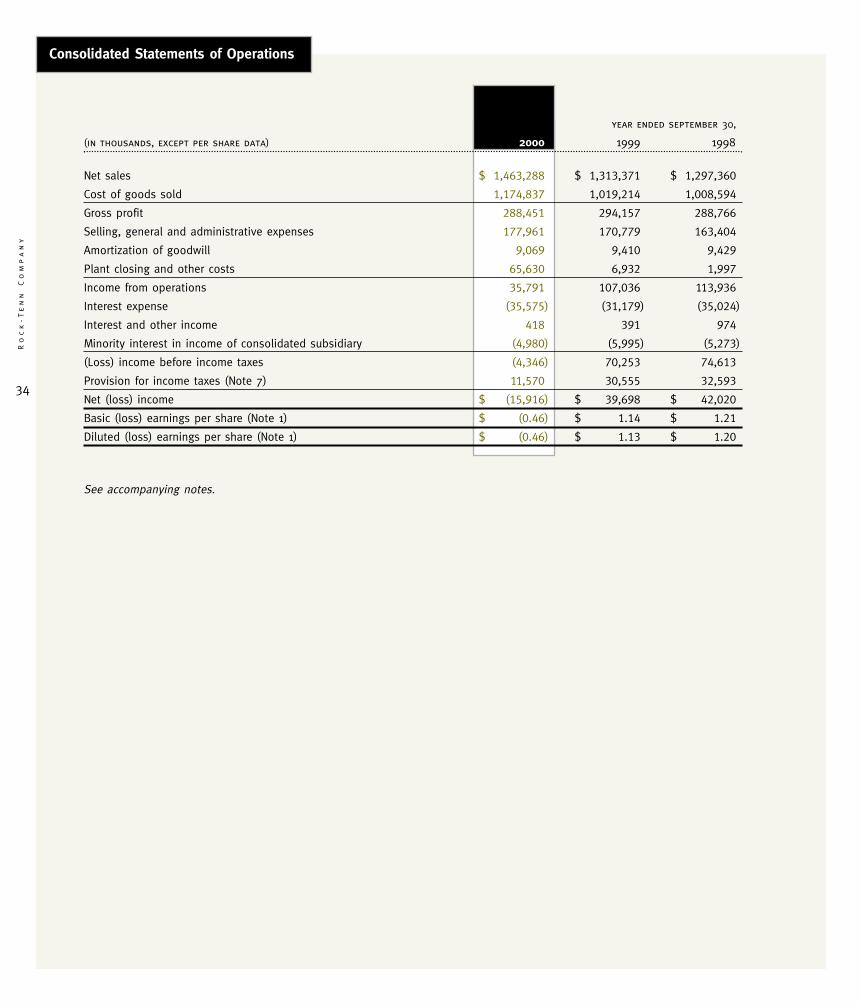
34
Ro
ck
-T
en
n
Co
mp
an
y
year ended september 30,
(in thousands, except per share data) 2000 1999 1998
Net sales $ 1,463,288 $ 1,313,371 $ 1,297,360
Cost of goods sold 1,174,837 1,019,214 1,008,594
Gross profit 288,451 294,157 288,766
Selling, general and administrative expenses 177,961 170,779 163,404
Amortization of goodwill 9,069 9,410 9,429
Plant closing and other costs 65,630 6,932 1,997
Income from operations 35,791 107,036 113,936
Interest expense (35,575) (31,179) (35,024)
Interest and other income 418 391 974
Minority interest in income of consolidated subsidiary (4,980) (5,995) (5,273)
(Loss) income before income taxes (4,346) 70,253 74,613
Provision for income taxes (Note 7) 11,570 30,555 32,593
Net (loss) income $ (15,916) $ 39,698 $ 42,020
Basic (loss) earnings per share (Note 1) $ (0.46) $ 1.14 $ 1.21
Diluted (loss) earnings per share (Note 1) $ (0.46) $ 1.13 $ 1.20
See accompanying notes.
Consolidated Statements of Operations
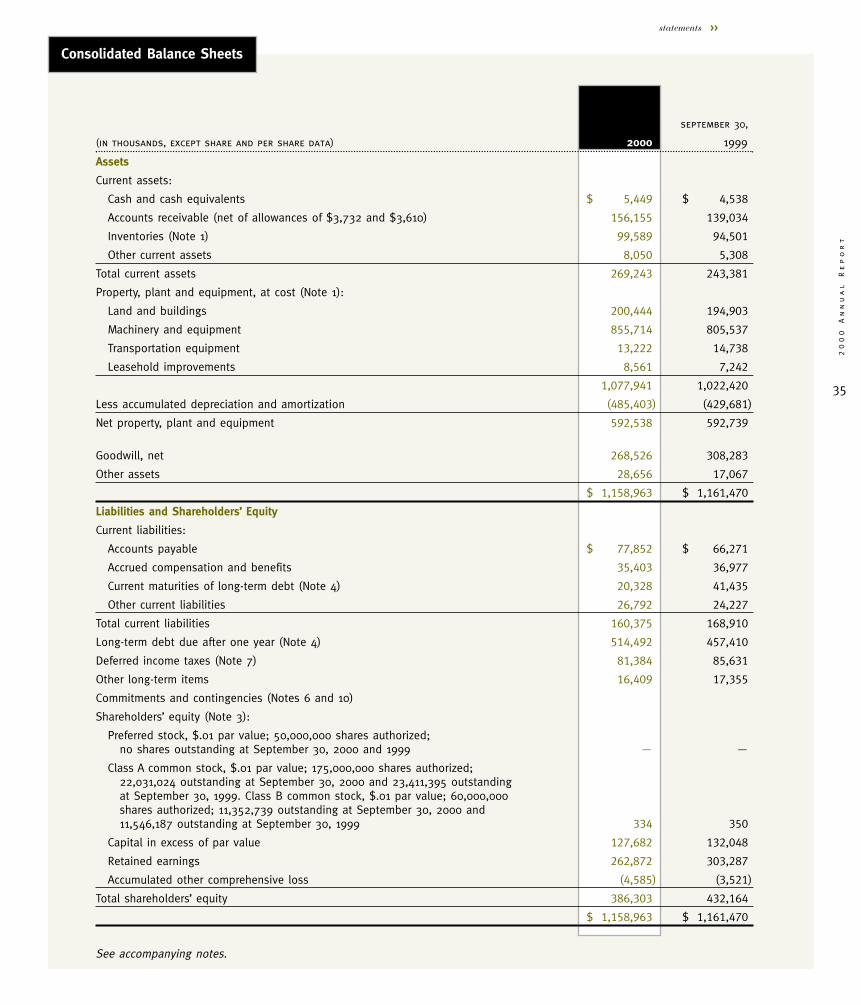
35
20
00
A
nn
ua
l
Re
po
rt
statements >>
Consolidated Balance Sheets
september 30,
(in thousands, except share and per share data) 2000 1999
Assets
Current assets:
Cash and cash equivalents $ 5,449 $ 4,538
Accounts receivable (net of allowances of $3,732 and $3,610) 156,155 139,034
Inventories (Note 1) 99,589 94,501
Other current assets 8,050 5,308
Total current assets 269,243 243,381
Property, plant and equipment, at cost (Note 1):
Land and buildings 200,444 194,903
Machinery and equipment 855,714 805,537
Transportation equipment 13,222 14,738
Leasehold improvements 8,561 7,242
1,077,941 1,022,420
Less accumulated depreciation and amortization (485,403) (429,681)
Net property, plant and equipment 592,538 592,739
Goodwill, net 268,526 308,283
Other assets 28,656 17,067
$ 1,158,963 $ 1,161,470
Liabilities and Shareholders’ Equity
Current liabilities:
Accounts payable $ 77,852 $ 66,271
Accrued compensation and benefits 35,403 36,977
Current maturities of long-term debt (Note 4) 20,328 41,435
Other current liabilities 26,792 24,227
Total current liabilities 160,375 168,910
Long-term debt due after one year (Note 4) 514,492 457,410
Deferred income taxes (Note 7) 81,384 85,631
Other long-term items 16,409 17,355
Commitments and contingencies (Notes 6 and 10)
Shareholders’ equity (Note 3):
Preferred stock, $.01 par value; 50,000,000 shares authorized; no shares outstanding at September 30, 2000 and 1999 — —
Class A common stock, $.01 par value; 175,000,000 shares authorized; 22,031,024 outstanding at September 30, 2000 and 23,411,395 outstanding at September 30, 1999. Class B common stock, $.01 par value; 60,000,000 shares authorized; 11,352,739 outstanding at September 30, 2000 and 11,546,187 outstanding at September 30, 1999 334 350
Capital in excess of par value 127,682 132,048
Retained earnings 262,872 303,287
Accumulated other comprehensive loss (4,585) (3,521)
Total shareholders’ equity 386,303 432,164
$ 1,158,963 $ 1,161,470
See accompanying notes.
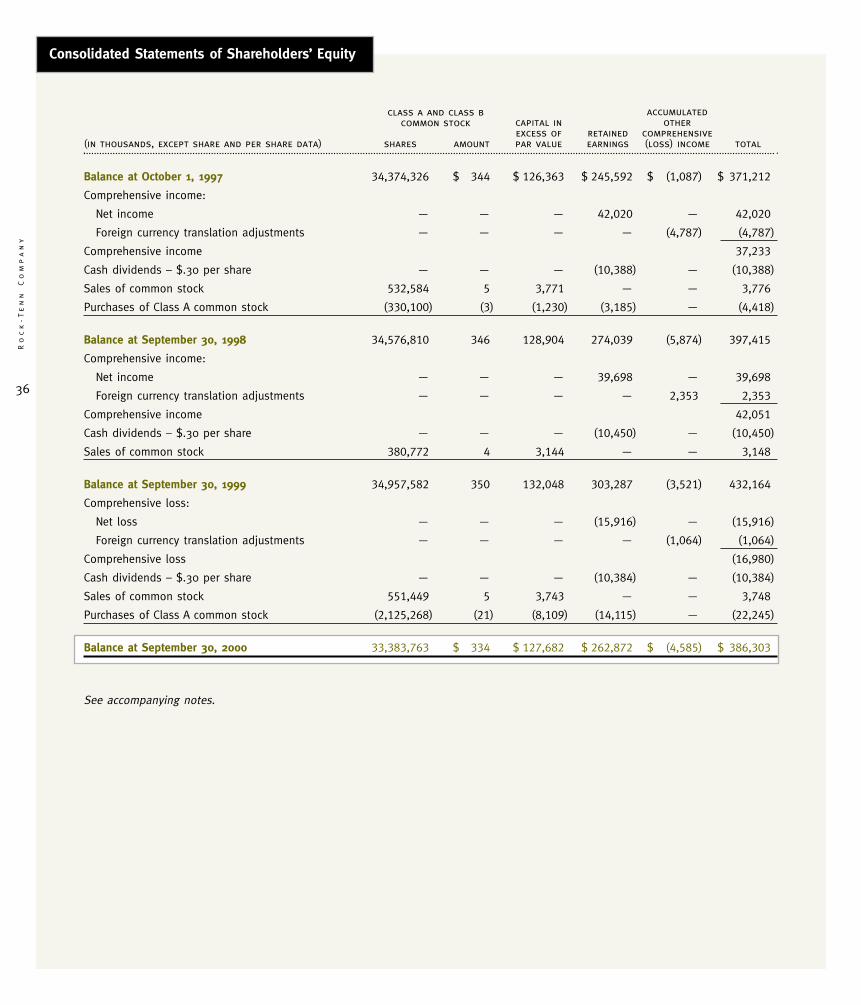
36
Ro
ck
-T
en
n
Co
mp
an
y
Consolidated Statements of Shareholders’ Equity
class a and class bcommon stock
accumulatedcapital in otherexcess of retained comprehensive
(in thousands, except share and per share data) shares amount par value earnings (loss) income total
Balance at October 1, 1997 34,374,326 $ 344 $ 126,363 $ 245,592 $ (1,087) $ 371,212
Comprehensive income:
Net income — — — 42,020 — 42,020
Foreign currency translation adjustments — — — — (4,787) (4,787)
Comprehensive income 37,233
Cash dividends – $.30 per share — — — (10,388) — (10,388)
Sales of common stock 532,584 5 3,771 — — 3,776
Purchases of Class A common stock (330,100) (3) (1,230) (3,185) — (4,418)
Balance at September 30, 1998 34,576,810 346 128,904 274,039 (5,874) 397,415
Comprehensive income:
Net income — — — 39,698 — 39,698
Foreign currency translation adjustments — — — — 2,353 2,353
Comprehensive income 42,051
Cash dividends – $.30 per share — — — (10,450) — (10,450)
Sales of common stock 380,772 4 3,144 — — 3,148
Balance at September 30, 1999 34,957,582 350 132,048 303,287 (3,521) 432,164
Comprehensive loss:
Net loss — — — (15,916) — (15,916)
Foreign currency translation adjustments — — — — (1,064) (1,064)
Comprehensive loss (16,980)
Cash dividends – $.30 per share — — — (10,384) — (10,384)
Sales of common stock 551,449 5 3,743 — — 3,748
Purchases of Class A common stock (2,125,268) (21) (8,109) (14,115) — (22,245)
Balance at September 30, 2000 33,383,763 $ 334 $ 127,682 $ 262,872 $ (4,585) $ 386,303
See accompanying notes.
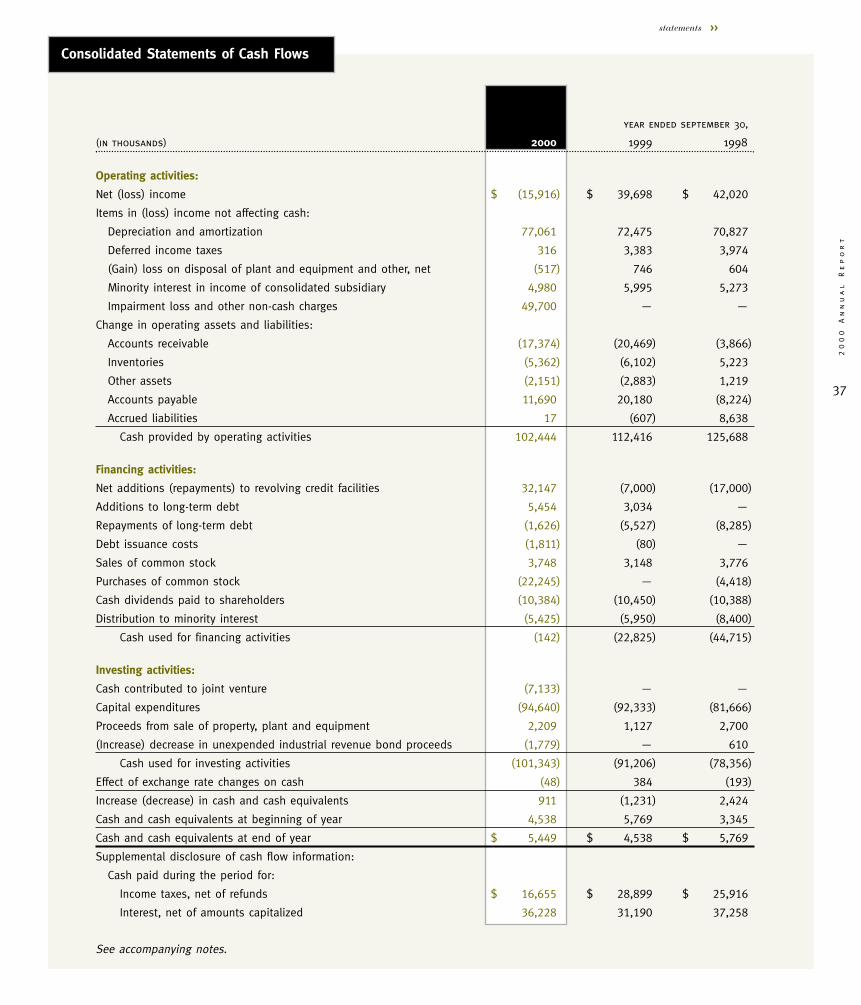
37
20
00
A
nn
ua
l
Re
po
rt
statements >>
Consolidated Statements of Cash Flows
year ended september 30,
(in thousands) 2000 1999 1998
Operating activities:
Net (loss) income $ (15,916) $ 39,698 $ 42,020
Items in (loss) income not affecting cash:
Depreciation and amortization 77,061 72,475 70,827
Deferred income taxes 316 3,383 3,974
(Gain) loss on disposal of plant and equipment and other, net (517) 746 604
Minority interest in income of consolidated subsidiary 4,980 5,995 5,273
Impairment loss and other non-cash charges 49,700 — —
Change in operating assets and liabilities:
Accounts receivable (17,374) (20,469) (3,866)
Inventories (5,362) (6,102) 5,223
Other assets (2,151) (2,883) 1,219
Accounts payable 11,690 20,180 (8,224)
Accrued liabilities 17 (607) 8,638
Cash provided by operating activities 102,444 112,416 125,688
Financing activities:
Net additions (repayments) to revolving credit facilities 32,147 (7,000) (17,000)
Additions to long-term debt 5,454 3,034 —
Repayments of long-term debt (1,626) (5,527) (8,285)
Debt issuance costs (1,811) (80) —
Sales of common stock 3,748 3,148 3,776
Purchases of common stock (22,245) — (4,418)
Cash dividends paid to shareholders (10,384) (10,450) (10,388)
Distribution to minority interest (5,425) (5,950) (8,400)
Cash used for financing activities (142) (22,825) (44,715)
Investing activities:
Cash contributed to joint venture (7,133) — —
Capital expenditures (94,640) (92,333) (81,666)
Proceeds from sale of property, plant and equipment 2,209 1,127 2,700
(Increase) decrease in unexpended industrial revenue bond proceeds (1,779) — 610
Cash used for investing activities (101,343) (91,206) (78,356)
Effect of exchange rate changes on cash (48) 384 (193)
Increase (decrease) in cash and cash equivalents 911 (1,231) 2,424
Cash and cash equivalents at beginning of year 4,538 5,769 3,345
Cash and cash equivalents at end of year $ 5,449 $ 4,538 $ 5,769
Supplemental disclosure of cash flow information:
Cash paid during the period for:
Income taxes, net of refunds $ 16,655 $ 28,899 $ 25,916
Interest, net of amounts capitalized 36,228 31,190 37,258
See accompanying notes.
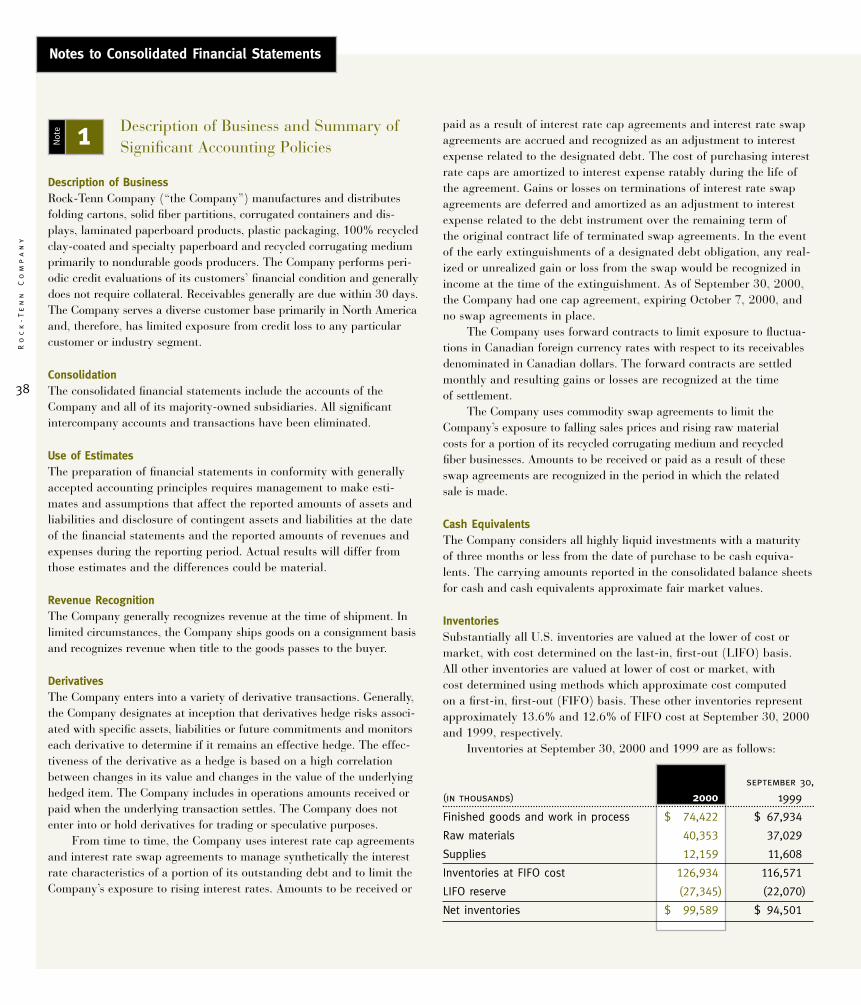
38
Ro
ck
-T
en
n
Co
mp
an
y
Notes to Consolidated Financial Statements
Description of Business and Summary ofSignificant Accounting Policies
Description of BusinessRock-Tenn Company (“the Company”) manufactures and distributesfolding cartons, solid fiber partitions, corrugated containers and dis-plays, laminated paperboard products, plastic packaging, 100% recycledclay-coated and specialty paperboard and recycled corrugating mediumprimarily to nondurable goods producers. The Company performs peri-odic credit evaluations of its customers’ financial condition and generallydoes not require collateral. Receivables generally are due within 30 days.The Company serves a diverse customer base primarily in North Americaand, therefore, has limited exposure from credit loss to any particularcustomer or industry segment.
ConsolidationThe consolidated financial statements include the accounts of theCompany and all of its majority-owned subsidiaries. All significantintercompany accounts and transactions have been eliminated.
Use of EstimatesThe preparation of financial statements in conformity with generallyaccepted accounting principles requires management to make esti-mates and assumptions that affect the reported amounts of assets andliabilities and disclosure of contingent assets and liabilities at the dateof the financial statements and the reported amounts of revenues andexpenses during the reporting period. Actual results will differ fromthose estimates and the differences could be material.
Revenue RecognitionThe Company generally recognizes revenue at the time of shipment. Inlimited circumstances, the Company ships goods on a consignment basisand recognizes revenue when title to the goods passes to the buyer.
DerivativesThe Company enters into a variety of derivative transactions. Generally,the Company designates at inception that derivatives hedge risks associ-ated with specific assets, liabilities or future commitments and monitorseach derivative to determine if it remains an effective hedge. The effec-tiveness of the derivative as a hedge is based on a high correlationbetween changes in its value and changes in the value of the underlyinghedged item. The Company includes in operations amounts received orpaid when the underlying transaction settles. The Company does notenter into or hold derivatives for trading or speculative purposes.
From time to time, the Company uses interest rate cap agreementsand interest rate swap agreements to manage synthetically the interestrate characteristics of a portion of its outstanding debt and to limit theCompany’s exposure to rising interest rates. Amounts to be received or
paid as a result of interest rate cap agreements and interest rate swapagreements are accrued and recognized as an adjustment to interestexpense related to the designated debt. The cost of purchasing interestrate caps are amortized to interest expense ratably during the life ofthe agreement. Gains or losses on terminations of interest rate swapagreements are deferred and amortized as an adjustment to interestexpense related to the debt instrument over the remaining term ofthe original contract life of terminated swap agreements. In the eventof the early extinguishments of a designated debt obligation, any real-ized or unrealized gain or loss from the swap would be recognized inincome at the time of the extinguishment. As of September 30, 2000,the Company had one cap agreement, expiring October 7, 2000, andno swap agreements in place.
The Company uses forward contracts to limit exposure to fluctua-tions in Canadian foreign currency rates with respect to its receivablesdenominated in Canadian dollars. The forward contracts are settledmonthly and resulting gains or losses are recognized at the time of settlement.
The Company uses commodity swap agreements to limit theCompany’s exposure to falling sales prices and rising raw materialcosts for a portion of its recycled corrugating medium and recycledfiber businesses. Amounts to be received or paid as a result of theseswap agreements are recognized in the period in which the related sale is made.
Cash EquivalentsThe Company considers all highly liquid investments with a maturityof three months or less from the date of purchase to be cash equiva-lents. The carrying amounts reported in the consolidated balance sheetsfor cash and cash equivalents approximate fair market values.
InventoriesSubstantially all U.S. inventories are valued at the lower of cost ormarket, with cost determined on the last-in, first-out (LIFO) basis.All other inventories are valued at lower of cost or market, withcost determined using methods which approximate cost computed on a first-in, first-out (FIFO) basis. These other inventories representapproximately 13.6% and 12.6% of FIFO cost at September 30, 2000and 1999, respectively.
Inventories at September 30, 2000 and 1999 are as follows:
september 30,
(in thousands) 2000 1999
Finished goods and work in process $ 74,422 $ 67,934
Raw materials 40,353 37,029
Supplies 12,159 11,608
Inventories at FIFO cost 126,934 116,571
LIFO reserve (27,345) (22,070)
Net inventories $ 99,589 $ 94,501
1Not
e
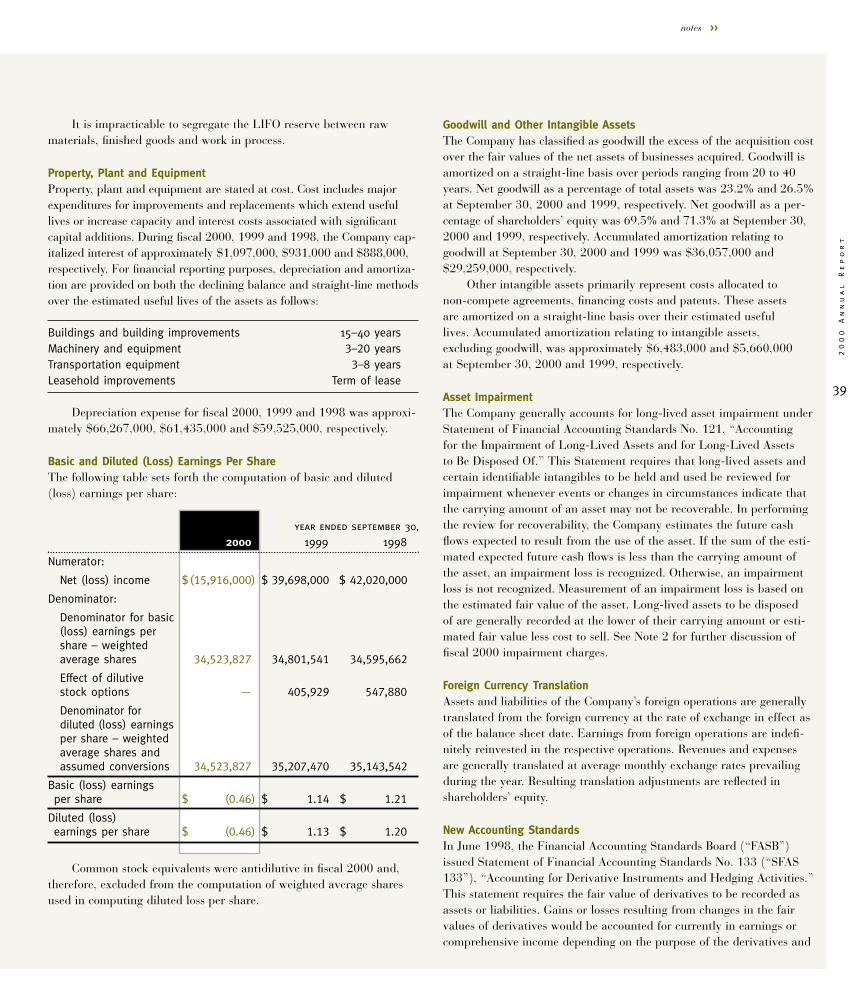
39
20
00
A
nn
ua
l
Re
po
rt
notes >>
It is impracticable to segregate the LIFO reserve between rawmaterials, finished goods and work in process.
Property, Plant and EquipmentProperty, plant and equipment are stated at cost. Cost includes majorexpenditures for improvements and replacements which extend usefullives or increase capacity and interest costs associated with significantcapital additions. During fiscal 2000, 1999 and 1998, the Company cap-italized interest of approximately $1,097,000, $931,000 and $888,000,respectively. For financial reporting purposes, depreciation and amortiza-tion are provided on both the declining balance and straight-line methodsover the estimated useful lives of the assets as follows:
Buildings and building improvements 15–40 yearsMachinery and equipment 3–20 yearsTransportation equipment 3–8 yearsLeasehold improvements Term of lease
Depreciation expense for fiscal 2000, 1999 and 1998 was approxi-mately $66,267,000, $61,435,000 and $59,525,000, respectively.
Basic and Diluted (Loss) Earnings Per Share The following table sets forth the computation of basic and diluted(loss) earnings per share:
year ended september 30,
2000 1999 1998
Numerator:
Net (loss) income $(15,916,000) $ 39,698,000 $ 42,020,000
Denominator:
Denominator for basic (loss) earnings per share – weighted average shares 34,523,827 34,801,541 34,595,662
Effect of dilutive stock options — 405,929 547,880
Denominator fordiluted (loss) earnings per share – weighted average shares and assumed conversions 34,523,827 35,207,470 35,143,542
Basic (loss) earnings per share $ (0.46) $ 1.14 $ 1.21
Diluted (loss) earnings per share $ (0.46) $ 1.13 $ 1.20
Common stock equivalents were antidilutive in fiscal 2000 and,therefore, excluded from the computation of weighted average sharesused in computing diluted loss per share.
Goodwill and Other Intangible AssetsThe Company has classified as goodwill the excess of the acquisition costover the fair values of the net assets of businesses acquired. Goodwill isamortized on a straight-line basis over periods ranging from 20 to 40years. Net goodwill as a percentage of total assets was 23.2% and 26.5%at September 30, 2000 and 1999, respectively. Net goodwill as a per-centage of shareholders’ equity was 69.5% and 71.3% at September 30,2000 and 1999, respectively. Accumulated amortization relating togoodwill at September 30, 2000 and 1999 was $36,057,000 and$29,259,000, respectively.
Other intangible assets primarily represent costs allocated to non-compete agreements, financing costs and patents. These assetsare amortized on a straight-line basis over their estimated usefullives. Accumulated amortization relating to intangible assets,excluding goodwill, was approximately $6,483,000 and $5,660,000at September 30, 2000 and 1999, respectively.
Asset ImpairmentThe Company generally accounts for long-lived asset impairment underStatement of Financial Accounting Standards No. 121, “Accountingfor the Impairment of Long-Lived Assets and for Long-Lived Assetsto Be Disposed Of.” This Statement requires that long-lived assets andcertain identifiable intangibles to be held and used be reviewed forimpairment whenever events or changes in circumstances indicate thatthe carrying amount of an asset may not be recoverable. In performingthe review for recoverability, the Company estimates the future cashflows expected to result from the use of the asset. If the sum of the esti-mated expected future cash flows is less than the carrying amount ofthe asset, an impairment loss is recognized. Otherwise, an impairmentloss is not recognized. Measurement of an impairment loss is based onthe estimated fair value of the asset. Long-lived assets to be disposedof are generally recorded at the lower of their carrying amount or esti-mated fair value less cost to sell. See Note 2 for further discussion offiscal 2000 impairment charges.
Foreign Currency TranslationAssets and liabilities of the Company’s foreign operations are generallytranslated from the foreign currency at the rate of exchange in effect asof the balance sheet date. Earnings from foreign operations are indefi-nitely reinvested in the respective operations. Revenues and expensesare generally translated at average monthly exchange rates prevailingduring the year. Resulting translation adjustments are reflected inshareholders’ equity.
New Accounting StandardsIn June 1998, the Financial Accounting Standards Board (“FASB”)issued Statement of Financial Accounting Standards No. 133 (“SFAS133”), “Accounting for Derivative Instruments and Hedging Activities.”This statement requires the fair value of derivatives to be recorded asassets or liabilities. Gains or losses resulting from changes in the fairvalues of derivatives would be accounted for currently in earnings orcomprehensive income depending on the purpose of the derivatives and
40
Ro
ck
-T
en
n
Co
mp
an
y
Notes to Consolidated Financial Statements
whether they qualify for hedge accounting treatment. SFAS 133 isrequired to be adopted in the first quarter of fiscal 2001. The adoptionof SFAS 133 will result in an insignificant charge, net of tax, from acumulative effect of a change in accounting principle, and a$7,814,000 decrease in shareholders’ equity in the Company’s financialstatements for the quarter ending December 31, 2000.
In December 1999, the Securities and Exchange Commissionreleased Staff Accounting Bulletin No. 101 (“SAB 101”), “RevenueRecognition.” This bulletin provides guidance on the recognition, pres-entation and disclosure of revenue in financial statements. This bulletinwill be effective in fiscal 2001. The Company does not anticipate thatSAB 101 will have a material impact on the Company’s consolidatedfinancial statements.
In July 2000, the FASB issued Emerging Issues Task ForceIssue 00-10 (“EITF 00-10”), “Accounting for Shipping and HandlingCosts.” This issue provides guidance regarding how shipping and han-dling costs incurred by the seller and billed to a customer should betreated. EITF 00-10 concludes that all amounts billed to a customerin a sales transaction related to shipping and handling should be clas-sified as revenue, and the costs incurred by the seller for shipping andhandling should be classified as cost of goods sold. Prior year financialstatements have been reclassified to conform to the requirements ofEITF 00-10.
ReclassificationsCertain reclassifications have been made to prior year amounts to con-form with the current year presentation.
Joint Venture and Other Matters
On February 18, 2000, the Company formed a joint ven-ture with Lafarge Corporation to produce gypsum paperboard liner forLafarge’s U.S. drywall manufacturing plants. The joint venture, SevenHills Paperboard, LLC, owns and will operate a paperboard machinelocated at the Company’s Lynchburg, Virginia manufacturing site. TheCompany has contributed a portion of its existing Lynchburg assets tothe venture, which will manufacture gypsum paperboard liner usingLafarge’s state-of-the-art proprietary processes. As of September 30,2000 the Company has contributed cash of $7,133,000 for purposesof rebuilding the paperboard machine and anticipates contributingan additional $6,767,000 million to the venture over the next severalquarters. Lafarge owns 51 percent and the Company owns 49 percentof the joint venture.
During fiscal 2000, the Company incurred plant closing and othercosts related to announced facility closings. The cost of employee termi-nations is generally accrued at the time of notification to the employees.Certain other costs, such as moving and relocation costs, are expensed
as incurred. Included in these plant closing costs are the closing of alaminated paperboard products plant in Lynchburg, Virginia and fold-ing carton plants in Chicago, Illinois, Norcross, Georgia and Madison,Wisconsin. The closures resulted in the termination of approximately550 employees. In connection with these and certain other plant clos-ings, the Company incurred charges of $61,130,000 during fiscal 2000,which consisted mainly of asset impairment, severance, equipment relo-cation, lease write-downs and other related expenses, including businessinterruption and other inefficiencies. Of the $61,130,000, $46,037,000was asset impairment charges related to the determination that mate-rial diminution in the value of assets had occurred at the Company’stwo folding carton plants that use web offset technology and at theother closed facilities. This includes $25.4 million of goodwill whichis not deductible for tax purposes. As a result of the asset impairmentand goodwill charges, depreciation and amortization expense in fiscalyear 2001 will be lower by $3,941,000 and $636,000, respectively.Payments of $12,593,000 were made in fiscal 2000, leaving a remain-ing liability of $2,500,000 at September 30, 2000. Facilities closedduring fiscal 2000 had combined revenues and operating losses of$72,037,000 and $5,587,000, respectively, in fiscal 2000, $98,314,000and $5,814,000, respectively, in fiscal 1999 and $119,746,000 and$4,801,000, respectively, in fiscal 1998. The Company has consolidatedthe operations of these closed plants into other existing facilities.
During fiscal 2000, the Company decided to remove certainequipment from service primarily in its laminated paperboard prod-ucts division. As a result of this decision, the Company incurredimpairment charges of $4,622,000 related to this equipment.
During fiscal 1999, the Company closed a folding carton plant inTaylorsville, North Carolina, a laminated paperboard products operationin Otsego, Michigan and an uncoated papermill serving its coverboardconverting operations in Jersey City, New Jersey. The closures resultedin the termination of approximately 280 employees. In connection withthese closings, the Company incurred charges of $6,357,000 duringfiscal 1999, which consisted mainly of severance, equipment relocation,expected losses on the disposition of the facility and related expenses.The Company made payments of $310,000 and $4,134,000 in fiscal2000 and 1999, respectively, incurred losses of $186,000 and $764,000in connection with the disposal of inventory and other assets during fis-cal 2000 and 1999, respectively, made an adjustment of $122,000 toreduce the liability during fiscal 2000 and reduced the carrying value ofthe Jersey City facility by $1,000,000 during fiscal 1999, leaving a nom-inal remaining liability at September 30, 2000. Facilities closed duringfiscal 1999 had combined revenues and operating losses of $16,585,000and $1,501,000, respectively, in fiscal 1999 and $63,323,000 and$745,000, respectively, in fiscal 1998.
During fiscal 1998, the Company began implementing certain costreduction initiatives designed to reduce overhead and production costsand improve operating efficiency. In connection with these cost reduction
2Not
e
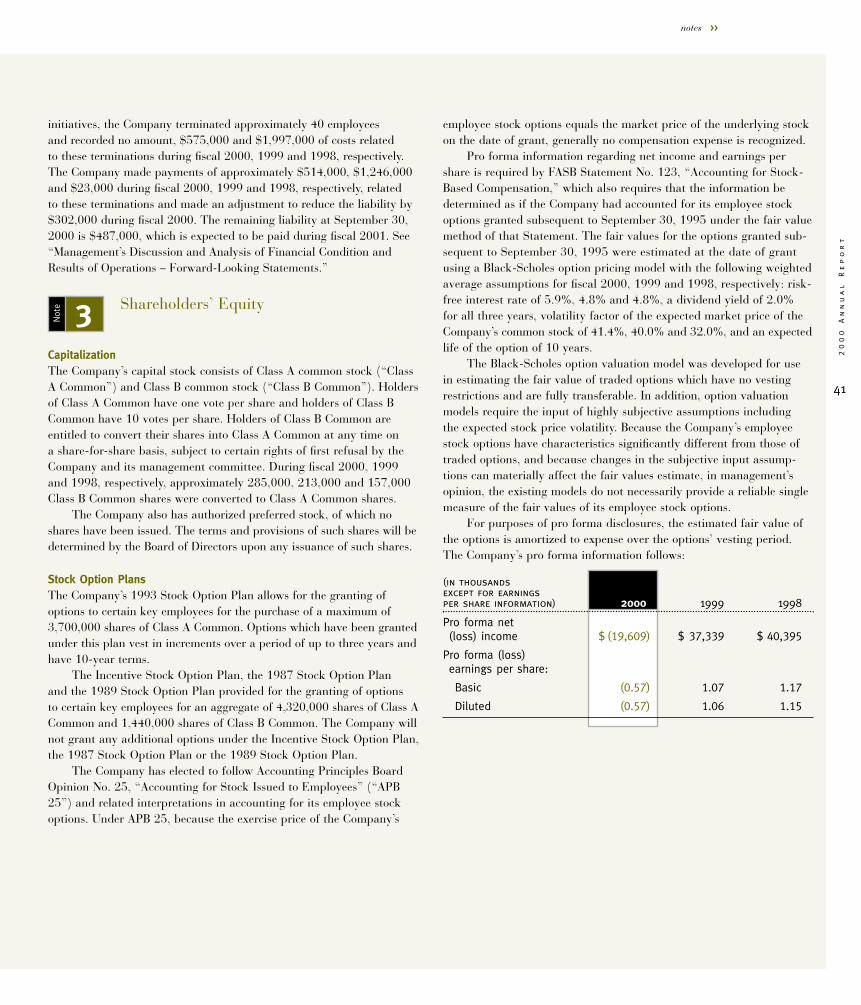
41
20
00
A
nn
ua
l
Re
po
rt
notes >>
initiatives, the Company terminated approximately 40 employeesand recorded no amount, $575,000 and $1,997,000 of costs relatedto these terminations during fiscal 2000, 1999 and 1998, respectively.The Company made payments of approximately $514,000, $1,246,000and $23,000 during fiscal 2000, 1999 and 1998, respectively, relatedto these terminations and made an adjustment to reduce the liability by$302,000 during fiscal 2000. The remaining liability at September 30,2000 is $487,000, which is expected to be paid during fiscal 2001. See“Management’s Discussion and Analysis of Financial Condition andResults of Operations – Forward-Looking Statements.”
Shareholders’ Equity
CapitalizationThe Company’s capital stock consists of Class A common stock (“ClassA Common”) and Class B common stock (“Class B Common”). Holdersof Class A Common have one vote per share and holders of Class BCommon have 10 votes per share. Holders of Class B Common areentitled to convert their shares into Class A Common at any time ona share-for-share basis, subject to certain rights of first refusal by theCompany and its management committee. During fiscal 2000, 1999and 1998, respectively, approximately 285,000, 213,000 and 157,000Class B Common shares were converted to Class A Common shares.
The Company also has authorized preferred stock, of which noshares have been issued. The terms and provisions of such shares will bedetermined by the Board of Directors upon any issuance of such shares.
Stock Option PlansThe Company’s 1993 Stock Option Plan allows for the granting ofoptions to certain key employees for the purchase of a maximum of3,700,000 shares of Class A Common. Options which have been grantedunder this plan vest in increments over a period of up to three years andhave 10-year terms.
The Incentive Stock Option Plan, the 1987 Stock Option Planand the 1989 Stock Option Plan provided for the granting of optionsto certain key employees for an aggregate of 4,320,000 shares of Class ACommon and 1,440,000 shares of Class B Common. The Company willnot grant any additional options under the Incentive Stock Option Plan,the 1987 Stock Option Plan or the 1989 Stock Option Plan.
The Company has elected to follow Accounting Principles BoardOpinion No. 25, “Accounting for Stock Issued to Employees” (“APB25”) and related interpretations in accounting for its employee stockoptions. Under APB 25, because the exercise price of the Company’s
employee stock options equals the market price of the underlying stockon the date of grant, generally no compensation expense is recognized.
Pro forma information regarding net income and earnings pershare is required by FASB Statement No. 123, “Accounting for Stock-Based Compensation,” which also requires that the information bedetermined as if the Company had accounted for its employee stockoptions granted subsequent to September 30, 1995 under the fair valuemethod of that Statement. The fair values for the options granted sub-sequent to September 30, 1995 were estimated at the date of grantusing a Black-Scholes option pricing model with the following weightedaverage assumptions for fiscal 2000, 1999 and 1998, respectively: risk-free interest rate of 5.9%, 4.8% and 4.8%, a dividend yield of 2.0%for all three years, volatility factor of the expected market price of theCompany’s common stock of 41.4%, 40.0% and 32.0%, and an expectedlife of the option of 10 years.
The Black-Scholes option valuation model was developed for usein estimating the fair value of traded options which have no vestingrestrictions and are fully transferable. In addition, option valuationmodels require the input of highly subjective assumptions includingthe expected stock price volatility. Because the Company’s employeestock options have characteristics significantly different from those oftraded options, and because changes in the subjective input assump-tions can materially affect the fair values estimate, in management’sopinion, the existing models do not necessarily provide a reliable singlemeasure of the fair values of its employee stock options.
For purposes of pro forma disclosures, the estimated fair value ofthe options is amortized to expense over the options’ vesting period.The Company’s pro forma information follows:
(in thousands except for earnings per share information) 2000 1999 1998
Pro forma net (loss) income $ (19,609) $ 37,339 $ 40,395
Pro forma (loss) earnings per share:
Basic (0.57) 1.07 1.17
Diluted (0.57) 1.06 1.15
3Not
e
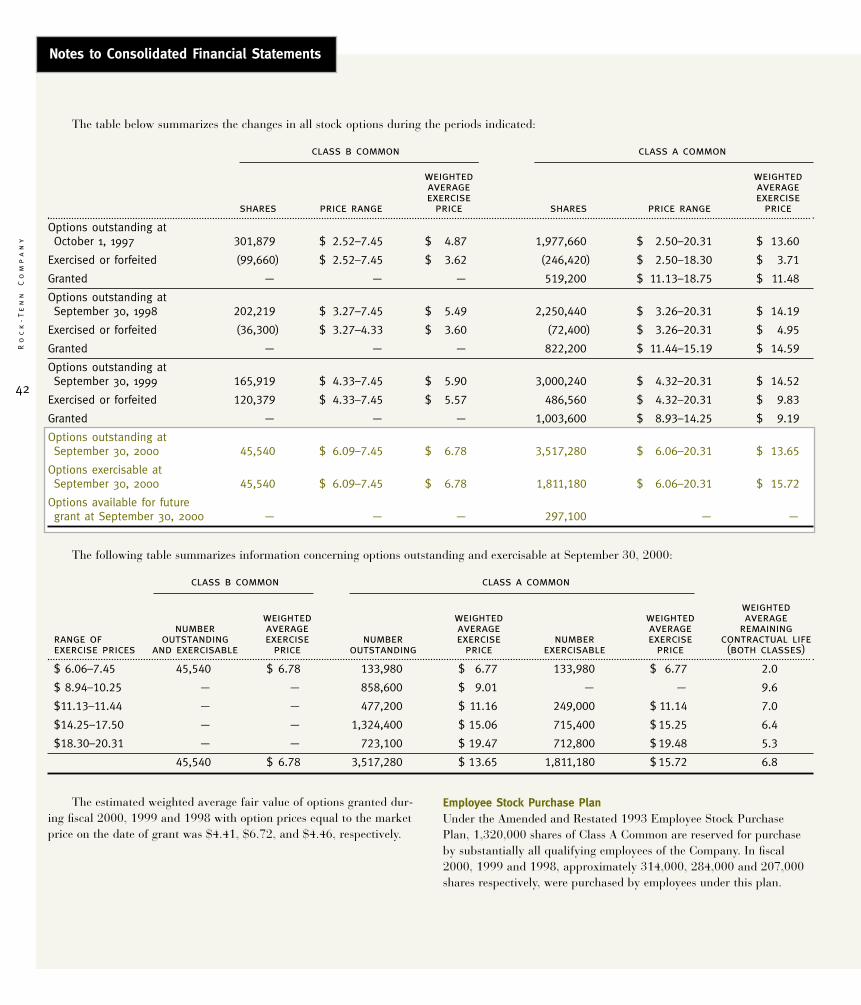
42
Ro
ck
-T
en
n
Co
mp
an
y
Notes to Consolidated Financial Statements
The table below summarizes the changes in all stock options during the periods indicated:
class b common class a common
weighted weightedaverage averageexercise exercise
shares price range price shares price range price
Options outstanding at October 1, 1997 301,879 $ 2.52–7.45 $ 4.87 1,977,660 $ 2.50–20.31 $ 13.60
Exercised or forfeited (99,660) $ 2.52–7.45 $ 3.62 (246,420) $ 2.50–18.30 $ 3.71
Granted — — — 519,200 $ 11.13–18.75 $ 11.48
Options outstanding at September 30, 1998 202,219 $ 3.27–7.45 $ 5.49 2,250,440 $ 3.26–20.31 $ 14.19
Exercised or forfeited (36,300) $ 3.27–4.33 $ 3.60 (72,400) $ 3.26–20.31 $ 4.95
Granted — — — 822,200 $ 11.44–15.19 $ 14.59
Options outstanding at September 30, 1999 165,919 $ 4.33–7.45 $ 5.90 3,000,240 $ 4.32–20.31 $ 14.52
Exercised or forfeited 120,379 $ 4.33–7.45 $ 5.57 486,560 $ 4.32–20.31 $ 9.83
Granted — — — 1,003,600 $ 8.93–14.25 $ 9.19
Options outstanding at September 30, 2000 45,540 $ 6.09–7.45 $ 6.78 3,517,280 $ 6.06–20.31 $ 13.65
Options exercisable atSeptember 30, 2000 45,540 $ 6.09–7.45 $ 6.78 1,811,180 $ 6.06–20.31 $ 15.72
Options available for future grant at September 30, 2000 — — — 297,100 — —
The following table summarizes information concerning options outstanding and exercisable at September 30, 2000:
class b common class a common
weightedweighted weighted weighted average
number average average average remainingrange of outstanding exercise number exercise number exercise contractual lifeexercise prices and exercisable price outstanding price exercisable price (both classes)
$ 6.06–7.45 45,540 $ 6.78 133,980 $ 6.77 133,980 $ 6.77 2.0
$ 8.94–10.25 — — 858,600 $ 9.01 — — 9.6
$11.13–11.44 — — 477,200 $ 11.16 249,000 $ 11.14 7.0
$14.25–17.50 — — 1,324,400 $ 15.06 715,400 $15.25 6.4
$18.30–20.31 — — 723,100 $ 19.47 712,800 $19.48 5.3
45,540 $ 6.78 3,517,280 $ 13.65 1,811,180 $15.72 6.8
The estimated weighted average fair value of options granted dur-ing fiscal 2000, 1999 and 1998 with option prices equal to the marketprice on the date of grant was $4.41, $6.72, and $4.46, respectively.
Employee Stock Purchase PlanUnder the Amended and Restated 1993 Employee Stock PurchasePlan, 1,320,000 shares of Class A Common are reserved for purchaseby substantially all qualifying employees of the Company. In fiscal2000, 1999 and 1998, approximately 314,000, 284,000 and 207,000shares respectively, were purchased by employees under this plan.
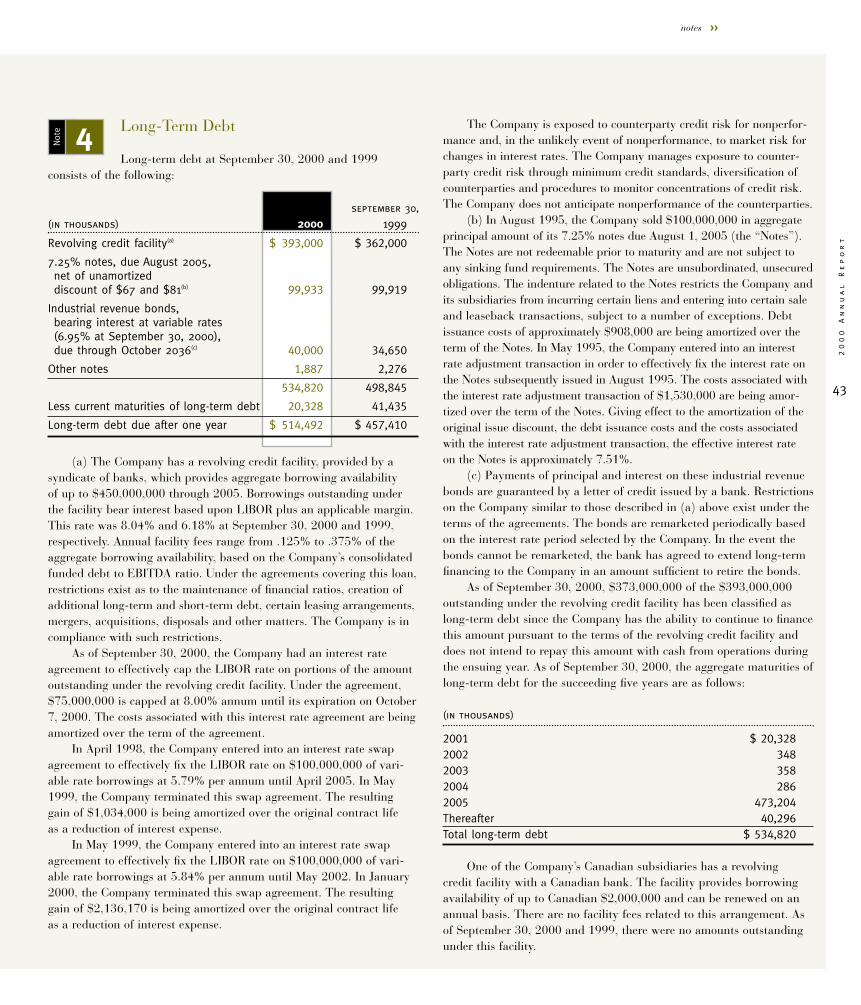
43
20
00
A
nn
ua
l
Re
po
rt
notes >>
Long-Term Debt
Long-term debt at September 30, 2000 and 1999consists of the following:
september 30,
(in thousands) 2000 1999
Revolving credit facility(a) $ 393,000 $ 362,000
7.25% notes, due August 2005, net of unamortized discount of $67 and $81(b) 99,933 99,919
Industrial revenue bonds, bearing interest at variable rates (6.95% at September 30, 2000), due through October 2036(c) 40,000 34,650
Other notes 1,887 2,276
534,820 498,845
Less current maturities of long-term debt 20,328 41,435
Long-term debt due after one year $ 514,492 $ 457,410
(a) The Company has a revolving credit facility, provided by asyndicate of banks, which provides aggregate borrowing availabilityof up to $450,000,000 through 2005. Borrowings outstanding underthe facility bear interest based upon LIBOR plus an applicable margin.This rate was 8.04% and 6.18% at September 30, 2000 and 1999,respectively. Annual facility fees range from .125% to .375% of theaggregate borrowing availability, based on the Company’s consolidatedfunded debt to EBITDA ratio. Under the agreements covering this loan,restrictions exist as to the maintenance of financial ratios, creation ofadditional long-term and short-term debt, certain leasing arrangements,mergers, acquisitions, disposals and other matters. The Company is incompliance with such restrictions.
As of September 30, 2000, the Company had an interest rateagreement to effectively cap the LIBOR rate on portions of the amountoutstanding under the revolving credit facility. Under the agreement,$75,000,000 is capped at 8.00% annum until its expiration on October7, 2000. The costs associated with this interest rate agreement are beingamortized over the term of the agreement.
In April 1998, the Company entered into an interest rate swapagreement to effectively fix the LIBOR rate on $100,000,000 of vari-able rate borrowings at 5.79% per annum until April 2005. In May1999, the Company terminated this swap agreement. The resultinggain of $1,034,000 is being amortized over the original contract lifeas a reduction of interest expense.
In May 1999, the Company entered into an interest rate swapagreement to effectively fix the LIBOR rate on $100,000,000 of vari-able rate borrowings at 5.84% per annum until May 2002. In January2000, the Company terminated this swap agreement. The resultinggain of $2,136,170 is being amortized over the original contract lifeas a reduction of interest expense.
The Company is exposed to counterparty credit risk for nonperfor-mance and, in the unlikely event of nonperformance, to market risk forchanges in interest rates. The Company manages exposure to counter-party credit risk through minimum credit standards, diversification ofcounterparties and procedures to monitor concentrations of credit risk.The Company does not anticipate nonperformance of the counterparties.
(b) In August 1995, the Company sold $100,000,000 in aggregateprincipal amount of its 7.25% notes due August 1, 2005 (the “Notes”).The Notes are not redeemable prior to maturity and are not subject toany sinking fund requirements. The Notes are unsubordinated, unsecuredobligations. The indenture related to the Notes restricts the Company andits subsidiaries from incurring certain liens and entering into certain saleand leaseback transactions, subject to a number of exceptions. Debtissuance costs of approximately $908,000 are being amortized over theterm of the Notes. In May 1995, the Company entered into an interestrate adjustment transaction in order to effectively fix the interest rate onthe Notes subsequently issued in August 1995. The costs associated withthe interest rate adjustment transaction of $1,530,000 are being amor-tized over the term of the Notes. Giving effect to the amortization of theoriginal issue discount, the debt issuance costs and the costs associatedwith the interest rate adjustment transaction, the effective interest rateon the Notes is approximately 7.51%.
(c) Payments of principal and interest on these industrial revenuebonds are guaranteed by a letter of credit issued by a bank. Restrictionson the Company similar to those described in (a) above exist under theterms of the agreements. The bonds are remarketed periodically basedon the interest rate period selected by the Company. In the event thebonds cannot be remarketed, the bank has agreed to extend long-termfinancing to the Company in an amount sufficient to retire the bonds.
As of September 30, 2000, $373,000,000 of the $393,000,000outstanding under the revolving credit facility has been classified aslong-term debt since the Company has the ability to continue to financethis amount pursuant to the terms of the revolving credit facility anddoes not intend to repay this amount with cash from operations duringthe ensuing year. As of September 30, 2000, the aggregate maturities oflong-term debt for the succeeding five years are as follows:
(in thousands)
2001 $ 20,3282002 3482003 3582004 2862005 473,204Thereafter 40,296Total long-term debt $ 534,820
One of the Company’s Canadian subsidiaries has a revolvingcredit facility with a Canadian bank. The facility provides borrowingavailability of up to Canadian $2,000,000 and can be renewed on anannual basis. There are no facility fees related to this arrangement. Asof September 30, 2000 and 1999, there were no amounts outstandingunder this facility.
4Not
e
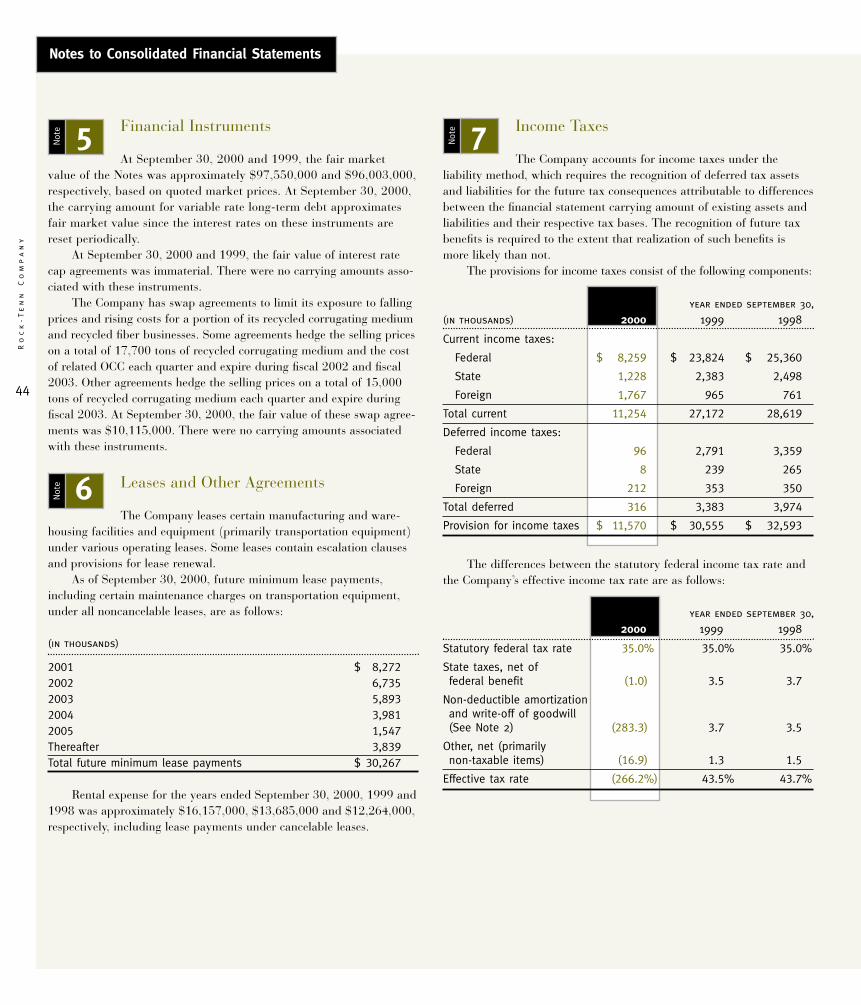
44
Ro
ck
-T
en
n
Co
mp
an
y
Notes to Consolidated Financial Statements
Financial Instruments
At September 30, 2000 and 1999, the fair marketvalue of the Notes was approximately $97,550,000 and $96,003,000,respectively, based on quoted market prices. At September 30, 2000,the carrying amount for variable rate long-term debt approximatesfair market value since the interest rates on these instruments arereset periodically.
At September 30, 2000 and 1999, the fair value of interest ratecap agreements was immaterial. There were no carrying amounts asso-ciated with these instruments.
The Company has swap agreements to limit its exposure to fallingprices and rising costs for a portion of its recycled corrugating mediumand recycled fiber businesses. Some agreements hedge the selling priceson a total of 17,700 tons of recycled corrugating medium and the costof related OCC each quarter and expire during fiscal 2002 and fiscal2003. Other agreements hedge the selling prices on a total of 15,000tons of recycled corrugating medium each quarter and expire duringfiscal 2003. At September 30, 2000, the fair value of these swap agree-ments was $10,115,000. There were no carrying amounts associatedwith these instruments.
Leases and Other Agreements
The Company leases certain manufacturing and ware-housing facilities and equipment (primarily transportation equipment)under various operating leases. Some leases contain escalation clausesand provisions for lease renewal.
As of September 30, 2000, future minimum lease payments,including certain maintenance charges on transportation equipment,under all noncancelable leases, are as follows:
(in thousands)
2001 $ 8,2722002 6,7352003 5,8932004 3,9812005 1,547Thereafter 3,839Total future minimum lease payments $ 30,267
Rental expense for the years ended September 30, 2000, 1999 and1998 was approximately $16,157,000, $13,685,000 and $12,264,000,respectively, including lease payments under cancelable leases.
Income Taxes
The Company accounts for income taxes under theliability method, which requires the recognition of deferred tax assetsand liabilities for the future tax consequences attributable to differencesbetween the financial statement carrying amount of existing assets andliabilities and their respective tax bases. The recognition of future taxbenefits is required to the extent that realization of such benefits ismore likely than not.
The provisions for income taxes consist of the following components:
year ended september 30,
(in thousands) 2000 1999 1998
Current income taxes:
Federal $ 8,259 $ 23,824 $ 25,360
State 1,228 2,383 2,498
Foreign 1,767 965 761
Total current 11,254 27,172 28,619
Deferred income taxes:
Federal 96 2,791 3,359
State 8 239 265
Foreign 212 353 350
Total deferred 316 3,383 3,974
Provision for income taxes $ 11,570 $ 30,555 $ 32,593
The differences between the statutory federal income tax rate andthe Company’s effective income tax rate are as follows:
year ended september 30,
2000 1999 1998
Statutory federal tax rate 35.0% 35.0% 35.0%
State taxes, net of federal benefit (1.0) 3.5 3.7
Non-deductible amortization and write-off of goodwill (See Note 2) (283.3) 3.7 3.5
Other, net (primarily non-taxable items) (16.9) 1.3 1.5
Effective tax rate (266.2%) 43.5% 43.7%
5Not
e
6Not
e
7Not
e
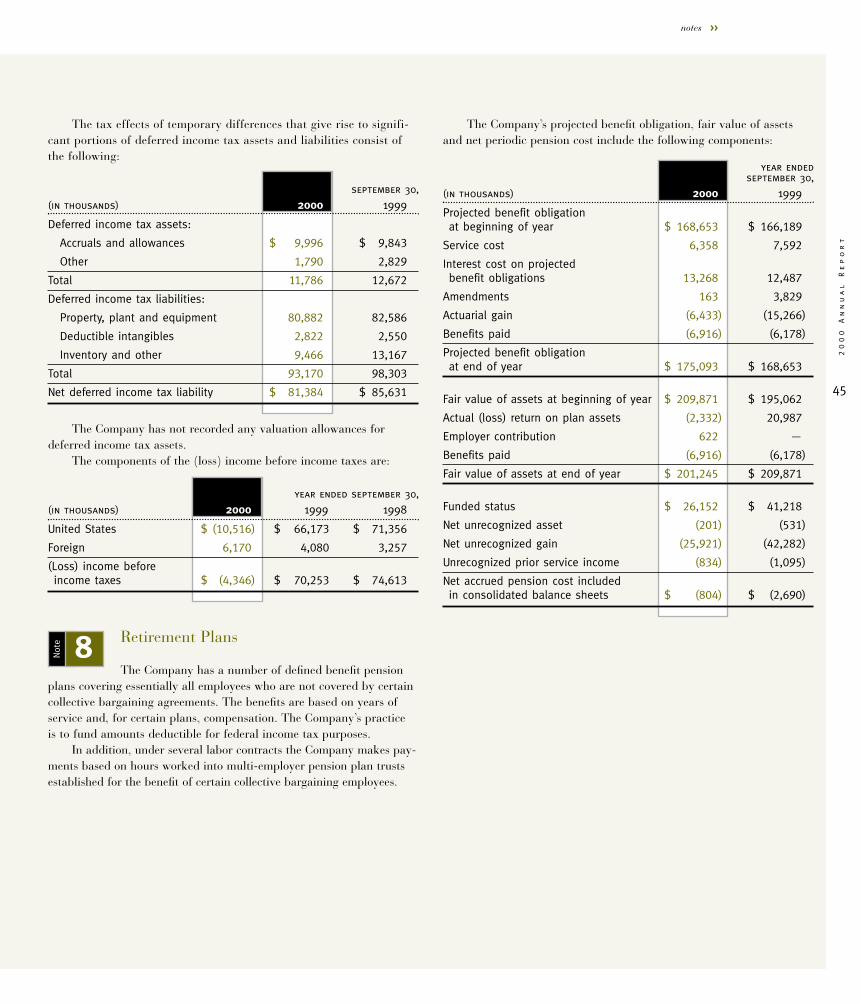
45
20
00
A
nn
ua
l
Re
po
rt
notes >>
The tax effects of temporary differences that give rise to signifi-cant portions of deferred income tax assets and liabilities consist ofthe following:
september 30,
(in thousands) 2000 1999
Deferred income tax assets:
Accruals and allowances $ 9,996 $ 9,843
Other 1,790 2,829
Total 11,786 12,672
Deferred income tax liabilities:
Property, plant and equipment 80,882 82,586
Deductible intangibles 2,822 2,550
Inventory and other 9,466 13,167
Total 93,170 98,303
Net deferred income tax liability $ 81,384 $ 85,631
The Company has not recorded any valuation allowances fordeferred income tax assets.
The components of the (loss) income before income taxes are:
year ended september 30,
(in thousands) 2000 1999 1998
United States $ (10,516) $ 66,173 $ 71,356
Foreign 6,170 4,080 3,257
(Loss) income before income taxes $ (4,346) $ 70,253 $ 74,613
Retirement Plans
The Company has a number of defined benefit pensionplans covering essentially all employees who are not covered by certaincollective bargaining agreements. The benefits are based on years ofservice and, for certain plans, compensation. The Company’s practiceis to fund amounts deductible for federal income tax purposes.
In addition, under several labor contracts the Company makes pay-ments based on hours worked into multi-employer pension plan trustsestablished for the benefit of certain collective bargaining employees.
The Company’s projected benefit obligation, fair value of assetsand net periodic pension cost include the following components:
year ended september 30,
(in thousands) 2000 1999
Projected benefit obligation at beginning of year $ 168,653 $ 166,189
Service cost 6,358 7,592
Interest cost on projected benefit obligations 13,268 12,487
Amendments 163 3,829
Actuarial gain (6,433) (15,266)
Benefits paid (6,916) (6,178)
Projected benefit obligation at end of year $ 175,093 $ 168,653
Fair value of assets at beginning of year $ 209,871 $ 195,062
Actual (loss) return on plan assets (2,332) 20,987
Employer contribution 622 —
Benefits paid (6,916) (6,178)
Fair value of assets at end of year $ 201,245 $ 209,871
Funded status $ 26,152 $ 41,218
Net unrecognized asset (201) (531)
Net unrecognized gain (25,921) (42,282)
Unrecognized prior service income (834) (1,095)
Net accrued pension cost included in consolidated balance sheets $ (804) $ (2,690)
8Not
e
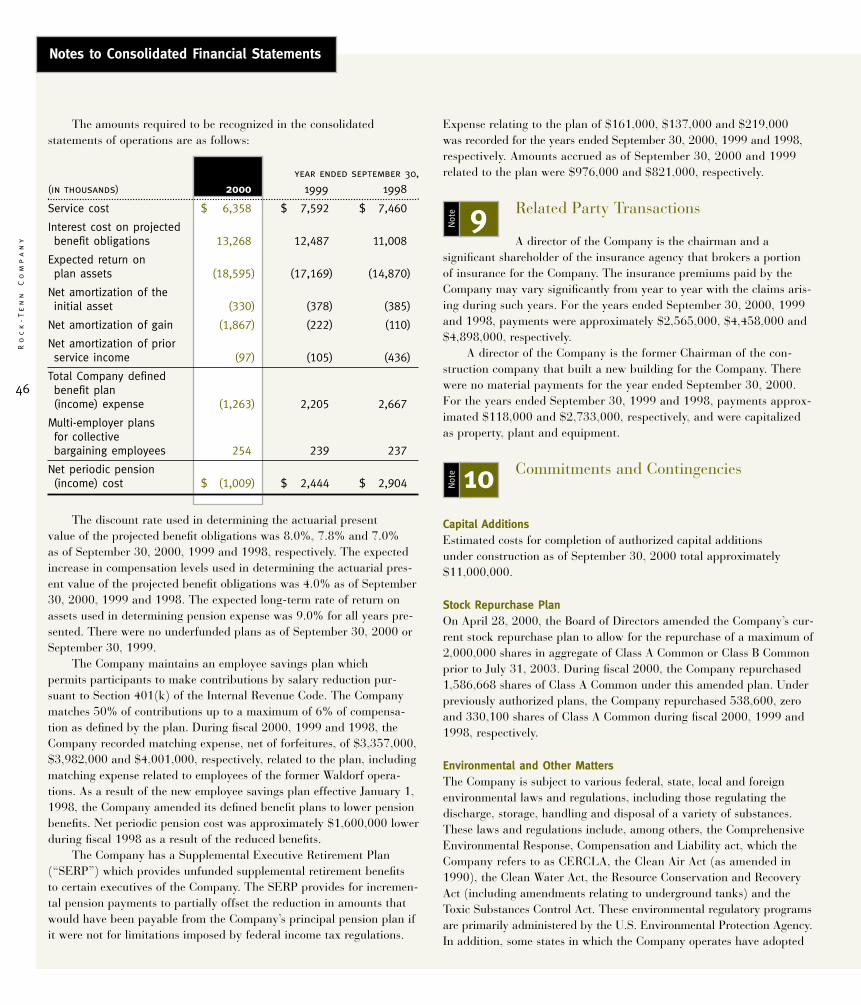
46
Ro
ck
-T
en
n
Co
mp
an
y
Notes to Consolidated Financial Statements
The amounts required to be recognized in the consolidatedstatements of operations are as follows:
year ended september 30,
(in thousands) 2000 1999 1998
Service cost $ 6,358 $ 7,592 $ 7,460
Interest cost on projected benefit obligations 13,268 12,487 11,008
Expected return on plan assets (18,595) (17,169) (14,870)
Net amortization of the initial asset (330) (378) (385)
Net amortization of gain (1,867) (222) (110)
Net amortization of prior service income (97) (105) (436)
Total Company defined benefit plan (income) expense (1,263) 2,205 2,667
Multi-employer plans for collective bargaining employees 254 239 237
Net periodic pension (income) cost $ (1,009) $ 2,444 $ 2,904
The discount rate used in determining the actuarial presentvalue of the projected benefit obligations was 8.0%, 7.8% and 7.0%as of September 30, 2000, 1999 and 1998, respectively. The expectedincrease in compensation levels used in determining the actuarial pres-ent value of the projected benefit obligations was 4.0% as of September30, 2000, 1999 and 1998. The expected long-term rate of return onassets used in determining pension expense was 9.0% for all years pre-sented. There were no underfunded plans as of September 30, 2000 orSeptember 30, 1999.
The Company maintains an employee savings plan whichpermits participants to make contributions by salary reduction pur-suant to Section 401(k) of the Internal Revenue Code. The Companymatches 50% of contributions up to a maximum of 6% of compensa-tion as defined by the plan. During fiscal 2000, 1999 and 1998, theCompany recorded matching expense, net of forfeitures, of $3,357,000,$3,982,000 and $4,001,000, respectively, related to the plan, includingmatching expense related to employees of the former Waldorf opera-tions. As a result of the new employee savings plan effective January 1,1998, the Company amended its defined benefit plans to lower pensionbenefits. Net periodic pension cost was approximately $1,600,000 lowerduring fiscal 1998 as a result of the reduced benefits.
The Company has a Supplemental Executive Retirement Plan(“SERP”) which provides unfunded supplemental retirement benefitsto certain executives of the Company. The SERP provides for incremen-tal pension payments to partially offset the reduction in amounts thatwould have been payable from the Company’s principal pension plan ifit were not for limitations imposed by federal income tax regulations.
Expense relating to the plan of $161,000, $137,000 and $219,000was recorded for the years ended September 30, 2000, 1999 and 1998,respectively. Amounts accrued as of September 30, 2000 and 1999related to the plan were $976,000 and $821,000, respectively.
Related Party Transactions
A director of the Company is the chairman and asignificant shareholder of the insurance agency that brokers a portionof insurance for the Company. The insurance premiums paid by theCompany may vary significantly from year to year with the claims aris-ing during such years. For the years ended September 30, 2000, 1999and 1998, payments were approximately $2,565,000, $4,458,000 and$4,898,000, respectively.
A director of the Company is the former Chairman of the con-struction company that built a new building for the Company. Therewere no material payments for the year ended September 30, 2000.For the years ended September 30, 1999 and 1998, payments approx-imated $118,000 and $2,733,000, respectively, and were capitalizedas property, plant and equipment.
Commitments and Contingencies
Capital AdditionsEstimated costs for completion of authorized capital additionsunder construction as of September 30, 2000 total approximately$11,000,000.
Stock Repurchase PlanOn April 28, 2000, the Board of Directors amended the Company’s cur-rent stock repurchase plan to allow for the repurchase of a maximum of2,000,000 shares in aggregate of Class A Common or Class B Commonprior to July 31, 2003. During fiscal 2000, the Company repurchased1,586,668 shares of Class A Common under this amended plan. Underpreviously authorized plans, the Company repurchased 538,600, zeroand 330,100 shares of Class A Common during fiscal 2000, 1999 and1998, respectively.
Environmental and Other MattersThe Company is subject to various federal, state, local and foreignenvironmental laws and regulations, including those regulating thedischarge, storage, handling and disposal of a variety of substances.These laws and regulations include, among others, the ComprehensiveEnvironmental Response, Compensation and Liability act, which theCompany refers to as CERCLA, the Clean Air Act (as amended in1990), the Clean Water Act, the Resource Conservation and RecoveryAct (including amendments relating to underground tanks) and theToxic Substances Control Act. These environmental regulatory programsare primarily administered by the U.S. Environmental Protection Agency.In addition, some states in which the Company operates have adopted
9Not
e
10Not
e
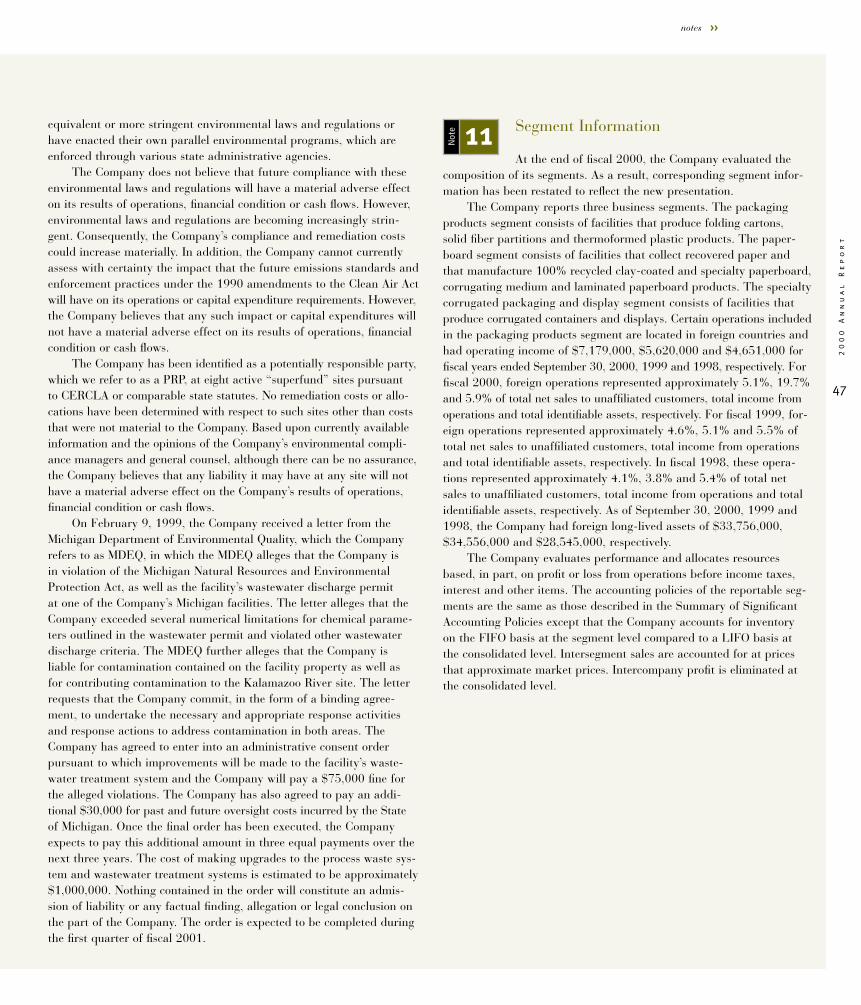
47
20
00
A
nn
ua
l
Re
po
rt
notes >>
equivalent or more stringent environmental laws and regulations orhave enacted their own parallel environmental programs, which areenforced through various state administrative agencies.
The Company does not believe that future compliance with theseenvironmental laws and regulations will have a material adverse effecton its results of operations, financial condition or cash flows. However,environmental laws and regulations are becoming increasingly strin-gent. Consequently, the Company’s compliance and remediation costscould increase materially. In addition, the Company cannot currentlyassess with certainty the impact that the future emissions standards andenforcement practices under the 1990 amendments to the Clean Air Actwill have on its operations or capital expenditure requirements. However,the Company believes that any such impact or capital expenditures willnot have a material adverse effect on its results of operations, financialcondition or cash flows.
The Company has been identified as a potentially responsible party,which we refer to as a PRP, at eight active “superfund” sites pursuantto CERCLA or comparable state statutes. No remediation costs or allo-cations have been determined with respect to such sites other than coststhat were not material to the Company. Based upon currently availableinformation and the opinions of the Company’s environmental compli-ance managers and general counsel, although there can be no assurance,the Company believes that any liability it may have at any site will nothave a material adverse effect on the Company’s results of operations,financial condition or cash flows.
On February 9, 1999, the Company received a letter from theMichigan Department of Environmental Quality, which the Companyrefers to as MDEQ, in which the MDEQ alleges that the Company isin violation of the Michigan Natural Resources and EnvironmentalProtection Act, as well as the facility’s wastewater discharge permitat one of the Company’s Michigan facilities. The letter alleges that theCompany exceeded several numerical limitations for chemical parame-ters outlined in the wastewater permit and violated other wastewaterdischarge criteria. The MDEQ further alleges that the Company isliable for contamination contained on the facility property as well asfor contributing contamination to the Kalamazoo River site. The letterrequests that the Company commit, in the form of a binding agree-ment, to undertake the necessary and appropriate response activitiesand response actions to address contamination in both areas. TheCompany has agreed to enter into an administrative consent orderpursuant to which improvements will be made to the facility’s waste-water treatment system and the Company will pay a $75,000 fine forthe alleged violations. The Company has also agreed to pay an addi-tional $30,000 for past and future oversight costs incurred by the Stateof Michigan. Once the final order has been executed, the Companyexpects to pay this additional amount in three equal payments over thenext three years. The cost of making upgrades to the process waste sys-tem and wastewater treatment systems is estimated to be approximately$1,000,000. Nothing contained in the order will constitute an admis-sion of liability or any factual finding, allegation or legal conclusion onthe part of the Company. The order is expected to be completed duringthe first quarter of fiscal 2001.
Segment Information
At the end of fiscal 2000, the Company evaluated thecomposition of its segments. As a result, corresponding segment infor-mation has been restated to reflect the new presentation.
The Company reports three business segments. The packagingproducts segment consists of facilities that produce folding cartons,solid fiber partitions and thermoformed plastic products. The paper-board segment consists of facilities that collect recovered paper andthat manufacture 100% recycled clay-coated and specialty paperboard,corrugating medium and laminated paperboard products. The specialtycorrugated packaging and display segment consists of facilities thatproduce corrugated containers and displays. Certain operations includedin the packaging products segment are located in foreign countries andhad operating income of $7,179,000, $5,620,000 and $4,651,000 forfiscal years ended September 30, 2000, 1999 and 1998, respectively. Forfiscal 2000, foreign operations represented approximately 5.1%, 19.7%and 5.9% of total net sales to unaffiliated customers, total income fromoperations and total identifiable assets, respectively. For fiscal 1999, for-eign operations represented approximately 4.6%, 5.1% and 5.5% oftotal net sales to unaffiliated customers, total income from operationsand total identifiable assets, respectively. In fiscal 1998, these opera-tions represented approximately 4.1%, 3.8% and 5.4% of total netsales to unaffiliated customers, total income from operations and totalidentifiable assets, respectively. As of September 30, 2000, 1999 and1998, the Company had foreign long-lived assets of $33,756,000,$34,556,000 and $28,545,000, respectively.
The Company evaluates performance and allocates resourcesbased, in part, on profit or loss from operations before income taxes,interest and other items. The accounting policies of the reportable seg-ments are the same as those described in the Summary of SignificantAccounting Policies except that the Company accounts for inventoryon the FIFO basis at the segment level compared to a LIFO basis atthe consolidated level. Intersegment sales are accounted for at pricesthat approximate market prices. Intercompany profit is eliminated atthe consolidated level.
11Not
e
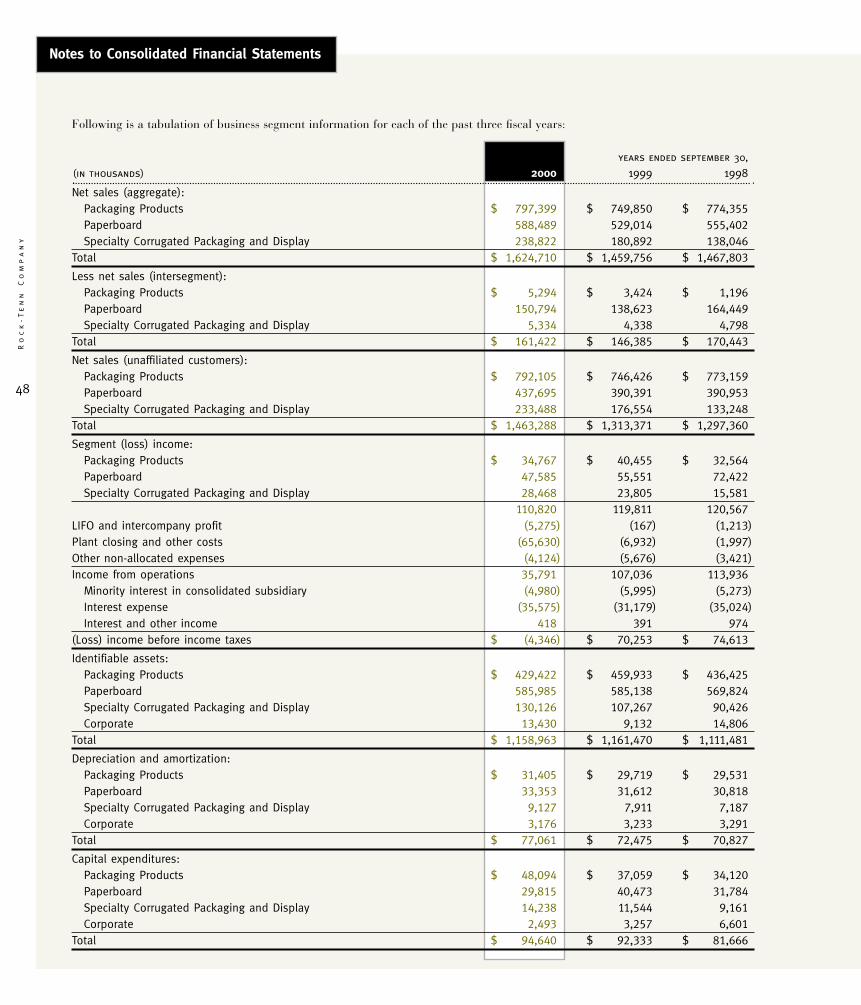
48
Ro
ck
-T
en
n
Co
mp
an
y
Notes to Consolidated Financial Statements
Following is a tabulation of business segment information for each of the past three fiscal years:
years ended september 30,
(in thousands) 2000 1999 1998
Net sales (aggregate):Packaging Products $ 797,399 $ 749,850 $ 774,355Paperboard 588,489 529,014 555,402Specialty Corrugated Packaging and Display 238,822 180,892 138,046
Total $ 1,624,710 $ 1,459,756 $ 1,467,803
Less net sales (intersegment):Packaging Products $ 5,294 $ 3,424 $ 1,196Paperboard 150,794 138,623 164,449Specialty Corrugated Packaging and Display 5,334 4,338 4,798
Total $ 161,422 $ 146,385 $ 170,443
Net sales (unaffiliated customers):Packaging Products $ 792,105 $ 746,426 $ 773,159Paperboard 437,695 390,391 390,953Specialty Corrugated Packaging and Display 233,488 176,554 133,248
Total $ 1,463,288 $ 1,313,371 $ 1,297,360
Segment (loss) income:Packaging Products $ 34,767 $ 40,455 $ 32,564Paperboard 47,585 55,551 72,422Specialty Corrugated Packaging and Display 28,468 23,805 15,581
110,820 119,811 120,567LIFO and intercompany profit (5,275) (167) (1,213)Plant closing and other costs (65,630) (6,932) (1,997)Other non-allocated expenses (4,124) (5,676) (3,421)Income from operations 35,791 107,036 113,936
Minority interest in consolidated subsidiary (4,980) (5,995) (5,273)Interest expense (35,575) (31,179) (35,024)Interest and other income 418 391 974
(Loss) income before income taxes $ (4,346) $ 70,253 $ 74,613
Identifiable assets:Packaging Products $ 429,422 $ 459,933 $ 436,425Paperboard 585,985 585,138 569,824Specialty Corrugated Packaging and Display 130,126 107,267 90,426Corporate 13,430 9,132 14,806
Total $ 1,158,963 $ 1,161,470 $ 1,111,481
Depreciation and amortization:Packaging Products $ 31,405 $ 29,719 $ 29,531Paperboard 33,353 31,612 30,818Specialty Corrugated Packaging and Display 9,127 7,911 7,187Corporate 3,176 3,233 3,291
Total $ 77,061 $ 72,475 $ 70,827
Capital expenditures:Packaging Products $ 48,094 $ 37,059 $ 34,120 Paperboard 29,815 40,473 31,784Specialty Corrugated Packaging and Display 14,238 11,544 9,161Corporate 2,493 3,257 6,601
Total $ 94,640 $ 92,333 $ 81,666
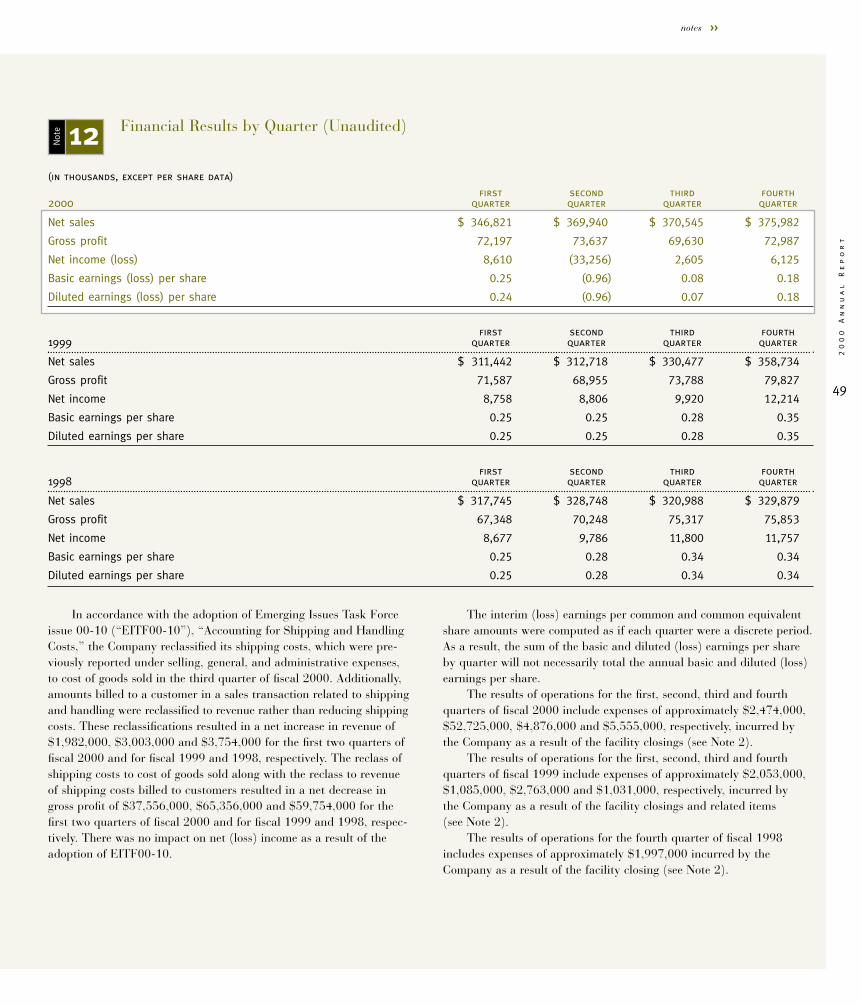
49
20
00
A
nn
ua
l
Re
po
rt
notes >>
Financial Results by Quarter (Unaudited)
In accordance with the adoption of Emerging Issues Task Forceissue 00-10 (“EITF00-10”), “Accounting for Shipping and HandlingCosts,” the Company reclassified its shipping costs, which were pre-viously reported under selling, general, and administrative expenses,to cost of goods sold in the third quarter of fiscal 2000. Additionally,amounts billed to a customer in a sales transaction related to shippingand handling were reclassified to revenue rather than reducing shippingcosts. These reclassifications resulted in a net increase in revenue of$1,982,000, $3,003,000 and $3,754,000 for the first two quarters offiscal 2000 and for fiscal 1999 and 1998, respectively. The reclass ofshipping costs to cost of goods sold along with the reclass to revenueof shipping costs billed to customers resulted in a net decrease ingross profit of $37,556,000, $65,356,000 and $59,754,000 for thefirst two quarters of fiscal 2000 and for fiscal 1999 and 1998, respec-tively. There was no impact on net (loss) income as a result of theadoption of EITF00-10.
The interim (loss) earnings per common and common equivalentshare amounts were computed as if each quarter were a discrete period.As a result, the sum of the basic and diluted (loss) earnings per shareby quarter will not necessarily total the annual basic and diluted (loss)earnings per share.
The results of operations for the first, second, third and fourthquarters of fiscal 2000 include expenses of approximately $2,474,000,$52,725,000, $4,876,000 and $5,555,000, respectively, incurred bythe Company as a result of the facility closings (see Note 2).
The results of operations for the first, second, third and fourthquarters of fiscal 1999 include expenses of approximately $2,053,000,$1,085,000, $2,763,000 and $1,031,000, respectively, incurred bythe Company as a result of the facility closings and related items(see Note 2).
The results of operations for the fourth quarter of fiscal 1998includes expenses of approximately $1,997,000 incurred by theCompany as a result of the facility closing (see Note 2).
12Not
e
(in thousands, except per share data)
first second third fourth2000 quarter quarter quarter quarter
Net sales $ 346,821 $ 369,940 $ 370,545 $ 375,982
Gross profit 72,197 73,637 69,630 72,987
Net income (loss) 8,610 (33,256) 2,605 6,125
Basic earnings (loss) per share 0.25 (0.96) 0.08 0.18
Diluted earnings (loss) per share 0.24 (0.96) 0.07 0.18
first second third fourth1999 quarter quarter quarter quarter
Net sales $ 311,442 $ 312,718 $ 330,477 $ 358,734
Gross profit 71,587 68,955 73,788 79,827
Net income 8,758 8,806 9,920 12,214
Basic earnings per share 0.25 0.25 0.28 0.35
Diluted earnings per share 0.25 0.25 0.28 0.35
first second third fourth1998 quarter quarter quarter quarter
Net sales $ 317,745 $ 328,748 $ 320,988 $ 329,879
Gross profit 67,348 70,248 75,317 75,853
Net income 8,677 9,786 11,800 11,757
Basic earnings per share 0.25 0.28 0.34 0.34
Diluted earnings per share 0.25 0.28 0.34 0.34
50
Ro
ck
-T
en
n
Co
mp
an
y
Report of Independent Auditors
The Board of Directors and ShareholdersRock-Tenn Company
We have audited the accompanying consolidated balance sheets of Rock-Tenn Company as of September 30, 2000 and 1999, and the relatedconsolidated statements of operations, shareholders’ equity and cash flows for each of the three years in the period ended September 30, 2000.These financial statements are the responsibility of the Company’s management. Our responsibility is to express an opinion on these financialstatements based on our audits.
We conducted our audits in accordance with auditing standards generally accepted in the United States. Those standards require that weplan and perform the audit to obtain reasonable assurance about whether the financial statements are free of material misstatement. An auditincludes examining, on a test basis, evidence supporting the amounts and disclosures in the financial statements. An audit also includes assessingthe accounting principles used and significant estimates made by management, as well as evaluating the overall financial statement presentation.We believe that our audits provide a reasonable basis for our opinion.
In our opinion, the financial statements referred to above present fairly, in all material respects, the consolidated financial position of Rock-Tenn Company at September 30, 2000 and 1999, and the consolidated results of its operations and its cash flows for each of the threeyears in the period ended September 30, 2000, in conformity with accounting principles generally accepted in the United States.
Atlanta, GeorgiaOctober 25, 2000
51
20
00
A
nn
ua
l
Re
po
rt
Management’s Statement of Responsibility for Financial Information
Rock-Tenn Company
The management of Rock-Tenn Company has the responsibility for preparing the accompanying consolidated financial statements and for theirintegrity and objectivity. The statements were prepared in accordance with generally accepted accounting principles. The financial statementsinclude amounts that are based on management’s best estimates and judgments. Management also prepared the other information in the annualreport and is responsible for its accuracy and consistency with the financial statements.
Rock-Tenn Company has established and maintains a system of internal control to safeguard assets against loss or unauthorized use and toensure the proper authorization and accounting for all transactions. This system includes appropriate reviews by the Company’s internal auditdepartment and management as well as written policies and procedures that are communicated to employees with significant roles in the financialreporting process and updated as necessary.
The Board of Directors, through its Audit Committee, is responsible for ensuring that both management and the independent auditorsfulfill their respective responsibilities with regard to the financial statements. The Audit Committee, composed entirely of directors who are notofficers or employees of the Company, meets periodically with both management and the independent auditors to assure that each is carrying outits responsibilities. The independent auditors and the Company’s internal audit department have full and free access to the Audit Committee andmeet with it, with and without management present, to discuss auditing and financial reporting matters.
The Company’s financial statements have been audited by Ernst & Young LLP, independent auditors. The opinion of the independentauditors, based upon their audits of the consolidated financial statements, is contained in this Annual Report.
As part of its audit of the Company’s financial statements, Ernst & Young LLP considered the Company’s internal control structure indetermining the nature, timing and extent of audit tests to be applied. Management has considered Ernst & Young LLP’s recommendationsconcerning the Company’s system of internal control and has taken actions that we believe are cost-effective in the circumstances to respondappropriately to these recommendations. Management believes that, as of September 30, 2000, the Company’s system of internal control isadequate to accomplish the objectives discussed herein.
Steven C. VoorheesExecutive Vice President andChief Financial Officer
52
Ro
ck
-T
en
n
Co
mp
an
y
Officers and Directors
Officers
James A. RubrightChairman and Chief Executive Officer
Steven C. VoorheesExecutive Vice President and Chief Financial Officer
Russell M. CurreySenior Vice PresidentMarketing & Planning
Robert B. McIntoshSenior Vice President, General Counsel and Secretary
R. Evan HardinVice President of Finance and Treasurer
Bradley P. NewmanVice President of Risk Managementand Administration
Larry S. ShutzbergVice President of Information Systems
Amanda F. PortnellController
Folding Carton Group
Nicholas G. GeorgeExecutive Vice President and General ManagerFolding Carton Group
Paperboard Group
David E. DreibelbisExecutive Vice President and General ManagerPaperboard Group
Terry W. DurhamExecutive Vice President and General ManagerLaminated Paperboard Products Division
Paul J. EnglandExecutive Vice President and General ManagerSpecialty Paperboard Division
Stephen P. FlanaganExecutive Vice President and General ManagerRecycled Fiber Division
James K. HansenExecutive Vice President and General ManagerCoated Paperboard Division
Specialty Packaging & Display Group
Edward E. BownsExecutive Vice President and General ManagerSpecialty Packaging and Display Group
Vincent J. D’AmelioExecutive Vice President and General ManagerPlastic Packaging Division
James L. EinsteinExecutive Vice President and General ManagerAlliance Division
John H. MorrisonExecutive Vice President and General ManagerCorrugated Packaging Division
Richard E. SteedPresident and Chief Executive OfficerRTS Packaging, LLC
Board of Directors
Stephen G. Anderson, M.D.(2)
Winston-Salem, North Carolina
J. Hyatt Brown(1)
Chairman and Chief Executive OfficerBrown & Brown, Inc.Daytona Beach, Florida
Bradley Currey, Jr.(1)
Retired Chairman Rock-Tenn CompanyAtlanta, Georgia
Robert B. CurreyChief Executive OfficerCurrey & Company, Inc.Atlanta, Georgia
A.D. Frazier, Jr.(2)
President and Chief Executive OfficerInvesco, Inc.Atlanta, Georgia
L.L. Gellerstedt III(3)
ChairmanL.G. III GroupAtlanta, Georgia
John D. Hopkins(1)(3)
Senior Vice President and General CounselJefferson-Pilot CorporationGreensboro, North Carolina
Lou Brown Jewell(3)
Private InvestorAtlanta, Georgia
James W. Johnson(3)
PresidentMcCranie Tractor CompanyUnadilla, Georgia
James A. Rubright(1)
Chairman and Chief Executive OfficerRock-Tenn CompanyNorcross, Georgia
Charles R. SextonPrincipalSexton-Talbert ProductsVero Beach, Florida
John W. Spiegel(1)(2)
Executive Vice President and Chief Financial OfficerSunTrust Banks, Inc.Atlanta, Georgia
(1) Executive Committee
(2) Audit Committee
(3) Compensation and Options Committee