Embed Size (px)
Citation preview
1
MPI Corporation.
(6223.TT)
For J.P. Morgan’s Global TMT Conference 2015 Only
Presentation Disclaimer
These presentations and/or other documents have been written and presented by MPI Corporation. MPI Corporation is solely responsible for the accuracy and completeness of the contents of such presentations and/or other documents. J.P. Morgan does not have any responsibility for or control over the contents of such presentations and/or other documents. No endorsement is intended or implied notwithstanding the distribution of the presentations and/or other documents at J.P. Morgan’s Global TMT Conference 2015. The materials and information in the presentations and other documents are for informational purposes only, and are not an offer or solicitation for the purchase or sale of any securities or financial instruments or to provide any investment service or investment advice. Thank you for your cooperation.
2
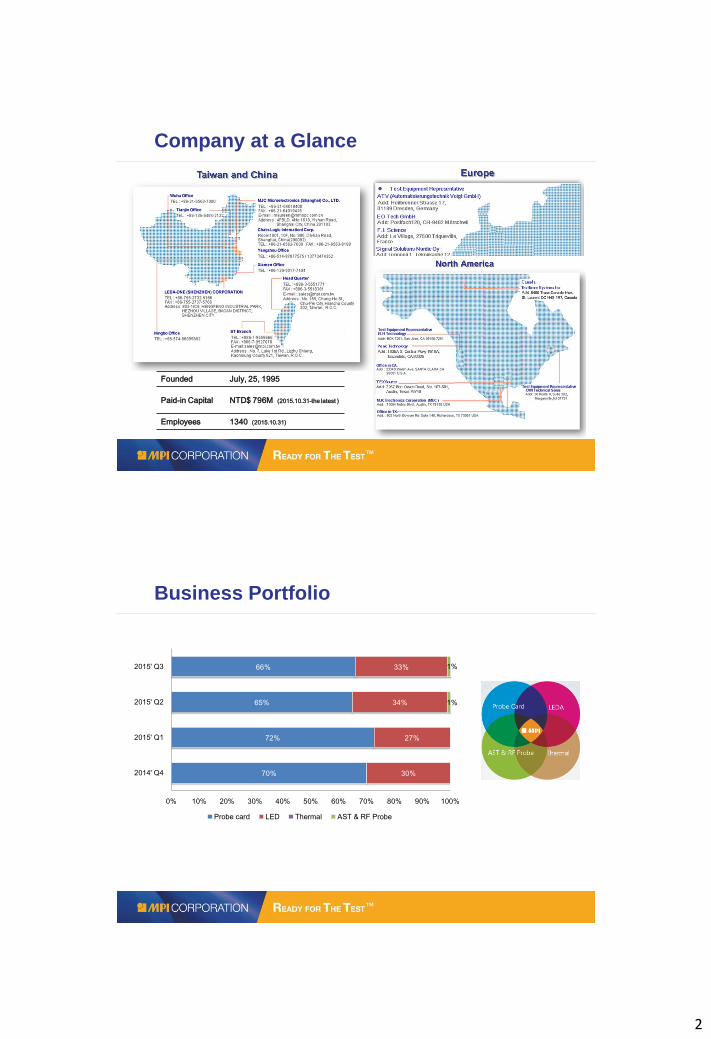
Founded July, 25, 1995
Paid-in Capital NTD$ 796M (2015.10.31-the latest )
Employees 1340 (2015.10.31)
Company at a Glance
Business Portfolio
70%
72%
65%
66%
30%
27%
34%
33%
1%
1%
0% 10% 20% 30% 40% 50% 60% 70% 80% 90% 100%
2014' Q4
2015' Q1
2015' Q2
2015' Q3
Probe card LED Thermal AST & RF Probe
3
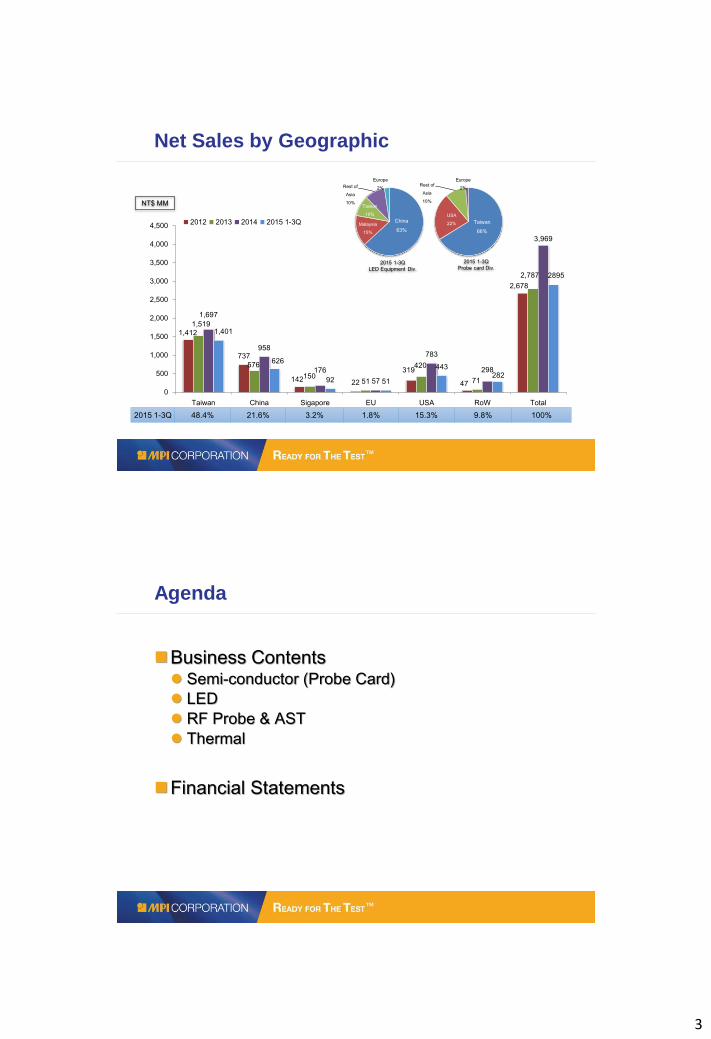
1,412
737
142 22
319
47
2,678
1,519
576
150 51
420
71
2,787
1,697
958
176
57
783
298
3,969
1,401
626
92 51
443 282
2895
0
500
1,000
1,500
2,000
2,500
3,000
3,500
4,000
4,500
Taiwan China Sigapore EU USA RoW Total
2012 2013 2014 2015 1-3Q
2015 1-3Q
LED Equipment Div.
2015 1-3Q 48.4% 21.6% 3.2% 1.8% 15.3% 9.8% 100%
2015 1-3Q
Probe card Div.
NT$ MM
Net Sales by Geographic
China
63% Malaysia
15%
Taiwan
10%
Rest of
Asia
10%
Europe
2%
Taiwan
66%
USA
22%
Rest of
Asia
10%
Europe
2%
Business Contents Semi-conductor (Probe Card)
LED
RF Probe & AST
Thermal
Financial Statements
Agenda
4
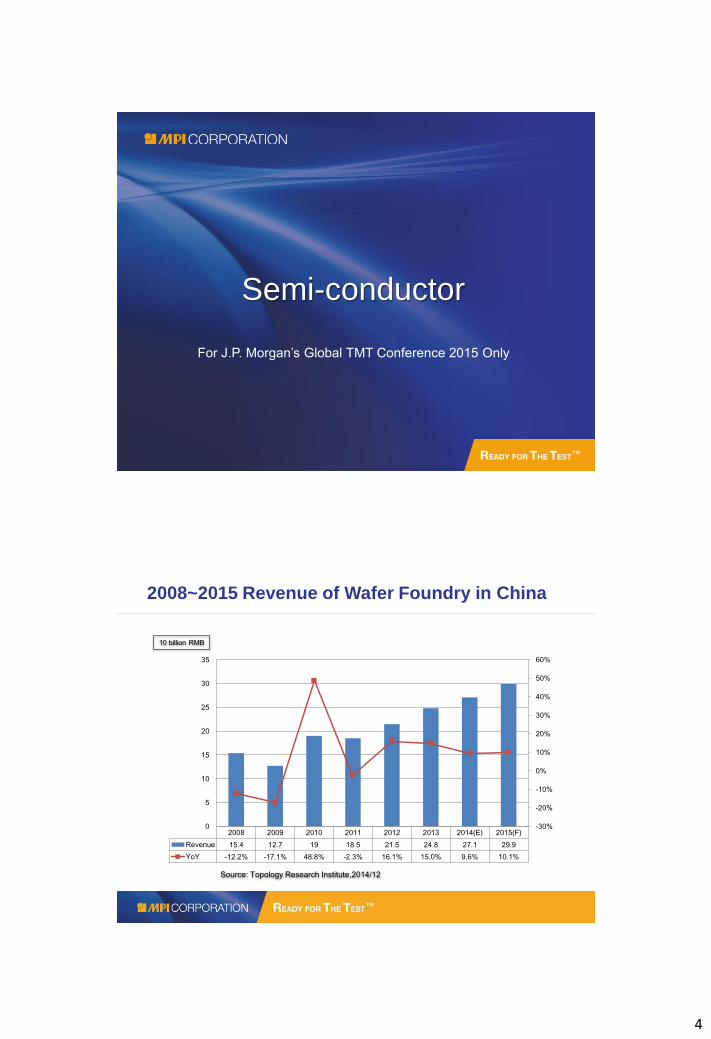
For J.P. Morgan’s Global TMT Conference 2015 Only
Semi-conductor
2008 2009 2010 2011 2012 2013 2014(E) 2015(F)
Revenue 15.4 12.7 19 18.5 21.5 24.8 27.1 29.9
YoY -12.2% -17.1% 48.8% -2.3% 16.1% 15.0% 9.6% 10.1%
-30%
-20%
-10%
0%
10%
20%
30%
40%
50%
60%
0
5
10
15
20
25
30
35
10 billion RMB
Source: Topology Research Institute,2014/12
2008~2015 Revenue of Wafer Foundry in China
5
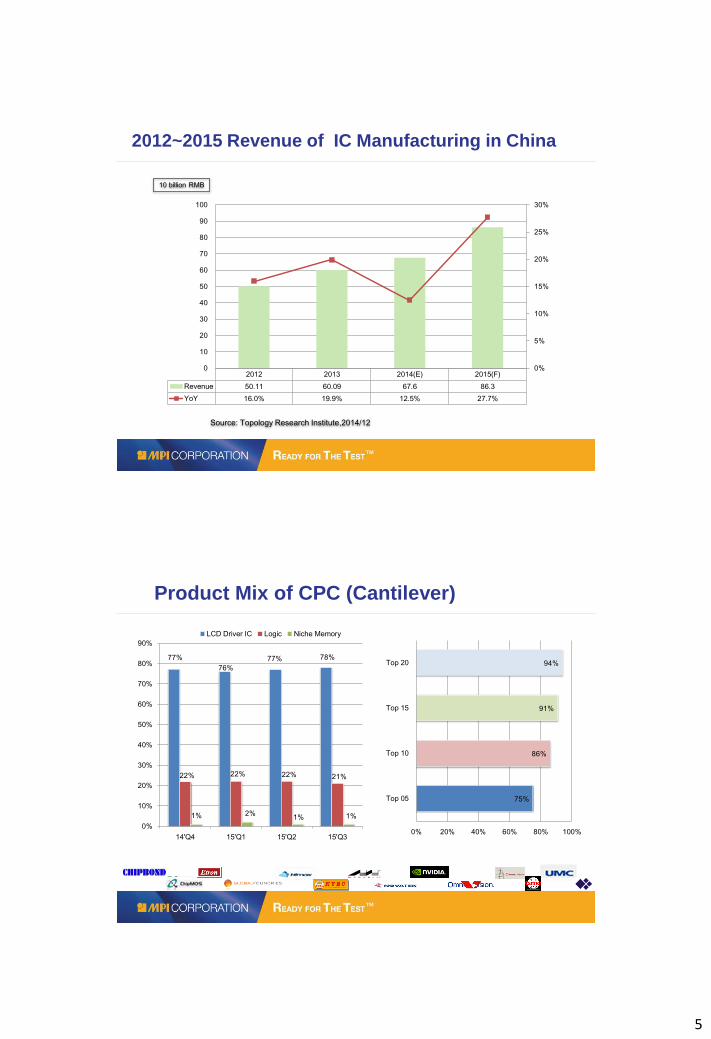
10 billion RMB
2012 2013 2014(E) 2015(F)
Revenue 50.11 60.09 67.6 86.3
YoY 16.0% 19.9% 12.5% 27.7%
0%
5%
10%
15%
20%
25%
30%
0
10
20
30
40
50
60
70
80
90
100
Source: Topology Research Institute,2014/12
2012~2015 Revenue of IC Manufacturing in China
75%
86%
91%
94%
0% 20% 40% 60% 80% 100%
Top 05
Top 10
Top 15
Top 2077%
76%
77% 78%
22% 22% 22% 21%
1% 2% 1% 1%
0%
10%
20%
30%
40%
50%
60%
70%
80%
90%
14'Q4 15'Q1 15'Q2 15'Q3
LCD Driver IC Logic Niche Memory
Product Mix of CPC (Cantilever)
6
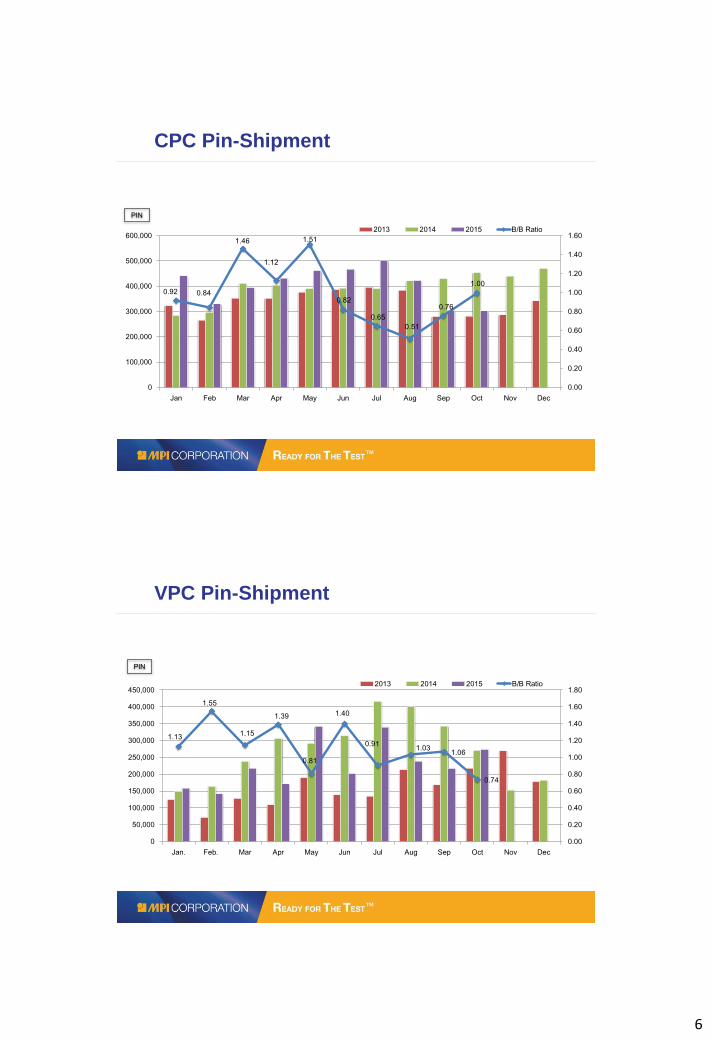
PIN
0.92 0.84
1.46
1.12
1.51
0.82
0.65
0.51
0.76
1.00
0.00
0.20
0.40
0.60
0.80
1.00
1.20
1.40
1.60
0
100,000
200,000
300,000
400,000
500,000
600,000
Jan Feb Mar Apr May Jun Jul Aug Sep Oct Nov Dec
2013 2014 2015 B/B Ratio
CPC Pin-Shipment
PIN
1.13
1.55
1.15
1.39
0.81
1.40
0.91 1.03
1.06
0.74
0.00
0.20
0.40
0.60
0.80
1.00
1.20
1.40
1.60
1.80
0
50,000
100,000
150,000
200,000
250,000
300,000
350,000
400,000
450,000
Jan. Feb. Mar Apr May Jun Jul Aug Sep Oct Nov Dec
2013 2014 2015 B/B Ratio
VPC Pin-Shipment
7
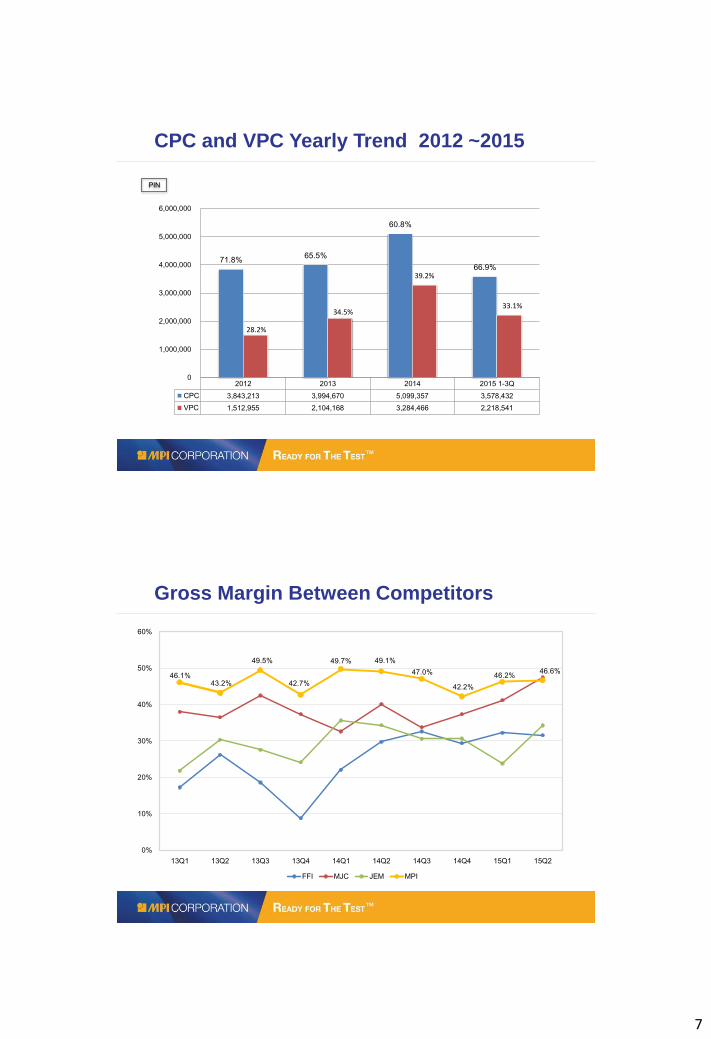
CPC and VPC Yearly Trend 2012 ~2015
PIN
2012 2013 2014 2015 1-3Q
CPC 3,843,213 3,994,670 5,099,357 3,578,432
VPC 1,512,955 2,104,168 3,284,466 2,218,541
71.8% 65.5%
60.8%
66.9%
28.2%
34.5%
39.2%
33.1%
0
1,000,000
2,000,000
3,000,000
4,000,000
5,000,000
6,000,000
Gross Margin Between Competitors
46.1% 43.2%
49.5%
42.7%
49.7% 49.1%
47.0%
42.2%
46.2% 46.6%
0%
10%
20%
30%
40%
50%
60%
13Q1 13Q2 13Q3 13Q4 14Q1 14Q2 14Q3 14Q4 15Q1 15Q2
FFI MJC JEM MPI
8
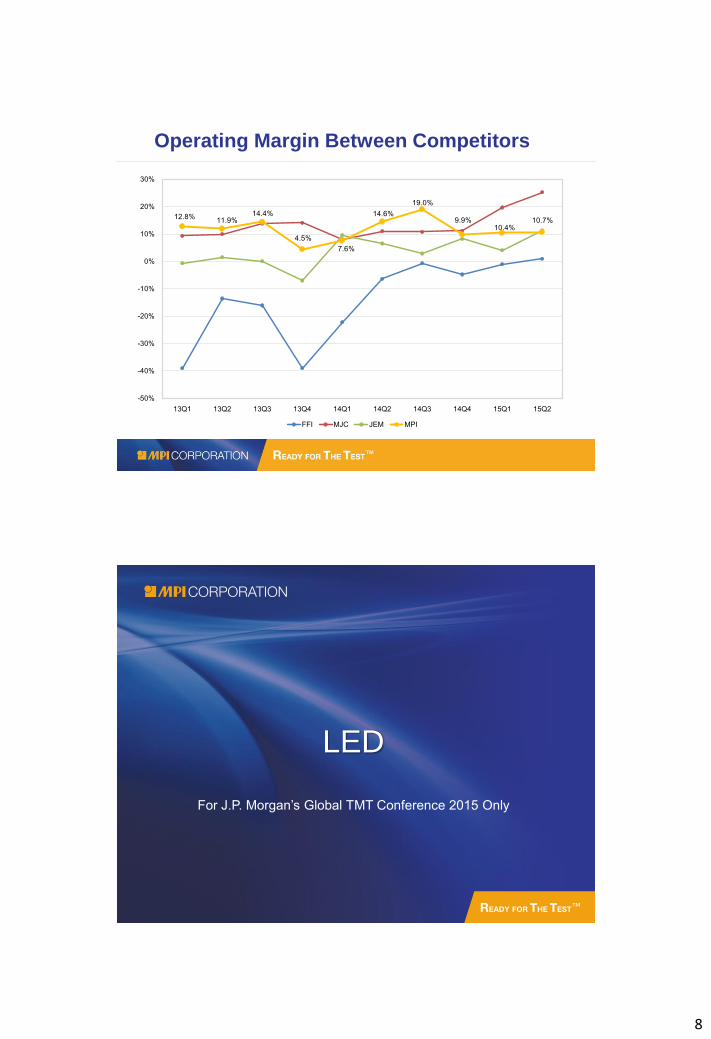
Operating Margin Between Competitors
12.8% 11.9%
14.4%
4.5%
7.6%
14.6%
19.0%
9.9% 10.4%
10.7%
-50%
-40%
-30%
-20%
-10%
0%
10%
20%
30%
13Q1 13Q2 13Q3 13Q4 14Q1 14Q2 14Q3 14Q4 15Q1 15Q2
FFI MJC JEM MPI
For J.P. Morgan’s Global TMT Conference 2015 Only
LED
9
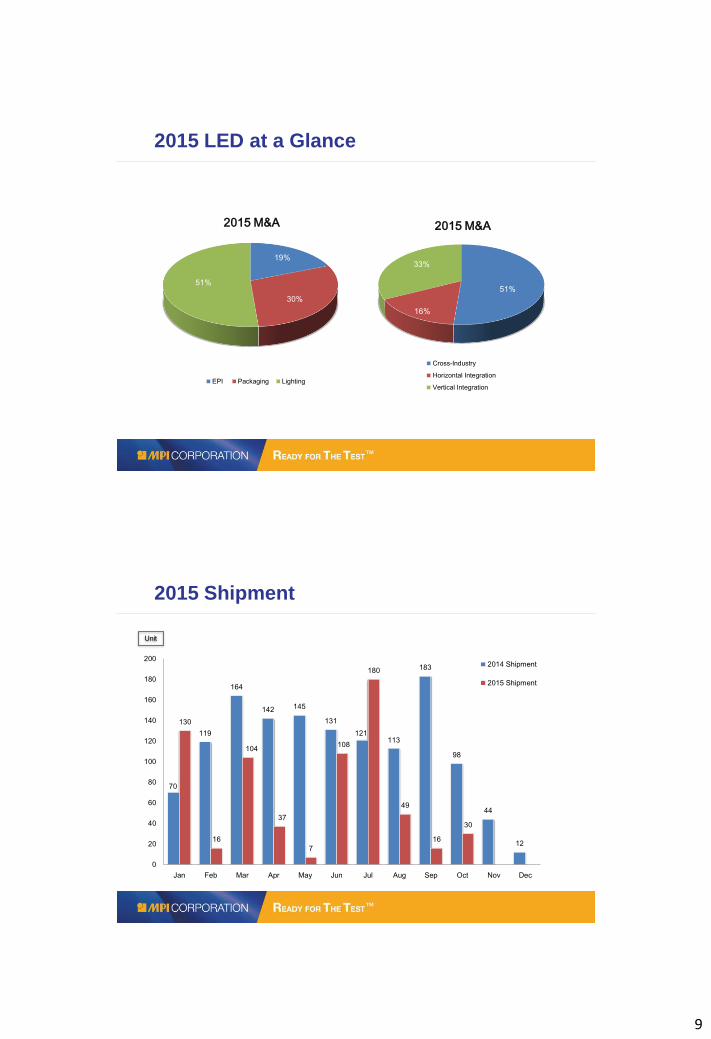
2015 LED at a Glance
51%
16%
33%
2015 M&A
Cross-Industry
Horizontal Integration
Vertical Integration
19%
30%
51%
2015 M&A
EPI Packaging Lighting
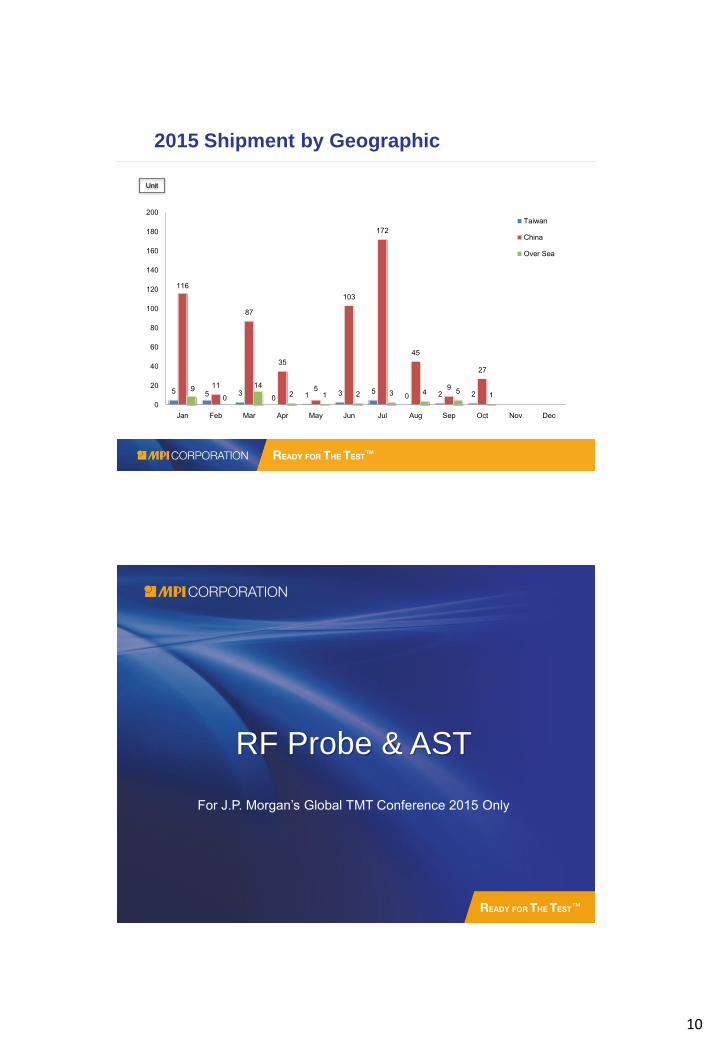
Unit
70
119
164
142 145
131
121 113
183
98
44
12
130
16
104
37
7
108
180
49
16
30
0
20
40
60
80
100
120
140
160
180
200
Jan Feb Mar Apr May Jun Jul Aug Sep Oct Nov Dec
2014 Shipment
2015 Shipment
2015 Shipment
10
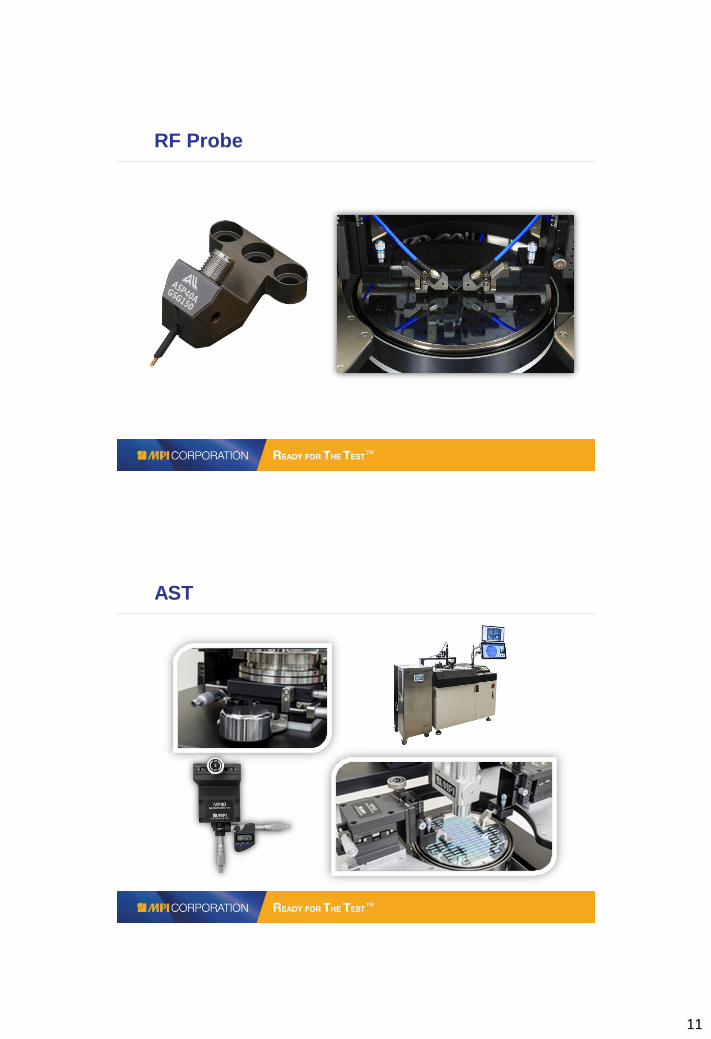
Unit
5 5 3 0 1 3 5
0 2 2
116
11
87
35
5
103
172
45
9
27
9
0
14
2 1 2 3 4 5 1
0
20
40
60
80
100
120
140
160
180
200
Jan Feb Mar Apr May Jun Jul Aug Sep Oct Nov Dec
Taiwan
China
Over Sea
2015 Shipment by Geographic
RF Probe & AST
For J.P. Morgan’s Global TMT Conference 2015 Only
11
RF Probe
AST
12
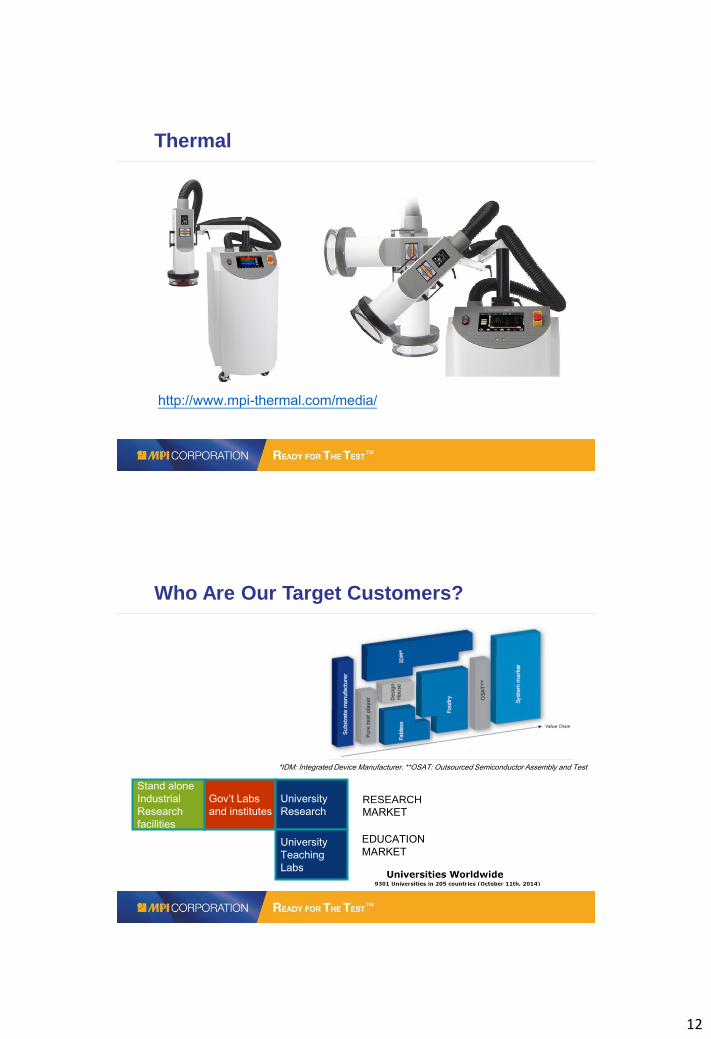
Thermal
http://www.mpi-thermal.com/media/
Who Are Our Target Customers?
*IDM: Integrated Device Manufacturer. **OSAT: Outsourced Semiconductor Assembly and Test
Stand alone
Industrial
Research
facilities
Gov’t Labs
and institutes
University
Research
University
Teaching
Labs
EDUCATION
MARKET
RESEARCH
MARKET
13
Financial Statements
For J.P. Morgan’s Global TMT Conference 2015 Only
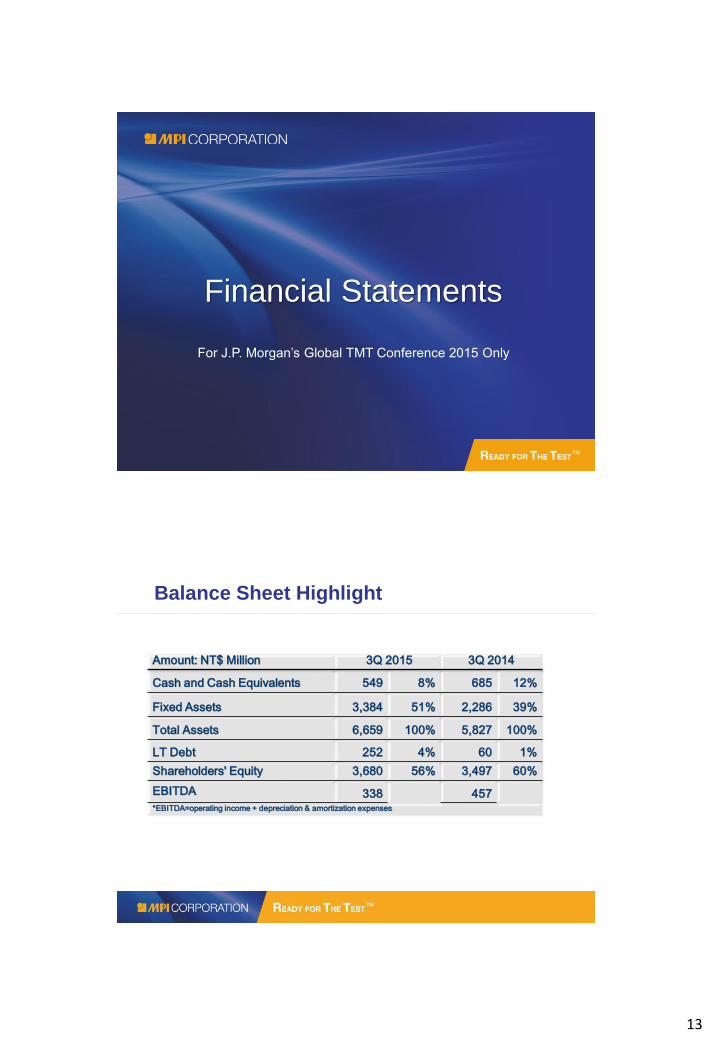
Balance Sheet Highlight
Amount: NT$ Million 3Q 2015 3Q 2014
Cash and Cash Equivalents 549 8% 685 12%
Fixed Assets 3,384 51% 2,286 39%
Total Assets 6,659 100% 5,827 100%
LT Debt 252 4% 60 1%
Shareholders' Equity 3,680 56% 3,497 60%
EBITDA 338 457 *EBITDA=operating income + depreciation & amortization expenses
14
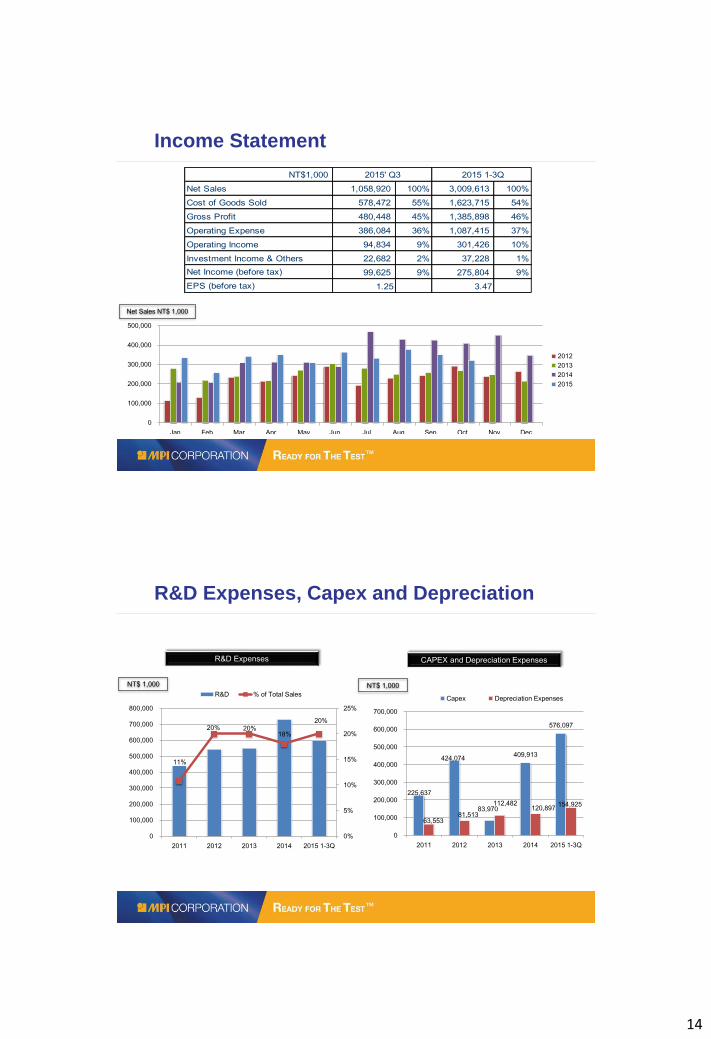
Income Statement
NT$1,000
Net Sales 1,058,920 100% 3,009,613 100%
Cost of Goods Sold 578,472 55% 1,623,715 54%
Gross Profit 480,448 45% 1,385,898 46%
Operating Expense 386,084 36% 1,087,415 37%
Operating Income 94,834 9% 301,426 10%
Investment Income & Others 22,682 2% 37,228 1%
Net Income (before tax) 99,625 9% 275,804 9%
EPS (before tax) 1.25 3.47
2015' Q3 2015 1-3Q
Net Sales NT$ 1,000
0
100,000
200,000
300,000
400,000
500,000
Jan. Feb. Mar. Apr. May Jun. Jul. Aug. Sep. Oct. Nov. Dec.
2012
2013
2014
2015
R&D Expenses, Capex and Depreciation
CAPEX and Depreciation Expenses R&D Expenses
225,637
424,074
83,970
409,913
576,097
63,553 81,513
112,482 120,897
154,925
0
100,000
200,000
300,000
400,000
500,000
600,000
700,000
2011 2012 2013 2014 2015 1-3Q
Capex Depreciation Expenses
11%
20% 20% 18%
20%
0%
5%
10%
15%
20%
25%
0
100,000
200,000
300,000
400,000
500,000
600,000
700,000
800,000
2011 2012 2013 2014 2015 1-3Q
R&D % of Total Sales
NT$ 1,000 NT$ 1,000
15
Thank You
http://www.mpi-corporation.com