Embed Size (px)
Citation preview
M.R. Burleigh 2601/Unit 2
DEPARTMENT OF PHYSICS AND ASTRONOMY
LIFECYCLES OF STARSLIFECYCLES OF STARS
Option 2601Option 2601

M.R. Burleigh 2601/Unit 2
Stellar PhysicsStellar Physics
Unit 1 - Observational properties of Unit 1 - Observational properties of starsstars
Unit 2 - Stellar SpectraUnit 2 - Stellar Spectra Unit 3 - The SunUnit 3 - The Sun Unit 4 - Stellar StructureUnit 4 - Stellar Structure Unit 5 - Stellar EvolutionUnit 5 - Stellar Evolution Unit 6 - Stars of particular interestUnit 6 - Stars of particular interest

M.R. Burleigh 2601/Unit 2
DEPARTMENT OF PHYSICS AND ASTRONOMY
Unit 2Unit 2
Stellar SpectraStellar Spectra

M.R. Burleigh 2601/Unit 2
Unit 1 Slides and NotesUnit 1 Slides and Notes
Reminder, cReminder, can be found at… an be found at… – www.star.le.ac.uk/~mbu/lectures.html
In case of problems see me in lectures In case of problems see me in lectures or email me… [email protected] email me… [email protected]
M.R. Burleigh 2601/Unit 2
Book ChaptersBook Chapters
Zeilik and GregoryZeilik and Gregory– Part II, Chapters 8,10-13,Part II, Chapters 8,10-13,– Part III, Chapters 15-18Part III, Chapters 15-18
PhillipsPhillips– Chapters 1-6 Chapters 1-6
M.R. Burleigh 2601/Unit 2
Stellar SpectraStellar Spectra
Review of atomic physicsReview of atomic physics Absorption and emission processesAbsorption and emission processes Qualitative treatment of spectral line Qualitative treatment of spectral line
formationformation Atmospheric opacityAtmospheric opacity Spectral classification of starsSpectral classification of stars Hertzsprung-Russell diagramHertzsprung-Russell diagram Atmosphere modelsAtmosphere models

M.R. Burleigh 2601/Unit 2
Bohr atom – quantized orbitsBohr atom – quantized orbits
Bohr postulate:Bohr postulate:
Energy of orbits:Energy of orbits: NB. It is –ve NB. It is –ve
i.e. boundi.e. bound
As n As n , E , E 0 0
Basic Atomic PhysicsBasic Atomic Physics

M.R. Burleigh 2601/Unit 2

M.R. Burleigh 2601/Unit 2
Electron transition between orbitsElectron transition between orbits
Emission:Emission: hnEnE ba
Absorption:Absorption: ab nEhnE If nIf naa > n > nbb
Frequency of photon:Frequency of photon:
h
nEnE baab
Quantized RadiationQuantized Radiation
E = hE = h

M.R. Burleigh 2601/Unit 2
Quantized RadiationQuantized Radiation
Emission – transition from higher to Emission – transition from higher to lower orbitlower orbit
Absorption – transition from lower to Absorption – transition from lower to higher orbithigher orbit
1 quantum emitted or absorbed1 quantum emitted or absorbed electron can jump over several levelselectron can jump over several levels Can cascade to lower orbit emitting Can cascade to lower orbit emitting
several photons of intermediate energyseveral photons of intermediate energy

M.R. Burleigh 2601/Unit 2
Example for hydrogenExample for hydrogen
222
42 1'
12
nR
nh
menE
2222
1111'1
abab
ab
ab nnR
nnchR
c
The Rydberg constant The Rydberg constant (10.96776(10.96776mm-1-1))
Example: Lyman seriesExample: Lyman series
Lyman Lyman ::
41
111
R = 1216= 1216Å (121.6nm)Å (121.6nm)

M.R. Burleigh 2601/Unit 2
Important TermsImportant Terms
Bound electrons – in orbits around Bound electrons – in orbits around atomsatoms
Free electrons – not in orbits associated Free electrons – not in orbits associated with individual atomswith individual atoms

M.R. Burleigh 2601/Unit 2
ExcitationExcitation
Atoms can be excited (increase in energy)Atoms can be excited (increase in energy) Radiatively – by absorption of a photonRadiatively – by absorption of a photon Collisional – by a free particle Collisional – by a free particle
(electron/atom)...(electron/atom)...– Returns by emitting a photonReturns by emitting a photon
Line formation – decay of radiatively Line formation – decay of radiatively excited statesexcited states

M.R. Burleigh 2601/Unit 2
De-excitationDe-excitation
Atoms remain excited for very short Atoms remain excited for very short times (~10times (~10-8-8 seconds) seconds)
Atoms always interacting, cause excited Atoms always interacting, cause excited atom to jump spontaneously to lower atom to jump spontaneously to lower levellevel– Radiative de-excitation – emission of Radiative de-excitation – emission of
photonphoton– Collisional de-excitation – colliding particle Collisional de-excitation – colliding particle
gains gains kinetic energykinetic energy

M.R. Burleigh 2601/Unit 2
Liberation of an electron: Liberation of an electron: + energy + energy ++ + e + e--
Energy required = ionisation potentialEnergy required = ionisation potential
e.g. for hydrogen 13.6eV for the ground state:e.g. for hydrogen 13.6eV for the ground state:
eVn
nEEnIP2
6.13
IonizationIonization

M.R. Burleigh 2601/Unit 2
Ion notationIon notation
Chemical notation - Chemical notation - + + or or ++ ++ etc.etc.– but but ++++++++ ++++++++ would be silly!would be silly!
Spectroscopic notation - Spectroscopic notation - (I), (I), (II) (II) etcetc..– e.g. neutral atoms… HI, HeI, CIe.g. neutral atoms… HI, HeI, CI– Singly ionized… HII (HSingly ionized… HII (H++), HeII (He), HeII (He++))– Doubly ionized… CIII (CDoubly ionized… CIII (C++++), NIII), NIII

M.R. Burleigh 2601/Unit 2
SpectraSpectra
Bound transitions Bound transitions absorption at absorption at discrete wavelengths discrete wavelengths series limit series limit– e.g. Lyman (n=1), Balmer (n=2), Paschen e.g. Lyman (n=1), Balmer (n=2), Paschen
(n=3), Brackett (n=4), Ffund (n=5)(n=3), Brackett (n=4), Ffund (n=5)– Lyman limit at 13.6eV = 91.2nmLyman limit at 13.6eV = 91.2nm

M.R. Burleigh 2601/Unit 2

M.R. Burleigh 2601/Unit 2
Spectra of atoms/ionsSpectra of atoms/ions
Very similar except for effects of chargeVery similar except for effects of charge Transitions give rise to emission or Transitions give rise to emission or
absorption features in spectraabsorption features in spectra
222 111
abab nnRZ
Wave numberWave number
Z = value of the ionisation stateZ = value of the ionisation state

M.R. Burleigh 2601/Unit 2
Spectra of moleculesSpectra of molecules
Spectra can arise fromSpectra can arise from
1.1. Electronic energy states from Electronic energy states from combined electron cloudcombined electron cloud
2.2. Internuclear distances quantised into Internuclear distances quantised into “vibrational” energy states“vibrational” energy states
3.3. Quantised rotational energyQuantised rotational energy
Appear as Appear as bandsbands in spectra in spectra

M.R. Burleigh 2601/Unit 2
Equal areas
Equivalent width
0
Pressure Doppler effects in gas
Spectral line intensities – equivalent widthSpectral line intensities – equivalent width
Line strength Line strength area of the line in the plot (absorption) area of the line in the plot (absorption)
This can be represented by ‘equivalent width’This can be represented by ‘equivalent width’
Spectral LinesSpectral Lines

M.R. Burleigh 2601/Unit 2
Mean kinetic energy of a gas particle:Mean kinetic energy of a gas particle:kTmv
23
21 2
Level populations depend upon temperatureLevel populations depend upon temperature
Boltzmann’s equation:Boltzmann’s equation:
kTEE
gg
NN BA
A
B
A
B exp
Excitation equilibriumExcitation equilibrium
NB / NA = excitation ratio
N = number density of state
g = multiplicity
E = energy of level
No of transitions depends on population of energy stateNo of transitions depends on population of energy stateFrom which the transition occursFrom which the transition occurs
Thermal equilibrium Thermal equilibrium mean no of atoms in given states constant mean no of atoms in given states constant
M.R. Burleigh 2601/Unit 2
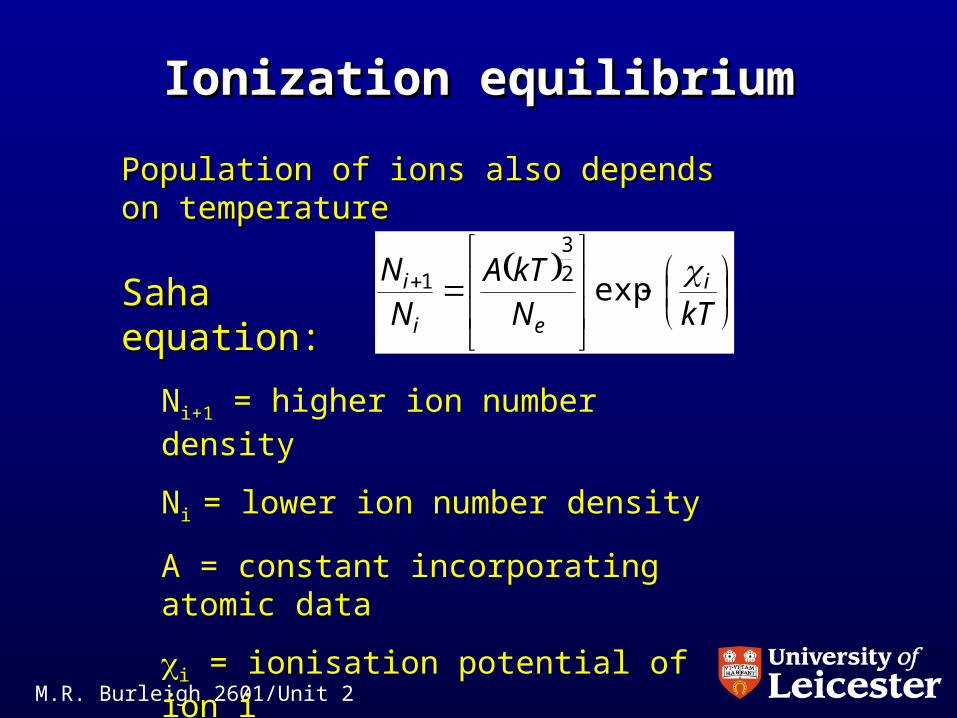
Population of ions also depends on temperaturePopulation of ions also depends on temperature
Saha equation:Saha equation:
kTNkTA
N
N i
ei
i exp
23
1
Ni+1 = higher ion number density
Ni = lower ion number density
A = constant incorporating atomic data
i = ionisation potential of ion i
Ne = electron density
Ionization equilibriumIonization equilibrium

M.R. Burleigh 2601/Unit 2
Local thermodynamic equilibriumLocal thermodynamic equilibrium
Combination of Boltzmann & Saha eqCombination of Boltzmann & Saha eqnsns specify state of gas completelyspecify state of gas completely
Iteration for each state and levelIteration for each state and level Plasma where all populations specified Plasma where all populations specified
by T and Nby T and Nee is said to be in Local is said to be in Local Thermodynamic Equilibrium (LTE)Thermodynamic Equilibrium (LTE)
Often assumed as an approximation in Often assumed as an approximation in atmosphere modellingatmosphere modelling

M.R. Burleigh 2601/Unit 2
Spectral ClassificationSpectral Classification
Division of stars into groups depending upon Division of stars into groups depending upon features in their spectrafeatures in their spectra
Angelo Secchi (1863) found different types, Angelo Secchi (1863) found different types, but ordering difficultbut ordering difficult
Annie J. Cannon (1910) developed Harvard Annie J. Cannon (1910) developed Harvard scheme scheme H Balmer strengths H Balmer strengths
Later re-arranged in order of decreasing Later re-arranged in order of decreasing temperature (see Saha & Boltzman eqtemperature (see Saha & Boltzman eqnsns))

M.R. Burleigh 2601/Unit 2
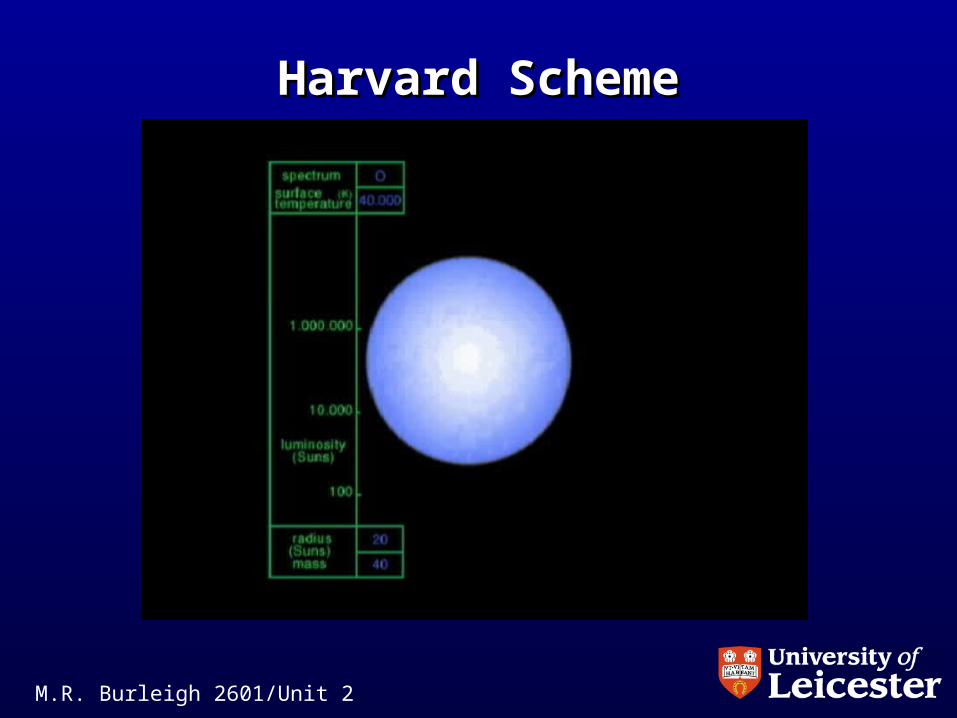
Harvard schemeHarvard scheme
Seven letters – O B A F G K MSeven letters – O B A F G K M (L T) (L T) Each subdivided from 0 to 9Each subdivided from 0 to 9 e.g. Sun has spectral type G2e.g. Sun has spectral type G2
Mnemonic – Only Bold Astronomers Forge Mnemonic – Only Bold Astronomers Forge Great Knowledgeable MindsGreat Knowledgeable Minds
or the 1950s/Katy Perry versionor the 1950s/Katy Perry version
- Oh Be A Fine Girl Kiss Me- Oh Be A Fine Girl Kiss Me
M.R. Burleigh 2601/Unit 2
Harvard SchemeHarvard Scheme

M.R. Burleigh 2601/Unit 2
TypeType ColourColour Approximate Approximate surface surface temperature (K)temperature (K)
Main characteristicsMain characteristics ExamplesExamples
OO BlueBlue > 25,000> 25,000 Singly ionised helium lines either in Singly ionised helium lines either in emission or absorption. Strong ultraviolet emission or absorption. Strong ultraviolet continuum.continuum.
10 Lacertra10 Lacertra
BB BlueBlue 11,000 – 25,00011,000 – 25,000 Neutral helium lines in absorption.Neutral helium lines in absorption. Rigel, SpicaRigel, Spica
AA BlueBlue 7,500 – 11,0007,500 – 11,000 Hydrogen lines at maximum strength for Hydrogen lines at maximum strength for A0 stars, decreasing thereafter.A0 stars, decreasing thereafter.
Sirius, VegaSirius, Vega
FF Blue to Blue to whitewhite
6,000 – 7,5006,000 – 7,500 Metallic lines become noticeable.Metallic lines become noticeable. Canopus, ProcyonCanopus, Procyon
GG White White to to yellowyellow
5,000 – 6,0005,000 – 6,000 Solar-type spectra. Absorption lines of Solar-type spectra. Absorption lines of neutral metallic atoms and ions (e.g. once-neutral metallic atoms and ions (e.g. once-ionised calcium) grow in strength.ionised calcium) grow in strength.
Sun, CapellaSun, Capella
KK OranOrangge e to redto red
3,500 – 5,0003,500 – 5,000 Metallic lines dominate. Weak blue Metallic lines dominate. Weak blue continuum.continuum.
Arcturus, Arcturus, AldebaranAldebaran
MM RedRed < 3,500< 3,500 Molecular bands of titanium oxide Molecular bands of titanium oxide noticeable.noticeable.
Betelgeuse, Betelgeuse, AntaresAntares
Harvard spectral classificationsHarvard spectral classifications
M.R. Burleigh 2601/Unit 2
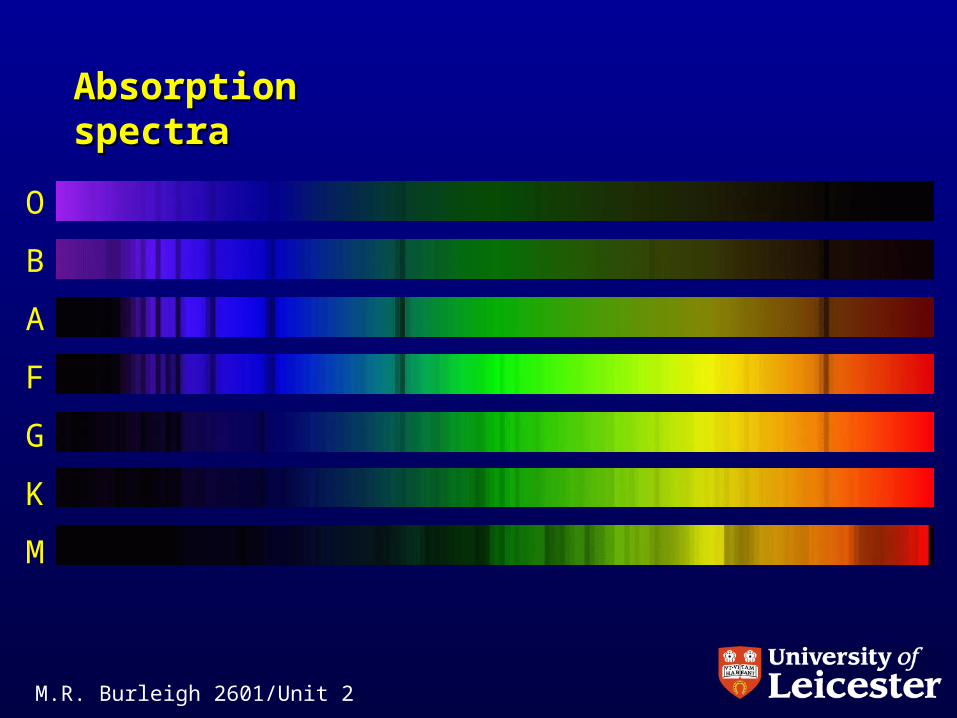
O
B
A
F
G
K
M
Absorption spectraAbsorption spectra

M.R. Burleigh 2601/Unit 2
Stellar spectraStellar spectra

M.R. Burleigh 2601/Unit 2
StellarStellarSpectraSpectra
SpectralSpectralTypeType

M.R. Burleigh 2601/Unit 2
The SunThe Sun
VegaVega
M.R. Burleigh 2601/Unit 2
Luminosity ClassificationLuminosity Classification
Observers noted differences in spectral Observers noted differences in spectral line shapesline shapes
Narrow lines Narrow lines star more luminous star more luminous Morgan & Keenan Morgan & Keenan 6 luminosity 6 luminosity
classesclasses e.g. Sun is a G2 V stare.g. Sun is a G2 V star

M.R. Burleigh 2601/Unit 2
Morgan-Keenan luminosity classesMorgan-Keenan luminosity classes
IaIa Most luminous supergiants.Most luminous supergiants.
IbIb Less luminous supergiants.Less luminous supergiants.
IIII Luminous giants.Luminous giants.
IIIIII Normal giants.Normal giants.
IVIV Subgiants.Subgiants.
VV Main sequence stars Main sequence stars (dwarfs).(dwarfs).

M.R. Burleigh 2601/Unit 2
StellarStellarSpectraSpectra
Luminosity Luminosity ClassClass

M.R. Burleigh 2601/Unit 2
Colour/Magnitude diagramColour/Magnitude diagram
Hertzsprung-Russell (H-R) diagramHertzsprung-Russell (H-R) diagram
1.1. Plot luminosity vs. spectral typePlot luminosity vs. spectral type
2.2. Plot magnitude vs. colour… same idea Plot magnitude vs. colour… same idea but different parametersbut different parameters
– Colour measures changes in spectral Colour measures changes in spectral shapeshape

M.R. Burleigh 2601/Unit 2
H-R diagramH-R diagram

M.R. Burleigh 2601/Unit 2
Bohr postulate: n = 1, 2, 3
Energy of orbits:
Transition wavelength:
R = Rydberg constant = 10.96776m-1
2h
nmvr
22
2422
hn
ZmenE
22
111
abab nnR
Important equationsImportant equations
M.R. Burleigh 2601/Unit 2
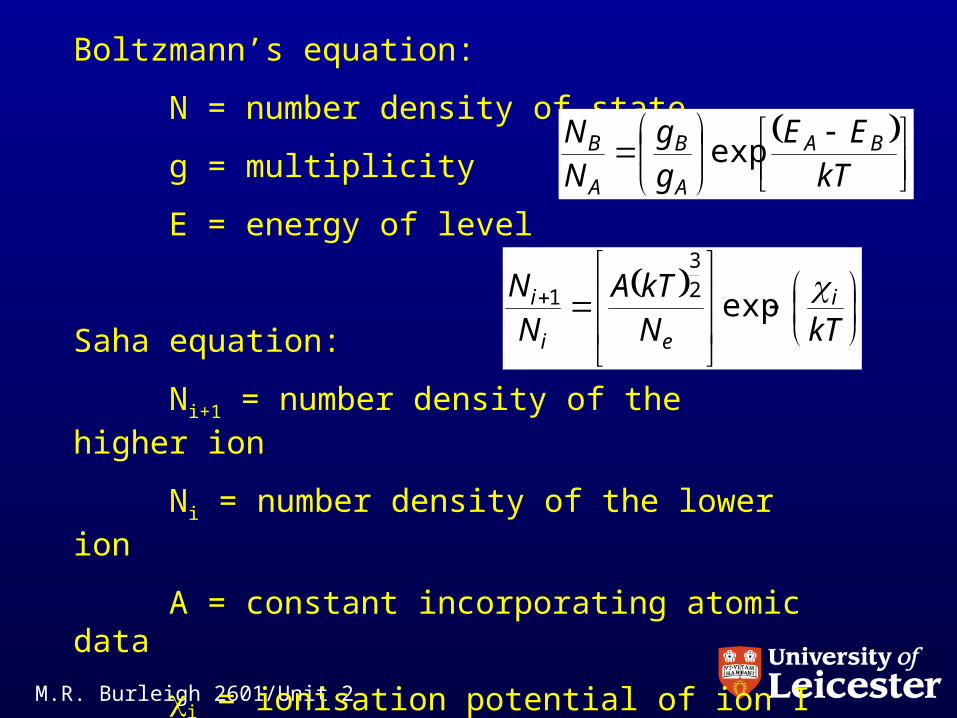
Boltzmann’s equation:
N = number density of state
g = multiplicity
E = energy of level
Saha equation:
Ni+1 = number density of the higher ion
Ni = number density of the lower ion
A = constant incorporating atomic data
i = ionisation potential of ion I
Ne = electron density
kTEE
gg
NN BA
A
B
A
B exp
kTNkTA
N
N i
ei
i exp
23
1

M.R. Burleigh 2601/Unit 2
Flux is constant:
Equation of radiative transfer:
= Rosseland mean opacity
Scale height of the atmosphere is << R*, so we can represent the atmosphere as a plane parallel layer of infinite extent
4effTF
dr
dTTr
rrrL 32
364
Atmosphere ModelsAtmosphere Models

M.R. Burleigh 2601/Unit 2
Flux equation: 4Td
rdPc
= optical depth
h > 0
h = 0
= 0
> 0
d > 0

M.R. Burleigh 2601/Unit 2
Flux is constant so we can integrate:
qTc
rP eff 4
Constant
Calculate q from the boundary conditions:
P(r) = P(r = surface) at = 0
surfacePT
cq
eff4

M.R. Burleigh 2601/Unit 2
Assume that locally the radiation field is a Planck function. At the stellar surface, radiation outflow is in one direction – outwards. Surface radiation pressure is half that given by the Planck formula.
32
32 4 qTc
surfaceP eff
and: 1st simple model equation
32
43 44 effTT
This gives T as a function of (Rosseland mean optical depth)
Note:Note: 1)1) TTeffeff is T at is T at = 2/3 = 2/3
andand 2)2) T(0) = TT(0) = Teffeff / 2 / 21/41/4 = 0.841 T = 0.841 Teffeff
Surface

M.R. Burleigh 2601/Unit 2
To complete the model add hydrostatic equilibrium to find pressure and density distribution:
2r
rGMdhdP
Variation in h is small compared to R
Matm << M M(r) = M and r = R
gR
MGdhdP
2
Surface gravityAnd dividing by gives:
g
ddP

M.R. Burleigh 2601/Unit 2
INITIAL MODEL e.g. Grey approximation
CALCULATE ION AND LEVEL POPULATIONS i.e. solve Saha-Boltzmann equations
CALCULATE RADIATIVE TRANSFER
DETERMINE NEW TEMPERATURE STRUCTURE
SOLVE EQUATION OF HYDROSTATIC EQUILIBRIUM
COMPARE NEW MODEL WITH OLD
LOOP BACK
END
Schematic model atmosphere calculation
T, structure
If differences are small
If differences are large i.e. > some limit

M.R. Burleigh 2601/Unit 2
Stellar SpectraStellar Spectra
Review of atomic physicsReview of atomic physics Absorption and emission processesAbsorption and emission processes Qualitative treatment of spectral line Qualitative treatment of spectral line
formationformation Atmospheric opacityAtmospheric opacity Spectral classification of starsSpectral classification of stars Hertzsprung-Russell diagramHertzsprung-Russell diagram Atmosphere modelsAtmosphere models

M.R. Burleigh 2601/Unit 2
DEPARTMENT OF PHYSICS AND ASTRONOMY
Unit 2Unit 2
Stellar SpectraStellar Spectra

M.R. Burleigh 2601/Unit 2
DEPARTMENT OF PHYSICS AND ASTRONOMY
LIFECYCLES OF STARSLIFECYCLES OF STARS
Option 2601Option 2601