Embed Size (px)
Citation preview
Multi-asset innovationUBS Market Pioneers Index
Not a solicitation or offer to buy or sell any securities or other financial instruments.
2
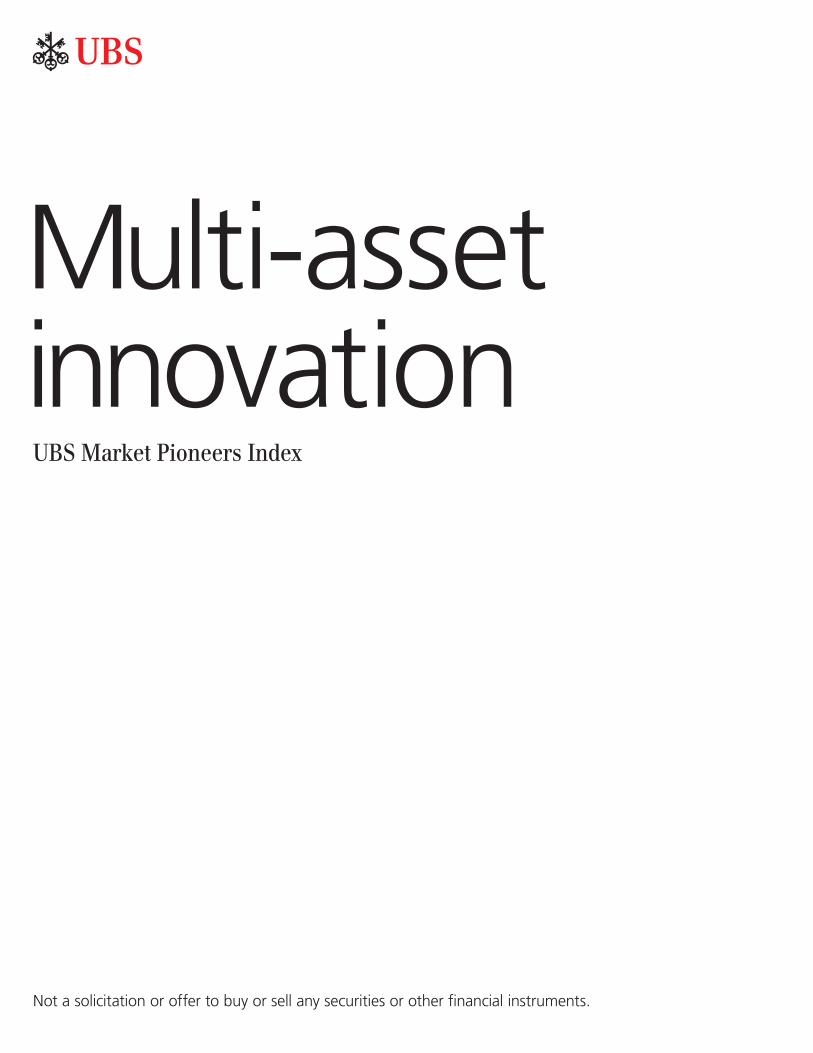
Capturing the benefits of a multi-asset allocationWhy choose a multi-asset class indexing strategy?For individuals approaching and in retirement, managing market volatility, capturing harder-to-find excess return and outpacing inflation are all critical concerns. Adding risk-focused strategies to a portfolio can help individuals address these concerns, offering a range of potential long-term benefits.
Low-correlation to traditional buy and
hold investment strategies
Designed to minimize volatility
Alternative sources of income
Potential hedge against inflation
3
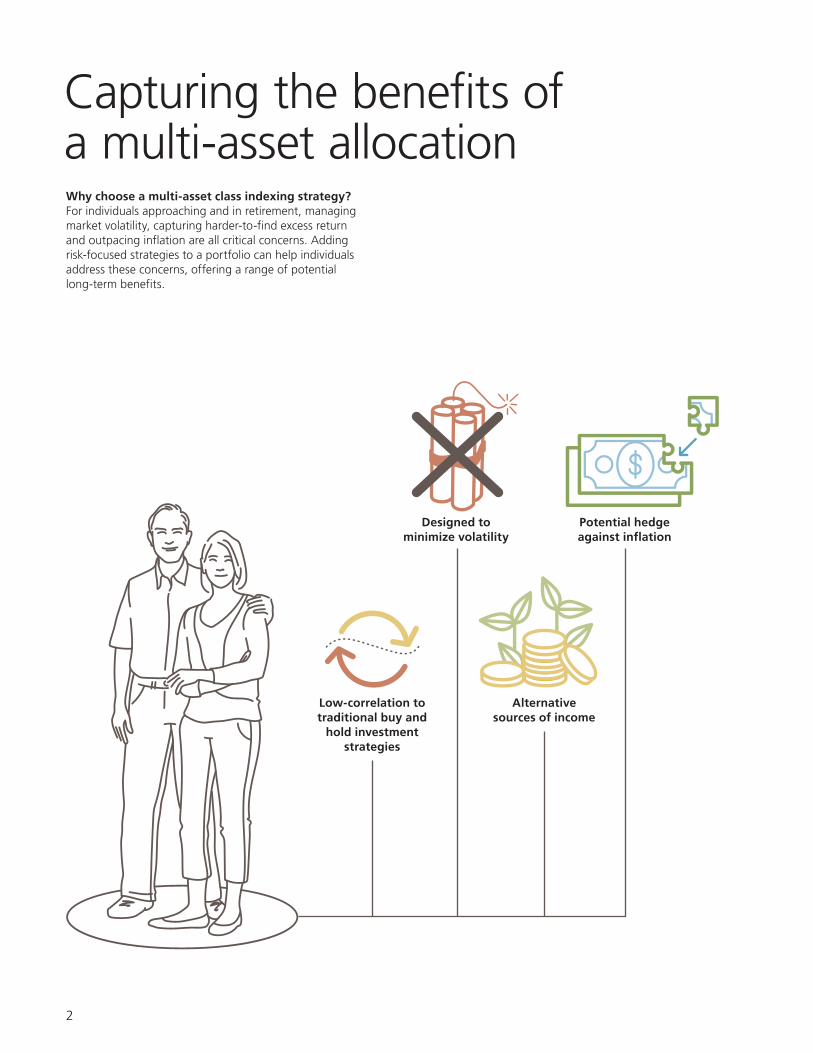
UBS Market Pioneers IndexWe brought together two great minds to build a singular strategy. Roger Ibbotson and Jim Rogers share a legacy of innovation and a common sense market outlook. Each of these market pioneers has a distinct perspective and unique approach that complements the other.
Deep market insight
+Decades of
investing experience+
Strategic and tactical expertise
=
UBS Market Pioneers
IndexJim Rogers
Founder of the Rogers International Commodity Index (RICI)
40-year market veteran
Guinness World Record-holding global traveler
B.A., Yale University and Oxford
Author of several best-selling books, including:
– Street Smarts (2013)
– A Bull in China: Investing Profitably in the World's Greatest Market (2007)
– Hot Commodities: How Anyone Can Invest Profitably (2004)
– Adventure Capitalist: The Ultimate Road Trip (2003)
– Investment Biker: Around the World with Jim Rogers (1994)
A pioneer in global investing
Roger Ibbotson, PhD
Chairman and CIO of Zebra Capital Management
Founder and former chairman of Ibbotson Associates
Former Executive Director of the Center for Research in Security Prices (CRSP)
Professor Emeritus of Finance, Yale University
PhD, University of Chicago
Co-author of Stocks, Bonds, Bills, and Inflation, the standard reference book for market performance and characteristics (Updated annually)
Nine time winner of CFA's Graham and Dodd Award
A pioneer in bridging academic research and industry practice on asset allocation
Illustration credit: Jim Rogers: James Williams, Face to Face, FT.com, 01 April 2016. Roger Ibbotson: Sophia Grene, Face to Face, FT.com, 04 March 2016 © The Financial Times Limited 2016. All Rights Reserved.
4
A new way to think about equity allocation
“Avoiding popularity rewards the investor who has longer horizons—and is willing to be contrarian.”
Roger Ibbotson
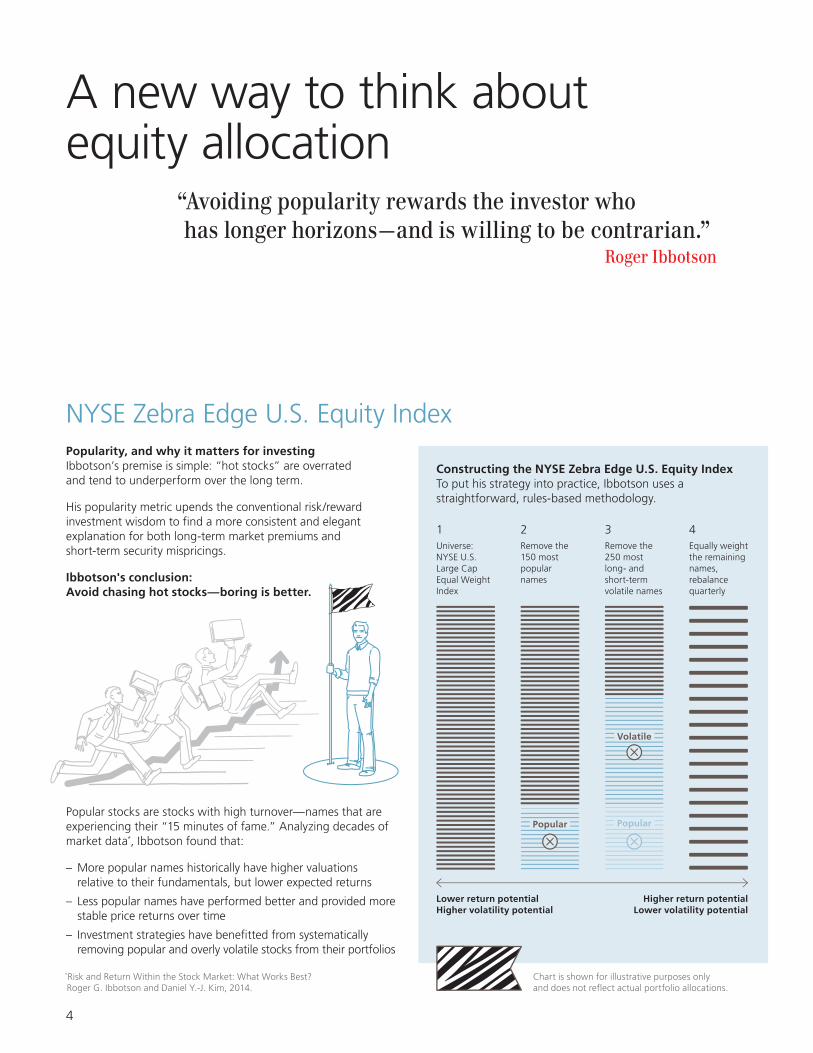
NYSE Zebra Edge U.S. Equity IndexPopularity, and why it matters for investing Ibbotson’s premise is simple: “hot stocks” are overrated and tend to underperform over the long term.
His popularity metric upends the conventional risk/reward investment wisdom to find a more consistent and elegant explanation for both long-term market premiums andshort-term security mispricings.
Ibbotson's conclusion: Avoid chasing hot stocks—boring is better.
Popular stocks are stocks with high turnover—names that are experiencing their “15 minutes of fame.” Analyzing decades of market data*, Ibbotson found that:
– More popular names historically have higher valuations relative to their fundamentals, but lower expected returns
– Less popular names have performed better and provided more stable price returns over time
– Investment strategies have benefi tted from systematically removing popular and overly volatile stocks from their portfolios
Constructing the NYSE Zebra Edge U.S. Equity IndexTo put his strategy into practice, Ibbotson uses a straightforward, rules-based methodology.
Popular Popular
Volatile
1 2 3 4Universe: NYSE U.S. Large Cap Equal Weight Index
Remove the 250 most long- and short-term volatile names
Remove the 150 most popular names
Equally weight the remaining names, rebalance quarterly
Lower return potentialHigher volatility potential
Higher return potentialLower volatility potential
*Risk and Return Within the Stock Market: What Works Best?Roger G. Ibbotson and Daniel Y.-J. Kim, 2014.
Chart is shown for illustrative purposes only and does not reflect actual portfolio allocations.
5
Taking a common sense approach to commodities
“Commodities are real things that are always likely to be worth something to somebody.”
Jim Rogers
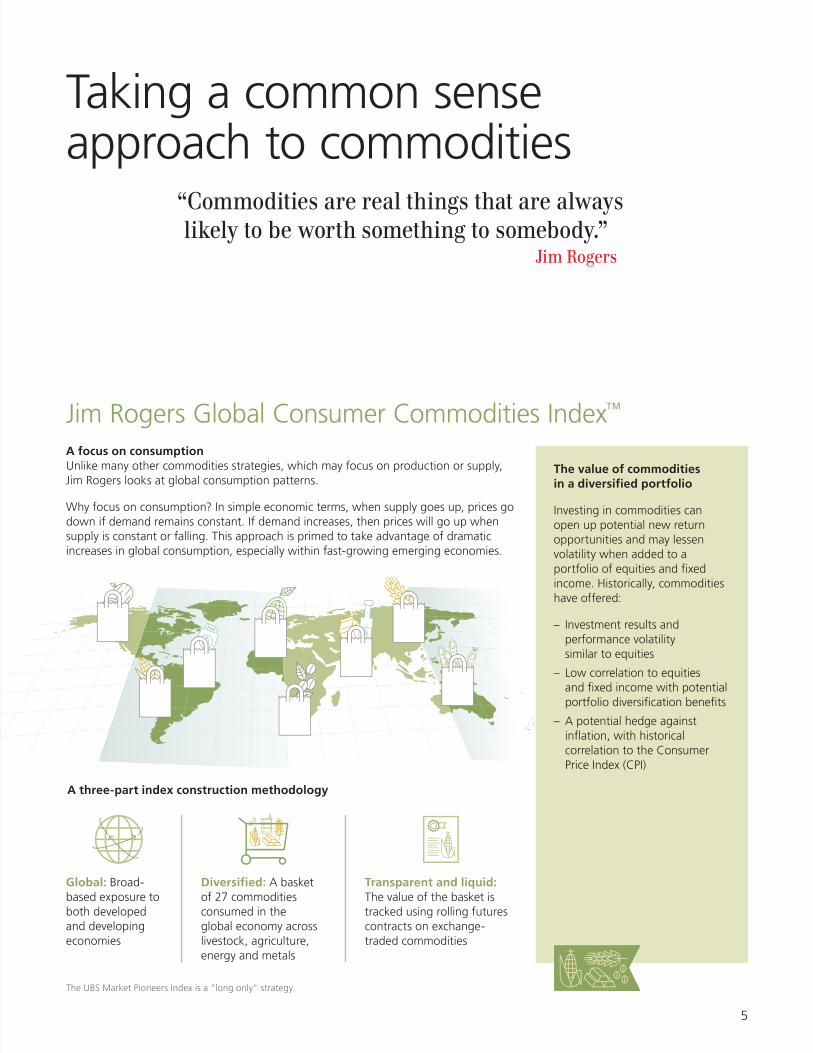
Jim Rogers Global Consumer Commodities Index™
A focus on consumptionUnlike many other commodities strategies, which may focus on production or supply, Jim Rogers looks at global consumption patterns.
Why focus on consumption? In simple economic terms, when supply goes up, prices go down if demand remains constant. If demand increases, then prices will go up when supply is constant or falling. This approach is primed to take advantage of dramatic increases in global consumption, especially within fast-growing emerging economies.
Transparent and liquid: The value of the basket is tracked using rolling futures contracts on exchange-traded commodities
Diversified: A basket of 27 commodities consumed in the global economy across livestock, agriculture, energy and metals
Global: Broad-based exposure to both developed and developing economies
The value of commodities in a diversified portfolio
Investing in commodities can open up potential new return opportunities and may lessen volatility when added to a portfolio of equities and fixed income. Historically, commodities have offered:
– Investment results and performance volatility similar to equities
– Low correlation to equities and fi xed income with potential portfolio diversifi cation benefi ts
– A potential hedge against infl ation, with historical correlation to the Consumer Price Index (CPI)
A three-part index construction methodology
The UBS Market Pioneers Index is a "long only" strategy.
6
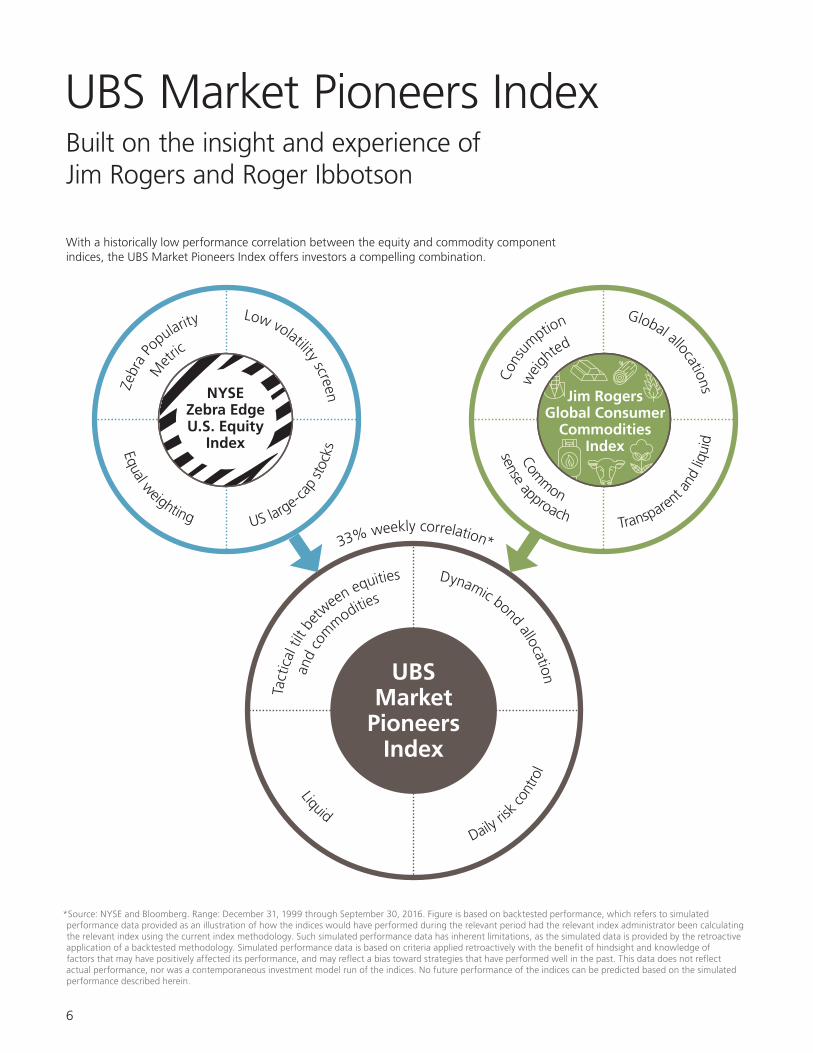
UBS Market Pioneers Index
With a historically low performance correlation between the equity and commodity component indices, the UBS Market Pioneers Index offers investors a compelling combination.
UBS Market
Pioneers Index
Tact
ical
tilt
be
twee
n equities Dynamic bond allocation
Daily ris
k con
trol
Liquid
and
com
modities
US large-c
ap st
ocks
Zebr
a Po
pularityLow volatility screen
Equal w
eighting
Met
ric
NYSE Zebra Edge U.S. Equity
Index
Con
su
mption Global allocations
sense approachTranspare
nt a
nd li
quid
Com
mon
wei
ghted
Jim Rogers Global Consumer
Commodities Index
Built on the insight and experience of Jim Rogers and Roger Ibbotson
33% weekly correlation*
*Source: NYSE and Bloomberg. Range: December 31, 1999 through September 30, 2016. Figure is based on backtested performance, which refers to simulated performance data provided as an illustration of how the indices would have performed during the relevant period had the relevant index administrator been calculating the relevant index using the current index methodology. Such simulated performance data has inherent limitations, as the simulated data is provided by the retroactive application of a backtested methodology. Simulated performance data is based on criteria applied retroactively with the benefit of hindsight and knowledge of factors that may have positively affected its performance, and may reflect a bias toward strategies that have performed well in the past. This data does not reflect actual performance, nor was a contemporaneous investment model run of the indices. No future performance of the indices can be predicted based on the simulated performance described herein.
7
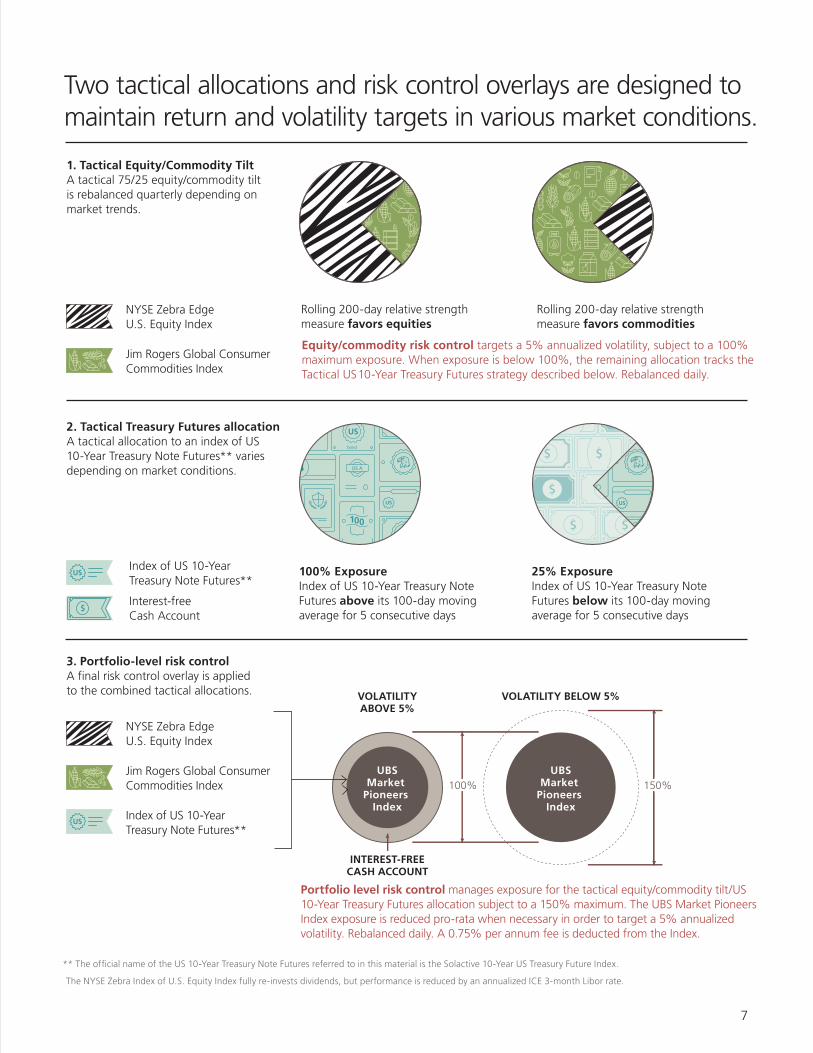
VOLATILITY VOLATILITY BELOW 5%ABOVE 5%
100% 150%
INTEREST-FREECASH ACCOUNT
UBSMarket
Pioneers Index
UBSMarket
Pioneers Index
bond
US A A
Two tactical allocations and risk control overlays are designed to maintain return and volatility targets in various market conditions.
100% Exposure Index of US 10-Year Treasury Note Futures above its 100-day moving average for 5 consecutive days
25% Exposure Index of US 10-Year Treasury Note Futures below its 100-day moving average for 5 consecutive days
Rolling 200-day relative strength measure favors commodities
Rolling 200-day relative strength measure favors equities
** The official name of the US 10-Year Treasury Note Futures referred to in this material is the Solactive 10-Year US Treasury Future Index.
The NYSE Zebra Index of U.S. Equity Index fully re-invests dividends, but performance is reduced by an annualized ICE 3-month Libor rate.
Jim Rogers Global Consumer Commodities Index
NYSE Zebra Edge U.S. Equity Index
Index of US 10-Year Treasury Note Futures**
Jim Rogers Global Consumer Commodities Index
NYSE Zebra Edge U.S. Equity Index
Index of US 10-Year Treasury Note Futures**
Interest-free Cash Account
Equity/commodity risk control targets a 5% annualized volatility, subject to a 100% maximum exposure. When exposure is below 100%, the remaining allocation tracks the Tactical US 10-Year Treasury Futures strategy described below. Rebalanced daily.
1. Tactical Equity/Commodity Tilt A tactical 75/25 equity/commodity tilt is rebalanced quarterly depending on market trends.
3. Portfolio-level risk control A final risk control overlay is applied to the combined tactical allocations.
2. Tactical Treasury Futures allocation A tactical allocation to an index of US 10-Year Treasury Note Futures** varies depending on market conditions.
Portfolio level risk control manages exposure for the tactical equity/commodity tilt/US 10-Year Treasury Futures allocation subject to a 150% maximum. The UBS Market Pioneers Index exposure is reduced pro-rata when necessary in order to target a 5% annualized volatility. Rebalanced daily. A 0.75% per annum fee is deducted from the Index.
8
Backtested Performance
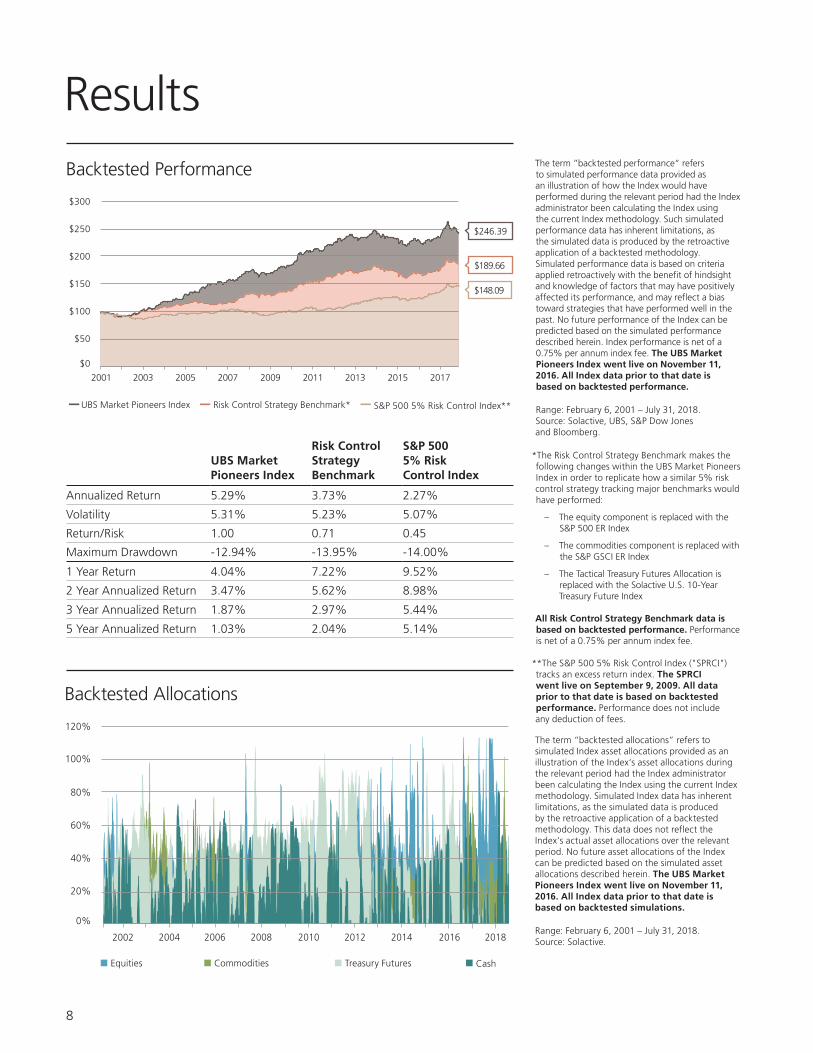
ResultsThe term ”backtested performance“ refers to simulated performance data provided as an illustration of how the Index would have performed during the relevant period had the Index administrator been calculating the Index using the current Index methodology. Such simulated performance data has inherent limitations, as the simulated data is produced by the retroactive application of a backtested methodology. Simulated performance data is based on criteria applied retroactively with the benefit of hindsight and knowledge of factors that may have positively affected its performance, and may reflect a bias toward strategies that have performed well in the past. No future performance of the Index can be predicted based on the simulated performance described herein. Index performance is net of a 0.75% per annum index fee. The UBS Market Pioneers Index went live on November 11, 2016. All Index data prior to that date is based on backtested performance.
Range: February 6, 2001 – July 31, 2018. Source: Solactive, UBS, S&P Dow Jones and Bloomberg.
*The Risk Control Strategy Benchmark makes the following changes within the UBS Market Pioneers Index in order to replicate how a similar 5% risk control strategy tracking major benchmarks would have performed:
– The equity component is replaced with the S&P 500 ER Index
– The commodities component is replaced with the S&P GSCI ER Index
– The Tactical Treasury Futures Allocation is replaced with the Solactive U.S. 10-Year Treasury Future Index
All Risk Control Strategy Benchmark data is based on backtested performance. Performance is net of a 0.75% per annum index fee.
**The S&P 500 5% Risk Control Index ("SPRCI") tracks an excess return index. The SPRCI went live on September 9, 2009. All data prior to that date is based on backtested performance. Performance does not include any deduction of fees.
The term “backtested allocations” refers to simulated Index asset allocations provided as an illustration of the Index‘s asset allocations during the relevant period had the Index administrator been calculating the Index using the current Index methodology. Simulated Index data has inherent limitations, as the simulated data is produced by the retroactive application of a backtested methodology. This data does not reflect the Index‘s actual asset allocations over the relevant period. No future asset allocations of the Index can be predicted based on the simulated asset allocations described herein. The UBS Market Pioneers Index went live on November 11, 2016. All Index data prior to that date is based on backtested simulations.
Range: February 6, 2001 – July 31, 2018. Source: Solactive.
Backtested Allocations
20172015201320112009200720032001
$0
$50
$100
$150
$200
$250
$300
2005
$246.39
$189.66
UBS Market Pioneers Index Risk Control Strategy Benchmark* S&P 500 5% Risk Control Index**
$148.09
Equities Commodities Treasury Futures Cash
0%
20%
40%
60%
80%
100%
120%
2002 2004 2006 2008 2010 2012 2014 2016 2018
UBS Market Pioneers Index
Risk Control Strategy Benchmark
S&P 500 5% Risk Control Index
Annualized Return 5.29% 3.73% 2.27%
Volatility 5.31% 5.23% 5.07%
Return/Risk 1.00 0.71 0.45
Maximum Drawdown -12.94% -13.95% -14.00%
1 Year Return 4.04% 7.22% 9.52%
2 Year Annualized Return 3.47% 5.62% 8.98%
3 Year Annualized Return 1.87% 2.97% 5.44%
5 Year Annualized Return 1.03% 2.04% 5.14%
9
Selected Risk ConsiderationsUBS Market Pioneers Index
– The Index is not guaranteed to succeed at meeting its objectives.
– The Index has exposure to equities, commodities and fixed income markets.
– Financial products linked to the Index will be exposed to the risks of those products.
– Relative strength and trend-following strategies could underperform in a choppy or range bound market.
– The Index relies on risk control methodology, and could underperform indices that do not have a risk control overlay.
– Changes in allocations between equities, commodities and US 10-Year Treasury Futures are based on rolling historical market data.
– The Index is an excess return index and will not earn any cash re-investment return.
– The Index has a limited operating history and may perform in unanticipated ways.
– Backtested performance and backtested allocations of the Index should not be taken as an indication of the future performance of, or future allocations of, the Index.
– Index performance is reduced by a 0.75% per annum index fee.
NYSE Zebra Edge U.S. Equity Index
– Exposure to equities market risk.
– Applying a volatility and popularity filter may cause the index to underperform other indexing strategies.
– Equal weighting of equity index components may underperform indices that use other weighting methodologies.
– Excess return indices will underperform if 3-month Libor rates experience a significant and consistent increase.
– The NYSE Zebra Edge U.S. Equity Index fully reinvests dividends, but performance is reduced by an annualized ICE 3-month Libor rate.
Jim Rogers Global Consumer Commodities Index
– The Jim Rogers Global Consumer Commodities Index weights commodities based on global consumption patterns. In certain market environments, a consumption weighted index may underperform indices that utilize other component weighting methodologies.
– The Jim Rogers Global Consumer Commodities Index tracks commodities with further dated maturities. This enhanced roll methodology may cause the index to underperform indices or strategies that are composed of commodity futures with shorter-dated maturities.
– Commodity indexes may lose value for the following reasons:
– The effects of weather.
– The impact of government programs and policies.
– National and international political, military, or economic events.
– Increases in interest and exchange rates and other factors that may affect the supply of and demand for global commodities.
– Strategies linked to commodity indices composed of futures contracts, such as the Jim Rogers Global Consumer Commodities Index, may be impacted by the following:
– Storage costs
– Interest rates
– Seasonality
– Cost to roll futures US 10-Year Treasury Note Futures Index
– Subject to interest rate risk.
– May be impacted by cost to roll futures.
– The index is an excess return index and does not include exposure to an interest-bearing cash account.
10
These materials are issued by UBS AG and/or its subsidiaries and/or its affiliates (“UBS”).
These materials are for distribution only under such circumstances as may be permitted by applicable law. They have not been prepared with regard to the specific investment objectives, financial situation or particular needs of any specific recipient. They are published solely for informational purposes and are not to be construed as a solicitation or an offer to buy or sell any securities or related financial instruments or to participate in any particular trading strategy. Options, derivative products and futures are not suitable for all investors, and trading in these instruments is considered risky. The recipient should not construe the contents of these materials as legal, tax, accounting, regulatory, or other specialist or technical advice or services or investment advice or a personal recommendation. Foreign currency rates of exchange may adversely affect the value, price or income of any security or related instrument mentioned in these materials. No representation or warranty, either express or implied, is provided in relation to the accuracy, completeness or reliability of the information contained herein except with respect to information concerning UBS, nor is it intended to be a complete statement or summary of the securities markets or developments referred to in these materials or a guarantee that the services described herein comply with all applicable laws, rules and regulations. They should not be regarded by recipients as a substitute for the exercise of their own judgment. Any opinions expressed in these materials are subject to change without notice and may differ or be contrary to opinions expressed by other business areas or groups of UBS as a result of using different assumptions and criteria. UBS is under no obligation to update or keep current the information contained herein, and past performance is not necessarily indicative of future results. UBS, its directors, officers, employees or clients may have or have had interest or long or short positions in the securities or other financial instruments referred to herein and may at any time make purchases and/or sales in them as principal or agent. UBS may act or have acted as market-maker in the securities or other financial instruments discussed in these materials. Furthermore, UBS may have or have had a relationship with or may provide or have provided investment banking, capital markets and/or other financial services to the relevant companies. Neither UBS nor any of its directors, officers, employees or agents accepts any liability for any loss or damage arising out of the use of all or any part of these materials or reliance upon the information contained herein. Additional information may be made available upon request. Clients wishing to effect transactions should contact their local sales representative.
Backtesting: This material contains backtested performance data and other data (such as simulated Index asset allocations) derived from backtesting. The terms “backtested performance,” “backtesting,” and “backtested” refer to simulated performance or other related data provided as an illustration of how the Index would have performed during the relevant period had the index administrator, sponsor or other relevant person or entity been calculating the Index using the current Index methodology. Such simulated performance data has inherent limitations, as the simulated data is produced by the retroactive application of a backtested methodology. Simulated performance data is based on criteria applied retroactively with the benefit of hindsight and knowledge of factors that may have positively affected its performance, and may reflect a bias toward strategies that have performed well in the past. Backtested performance data and backtested asset allocations do not reflect actual performance or actual asset allocations of the Index. No future performance of any index or strategy, including the Index, can be predicted based on the simulated performance described in this material.
Disclaimer
The UBS Market Pioneers Index (the “Index”) is a risk-controlled composite index developed by UBS AG based in part on the non-risk-controlled NYSE® Zebra EdgeTM U.S. Equity Index (the “NYSE Zebra Edge U.S. Equity Index”) and the non-risk-controlled Jim Rogers Global Consumer Commodities IndexTM (the “Jim Rogers Index”).
UBS owns or otherwise has the rights to license all intellectual property and other property rights to the Index, which is being used by Security Benefit Life Insurance Company (“SBL”) under license from UBS AG.
The mark NYSE® is a registered trademark of NYSE Group, Inc. (together with its subsidiaries and affiliates, “NYSE”), Intercontinental Exchange, Inc. (“ICE”) or their affiliates and is being used by permission under license.
The marks Zebra® and Zebra EdgeTM are trademarks of Zebra Capital Management, LLC (together with its subsidiaries and affiliates, "Zebra") and are being used by permission under license.
The names Jim Rogers, James Beeland Rogers, Jr., Rogers, and Jim Rogers Global Consumer Commodities Index are trademarks, service marks and/or registered trademarks owned by Gladys Holdings, LLC or its affiliate Beeland Interests, Inc. (together with their subsidiaries and affiliates, “Gladys”), and are being used by permission under license. The personal names and likeness of Jim Rogers/James Beeland Rogers, Jr. are owned and licensed by James Beeland Rogers, Jr.
ICE / NYSE Group, Inc. owns all intellectual and other property rights to the NYSE Zebra Edge U.S. Equity Index, excluding the concept, methodology, formulas and algorithms for such index. Zebra Capital Management, LLC owns all intellectual and other property rights to the concept, methodology, formulas and algorithms for the NYSE Zebra Edge U.S. Equity Index, which are being used by NYSE Group, Inc. under license from Zebra Capital Management, LLC. The NYSE Zebra Edge U.S. Equity Index has been licensed by NYSE Group, Inc. to UBS for use in the Index.
Gladys owns or otherwise has the rights to license all intellectual property and other property rights to the Jim Rogers Index, which has been licensed by Gladys to UBS for use in the Index.
The Index and other information disseminated concerning the Index are for informational purposes only, are provided on an “as is” basis, and are not intended for trading purposes. Neither SBL nor Select Benefit Annuity (the “Product”) is sponsored, operated, endorsed, recommended, sold or promoted by Zebra, NYSE, UBS, Gladys or Solactive AG, the index administrator for the Index (“Solactive”). None of Zebra, NYSE, UBS, Gladys or Solactive makes any representation or gives any warranty, express or implied, regarding the advisability or possible benefits of purchasing the Product or any other financial product. Clients should undertake their own due diligence and seek appropriate professional advice before purchasing any financial product, including the Product.
None of Zebra, NYSE, UBS, Gladys or Solactive or their respective licensors makes any warranty, express or implied, as to, without limitation, (i) the correctness, accuracy, reliability or other characteristics of the Index, (ii) the results to be obtained by any person or entity from the use of the Index or the Index trademark for any purpose, or (iii) relating to the use of the Index and other information covered by the Product, including, but not limited to, express or implied warranties of merchantability, fitness for a particular purpose or use, title or non-infringement. None of Zebra, NYSE, UBS or Solactive warrants that the
11
Index will be uninterrupted and they are not under any obligation to continue compiling, calculating, maintaining or sponsoring the Index.
The Index (including the concept, methodology, formulas and algorithms therefor) has been designed and is compiled, calculated, maintained and sponsored without regard to any financial products that reference the Index (including the Product), any licensee, sub-licensor or sub-licensee of the Index, any client or any other person. Zebra, NYSE, UBS and Gladys may independently issue and/or sponsor other indices and products that are similar to and/or may compete with the Index and the Product. Zebra, NYSE, UBS and Gladys may also transact in assets referenced in the Index ("Index Components") or in financial instruments such as derivatives that reference those assets or related assets ("Index Related Instruments"). In addition, UBS may enter into transactions with Index licensees or their affiliates intended to hedge such licensees' obligations under any Product and UBS may transact in Index Components and/or Related Instruments in connection with such hedging transactions. Any such transactions by Zebra, NYSE, UBS or Gladys could have a positive or negative effect on the value of the Index and any Product.
An annual index cost is deducted from the Index on a daily basis when calculating the Index value. The annual index cost, which funds certain operational and licensing costs for the Index, reduces the Index value, which will affect the return of the Index and impact the potential interest credited to the Product.
None of Zebra, NYSE, UBS, Gladys or Solactive shall bear any responsibility or liability, whether for negligence or otherwise, with respect to (i) any inaccuracies, omissions, mistakes or errors in the concept, methodology, formulas or algorithms for, or computation of, the Index (and shall not be obligated to advise any person of and/or to correct any such inaccuracies, omissions, mistakes or errors), (ii) the use of and/or reference to the Index by Zebra, NYSE, UBS, Gladys or any other person in connection with any financial product or otherwise, or (iii) any economic or other loss which may be directly or indirectly sustained by any client or other person dealing with any such financial product or otherwise. Any client or other person dealing with such financial products does so, therefore, in full knowledge of this disclaimer and can place no reliance whatsoever on Zebra, NYSE, UBS, Gladys or Solactive nor bring claims, actions or legal proceedings in any manner whatsoever against any of them.
UBS specifically prohibits the redistribution or reproduction of this material in whole or in part without the prior written permission of UBS and UBS accepts no liability whatsoever for the actions of third parties in this respect. © UBS 2018. The key symbol and UBS are among the registered and unregistered trademarks of UBS. Other marks may be trademarks of their respective owners. All rights reserved.
© U
BS 2
018.
The
key
sym
bol a
nd U
BS a
re a
mon
g th
e re
gist
ered
and
unr
egis
tere
d tr
adem
arks
of
UBS
. All
right
s re
serv
ed.
ubsmarketpioneers.com
Ticker: UBSMPI