Embed Size (px)
Citation preview
Multi-cost Routing and its use in
Wireless Ad-Hoc
Optical Burst Switched
Max-Min Fair Share
Networks
Manos VarvarigosUniversity of Patras Greece
Multi-cost Routing
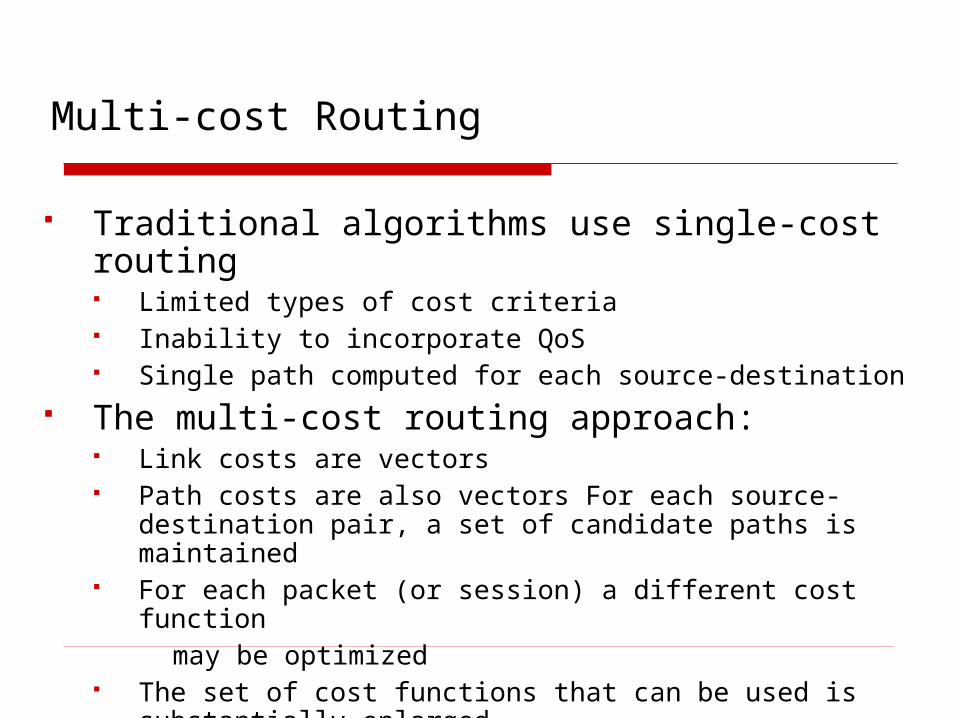
Traditional algorithms use single-cost routing Limited types of cost criteria Inability to incorporate QoS Single path computed for each source-destination
The multi-cost routing approach Link costs are vectors Path costs are also vectors For each source-destination
pair a set of candidate paths is maintained For each packet (or session) a different cost function may be optimized The set of cost functions that can be used is substantially
enlarged
Multi-cost Routing
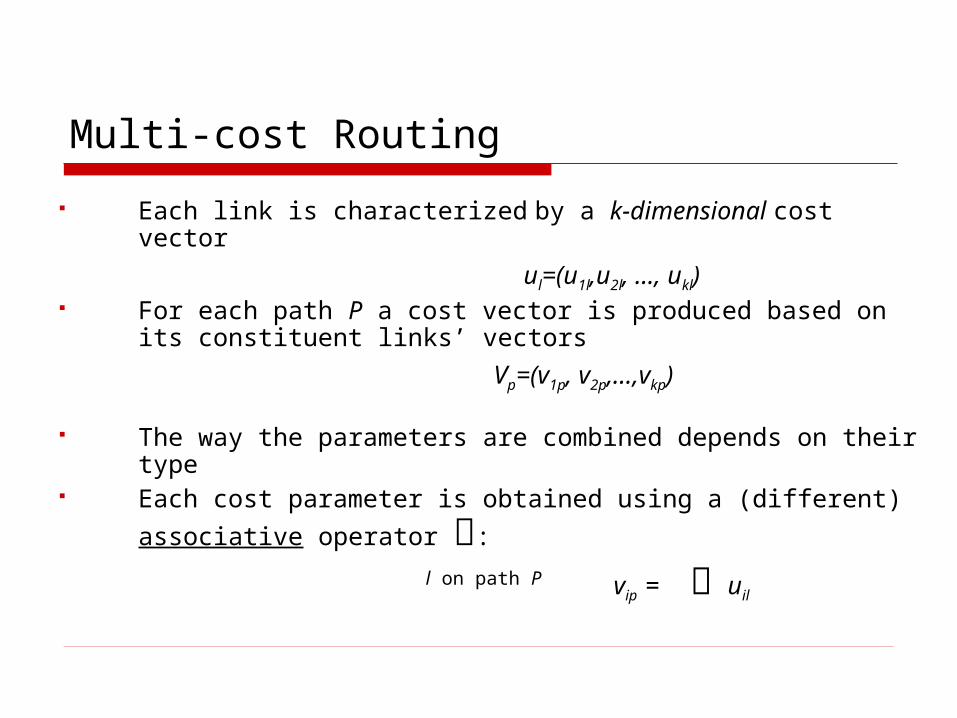
Each link is characterized by a k-dimensional cost vector
ul=(u1lu2l hellip ukl) For each path P a cost vector is produced based on its
constituent linksrsquo vectors
Vp=(v1p v2phellipvkp) The way the parameters are combined depends on their
type Each cost parameter is obtained using a (different)
associative operator ס
vip = ס uill on path P
Multi-cost Routing
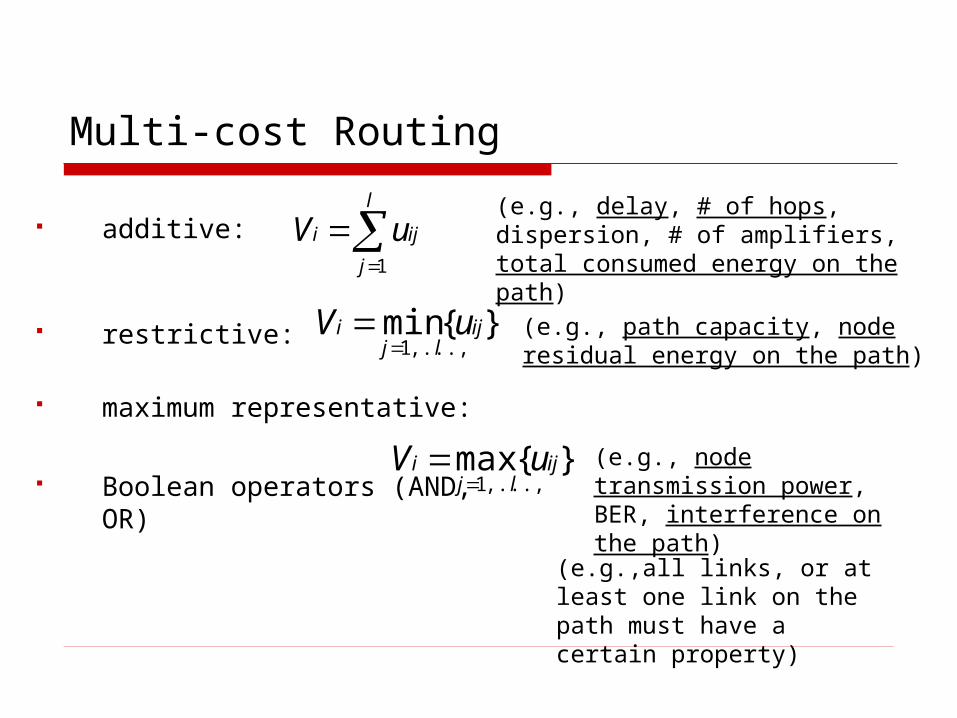
additive
restrictive
maximum representative
Boolean operators (AND OR)
max1
ijlj
i uV
min1
ijlj
i uV
l
j
iji uV1
(eg path capacity node residual energy on the path)
(eg delay of hops dispersion of amplifiers total consumed energy on the path)
(eg node transmission power BER interference on the path)
(egall links or at least one link on the path must have a certain property)
d here is any additive cost parameter (eg delay hops energy consumed)c here is any restrictive parameter (eg capacity residual node energy)
Non-dominated paths
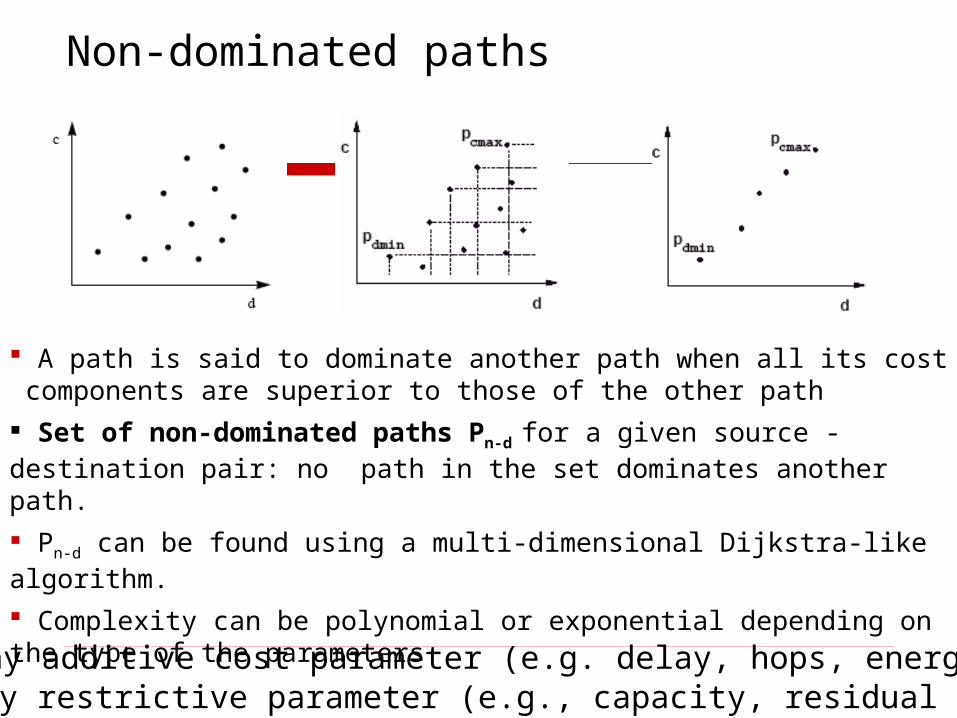
A path is said to dominate another path when all its cost components are superior to those of the other path
Set of non-dominated paths Pn-d for a given source - destination pair no path in the set dominates another path
Pn-d can be found using a multi-dimensional Dijkstra-like algorithm
Complexity can be polynomial or exponential depending on the type of the parameters
Multi-cost Routing
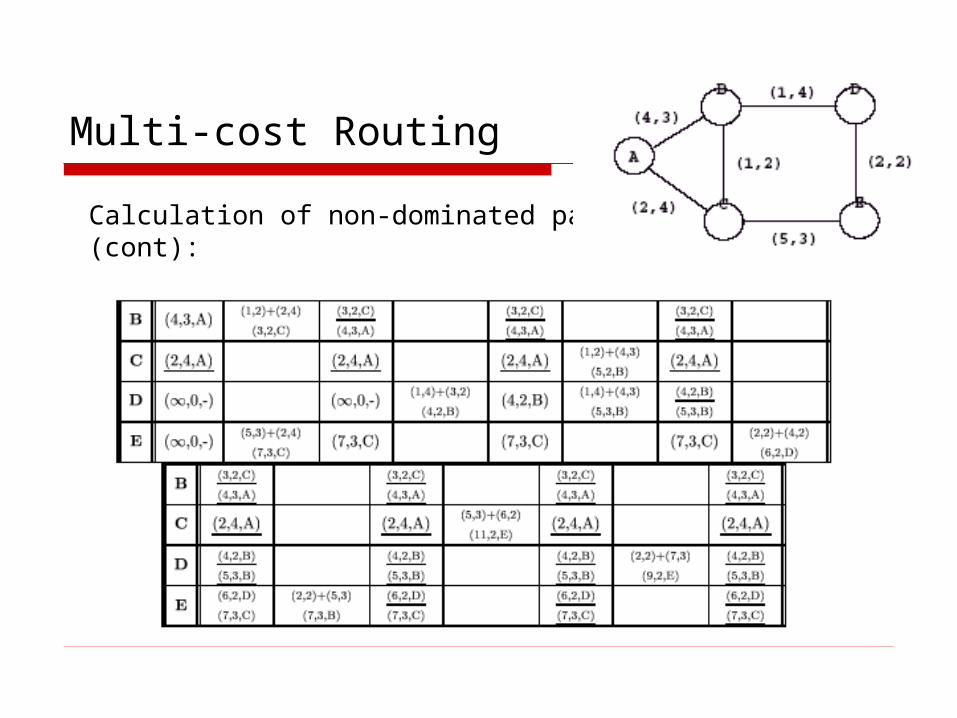
Calculation of non-dominated paths example (cont)
Multi-cost Routing
A multi-cost algorithm consists of two phases Enumeration of a set of non-dominated paths for a
given source-destination pair The optimum path from this set is chosen according
to some optimization function
f (h d c T R BER hellip)
of hopspath delay path capacity total consumed power
minimum node residual energy
The parameters and the choice of function f( ) may depend on the QoS of the user or the interests of the network
Energy-Aware Routing algorithmsWireless Ad-Hoc Networks
We propose multi-cost energy-aware routing algorithms that use the following parameters
The number of hops h (additive) The residual energy R at the transmitting nodes of the links on the path (restrictive) R=min Ri
The total consumed energy T of the transmitting nodes the links on the path (additive)
T= Σ Ti
The maximum consumed energy Trsquo on the path (maximum representative) Trsquo= max Ti
links i on path
links i on path
links i on path
Routing algorithms tested Wireless Ad-Hoc Networks
SUMMIN Energy
SUMMIN Energy-Hop
SUMMIN Energy-Half-Hop
Pii
Pii
R
T
min
max
Various optimization functions f (h R T Tprime) were tested and compared
Minimum-Hop
MAXMIN Energy
MAXMIN Energy-Hop
MAXMIN Energy-Half-Hop
h
Pii
Pi
i
R
T
min
Pii
Pi
i
R
Th
min
Pii
Pi
i
R
Th
min
Pii
Pii
R
Th
min
max
Pii
Pii
R
Th
min
max
=radic h TR
=TprimeR
=hTprimeR
=radic h TprimeR
=TR
=hTR
Note each optimization function corresponds to a different routing algorithm
The infinite time horizon modelWireless Ad-Hoc Networks
Packets and energy are generated at each node continuously over an infinite time horizon
The objective is to achieve the maximum throughput small average packet delay for a given throughput
packet generation rate p
energy generation rate X
packet generation rate p
packet generation rate p
packet generation rate p
packet generation rate p
energy generation rate X
energy generation rate X
energy generation rate X
energy generation rate X
The network evacuation modelWireless Ad-Hoc Networks The network starts with a certain number of packets to be
transmitted to their destination
Each node has a certain amount of energy The objective is
to serve the packets in the smallest number of steps or serve as many packets as possible before the energy at the nodes is depleted
Network Evacuation modelWireless Ad-Hoc Networks
Average residual energy
00
05
10
15
20
100 200 300 400 500 600 700 800 900 1000
of packets sent by each node
Avera
ge r
esid
ual en
erg
y
Minimum-Hop MAX MIN Energy MAX MIN Energy-Hop
hPi
i
Pii
R
Th
min
max
The Minimum-HopThe Minimum-Hop algorithm gives the best average node residual energy at the end of the evacuation problem buthellip
Minimum-Hop MAXMIN Energy MAXMIN Energy-Hop Pi
i
Pii
R
T
min
max
hellipbut the Minimum-HopMinimum-Hop algorithm also gives the worst variance of the residual energy σ2
Ε and the worst energy-depletion times DT
Variance of residual energy
000
005010
015
020
025030
035
040
100 200 300 400 500 600 700 800 900 1000
of packets sent by each node
Vari
an
ce o
f re
sid
ual
en
erg
y
Minimum-Hop SUM MIN Energy SUM MIN Energy-Hop
Pii
Pi
i
R
Th
min
Pii
Pi
i
R
T
minhMinimum-Hop SUMMIN Energy SUMMIN Energy-Hop
Network Evacuation modelWireless Ad-Hoc Networks
Network Evacuation modelWireless Ad-Hoc Networks
Current number of nodes with depleted energy
0
5
10
15
20
2200 3200 4200 5200 6200 7200 8200 9200
time (sec)
Cu
rre
nt
nu
mb
er
of
no
de
s
wit
h d
ep
lete
d e
ne
rgy
Minimum-Hop SUM MIN Energy SUM MIN Energy-Hop
Pii
Pi
i
R
Th
min
Pii
Pi
i
R
T
min SUMMIN Energy SUMMIN Energy-Hop Minimum-Hop h
Node energy-depletion times
RS ReceivedSent ratioReceivedSent ratioReceived to sent packets ratio
00
0204
0608
1012
100 200 300 400 500 600 700 800 900 1000
of packets sent by each node
Rec
eive
d to
sen
t pa
cket
s ra
tio
Minimum-Hop SUM MIN Energy SUM MIN Energy-Hop
hPi
i
Pi
i
R
Th
min
Pii
Pi
i
R
T
min SUMMIN Energy - SUMMIN Energy-Hop Minimum-Hop -
Evacuation problem
The average length of paths usedThe average length of paths usedAverage path length
32
34
36
38
40
42
44
46
100 200 300 400 500 600 700 800 900 1000
of packets sent by each node
Ave
rag
e p
ath
len
gth
Minimum-Hop SUM MIN Energy SUM MIN Energy-Hop
Pii
Pi
i
R
Th
min
Pii
Pi
i
R
T
minhMinimum-Hop SUMMIN Energy SUMMIN Energy-Hop
Network Evacuation modelWireless Ad-Hoc Networks
Network Evacuation modelWireless Ad-Hoc Networks
Current number of nodes with depleted energy
0
5
10
15
20
25
30
35
0 2000 4000 6000 8000 10000 12000
time (sec)
Cu
rren
t n
um
ber
of
no
des w
ith
dep
lete
d e
nerg
y
1 5 10 20 50 100
hPi
i
Pi
i
R
Th
min
Pii
Pi
i
R
T
minMinimum-Hop SUMMIN Energy SUMMIN Energy-Hop
Effect of the topology Update Interval
Capacity constraint
Limitations on an ad-hoc networkunder the infinite time horizon modelWireless Ad-Hoc Networks
Energy constraint1
1
aRLk
Xp
R is the transmission rangeL is the average physical source-destination distance ρ is the energy network densityX is the recharging rateK Krsquo are constants 2leαle4p = Bernoulli packet generation probability per node
X
Upper bound on p
Simulation Results ndash infinite time horizon
Pii
Pii
R
TTRf
min
)(Multicost algorithm with
Infinite time horizon modelWireless Ad-Hoc Networks
Optical Burst Switched Networks
Packets destined to the same egress node and with similar QoS requirements are aggregated into bursts A control packet is sent to reserve resources and is processed electronically the burst follows after an offset time and stays in the optical domain
Tell-and-wait protocolsTell-and-go protocols
OBS network
WDM linksLegacy networks
Controlchannels
Data channels
off set
OBS node
Burst size kB divide MB
Switching timesms divide s
Out- of- band signal
Reserv manager
Assemblymanager
OBS network
WDM linksLegacy networks
Controlchannels
Data channels
off set
OBS node
Burst size kB divide MB
Switching timesms divide s
Out- of- band signal
Reserv manager
Assemblymanager
Burst Routing and Scheduling Problem Given Network with links of known propagation delays dl and
link utilization profiles Source A wants to send a burst of size I bits and duration B=IC to some destination G
We want to find a feasible path and the time at which the burst should start transmission so as to optimize the burst reception time at its destination (or hop count orhellip)
A tell-and-go or a tell-and-wait reservation scheme is used to send the burst
r
r
r
0000011111111
0111111111111
1111111111111
r
0000011111111
r
1111111111111
A
B
C
G
dCB=1
Multicost Burst Routing and Scheduling
Each link l is assigned a vector Vl Vl =(dl Ĉl)=(dl c1lc2lhellipcdl)
A cost vector is defined for a path p based on the cost vectors of its links
p1 dominates p2 (notation p1 gtp2) iff
11 1
( ) def kk k
ll l ll l
V p V d C
1 21 2
and l l l ll p l p
l p l p
d d C C
1) Calculate the set Pn-d of non-dominated paths
2) Apply an optimization function f(V(p)) to the path cost vectors to select the optimal one
Path Binary Capacity Availability Vector
Transmission of the CAV from node A to a source node C requires time equal to the propagation delay dAC
Assuming that the propagation delays are the same in both directions any data sent from A will incur to reach C dAC
Source A shifts the received CAV by 2dAC
The Capacity Availability Vector of a path is computed
AB ABAB BC AB BC AB BCd 2dABC amp (A) amp C C C C LSH (C C LSH (C) )
Polynomial Time Heuristic Algorithm
The number of non-dominated paths may be exponential Heuristic variations of the multicost algorithm define a
pseudo-domination relation gtps The pseudo-domination relation can be used to prune
paths yielding a set Pn-ps-d Pn-d
of non-pseudo-dominated paths of polynomial cardinality
Eg (Availability Weighted heuristic algorithm)
p1 pseudo-dominates p2 (p1 gtps p2) iff
1 21 2
and ( ) ( )l l l ll p l p
l p l p
d d weight weightC C
Delay vs traffic load ( =300kB)
The optimal multicost algorithm outperforms the Dijkstra and the DijkstraCA algorithms
Marginal difference between the optimal algo and the AW and CSA heuristic algorithms
I
0
2
4
6
8
0 20 40 60 80 100 120 140
Arrival Rate λ ( burstssec)
End
-to-
end
dela
y (m
sec)
Dijkstra
Optimal multicost
AW heuristic multicost
CSA heuristic multicost
DijkstraCA
The propagation delays in the network play a significant role on the link state information exchange mechanism
0
2
4
6
8
0 20 40 60 80 100
Arrival Rate λ ( burstssec)
End
-to-
end
dela
y (m
sec)
AW heuristic multicost - 200kmDijkstraCA - 200kmAW heuristic multicost- 100kmDijkstraCA - 100kmAW heuristic multicost - 50kmDijkstraCA - 50km
MaxndashMin Fair Share Networks
In a max min fair share network the connections using a particular link get a ldquofair sharerdquo of the link bandwidth
Cost Parameters
bullh number of links
bullr available capacity Usually the capacity of a link is taken to be the residual link bandwidth In the max min fair share networks however r is an estimate of the max min fair rate that would be obtained by the new connection if admitted
bulld path propagation delay
Routing algorithms tested MaxndashMin Fair Share Networks
Multicost cost functions (hrd) f(hr) = hr f(dbr) = d + br f1(dbrh) = (d + br)h f2(dbrh) = (d + br)hn
Widest-shortest path min(h)In case of a tie the one with maximum capacity is selected
Shortest-widest path max(r) In case of a tie the one with the minimum of hops is selected
bullb the amount of data to be transmitted
Simulation ResultsMaxndashMin Fair Share Networks
Metrics Average delay (when MCR = 0 ) Probability of success for a new connection (when MCR ne 0)
Topologies considered a random network and a 4x4 mesh network with varying capacities
MaxndashMin Fair Share Networks
MCR = 0 Random topology f(dbrh) = (d + br)h
MaxndashMin Fair Share Networks
MCR ne 0 Mesh topology f(dbrh) = (d + br)h05
Simulation ResultsMaxndashMin Fair Share Networks
Capacity availability definition
MCR = 0 Mesh and Random topology f(dbrh) = (d + br)h05
Simulation ResultsMaxndashMin Fair Share Networks
Link utilization information updates (P = 10 50 100)
MCR = 0 transmission time gtgt propagation time Mesh topology f(dbrh) = (d + br)h05
Conclusionsfor Wireless Ad-Hoc Networks
Multi-cost algorithms that take energy into account result in
Increased network lifetime More evenly spread energy consumption Higher throughput
The SUMMIN energy-hop algorithm where the cost function is
gives the most balanced results (in terms of node residual
energy energy variance packets dropped depletion times number of hops on paths taken)
The performance benefits diminish when the limitation posed by the network capacity is approached
Pii
Pi
i
R
Th
min
f (h T R) =
Conclusions for OBS networks
The proposed multicost burst routing and scheduling algorithm and its heuristic variations significantly outperform other simulated algorithms
The optimal multicost algorithm is not polynomial but the proposed AW multicost heuristic algorithm has polynomial complexity and performance that is very close to that of the optimal algorithm
The improvements obtained are more significant for small propagation delays
Conclusionsfor max-min fare share networks
Multi-cost algorithms can result in
Lower blocking probability Lower average delay
The algorithm that uses the cost function
f(dbrh) = (d + br)h05 gives the best results
The term r is an estimate of the max min fair rate that would be obtained by the new connection if admitted
Multi-cost Routing
Traditional algorithms use single-cost routing Limited types of cost criteria Inability to incorporate QoS Single path computed for each source-destination
The multi-cost routing approach Link costs are vectors Path costs are also vectors For each source-destination
pair a set of candidate paths is maintained For each packet (or session) a different cost function may be optimized The set of cost functions that can be used is substantially
enlarged
Multi-cost Routing
Each link is characterized by a k-dimensional cost vector
ul=(u1lu2l hellip ukl) For each path P a cost vector is produced based on its
constituent linksrsquo vectors
Vp=(v1p v2phellipvkp) The way the parameters are combined depends on their
type Each cost parameter is obtained using a (different)
associative operator ס
vip = ס uill on path P
Multi-cost Routing
additive
restrictive
maximum representative
Boolean operators (AND OR)
max1
ijlj
i uV
min1
ijlj
i uV
l
j
iji uV1
(eg path capacity node residual energy on the path)
(eg delay of hops dispersion of amplifiers total consumed energy on the path)
(eg node transmission power BER interference on the path)
(egall links or at least one link on the path must have a certain property)
d here is any additive cost parameter (eg delay hops energy consumed)c here is any restrictive parameter (eg capacity residual node energy)
Non-dominated paths
A path is said to dominate another path when all its cost components are superior to those of the other path
Set of non-dominated paths Pn-d for a given source - destination pair no path in the set dominates another path
Pn-d can be found using a multi-dimensional Dijkstra-like algorithm
Complexity can be polynomial or exponential depending on the type of the parameters
Multi-cost Routing
Calculation of non-dominated paths example (cont)
Multi-cost Routing
A multi-cost algorithm consists of two phases Enumeration of a set of non-dominated paths for a
given source-destination pair The optimum path from this set is chosen according
to some optimization function
f (h d c T R BER hellip)
of hopspath delay path capacity total consumed power
minimum node residual energy
The parameters and the choice of function f( ) may depend on the QoS of the user or the interests of the network
Energy-Aware Routing algorithmsWireless Ad-Hoc Networks
We propose multi-cost energy-aware routing algorithms that use the following parameters
The number of hops h (additive) The residual energy R at the transmitting nodes of the links on the path (restrictive) R=min Ri
The total consumed energy T of the transmitting nodes the links on the path (additive)
T= Σ Ti
The maximum consumed energy Trsquo on the path (maximum representative) Trsquo= max Ti
links i on path
links i on path
links i on path
Routing algorithms tested Wireless Ad-Hoc Networks
SUMMIN Energy
SUMMIN Energy-Hop
SUMMIN Energy-Half-Hop
Pii
Pii
R
T
min
max
Various optimization functions f (h R T Tprime) were tested and compared
Minimum-Hop
MAXMIN Energy
MAXMIN Energy-Hop
MAXMIN Energy-Half-Hop
h
Pii
Pi
i
R
T
min
Pii
Pi
i
R
Th
min
Pii
Pi
i
R
Th
min
Pii
Pii
R
Th
min
max
Pii
Pii
R
Th
min
max
=radic h TR
=TprimeR
=hTprimeR
=radic h TprimeR
=TR
=hTR
Note each optimization function corresponds to a different routing algorithm
The infinite time horizon modelWireless Ad-Hoc Networks
Packets and energy are generated at each node continuously over an infinite time horizon
The objective is to achieve the maximum throughput small average packet delay for a given throughput
packet generation rate p
energy generation rate X
packet generation rate p
packet generation rate p
packet generation rate p
packet generation rate p
energy generation rate X
energy generation rate X
energy generation rate X
energy generation rate X
The network evacuation modelWireless Ad-Hoc Networks The network starts with a certain number of packets to be
transmitted to their destination
Each node has a certain amount of energy The objective is
to serve the packets in the smallest number of steps or serve as many packets as possible before the energy at the nodes is depleted
Network Evacuation modelWireless Ad-Hoc Networks
Average residual energy
00
05
10
15
20
100 200 300 400 500 600 700 800 900 1000
of packets sent by each node
Avera
ge r
esid
ual en
erg
y
Minimum-Hop MAX MIN Energy MAX MIN Energy-Hop
hPi
i
Pii
R
Th
min
max
The Minimum-HopThe Minimum-Hop algorithm gives the best average node residual energy at the end of the evacuation problem buthellip
Minimum-Hop MAXMIN Energy MAXMIN Energy-Hop Pi
i
Pii
R
T
min
max
hellipbut the Minimum-HopMinimum-Hop algorithm also gives the worst variance of the residual energy σ2
Ε and the worst energy-depletion times DT
Variance of residual energy
000
005010
015
020
025030
035
040
100 200 300 400 500 600 700 800 900 1000
of packets sent by each node
Vari
an
ce o
f re
sid
ual
en
erg
y
Minimum-Hop SUM MIN Energy SUM MIN Energy-Hop
Pii
Pi
i
R
Th
min
Pii
Pi
i
R
T
minhMinimum-Hop SUMMIN Energy SUMMIN Energy-Hop
Network Evacuation modelWireless Ad-Hoc Networks
Network Evacuation modelWireless Ad-Hoc Networks
Current number of nodes with depleted energy
0
5
10
15
20
2200 3200 4200 5200 6200 7200 8200 9200
time (sec)
Cu
rre
nt
nu
mb
er
of
no
de
s
wit
h d
ep
lete
d e
ne
rgy
Minimum-Hop SUM MIN Energy SUM MIN Energy-Hop
Pii
Pi
i
R
Th
min
Pii
Pi
i
R
T
min SUMMIN Energy SUMMIN Energy-Hop Minimum-Hop h
Node energy-depletion times
RS ReceivedSent ratioReceivedSent ratioReceived to sent packets ratio
00
0204
0608
1012
100 200 300 400 500 600 700 800 900 1000
of packets sent by each node
Rec
eive
d to
sen
t pa
cket
s ra
tio
Minimum-Hop SUM MIN Energy SUM MIN Energy-Hop
hPi
i
Pi
i
R
Th
min
Pii
Pi
i
R
T
min SUMMIN Energy - SUMMIN Energy-Hop Minimum-Hop -
Evacuation problem
The average length of paths usedThe average length of paths usedAverage path length
32
34
36
38
40
42
44
46
100 200 300 400 500 600 700 800 900 1000
of packets sent by each node
Ave
rag
e p
ath
len
gth
Minimum-Hop SUM MIN Energy SUM MIN Energy-Hop
Pii
Pi
i
R
Th
min
Pii
Pi
i
R
T
minhMinimum-Hop SUMMIN Energy SUMMIN Energy-Hop
Network Evacuation modelWireless Ad-Hoc Networks
Network Evacuation modelWireless Ad-Hoc Networks
Current number of nodes with depleted energy
0
5
10
15
20
25
30
35
0 2000 4000 6000 8000 10000 12000
time (sec)
Cu
rren
t n
um
ber
of
no
des w
ith
dep
lete
d e
nerg
y
1 5 10 20 50 100
hPi
i
Pi
i
R
Th
min
Pii
Pi
i
R
T
minMinimum-Hop SUMMIN Energy SUMMIN Energy-Hop
Effect of the topology Update Interval
Capacity constraint
Limitations on an ad-hoc networkunder the infinite time horizon modelWireless Ad-Hoc Networks
Energy constraint1
1
aRLk
Xp
R is the transmission rangeL is the average physical source-destination distance ρ is the energy network densityX is the recharging rateK Krsquo are constants 2leαle4p = Bernoulli packet generation probability per node
X
Upper bound on p
Simulation Results ndash infinite time horizon
Pii
Pii
R
TTRf
min
)(Multicost algorithm with
Infinite time horizon modelWireless Ad-Hoc Networks
Optical Burst Switched Networks
Packets destined to the same egress node and with similar QoS requirements are aggregated into bursts A control packet is sent to reserve resources and is processed electronically the burst follows after an offset time and stays in the optical domain
Tell-and-wait protocolsTell-and-go protocols
OBS network
WDM linksLegacy networks
Controlchannels
Data channels
off set
OBS node
Burst size kB divide MB
Switching timesms divide s
Out- of- band signal
Reserv manager
Assemblymanager
OBS network
WDM linksLegacy networks
Controlchannels
Data channels
off set
OBS node
Burst size kB divide MB
Switching timesms divide s
Out- of- band signal
Reserv manager
Assemblymanager
Burst Routing and Scheduling Problem Given Network with links of known propagation delays dl and
link utilization profiles Source A wants to send a burst of size I bits and duration B=IC to some destination G
We want to find a feasible path and the time at which the burst should start transmission so as to optimize the burst reception time at its destination (or hop count orhellip)
A tell-and-go or a tell-and-wait reservation scheme is used to send the burst
r
r
r
0000011111111
0111111111111
1111111111111
r
0000011111111
r
1111111111111
A
B
C
G
dCB=1
Multicost Burst Routing and Scheduling
Each link l is assigned a vector Vl Vl =(dl Ĉl)=(dl c1lc2lhellipcdl)
A cost vector is defined for a path p based on the cost vectors of its links
p1 dominates p2 (notation p1 gtp2) iff
11 1
( ) def kk k
ll l ll l
V p V d C
1 21 2
and l l l ll p l p
l p l p
d d C C
1) Calculate the set Pn-d of non-dominated paths
2) Apply an optimization function f(V(p)) to the path cost vectors to select the optimal one
Path Binary Capacity Availability Vector
Transmission of the CAV from node A to a source node C requires time equal to the propagation delay dAC
Assuming that the propagation delays are the same in both directions any data sent from A will incur to reach C dAC
Source A shifts the received CAV by 2dAC
The Capacity Availability Vector of a path is computed
AB ABAB BC AB BC AB BCd 2dABC amp (A) amp C C C C LSH (C C LSH (C) )
Polynomial Time Heuristic Algorithm
The number of non-dominated paths may be exponential Heuristic variations of the multicost algorithm define a
pseudo-domination relation gtps The pseudo-domination relation can be used to prune
paths yielding a set Pn-ps-d Pn-d
of non-pseudo-dominated paths of polynomial cardinality
Eg (Availability Weighted heuristic algorithm)
p1 pseudo-dominates p2 (p1 gtps p2) iff
1 21 2
and ( ) ( )l l l ll p l p
l p l p
d d weight weightC C
Delay vs traffic load ( =300kB)
The optimal multicost algorithm outperforms the Dijkstra and the DijkstraCA algorithms
Marginal difference between the optimal algo and the AW and CSA heuristic algorithms
I
0
2
4
6
8
0 20 40 60 80 100 120 140
Arrival Rate λ ( burstssec)
End
-to-
end
dela
y (m
sec)
Dijkstra
Optimal multicost
AW heuristic multicost
CSA heuristic multicost
DijkstraCA
The propagation delays in the network play a significant role on the link state information exchange mechanism
0
2
4
6
8
0 20 40 60 80 100
Arrival Rate λ ( burstssec)
End
-to-
end
dela
y (m
sec)
AW heuristic multicost - 200kmDijkstraCA - 200kmAW heuristic multicost- 100kmDijkstraCA - 100kmAW heuristic multicost - 50kmDijkstraCA - 50km
MaxndashMin Fair Share Networks
In a max min fair share network the connections using a particular link get a ldquofair sharerdquo of the link bandwidth
Cost Parameters
bullh number of links
bullr available capacity Usually the capacity of a link is taken to be the residual link bandwidth In the max min fair share networks however r is an estimate of the max min fair rate that would be obtained by the new connection if admitted
bulld path propagation delay
Routing algorithms tested MaxndashMin Fair Share Networks
Multicost cost functions (hrd) f(hr) = hr f(dbr) = d + br f1(dbrh) = (d + br)h f2(dbrh) = (d + br)hn
Widest-shortest path min(h)In case of a tie the one with maximum capacity is selected
Shortest-widest path max(r) In case of a tie the one with the minimum of hops is selected
bullb the amount of data to be transmitted
Simulation ResultsMaxndashMin Fair Share Networks
Metrics Average delay (when MCR = 0 ) Probability of success for a new connection (when MCR ne 0)
Topologies considered a random network and a 4x4 mesh network with varying capacities
MaxndashMin Fair Share Networks
MCR = 0 Random topology f(dbrh) = (d + br)h
MaxndashMin Fair Share Networks
MCR ne 0 Mesh topology f(dbrh) = (d + br)h05
Simulation ResultsMaxndashMin Fair Share Networks
Capacity availability definition
MCR = 0 Mesh and Random topology f(dbrh) = (d + br)h05
Simulation ResultsMaxndashMin Fair Share Networks
Link utilization information updates (P = 10 50 100)
MCR = 0 transmission time gtgt propagation time Mesh topology f(dbrh) = (d + br)h05
Conclusionsfor Wireless Ad-Hoc Networks
Multi-cost algorithms that take energy into account result in
Increased network lifetime More evenly spread energy consumption Higher throughput
The SUMMIN energy-hop algorithm where the cost function is
gives the most balanced results (in terms of node residual
energy energy variance packets dropped depletion times number of hops on paths taken)
The performance benefits diminish when the limitation posed by the network capacity is approached
Pii
Pi
i
R
Th
min
f (h T R) =
Conclusions for OBS networks
The proposed multicost burst routing and scheduling algorithm and its heuristic variations significantly outperform other simulated algorithms
The optimal multicost algorithm is not polynomial but the proposed AW multicost heuristic algorithm has polynomial complexity and performance that is very close to that of the optimal algorithm
The improvements obtained are more significant for small propagation delays
Conclusionsfor max-min fare share networks
Multi-cost algorithms can result in
Lower blocking probability Lower average delay
The algorithm that uses the cost function
f(dbrh) = (d + br)h05 gives the best results
The term r is an estimate of the max min fair rate that would be obtained by the new connection if admitted
Multi-cost Routing
additive
restrictive
maximum representative
Boolean operators (AND OR)
max1
ijlj
i uV
min1
ijlj
i uV
l
j
iji uV1
(eg path capacity node residual energy on the path)
(eg delay of hops dispersion of amplifiers total consumed energy on the path)
(eg node transmission power BER interference on the path)
(egall links or at least one link on the path must have a certain property)
d here is any additive cost parameter (eg delay hops energy consumed)c here is any restrictive parameter (eg capacity residual node energy)
Non-dominated paths
A path is said to dominate another path when all its cost components are superior to those of the other path
Set of non-dominated paths Pn-d for a given source - destination pair no path in the set dominates another path
Pn-d can be found using a multi-dimensional Dijkstra-like algorithm
Complexity can be polynomial or exponential depending on the type of the parameters
Multi-cost Routing
Calculation of non-dominated paths example (cont)
Multi-cost Routing
A multi-cost algorithm consists of two phases Enumeration of a set of non-dominated paths for a
given source-destination pair The optimum path from this set is chosen according
to some optimization function
f (h d c T R BER hellip)
of hopspath delay path capacity total consumed power
minimum node residual energy
The parameters and the choice of function f( ) may depend on the QoS of the user or the interests of the network
Energy-Aware Routing algorithmsWireless Ad-Hoc Networks
We propose multi-cost energy-aware routing algorithms that use the following parameters
The number of hops h (additive) The residual energy R at the transmitting nodes of the links on the path (restrictive) R=min Ri
The total consumed energy T of the transmitting nodes the links on the path (additive)
T= Σ Ti
The maximum consumed energy Trsquo on the path (maximum representative) Trsquo= max Ti
links i on path
links i on path
links i on path
Routing algorithms tested Wireless Ad-Hoc Networks
SUMMIN Energy
SUMMIN Energy-Hop
SUMMIN Energy-Half-Hop
Pii
Pii
R
T
min
max
Various optimization functions f (h R T Tprime) were tested and compared
Minimum-Hop
MAXMIN Energy
MAXMIN Energy-Hop
MAXMIN Energy-Half-Hop
h
Pii
Pi
i
R
T
min
Pii
Pi
i
R
Th
min
Pii
Pi
i
R
Th
min
Pii
Pii
R
Th
min
max
Pii
Pii
R
Th
min
max
=radic h TR
=TprimeR
=hTprimeR
=radic h TprimeR
=TR
=hTR
Note each optimization function corresponds to a different routing algorithm
The infinite time horizon modelWireless Ad-Hoc Networks
Packets and energy are generated at each node continuously over an infinite time horizon
The objective is to achieve the maximum throughput small average packet delay for a given throughput
packet generation rate p
energy generation rate X
packet generation rate p
packet generation rate p
packet generation rate p
packet generation rate p
energy generation rate X
energy generation rate X
energy generation rate X
energy generation rate X
The network evacuation modelWireless Ad-Hoc Networks The network starts with a certain number of packets to be
transmitted to their destination
Each node has a certain amount of energy The objective is
to serve the packets in the smallest number of steps or serve as many packets as possible before the energy at the nodes is depleted
Network Evacuation modelWireless Ad-Hoc Networks
Average residual energy
00
05
10
15
20
100 200 300 400 500 600 700 800 900 1000
of packets sent by each node
Avera
ge r
esid
ual en
erg
y
Minimum-Hop MAX MIN Energy MAX MIN Energy-Hop
hPi
i
Pii
R
Th
min
max
The Minimum-HopThe Minimum-Hop algorithm gives the best average node residual energy at the end of the evacuation problem buthellip
Minimum-Hop MAXMIN Energy MAXMIN Energy-Hop Pi
i
Pii
R
T
min
max
hellipbut the Minimum-HopMinimum-Hop algorithm also gives the worst variance of the residual energy σ2
Ε and the worst energy-depletion times DT
Variance of residual energy
000
005010
015
020
025030
035
040
100 200 300 400 500 600 700 800 900 1000
of packets sent by each node
Vari
an
ce o
f re
sid
ual
en
erg
y
Minimum-Hop SUM MIN Energy SUM MIN Energy-Hop
Pii
Pi
i
R
Th
min
Pii
Pi
i
R
T
minhMinimum-Hop SUMMIN Energy SUMMIN Energy-Hop
Network Evacuation modelWireless Ad-Hoc Networks
Network Evacuation modelWireless Ad-Hoc Networks
Current number of nodes with depleted energy
0
5
10
15
20
2200 3200 4200 5200 6200 7200 8200 9200
time (sec)
Cu
rre
nt
nu
mb
er
of
no
de
s
wit
h d
ep
lete
d e
ne
rgy
Minimum-Hop SUM MIN Energy SUM MIN Energy-Hop
Pii
Pi
i
R
Th
min
Pii
Pi
i
R
T
min SUMMIN Energy SUMMIN Energy-Hop Minimum-Hop h
Node energy-depletion times
RS ReceivedSent ratioReceivedSent ratioReceived to sent packets ratio
00
0204
0608
1012
100 200 300 400 500 600 700 800 900 1000
of packets sent by each node
Rec
eive
d to
sen
t pa
cket
s ra
tio
Minimum-Hop SUM MIN Energy SUM MIN Energy-Hop
hPi
i
Pi
i
R
Th
min
Pii
Pi
i
R
T
min SUMMIN Energy - SUMMIN Energy-Hop Minimum-Hop -
Evacuation problem
The average length of paths usedThe average length of paths usedAverage path length
32
34
36
38
40
42
44
46
100 200 300 400 500 600 700 800 900 1000
of packets sent by each node
Ave
rag
e p
ath
len
gth
Minimum-Hop SUM MIN Energy SUM MIN Energy-Hop
Pii
Pi
i
R
Th
min
Pii
Pi
i
R
T
minhMinimum-Hop SUMMIN Energy SUMMIN Energy-Hop
Network Evacuation modelWireless Ad-Hoc Networks
Network Evacuation modelWireless Ad-Hoc Networks
Current number of nodes with depleted energy
0
5
10
15
20
25
30
35
0 2000 4000 6000 8000 10000 12000
time (sec)
Cu
rren
t n
um
ber
of
no
des w
ith
dep
lete
d e
nerg
y
1 5 10 20 50 100
hPi
i
Pi
i
R
Th
min
Pii
Pi
i
R
T
minMinimum-Hop SUMMIN Energy SUMMIN Energy-Hop
Effect of the topology Update Interval
Capacity constraint
Limitations on an ad-hoc networkunder the infinite time horizon modelWireless Ad-Hoc Networks
Energy constraint1
1
aRLk
Xp
R is the transmission rangeL is the average physical source-destination distance ρ is the energy network densityX is the recharging rateK Krsquo are constants 2leαle4p = Bernoulli packet generation probability per node
X
Upper bound on p
Simulation Results ndash infinite time horizon
Pii
Pii
R
TTRf
min
)(Multicost algorithm with
Infinite time horizon modelWireless Ad-Hoc Networks
Optical Burst Switched Networks
Packets destined to the same egress node and with similar QoS requirements are aggregated into bursts A control packet is sent to reserve resources and is processed electronically the burst follows after an offset time and stays in the optical domain
Tell-and-wait protocolsTell-and-go protocols
OBS network
WDM linksLegacy networks
Controlchannels
Data channels
off set
OBS node
Burst size kB divide MB
Switching timesms divide s
Out- of- band signal
Reserv manager
Assemblymanager
OBS network
WDM linksLegacy networks
Controlchannels
Data channels
off set
OBS node
Burst size kB divide MB
Switching timesms divide s
Out- of- band signal
Reserv manager
Assemblymanager
Burst Routing and Scheduling Problem Given Network with links of known propagation delays dl and
link utilization profiles Source A wants to send a burst of size I bits and duration B=IC to some destination G
We want to find a feasible path and the time at which the burst should start transmission so as to optimize the burst reception time at its destination (or hop count orhellip)
A tell-and-go or a tell-and-wait reservation scheme is used to send the burst
r
r
r
0000011111111
0111111111111
1111111111111
r
0000011111111
r
1111111111111
A
B
C
G
dCB=1
Multicost Burst Routing and Scheduling
Each link l is assigned a vector Vl Vl =(dl Ĉl)=(dl c1lc2lhellipcdl)
A cost vector is defined for a path p based on the cost vectors of its links
p1 dominates p2 (notation p1 gtp2) iff
11 1
( ) def kk k
ll l ll l
V p V d C
1 21 2
and l l l ll p l p
l p l p
d d C C
1) Calculate the set Pn-d of non-dominated paths
2) Apply an optimization function f(V(p)) to the path cost vectors to select the optimal one
Path Binary Capacity Availability Vector
Transmission of the CAV from node A to a source node C requires time equal to the propagation delay dAC
Assuming that the propagation delays are the same in both directions any data sent from A will incur to reach C dAC
Source A shifts the received CAV by 2dAC
The Capacity Availability Vector of a path is computed
AB ABAB BC AB BC AB BCd 2dABC amp (A) amp C C C C LSH (C C LSH (C) )
Polynomial Time Heuristic Algorithm
The number of non-dominated paths may be exponential Heuristic variations of the multicost algorithm define a
pseudo-domination relation gtps The pseudo-domination relation can be used to prune
paths yielding a set Pn-ps-d Pn-d
of non-pseudo-dominated paths of polynomial cardinality
Eg (Availability Weighted heuristic algorithm)
p1 pseudo-dominates p2 (p1 gtps p2) iff
1 21 2
and ( ) ( )l l l ll p l p
l p l p
d d weight weightC C
Delay vs traffic load ( =300kB)
The optimal multicost algorithm outperforms the Dijkstra and the DijkstraCA algorithms
Marginal difference between the optimal algo and the AW and CSA heuristic algorithms
I
0
2
4
6
8
0 20 40 60 80 100 120 140
Arrival Rate λ ( burstssec)
End
-to-
end
dela
y (m
sec)
Dijkstra
Optimal multicost
AW heuristic multicost
CSA heuristic multicost
DijkstraCA
The propagation delays in the network play a significant role on the link state information exchange mechanism
0
2
4
6
8
0 20 40 60 80 100
Arrival Rate λ ( burstssec)
End
-to-
end
dela
y (m
sec)
AW heuristic multicost - 200kmDijkstraCA - 200kmAW heuristic multicost- 100kmDijkstraCA - 100kmAW heuristic multicost - 50kmDijkstraCA - 50km
MaxndashMin Fair Share Networks
In a max min fair share network the connections using a particular link get a ldquofair sharerdquo of the link bandwidth
Cost Parameters
bullh number of links
bullr available capacity Usually the capacity of a link is taken to be the residual link bandwidth In the max min fair share networks however r is an estimate of the max min fair rate that would be obtained by the new connection if admitted
bulld path propagation delay
Routing algorithms tested MaxndashMin Fair Share Networks
Multicost cost functions (hrd) f(hr) = hr f(dbr) = d + br f1(dbrh) = (d + br)h f2(dbrh) = (d + br)hn
Widest-shortest path min(h)In case of a tie the one with maximum capacity is selected
Shortest-widest path max(r) In case of a tie the one with the minimum of hops is selected
bullb the amount of data to be transmitted
Simulation ResultsMaxndashMin Fair Share Networks
Metrics Average delay (when MCR = 0 ) Probability of success for a new connection (when MCR ne 0)
Topologies considered a random network and a 4x4 mesh network with varying capacities
MaxndashMin Fair Share Networks
MCR = 0 Random topology f(dbrh) = (d + br)h
MaxndashMin Fair Share Networks
MCR ne 0 Mesh topology f(dbrh) = (d + br)h05
Simulation ResultsMaxndashMin Fair Share Networks
Capacity availability definition
MCR = 0 Mesh and Random topology f(dbrh) = (d + br)h05
Simulation ResultsMaxndashMin Fair Share Networks
Link utilization information updates (P = 10 50 100)
MCR = 0 transmission time gtgt propagation time Mesh topology f(dbrh) = (d + br)h05
Conclusionsfor Wireless Ad-Hoc Networks
Multi-cost algorithms that take energy into account result in
Increased network lifetime More evenly spread energy consumption Higher throughput
The SUMMIN energy-hop algorithm where the cost function is
gives the most balanced results (in terms of node residual
energy energy variance packets dropped depletion times number of hops on paths taken)
The performance benefits diminish when the limitation posed by the network capacity is approached
Pii
Pi
i
R
Th
min
f (h T R) =
Conclusions for OBS networks
The proposed multicost burst routing and scheduling algorithm and its heuristic variations significantly outperform other simulated algorithms
The optimal multicost algorithm is not polynomial but the proposed AW multicost heuristic algorithm has polynomial complexity and performance that is very close to that of the optimal algorithm
The improvements obtained are more significant for small propagation delays
Conclusionsfor max-min fare share networks
Multi-cost algorithms can result in
Lower blocking probability Lower average delay
The algorithm that uses the cost function
f(dbrh) = (d + br)h05 gives the best results
The term r is an estimate of the max min fair rate that would be obtained by the new connection if admitted
Multi-cost Routing
Calculation of non-dominated paths example (cont)
Multi-cost Routing
A multi-cost algorithm consists of two phases Enumeration of a set of non-dominated paths for a
given source-destination pair The optimum path from this set is chosen according
to some optimization function
f (h d c T R BER hellip)
of hopspath delay path capacity total consumed power
minimum node residual energy
The parameters and the choice of function f( ) may depend on the QoS of the user or the interests of the network
Energy-Aware Routing algorithmsWireless Ad-Hoc Networks
We propose multi-cost energy-aware routing algorithms that use the following parameters
The number of hops h (additive) The residual energy R at the transmitting nodes of the links on the path (restrictive) R=min Ri
The total consumed energy T of the transmitting nodes the links on the path (additive)
T= Σ Ti
The maximum consumed energy Trsquo on the path (maximum representative) Trsquo= max Ti
links i on path
links i on path
links i on path
Routing algorithms tested Wireless Ad-Hoc Networks
SUMMIN Energy
SUMMIN Energy-Hop
SUMMIN Energy-Half-Hop
Pii
Pii
R
T
min
max
Various optimization functions f (h R T Tprime) were tested and compared
Minimum-Hop
MAXMIN Energy
MAXMIN Energy-Hop
MAXMIN Energy-Half-Hop
h
Pii
Pi
i
R
T
min
Pii
Pi
i
R
Th
min
Pii
Pi
i
R
Th
min
Pii
Pii
R
Th
min
max
Pii
Pii
R
Th
min
max
=radic h TR
=TprimeR
=hTprimeR
=radic h TprimeR
=TR
=hTR
Note each optimization function corresponds to a different routing algorithm
The infinite time horizon modelWireless Ad-Hoc Networks
Packets and energy are generated at each node continuously over an infinite time horizon
The objective is to achieve the maximum throughput small average packet delay for a given throughput
packet generation rate p
energy generation rate X
packet generation rate p
packet generation rate p
packet generation rate p
packet generation rate p
energy generation rate X
energy generation rate X
energy generation rate X
energy generation rate X
The network evacuation modelWireless Ad-Hoc Networks The network starts with a certain number of packets to be
transmitted to their destination
Each node has a certain amount of energy The objective is
to serve the packets in the smallest number of steps or serve as many packets as possible before the energy at the nodes is depleted
Network Evacuation modelWireless Ad-Hoc Networks
Average residual energy
00
05
10
15
20
100 200 300 400 500 600 700 800 900 1000
of packets sent by each node
Avera
ge r
esid
ual en
erg
y
Minimum-Hop MAX MIN Energy MAX MIN Energy-Hop
hPi
i
Pii
R
Th
min
max
The Minimum-HopThe Minimum-Hop algorithm gives the best average node residual energy at the end of the evacuation problem buthellip
Minimum-Hop MAXMIN Energy MAXMIN Energy-Hop Pi
i
Pii
R
T
min
max
hellipbut the Minimum-HopMinimum-Hop algorithm also gives the worst variance of the residual energy σ2
Ε and the worst energy-depletion times DT
Variance of residual energy
000
005010
015
020
025030
035
040
100 200 300 400 500 600 700 800 900 1000
of packets sent by each node
Vari
an
ce o
f re
sid
ual
en
erg
y
Minimum-Hop SUM MIN Energy SUM MIN Energy-Hop
Pii
Pi
i
R
Th
min
Pii
Pi
i
R
T
minhMinimum-Hop SUMMIN Energy SUMMIN Energy-Hop
Network Evacuation modelWireless Ad-Hoc Networks
Network Evacuation modelWireless Ad-Hoc Networks
Current number of nodes with depleted energy
0
5
10
15
20
2200 3200 4200 5200 6200 7200 8200 9200
time (sec)
Cu
rre
nt
nu
mb
er
of
no
de
s
wit
h d
ep
lete
d e
ne
rgy
Minimum-Hop SUM MIN Energy SUM MIN Energy-Hop
Pii
Pi
i
R
Th
min
Pii
Pi
i
R
T
min SUMMIN Energy SUMMIN Energy-Hop Minimum-Hop h
Node energy-depletion times
RS ReceivedSent ratioReceivedSent ratioReceived to sent packets ratio
00
0204
0608
1012
100 200 300 400 500 600 700 800 900 1000
of packets sent by each node
Rec
eive
d to
sen
t pa
cket
s ra
tio
Minimum-Hop SUM MIN Energy SUM MIN Energy-Hop
hPi
i
Pi
i
R
Th
min
Pii
Pi
i
R
T
min SUMMIN Energy - SUMMIN Energy-Hop Minimum-Hop -
Evacuation problem
The average length of paths usedThe average length of paths usedAverage path length
32
34
36
38
40
42
44
46
100 200 300 400 500 600 700 800 900 1000
of packets sent by each node
Ave
rag
e p
ath
len
gth
Minimum-Hop SUM MIN Energy SUM MIN Energy-Hop
Pii
Pi
i
R
Th
min
Pii
Pi
i
R
T
minhMinimum-Hop SUMMIN Energy SUMMIN Energy-Hop
Network Evacuation modelWireless Ad-Hoc Networks
Network Evacuation modelWireless Ad-Hoc Networks
Current number of nodes with depleted energy
0
5
10
15
20
25
30
35
0 2000 4000 6000 8000 10000 12000
time (sec)
Cu
rren
t n
um
ber
of
no
des w
ith
dep
lete
d e
nerg
y
1 5 10 20 50 100
hPi
i
Pi
i
R
Th
min
Pii
Pi
i
R
T
minMinimum-Hop SUMMIN Energy SUMMIN Energy-Hop
Effect of the topology Update Interval
Capacity constraint
Limitations on an ad-hoc networkunder the infinite time horizon modelWireless Ad-Hoc Networks
Energy constraint1
1
aRLk
Xp
R is the transmission rangeL is the average physical source-destination distance ρ is the energy network densityX is the recharging rateK Krsquo are constants 2leαle4p = Bernoulli packet generation probability per node
X
Upper bound on p
Simulation Results ndash infinite time horizon
Pii
Pii
R
TTRf
min
)(Multicost algorithm with
Infinite time horizon modelWireless Ad-Hoc Networks
Optical Burst Switched Networks
Packets destined to the same egress node and with similar QoS requirements are aggregated into bursts A control packet is sent to reserve resources and is processed electronically the burst follows after an offset time and stays in the optical domain
Tell-and-wait protocolsTell-and-go protocols
OBS network
WDM linksLegacy networks
Controlchannels
Data channels
off set
OBS node
Burst size kB divide MB
Switching timesms divide s
Out- of- band signal
Reserv manager
Assemblymanager
OBS network
WDM linksLegacy networks
Controlchannels
Data channels
off set
OBS node
Burst size kB divide MB
Switching timesms divide s
Out- of- band signal
Reserv manager
Assemblymanager
Burst Routing and Scheduling Problem Given Network with links of known propagation delays dl and
link utilization profiles Source A wants to send a burst of size I bits and duration B=IC to some destination G
We want to find a feasible path and the time at which the burst should start transmission so as to optimize the burst reception time at its destination (or hop count orhellip)
A tell-and-go or a tell-and-wait reservation scheme is used to send the burst
r
r
r
0000011111111
0111111111111
1111111111111
r
0000011111111
r
1111111111111
A
B
C
G
dCB=1
Multicost Burst Routing and Scheduling
Each link l is assigned a vector Vl Vl =(dl Ĉl)=(dl c1lc2lhellipcdl)
A cost vector is defined for a path p based on the cost vectors of its links
p1 dominates p2 (notation p1 gtp2) iff
11 1
( ) def kk k
ll l ll l
V p V d C
1 21 2
and l l l ll p l p
l p l p
d d C C
1) Calculate the set Pn-d of non-dominated paths
2) Apply an optimization function f(V(p)) to the path cost vectors to select the optimal one
Path Binary Capacity Availability Vector
Transmission of the CAV from node A to a source node C requires time equal to the propagation delay dAC
Assuming that the propagation delays are the same in both directions any data sent from A will incur to reach C dAC
Source A shifts the received CAV by 2dAC
The Capacity Availability Vector of a path is computed
AB ABAB BC AB BC AB BCd 2dABC amp (A) amp C C C C LSH (C C LSH (C) )
Polynomial Time Heuristic Algorithm
The number of non-dominated paths may be exponential Heuristic variations of the multicost algorithm define a
pseudo-domination relation gtps The pseudo-domination relation can be used to prune
paths yielding a set Pn-ps-d Pn-d
of non-pseudo-dominated paths of polynomial cardinality
Eg (Availability Weighted heuristic algorithm)
p1 pseudo-dominates p2 (p1 gtps p2) iff
1 21 2
and ( ) ( )l l l ll p l p
l p l p
d d weight weightC C
Delay vs traffic load ( =300kB)
The optimal multicost algorithm outperforms the Dijkstra and the DijkstraCA algorithms
Marginal difference between the optimal algo and the AW and CSA heuristic algorithms
I
0
2
4
6
8
0 20 40 60 80 100 120 140
Arrival Rate λ ( burstssec)
End
-to-
end
dela
y (m
sec)
Dijkstra
Optimal multicost
AW heuristic multicost
CSA heuristic multicost
DijkstraCA
The propagation delays in the network play a significant role on the link state information exchange mechanism
0
2
4
6
8
0 20 40 60 80 100
Arrival Rate λ ( burstssec)
End
-to-
end
dela
y (m
sec)
AW heuristic multicost - 200kmDijkstraCA - 200kmAW heuristic multicost- 100kmDijkstraCA - 100kmAW heuristic multicost - 50kmDijkstraCA - 50km
MaxndashMin Fair Share Networks
In a max min fair share network the connections using a particular link get a ldquofair sharerdquo of the link bandwidth
Cost Parameters
bullh number of links
bullr available capacity Usually the capacity of a link is taken to be the residual link bandwidth In the max min fair share networks however r is an estimate of the max min fair rate that would be obtained by the new connection if admitted
bulld path propagation delay
Routing algorithms tested MaxndashMin Fair Share Networks
Multicost cost functions (hrd) f(hr) = hr f(dbr) = d + br f1(dbrh) = (d + br)h f2(dbrh) = (d + br)hn
Widest-shortest path min(h)In case of a tie the one with maximum capacity is selected
Shortest-widest path max(r) In case of a tie the one with the minimum of hops is selected
bullb the amount of data to be transmitted
Simulation ResultsMaxndashMin Fair Share Networks
Metrics Average delay (when MCR = 0 ) Probability of success for a new connection (when MCR ne 0)
Topologies considered a random network and a 4x4 mesh network with varying capacities
MaxndashMin Fair Share Networks
MCR = 0 Random topology f(dbrh) = (d + br)h
MaxndashMin Fair Share Networks
MCR ne 0 Mesh topology f(dbrh) = (d + br)h05
Simulation ResultsMaxndashMin Fair Share Networks
Capacity availability definition
MCR = 0 Mesh and Random topology f(dbrh) = (d + br)h05
Simulation ResultsMaxndashMin Fair Share Networks
Link utilization information updates (P = 10 50 100)
MCR = 0 transmission time gtgt propagation time Mesh topology f(dbrh) = (d + br)h05
Conclusionsfor Wireless Ad-Hoc Networks
Multi-cost algorithms that take energy into account result in
Increased network lifetime More evenly spread energy consumption Higher throughput
The SUMMIN energy-hop algorithm where the cost function is
gives the most balanced results (in terms of node residual
energy energy variance packets dropped depletion times number of hops on paths taken)
The performance benefits diminish when the limitation posed by the network capacity is approached
Pii
Pi
i
R
Th
min
f (h T R) =
Conclusions for OBS networks
The proposed multicost burst routing and scheduling algorithm and its heuristic variations significantly outperform other simulated algorithms
The optimal multicost algorithm is not polynomial but the proposed AW multicost heuristic algorithm has polynomial complexity and performance that is very close to that of the optimal algorithm
The improvements obtained are more significant for small propagation delays
Conclusionsfor max-min fare share networks
Multi-cost algorithms can result in
Lower blocking probability Lower average delay
The algorithm that uses the cost function
f(dbrh) = (d + br)h05 gives the best results
The term r is an estimate of the max min fair rate that would be obtained by the new connection if admitted
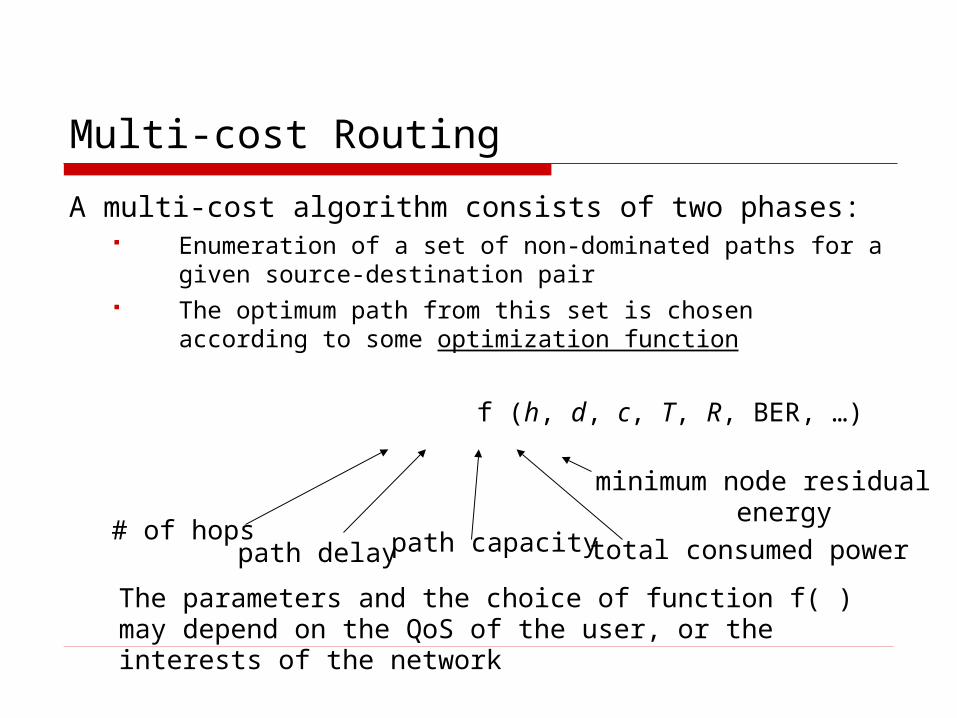
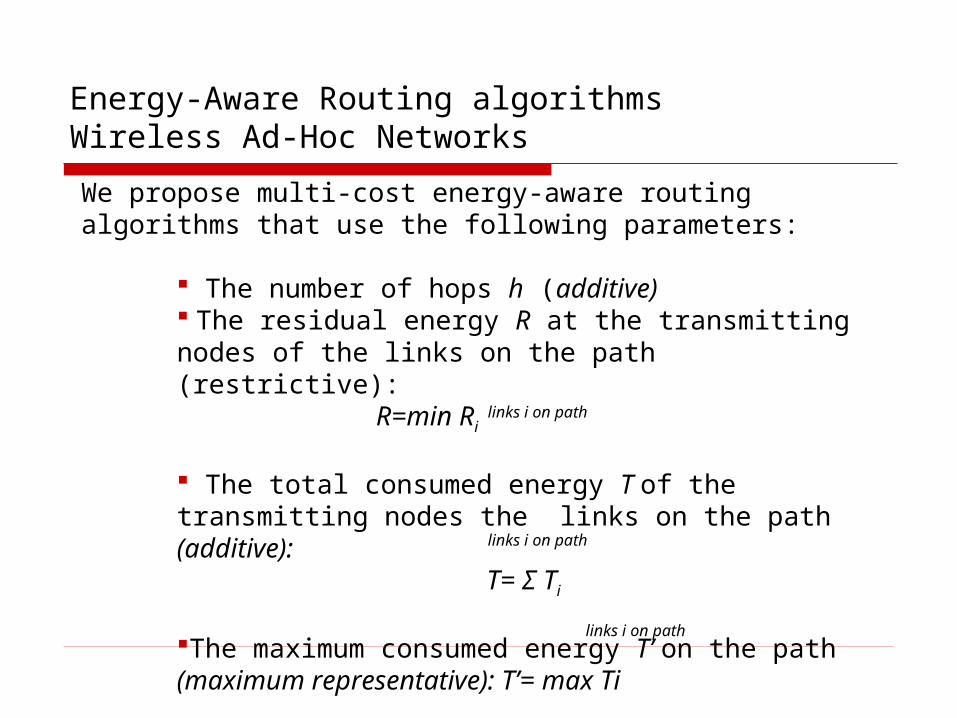
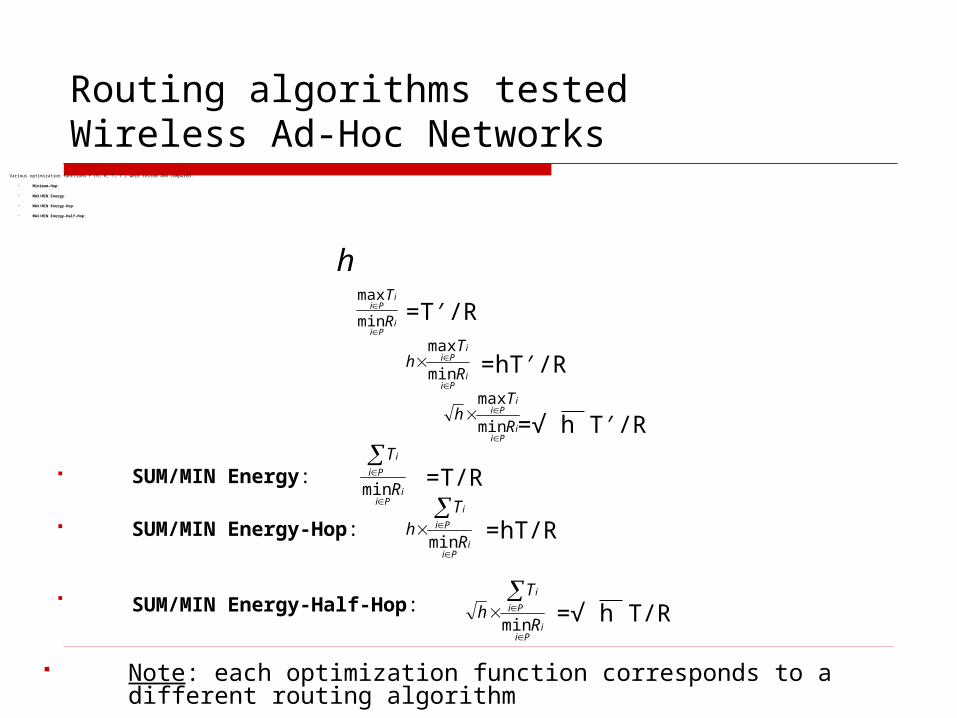
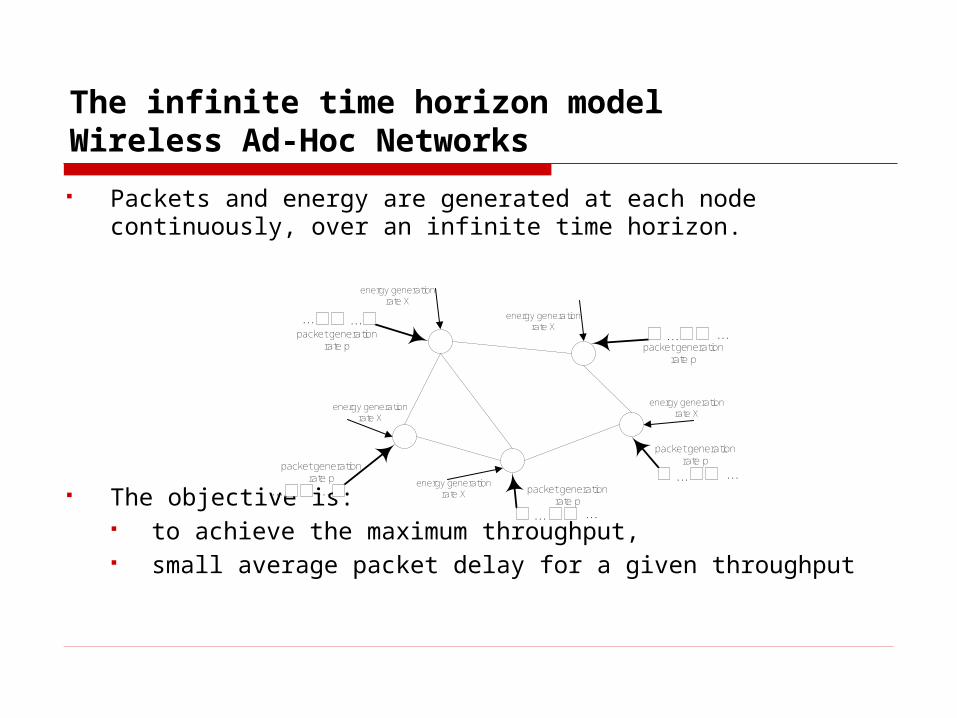
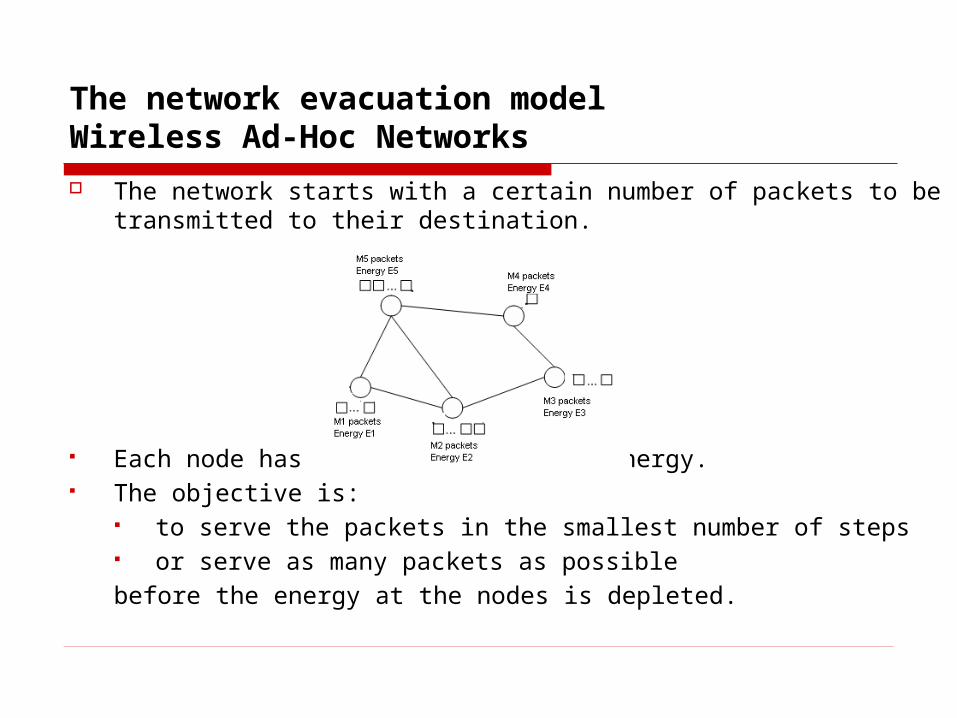
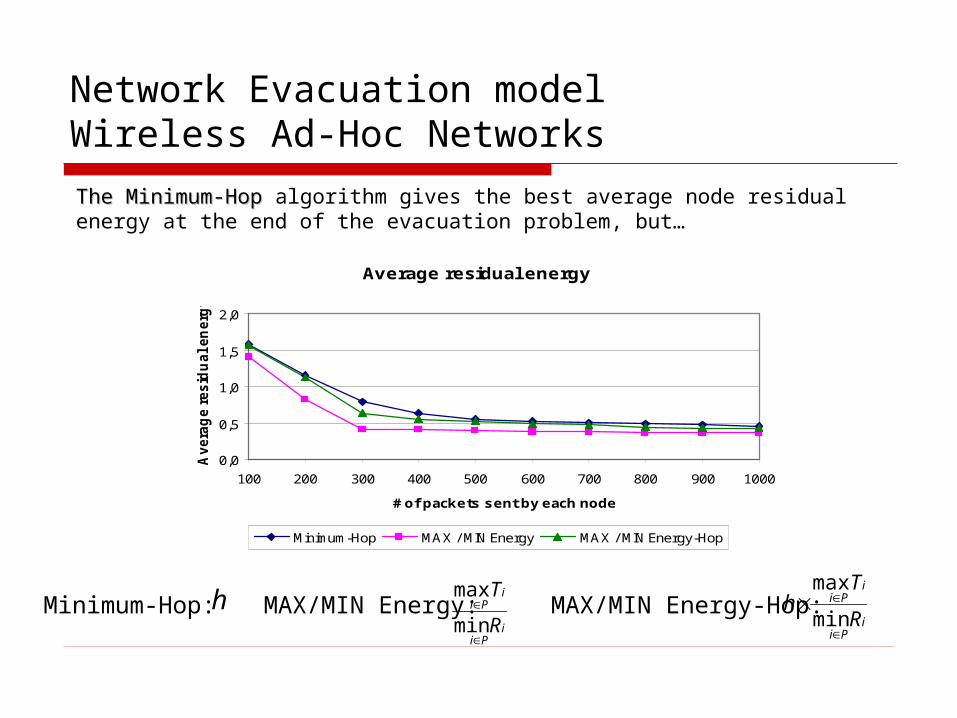
Network Evacuation modelWireless Ad-Hoc Networks
Average residual energy
00
05
10
15
20
100 200 300 400 500 600 700 800 900 1000
of packets sent by each node
Avera
ge r
esid
ual en
erg
y
Minimum-Hop MAX MIN Energy MAX MIN Energy-Hop
hPi
i
Pii
R
Th
min
max
The Minimum-HopThe Minimum-Hop algorithm gives the best average node residual energy at the end of the evacuation problem buthellip
Minimum-Hop MAXMIN Energy MAXMIN Energy-Hop Pi
i
Pii
R
T
min
max
hellipbut the Minimum-HopMinimum-Hop algorithm also gives the worst variance of the residual energy σ2
Ε and the worst energy-depletion times DT
Variance of residual energy
000
005010
015
020
025030
035
040
100 200 300 400 500 600 700 800 900 1000
of packets sent by each node
Vari
an
ce o
f re
sid
ual
en
erg
y
Minimum-Hop SUM MIN Energy SUM MIN Energy-Hop
Pii
Pi
i
R
Th
min
Pii
Pi
i
R
T
minhMinimum-Hop SUMMIN Energy SUMMIN Energy-Hop
Network Evacuation modelWireless Ad-Hoc Networks
Network Evacuation modelWireless Ad-Hoc Networks
Current number of nodes with depleted energy
0
5
10
15
20
2200 3200 4200 5200 6200 7200 8200 9200
time (sec)
Cu
rre
nt
nu
mb
er
of
no
de
s
wit
h d
ep
lete
d e
ne
rgy
Minimum-Hop SUM MIN Energy SUM MIN Energy-Hop
Pii
Pi
i
R
Th
min
Pii
Pi
i
R
T
min SUMMIN Energy SUMMIN Energy-Hop Minimum-Hop h
Node energy-depletion times
RS ReceivedSent ratioReceivedSent ratioReceived to sent packets ratio
00
0204
0608
1012
100 200 300 400 500 600 700 800 900 1000
of packets sent by each node
Rec
eive
d to
sen
t pa
cket
s ra
tio
Minimum-Hop SUM MIN Energy SUM MIN Energy-Hop
hPi
i
Pi
i
R
Th
min
Pii
Pi
i
R
T
min SUMMIN Energy - SUMMIN Energy-Hop Minimum-Hop -
Evacuation problem
The average length of paths usedThe average length of paths usedAverage path length
32
34
36
38
40
42
44
46
100 200 300 400 500 600 700 800 900 1000
of packets sent by each node
Ave
rag
e p
ath
len
gth
Minimum-Hop SUM MIN Energy SUM MIN Energy-Hop
Pii
Pi
i
R
Th
min
Pii
Pi
i
R
T
minhMinimum-Hop SUMMIN Energy SUMMIN Energy-Hop
Network Evacuation modelWireless Ad-Hoc Networks
Network Evacuation modelWireless Ad-Hoc Networks
Current number of nodes with depleted energy
0
5
10
15
20
25
30
35
0 2000 4000 6000 8000 10000 12000
time (sec)
Cu
rren
t n
um
ber
of
no
des w
ith
dep
lete
d e
nerg
y
1 5 10 20 50 100
hPi
i
Pi
i
R
Th
min
Pii
Pi
i
R
T
minMinimum-Hop SUMMIN Energy SUMMIN Energy-Hop
Effect of the topology Update Interval
Capacity constraint
Limitations on an ad-hoc networkunder the infinite time horizon modelWireless Ad-Hoc Networks
Energy constraint1
1
aRLk
Xp
R is the transmission rangeL is the average physical source-destination distance ρ is the energy network densityX is the recharging rateK Krsquo are constants 2leαle4p = Bernoulli packet generation probability per node
X
Upper bound on p
Simulation Results ndash infinite time horizon
Pii
Pii
R
TTRf
min
)(Multicost algorithm with
Infinite time horizon modelWireless Ad-Hoc Networks
Optical Burst Switched Networks
Packets destined to the same egress node and with similar QoS requirements are aggregated into bursts A control packet is sent to reserve resources and is processed electronically the burst follows after an offset time and stays in the optical domain
Tell-and-wait protocolsTell-and-go protocols
OBS network
WDM linksLegacy networks
Controlchannels
Data channels
off set
OBS node
Burst size kB divide MB
Switching timesms divide s
Out- of- band signal
Reserv manager
Assemblymanager
OBS network
WDM linksLegacy networks
Controlchannels
Data channels
off set
OBS node
Burst size kB divide MB
Switching timesms divide s
Out- of- band signal
Reserv manager
Assemblymanager
Burst Routing and Scheduling Problem Given Network with links of known propagation delays dl and
link utilization profiles Source A wants to send a burst of size I bits and duration B=IC to some destination G
We want to find a feasible path and the time at which the burst should start transmission so as to optimize the burst reception time at its destination (or hop count orhellip)
A tell-and-go or a tell-and-wait reservation scheme is used to send the burst
r
r
r
0000011111111
0111111111111
1111111111111
r
0000011111111
r
1111111111111
A
B
C
G
dCB=1
Multicost Burst Routing and Scheduling
Each link l is assigned a vector Vl Vl =(dl Ĉl)=(dl c1lc2lhellipcdl)
A cost vector is defined for a path p based on the cost vectors of its links
p1 dominates p2 (notation p1 gtp2) iff
11 1
( ) def kk k
ll l ll l
V p V d C
1 21 2
and l l l ll p l p
l p l p
d d C C
1) Calculate the set Pn-d of non-dominated paths
2) Apply an optimization function f(V(p)) to the path cost vectors to select the optimal one
Path Binary Capacity Availability Vector
Transmission of the CAV from node A to a source node C requires time equal to the propagation delay dAC
Assuming that the propagation delays are the same in both directions any data sent from A will incur to reach C dAC
Source A shifts the received CAV by 2dAC
The Capacity Availability Vector of a path is computed
AB ABAB BC AB BC AB BCd 2dABC amp (A) amp C C C C LSH (C C LSH (C) )
Polynomial Time Heuristic Algorithm
The number of non-dominated paths may be exponential Heuristic variations of the multicost algorithm define a
pseudo-domination relation gtps The pseudo-domination relation can be used to prune
paths yielding a set Pn-ps-d Pn-d
of non-pseudo-dominated paths of polynomial cardinality
Eg (Availability Weighted heuristic algorithm)
p1 pseudo-dominates p2 (p1 gtps p2) iff
1 21 2
and ( ) ( )l l l ll p l p
l p l p
d d weight weightC C
Delay vs traffic load ( =300kB)
The optimal multicost algorithm outperforms the Dijkstra and the DijkstraCA algorithms
Marginal difference between the optimal algo and the AW and CSA heuristic algorithms
I
0
2
4
6
8
0 20 40 60 80 100 120 140
Arrival Rate λ ( burstssec)
End
-to-
end
dela
y (m
sec)
Dijkstra
Optimal multicost
AW heuristic multicost
CSA heuristic multicost
DijkstraCA
The propagation delays in the network play a significant role on the link state information exchange mechanism
0
2
4
6
8
0 20 40 60 80 100
Arrival Rate λ ( burstssec)
End
-to-
end
dela
y (m
sec)
AW heuristic multicost - 200kmDijkstraCA - 200kmAW heuristic multicost- 100kmDijkstraCA - 100kmAW heuristic multicost - 50kmDijkstraCA - 50km
MaxndashMin Fair Share Networks
In a max min fair share network the connections using a particular link get a ldquofair sharerdquo of the link bandwidth
Cost Parameters
bullh number of links
bullr available capacity Usually the capacity of a link is taken to be the residual link bandwidth In the max min fair share networks however r is an estimate of the max min fair rate that would be obtained by the new connection if admitted
bulld path propagation delay
Routing algorithms tested MaxndashMin Fair Share Networks
Multicost cost functions (hrd) f(hr) = hr f(dbr) = d + br f1(dbrh) = (d + br)h f2(dbrh) = (d + br)hn
Widest-shortest path min(h)In case of a tie the one with maximum capacity is selected
Shortest-widest path max(r) In case of a tie the one with the minimum of hops is selected
bullb the amount of data to be transmitted
Simulation ResultsMaxndashMin Fair Share Networks
Metrics Average delay (when MCR = 0 ) Probability of success for a new connection (when MCR ne 0)
Topologies considered a random network and a 4x4 mesh network with varying capacities
MaxndashMin Fair Share Networks
MCR = 0 Random topology f(dbrh) = (d + br)h
MaxndashMin Fair Share Networks
MCR ne 0 Mesh topology f(dbrh) = (d + br)h05
Simulation ResultsMaxndashMin Fair Share Networks
Capacity availability definition
MCR = 0 Mesh and Random topology f(dbrh) = (d + br)h05
Simulation ResultsMaxndashMin Fair Share Networks
Link utilization information updates (P = 10 50 100)
MCR = 0 transmission time gtgt propagation time Mesh topology f(dbrh) = (d + br)h05
Conclusionsfor Wireless Ad-Hoc Networks
Multi-cost algorithms that take energy into account result in
Increased network lifetime More evenly spread energy consumption Higher throughput
The SUMMIN energy-hop algorithm where the cost function is
gives the most balanced results (in terms of node residual
energy energy variance packets dropped depletion times number of hops on paths taken)
The performance benefits diminish when the limitation posed by the network capacity is approached
Pii
Pi
i
R
Th
min
f (h T R) =
Conclusions for OBS networks
The proposed multicost burst routing and scheduling algorithm and its heuristic variations significantly outperform other simulated algorithms
The optimal multicost algorithm is not polynomial but the proposed AW multicost heuristic algorithm has polynomial complexity and performance that is very close to that of the optimal algorithm
The improvements obtained are more significant for small propagation delays
Conclusionsfor max-min fare share networks
Multi-cost algorithms can result in
Lower blocking probability Lower average delay
The algorithm that uses the cost function
f(dbrh) = (d + br)h05 gives the best results
The term r is an estimate of the max min fair rate that would be obtained by the new connection if admitted
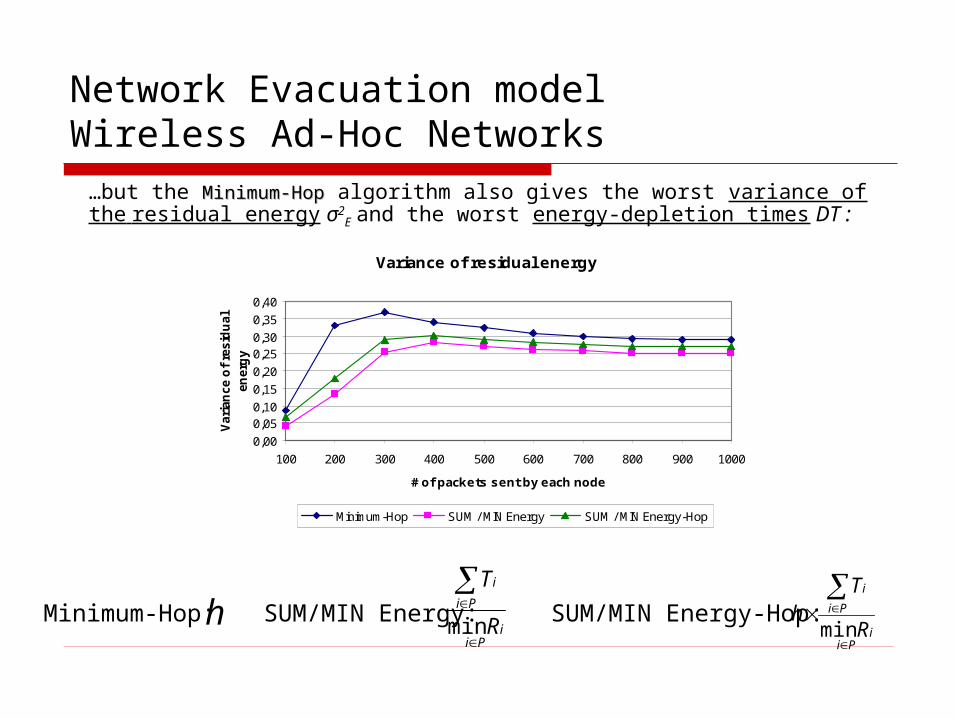
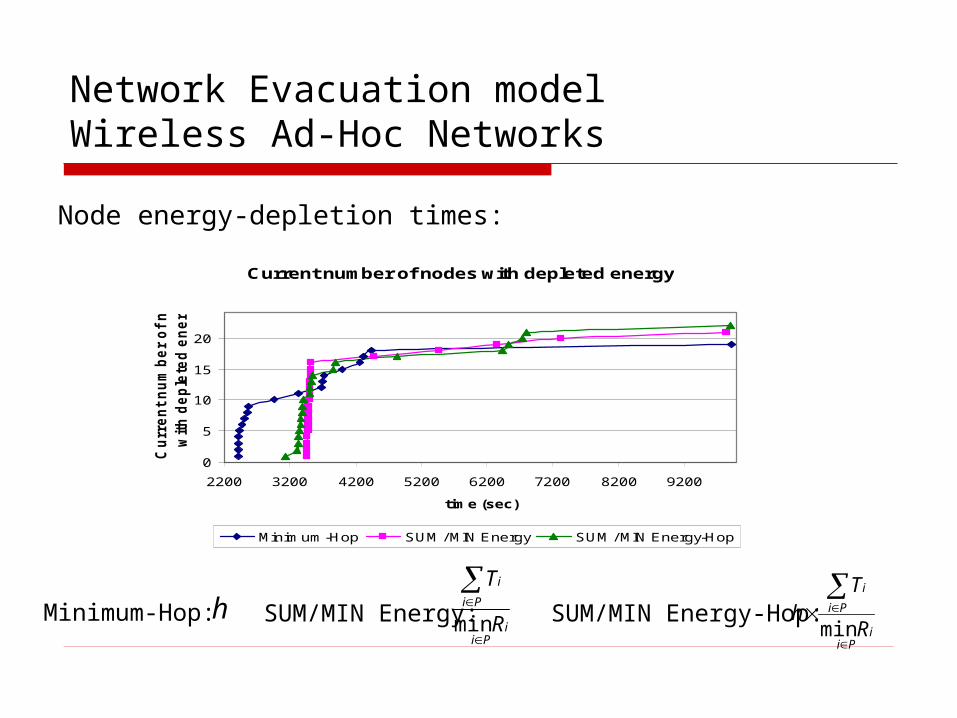
Network Evacuation modelWireless Ad-Hoc Networks
Current number of nodes with depleted energy
0
5
10
15
20
2200 3200 4200 5200 6200 7200 8200 9200
time (sec)
Cu
rre
nt
nu
mb
er
of
no
de
s
wit
h d
ep
lete
d e
ne
rgy
Minimum-Hop SUM MIN Energy SUM MIN Energy-Hop
Pii
Pi
i
R
Th
min
Pii
Pi
i
R
T
min SUMMIN Energy SUMMIN Energy-Hop Minimum-Hop h
Node energy-depletion times
RS ReceivedSent ratioReceivedSent ratioReceived to sent packets ratio
00
0204
0608
1012
100 200 300 400 500 600 700 800 900 1000
of packets sent by each node
Rec
eive
d to
sen
t pa
cket
s ra
tio
Minimum-Hop SUM MIN Energy SUM MIN Energy-Hop
hPi
i
Pi
i
R
Th
min
Pii
Pi
i
R
T
min SUMMIN Energy - SUMMIN Energy-Hop Minimum-Hop -
Evacuation problem
The average length of paths usedThe average length of paths usedAverage path length
32
34
36
38
40
42
44
46
100 200 300 400 500 600 700 800 900 1000
of packets sent by each node
Ave
rag
e p
ath
len
gth
Minimum-Hop SUM MIN Energy SUM MIN Energy-Hop
Pii
Pi
i
R
Th
min
Pii
Pi
i
R
T
minhMinimum-Hop SUMMIN Energy SUMMIN Energy-Hop
Network Evacuation modelWireless Ad-Hoc Networks
Network Evacuation modelWireless Ad-Hoc Networks
Current number of nodes with depleted energy
0
5
10
15
20
25
30
35
0 2000 4000 6000 8000 10000 12000
time (sec)
Cu
rren
t n
um
ber
of
no
des w
ith
dep
lete
d e
nerg
y
1 5 10 20 50 100
hPi
i
Pi
i
R
Th
min
Pii
Pi
i
R
T
minMinimum-Hop SUMMIN Energy SUMMIN Energy-Hop
Effect of the topology Update Interval
Capacity constraint
Limitations on an ad-hoc networkunder the infinite time horizon modelWireless Ad-Hoc Networks
Energy constraint1
1
aRLk
Xp
R is the transmission rangeL is the average physical source-destination distance ρ is the energy network densityX is the recharging rateK Krsquo are constants 2leαle4p = Bernoulli packet generation probability per node
X
Upper bound on p
Simulation Results ndash infinite time horizon
Pii
Pii
R
TTRf
min
)(Multicost algorithm with
Infinite time horizon modelWireless Ad-Hoc Networks
Optical Burst Switched Networks
Packets destined to the same egress node and with similar QoS requirements are aggregated into bursts A control packet is sent to reserve resources and is processed electronically the burst follows after an offset time and stays in the optical domain
Tell-and-wait protocolsTell-and-go protocols
OBS network
WDM linksLegacy networks
Controlchannels
Data channels
off set
OBS node
Burst size kB divide MB
Switching timesms divide s
Out- of- band signal
Reserv manager
Assemblymanager
OBS network
WDM linksLegacy networks
Controlchannels
Data channels
off set
OBS node
Burst size kB divide MB
Switching timesms divide s
Out- of- band signal
Reserv manager
Assemblymanager
Burst Routing and Scheduling Problem Given Network with links of known propagation delays dl and
link utilization profiles Source A wants to send a burst of size I bits and duration B=IC to some destination G
We want to find a feasible path and the time at which the burst should start transmission so as to optimize the burst reception time at its destination (or hop count orhellip)
A tell-and-go or a tell-and-wait reservation scheme is used to send the burst
r
r
r
0000011111111
0111111111111
1111111111111
r
0000011111111
r
1111111111111
A
B
C
G
dCB=1
Multicost Burst Routing and Scheduling
Each link l is assigned a vector Vl Vl =(dl Ĉl)=(dl c1lc2lhellipcdl)
A cost vector is defined for a path p based on the cost vectors of its links
p1 dominates p2 (notation p1 gtp2) iff
11 1
( ) def kk k
ll l ll l
V p V d C
1 21 2
and l l l ll p l p
l p l p
d d C C
1) Calculate the set Pn-d of non-dominated paths
2) Apply an optimization function f(V(p)) to the path cost vectors to select the optimal one
Path Binary Capacity Availability Vector
Transmission of the CAV from node A to a source node C requires time equal to the propagation delay dAC
Assuming that the propagation delays are the same in both directions any data sent from A will incur to reach C dAC
Source A shifts the received CAV by 2dAC
The Capacity Availability Vector of a path is computed
AB ABAB BC AB BC AB BCd 2dABC amp (A) amp C C C C LSH (C C LSH (C) )
Polynomial Time Heuristic Algorithm
The number of non-dominated paths may be exponential Heuristic variations of the multicost algorithm define a
pseudo-domination relation gtps The pseudo-domination relation can be used to prune
paths yielding a set Pn-ps-d Pn-d
of non-pseudo-dominated paths of polynomial cardinality
Eg (Availability Weighted heuristic algorithm)
p1 pseudo-dominates p2 (p1 gtps p2) iff
1 21 2
and ( ) ( )l l l ll p l p
l p l p
d d weight weightC C
Delay vs traffic load ( =300kB)
The optimal multicost algorithm outperforms the Dijkstra and the DijkstraCA algorithms
Marginal difference between the optimal algo and the AW and CSA heuristic algorithms
I
0
2
4
6
8
0 20 40 60 80 100 120 140
Arrival Rate λ ( burstssec)
End
-to-
end
dela
y (m
sec)
Dijkstra
Optimal multicost
AW heuristic multicost
CSA heuristic multicost
DijkstraCA
The propagation delays in the network play a significant role on the link state information exchange mechanism
0
2
4
6
8
0 20 40 60 80 100
Arrival Rate λ ( burstssec)
End
-to-
end
dela
y (m
sec)
AW heuristic multicost - 200kmDijkstraCA - 200kmAW heuristic multicost- 100kmDijkstraCA - 100kmAW heuristic multicost - 50kmDijkstraCA - 50km
MaxndashMin Fair Share Networks
In a max min fair share network the connections using a particular link get a ldquofair sharerdquo of the link bandwidth
Cost Parameters
bullh number of links
bullr available capacity Usually the capacity of a link is taken to be the residual link bandwidth In the max min fair share networks however r is an estimate of the max min fair rate that would be obtained by the new connection if admitted
bulld path propagation delay
Routing algorithms tested MaxndashMin Fair Share Networks
Multicost cost functions (hrd) f(hr) = hr f(dbr) = d + br f1(dbrh) = (d + br)h f2(dbrh) = (d + br)hn
Widest-shortest path min(h)In case of a tie the one with maximum capacity is selected
Shortest-widest path max(r) In case of a tie the one with the minimum of hops is selected
bullb the amount of data to be transmitted
Simulation ResultsMaxndashMin Fair Share Networks
Metrics Average delay (when MCR = 0 ) Probability of success for a new connection (when MCR ne 0)
Topologies considered a random network and a 4x4 mesh network with varying capacities
MaxndashMin Fair Share Networks
MCR = 0 Random topology f(dbrh) = (d + br)h
MaxndashMin Fair Share Networks
MCR ne 0 Mesh topology f(dbrh) = (d + br)h05
Simulation ResultsMaxndashMin Fair Share Networks
Capacity availability definition
MCR = 0 Mesh and Random topology f(dbrh) = (d + br)h05
Simulation ResultsMaxndashMin Fair Share Networks
Link utilization information updates (P = 10 50 100)
MCR = 0 transmission time gtgt propagation time Mesh topology f(dbrh) = (d + br)h05
Conclusionsfor Wireless Ad-Hoc Networks
Multi-cost algorithms that take energy into account result in
Increased network lifetime More evenly spread energy consumption Higher throughput
The SUMMIN energy-hop algorithm where the cost function is
gives the most balanced results (in terms of node residual
energy energy variance packets dropped depletion times number of hops on paths taken)
The performance benefits diminish when the limitation posed by the network capacity is approached
Pii
Pi
i
R
Th
min
f (h T R) =
Conclusions for OBS networks
The proposed multicost burst routing and scheduling algorithm and its heuristic variations significantly outperform other simulated algorithms
The optimal multicost algorithm is not polynomial but the proposed AW multicost heuristic algorithm has polynomial complexity and performance that is very close to that of the optimal algorithm
The improvements obtained are more significant for small propagation delays
Conclusionsfor max-min fare share networks
Multi-cost algorithms can result in
Lower blocking probability Lower average delay
The algorithm that uses the cost function
f(dbrh) = (d + br)h05 gives the best results
The term r is an estimate of the max min fair rate that would be obtained by the new connection if admitted
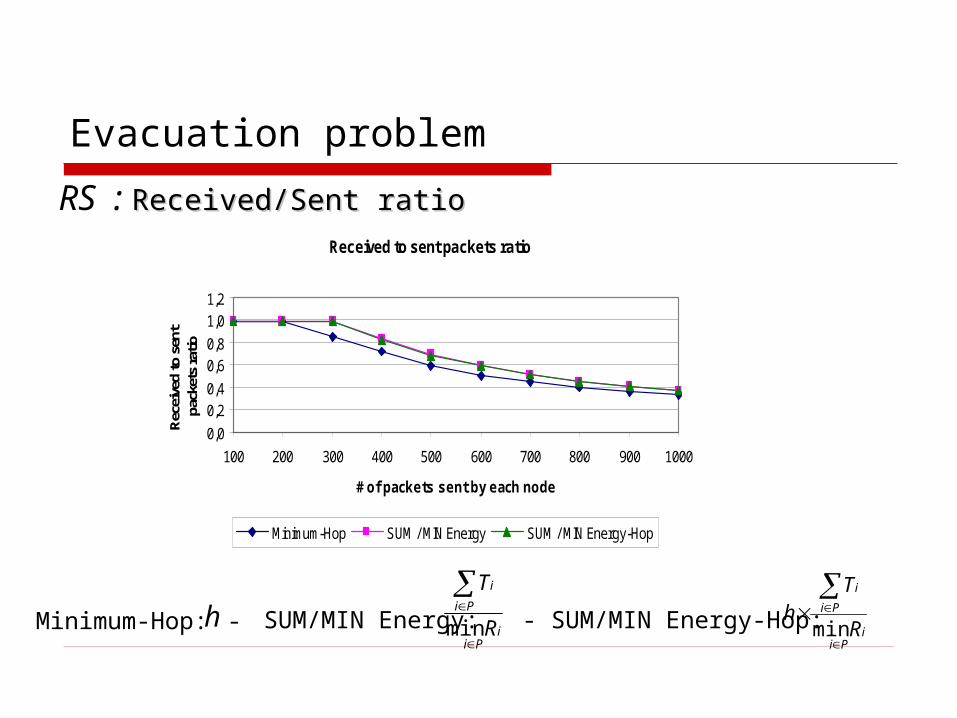
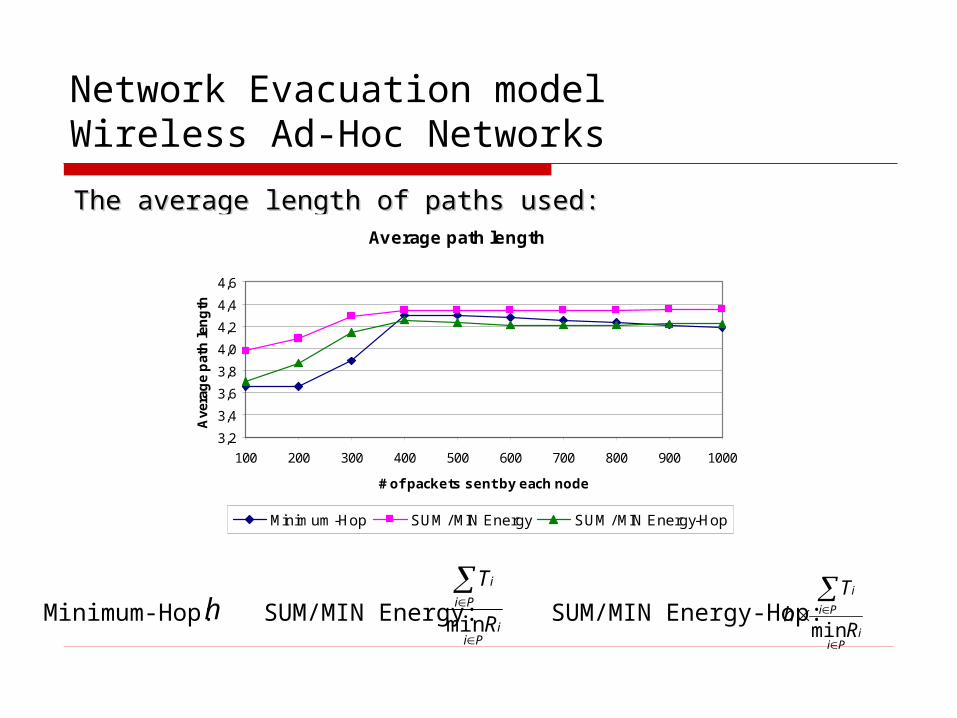
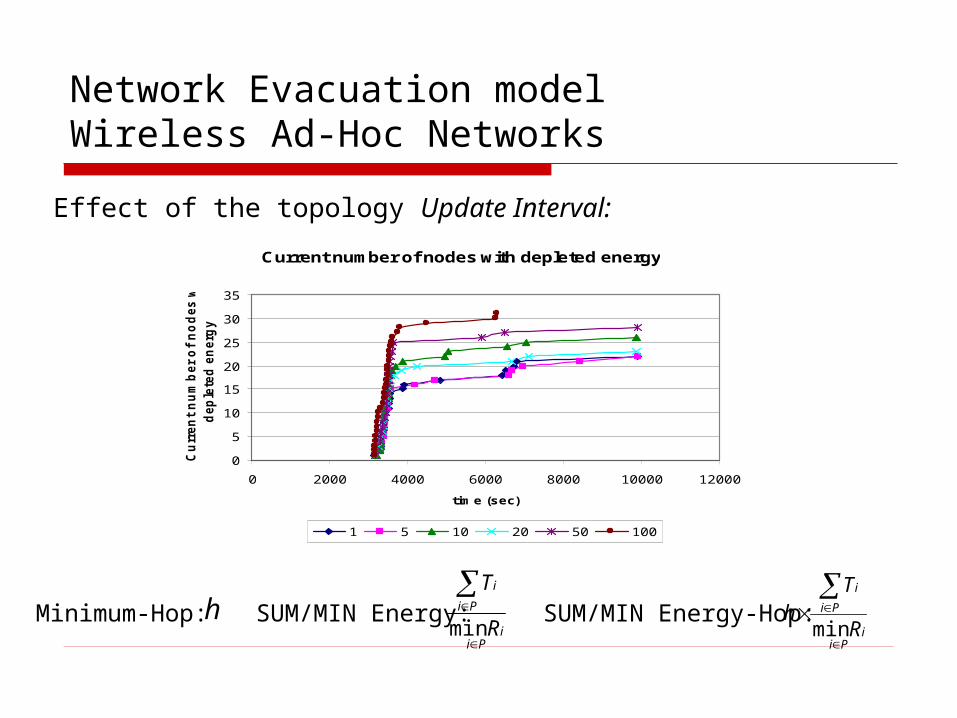
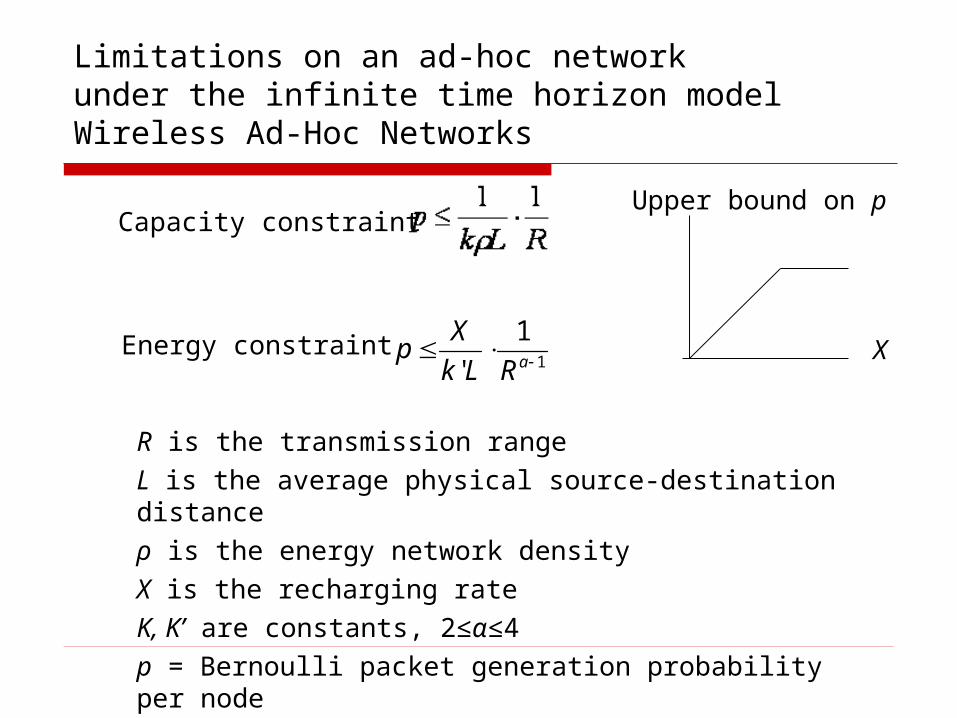
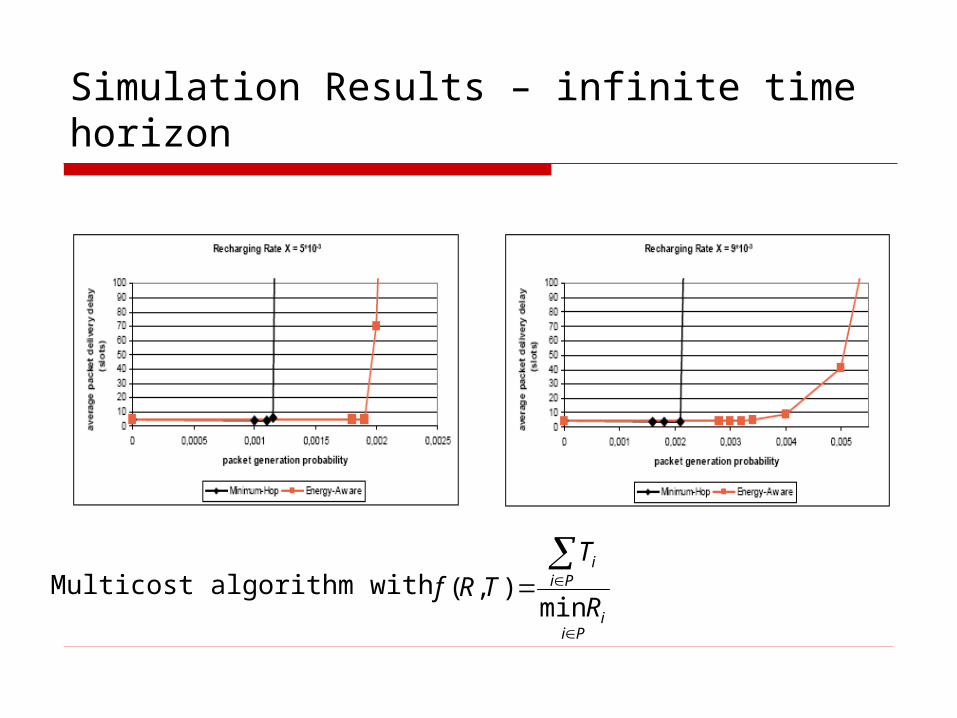
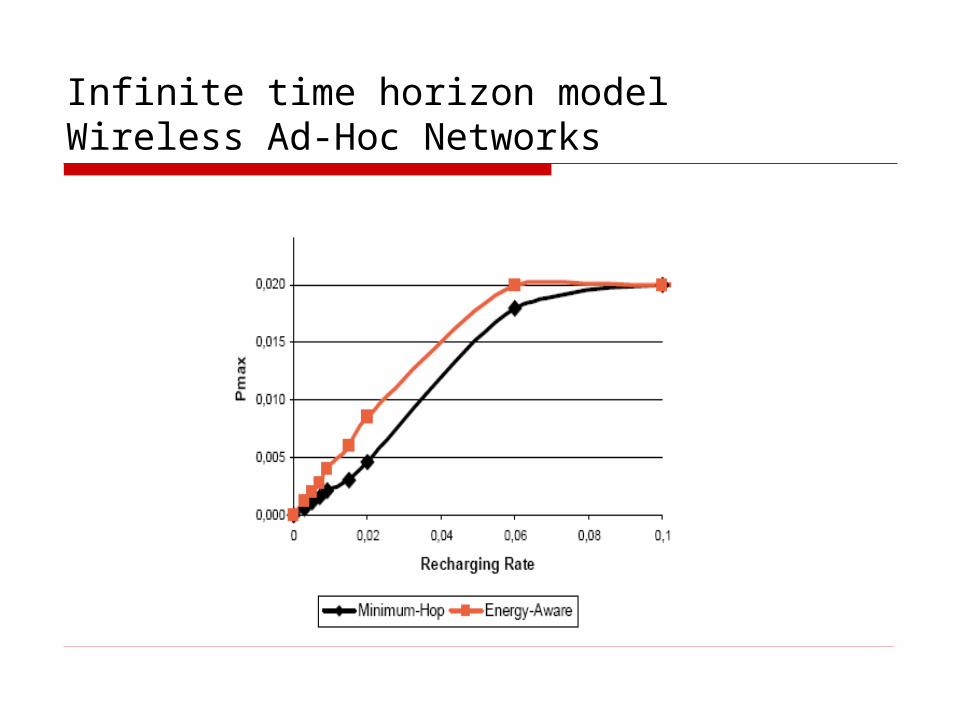
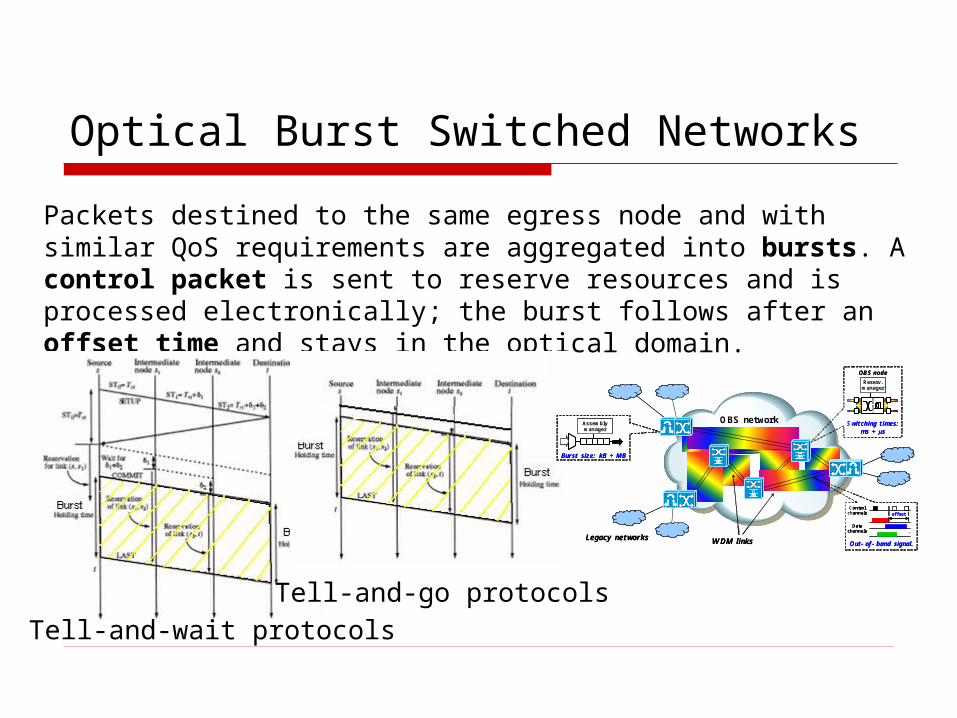
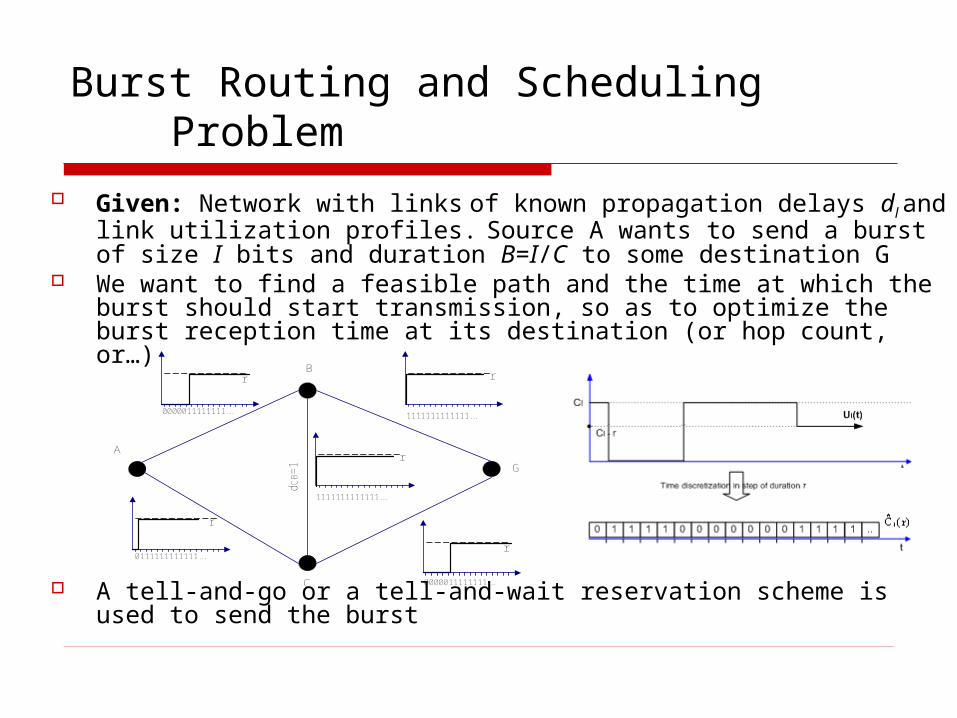
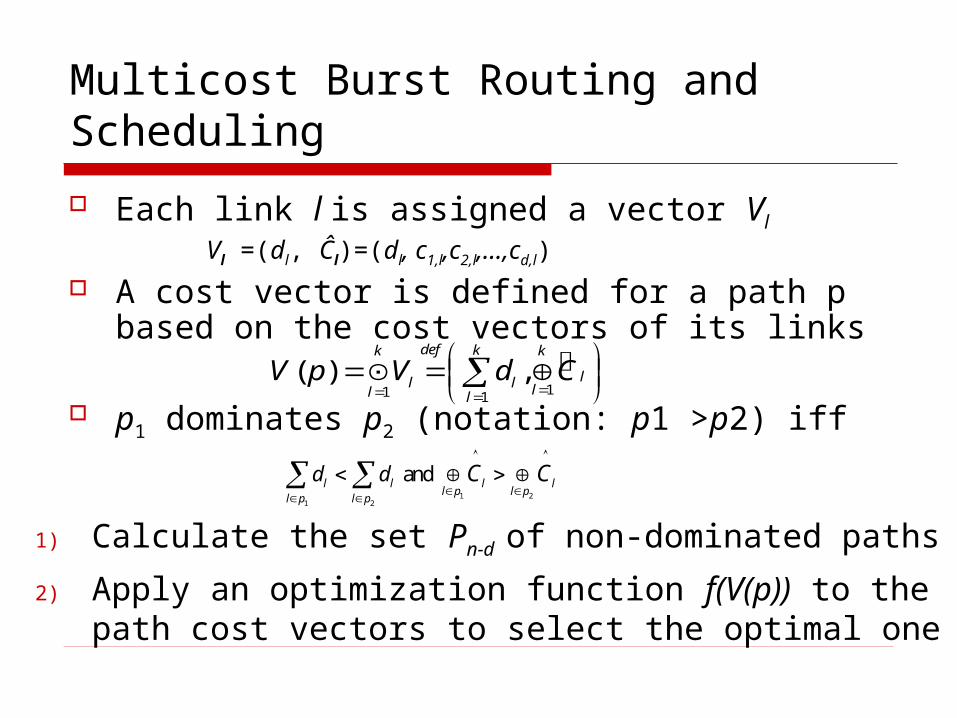
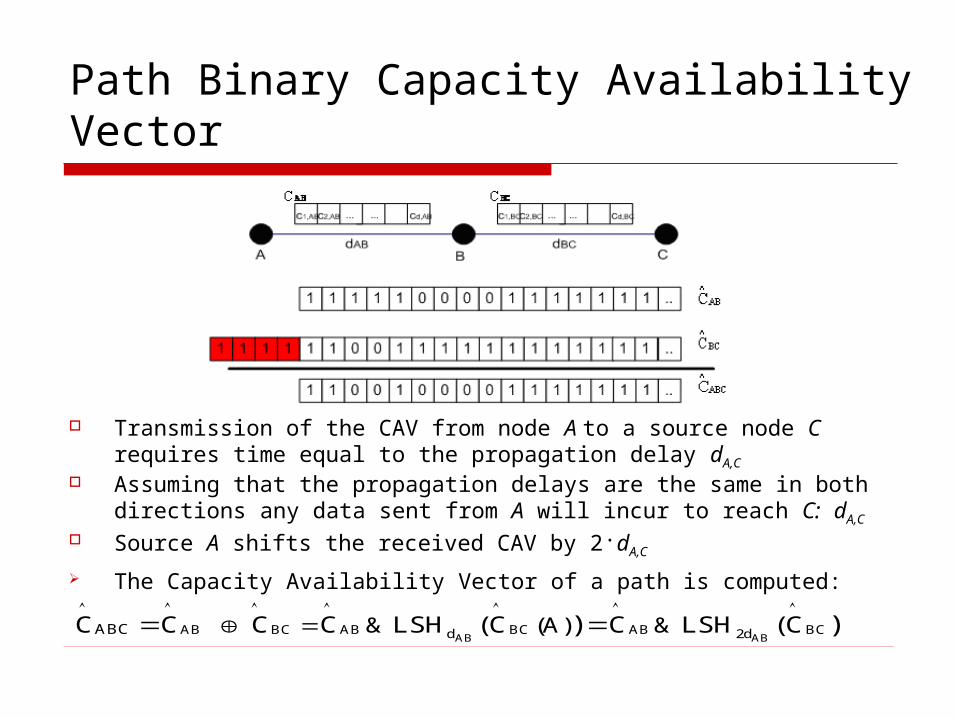
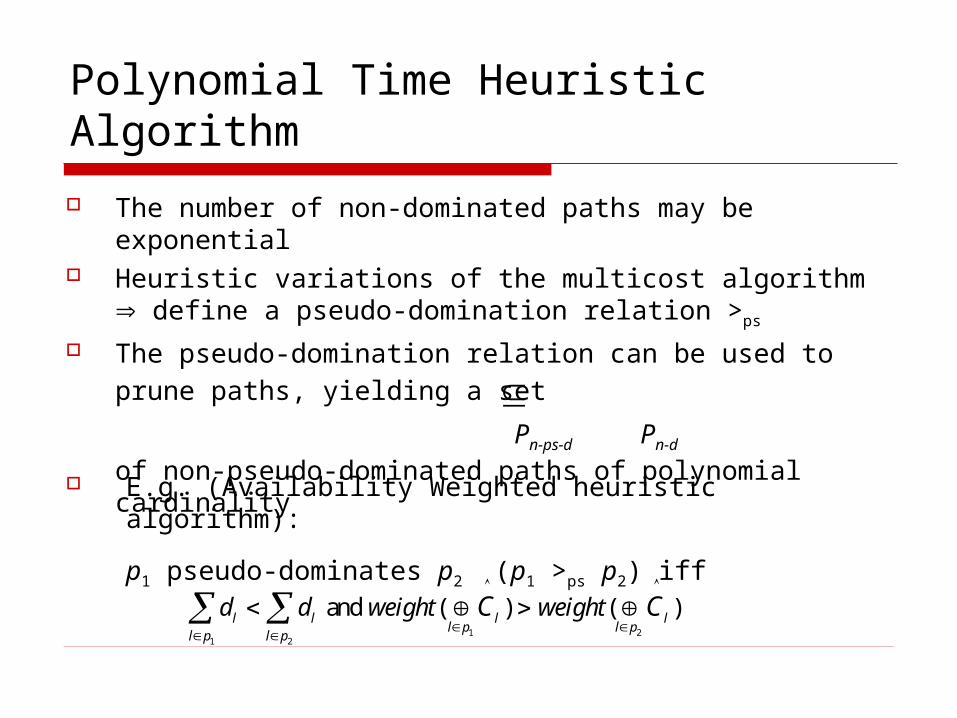
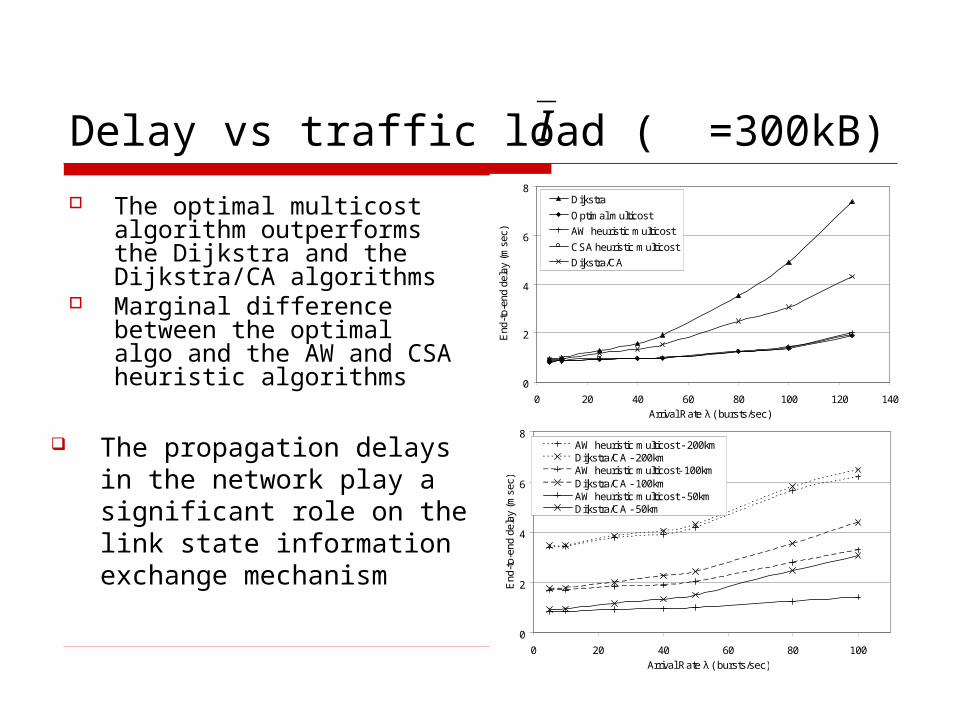
MaxndashMin Fair Share Networks
In a max min fair share network the connections using a particular link get a ldquofair sharerdquo of the link bandwidth
Cost Parameters
bullh number of links
bullr available capacity Usually the capacity of a link is taken to be the residual link bandwidth In the max min fair share networks however r is an estimate of the max min fair rate that would be obtained by the new connection if admitted
bulld path propagation delay
Routing algorithms tested MaxndashMin Fair Share Networks
Multicost cost functions (hrd) f(hr) = hr f(dbr) = d + br f1(dbrh) = (d + br)h f2(dbrh) = (d + br)hn
Widest-shortest path min(h)In case of a tie the one with maximum capacity is selected
Shortest-widest path max(r) In case of a tie the one with the minimum of hops is selected
bullb the amount of data to be transmitted
Simulation ResultsMaxndashMin Fair Share Networks
Metrics Average delay (when MCR = 0 ) Probability of success for a new connection (when MCR ne 0)
Topologies considered a random network and a 4x4 mesh network with varying capacities
MaxndashMin Fair Share Networks
MCR = 0 Random topology f(dbrh) = (d + br)h
MaxndashMin Fair Share Networks
MCR ne 0 Mesh topology f(dbrh) = (d + br)h05
Simulation ResultsMaxndashMin Fair Share Networks
Capacity availability definition
MCR = 0 Mesh and Random topology f(dbrh) = (d + br)h05
Simulation ResultsMaxndashMin Fair Share Networks
Link utilization information updates (P = 10 50 100)
MCR = 0 transmission time gtgt propagation time Mesh topology f(dbrh) = (d + br)h05
Conclusionsfor Wireless Ad-Hoc Networks
Multi-cost algorithms that take energy into account result in
Increased network lifetime More evenly spread energy consumption Higher throughput
The SUMMIN energy-hop algorithm where the cost function is
gives the most balanced results (in terms of node residual
energy energy variance packets dropped depletion times number of hops on paths taken)
The performance benefits diminish when the limitation posed by the network capacity is approached
Pii
Pi
i
R
Th
min
f (h T R) =
Conclusions for OBS networks
The proposed multicost burst routing and scheduling algorithm and its heuristic variations significantly outperform other simulated algorithms
The optimal multicost algorithm is not polynomial but the proposed AW multicost heuristic algorithm has polynomial complexity and performance that is very close to that of the optimal algorithm
The improvements obtained are more significant for small propagation delays
Conclusionsfor max-min fare share networks
Multi-cost algorithms can result in
Lower blocking probability Lower average delay
The algorithm that uses the cost function
f(dbrh) = (d + br)h05 gives the best results
The term r is an estimate of the max min fair rate that would be obtained by the new connection if admitted
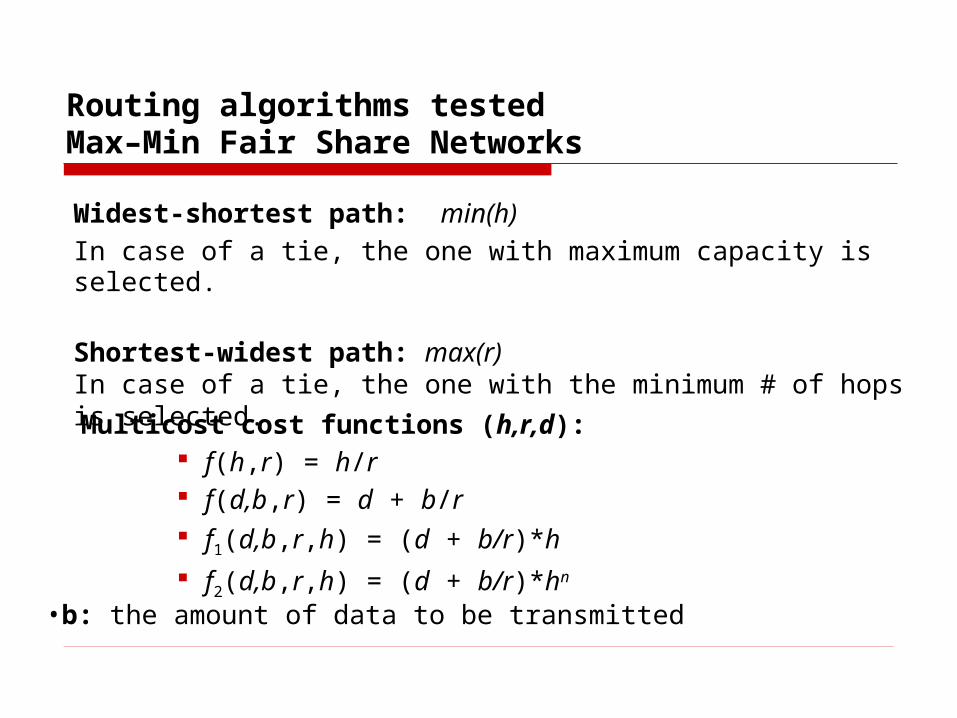
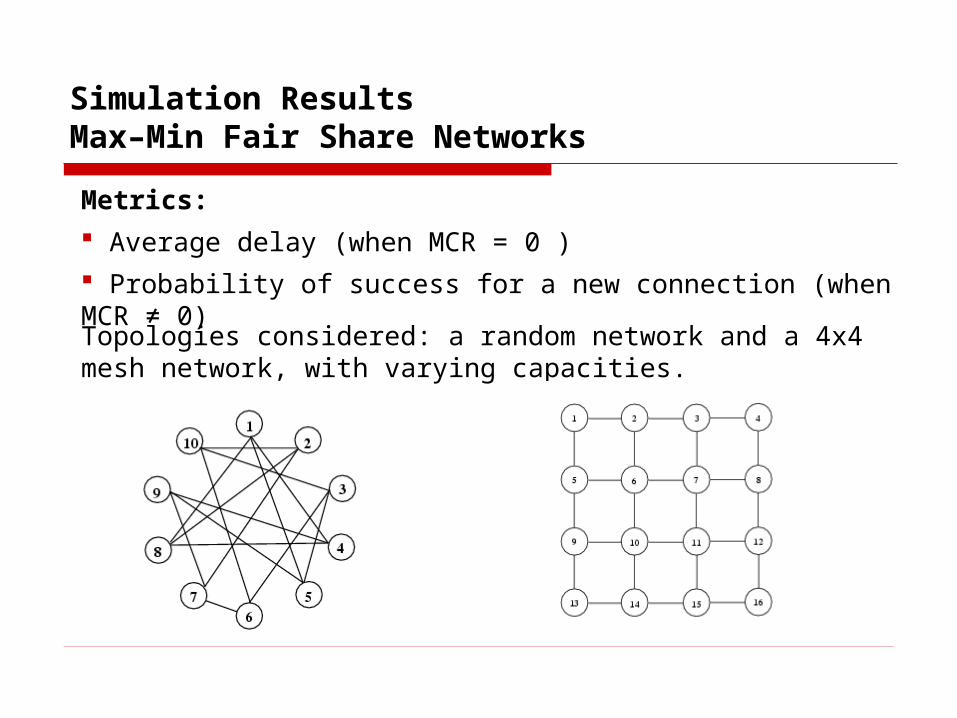
Simulation ResultsMaxndashMin Fair Share Networks
Metrics Average delay (when MCR = 0 ) Probability of success for a new connection (when MCR ne 0)
Topologies considered a random network and a 4x4 mesh network with varying capacities
MaxndashMin Fair Share Networks
MCR = 0 Random topology f(dbrh) = (d + br)h
MaxndashMin Fair Share Networks
MCR ne 0 Mesh topology f(dbrh) = (d + br)h05
Simulation ResultsMaxndashMin Fair Share Networks
Capacity availability definition
MCR = 0 Mesh and Random topology f(dbrh) = (d + br)h05
Simulation ResultsMaxndashMin Fair Share Networks
Link utilization information updates (P = 10 50 100)
MCR = 0 transmission time gtgt propagation time Mesh topology f(dbrh) = (d + br)h05
Conclusionsfor Wireless Ad-Hoc Networks
Multi-cost algorithms that take energy into account result in
Increased network lifetime More evenly spread energy consumption Higher throughput
The SUMMIN energy-hop algorithm where the cost function is
gives the most balanced results (in terms of node residual
energy energy variance packets dropped depletion times number of hops on paths taken)
The performance benefits diminish when the limitation posed by the network capacity is approached
Pii
Pi
i
R
Th
min
f (h T R) =
Conclusions for OBS networks
The proposed multicost burst routing and scheduling algorithm and its heuristic variations significantly outperform other simulated algorithms
The optimal multicost algorithm is not polynomial but the proposed AW multicost heuristic algorithm has polynomial complexity and performance that is very close to that of the optimal algorithm
The improvements obtained are more significant for small propagation delays
Conclusionsfor max-min fare share networks
Multi-cost algorithms can result in
Lower blocking probability Lower average delay
The algorithm that uses the cost function
f(dbrh) = (d + br)h05 gives the best results
The term r is an estimate of the max min fair rate that would be obtained by the new connection if admitted
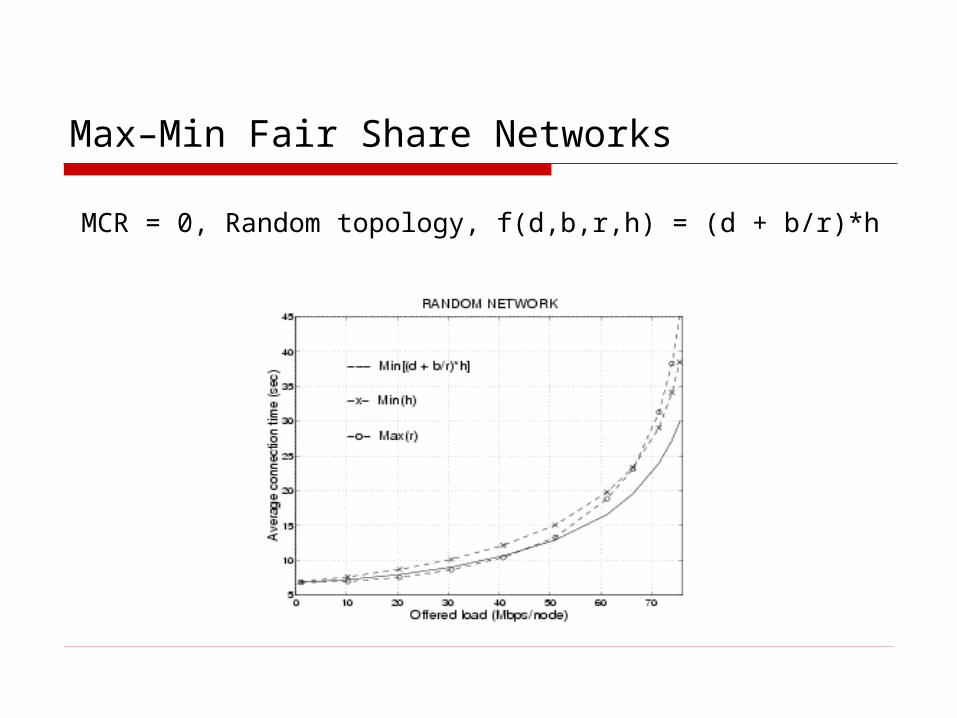
MaxndashMin Fair Share Networks
MCR = 0 Random topology f(dbrh) = (d + br)h
MaxndashMin Fair Share Networks
MCR ne 0 Mesh topology f(dbrh) = (d + br)h05
Simulation ResultsMaxndashMin Fair Share Networks
Capacity availability definition
MCR = 0 Mesh and Random topology f(dbrh) = (d + br)h05
Simulation ResultsMaxndashMin Fair Share Networks
Link utilization information updates (P = 10 50 100)
MCR = 0 transmission time gtgt propagation time Mesh topology f(dbrh) = (d + br)h05
Conclusionsfor Wireless Ad-Hoc Networks
Multi-cost algorithms that take energy into account result in
Increased network lifetime More evenly spread energy consumption Higher throughput
The SUMMIN energy-hop algorithm where the cost function is
gives the most balanced results (in terms of node residual
energy energy variance packets dropped depletion times number of hops on paths taken)
The performance benefits diminish when the limitation posed by the network capacity is approached
Pii
Pi
i
R
Th
min
f (h T R) =
Conclusions for OBS networks
The proposed multicost burst routing and scheduling algorithm and its heuristic variations significantly outperform other simulated algorithms
The optimal multicost algorithm is not polynomial but the proposed AW multicost heuristic algorithm has polynomial complexity and performance that is very close to that of the optimal algorithm
The improvements obtained are more significant for small propagation delays
Conclusionsfor max-min fare share networks
Multi-cost algorithms can result in
Lower blocking probability Lower average delay
The algorithm that uses the cost function
f(dbrh) = (d + br)h05 gives the best results
The term r is an estimate of the max min fair rate that would be obtained by the new connection if admitted
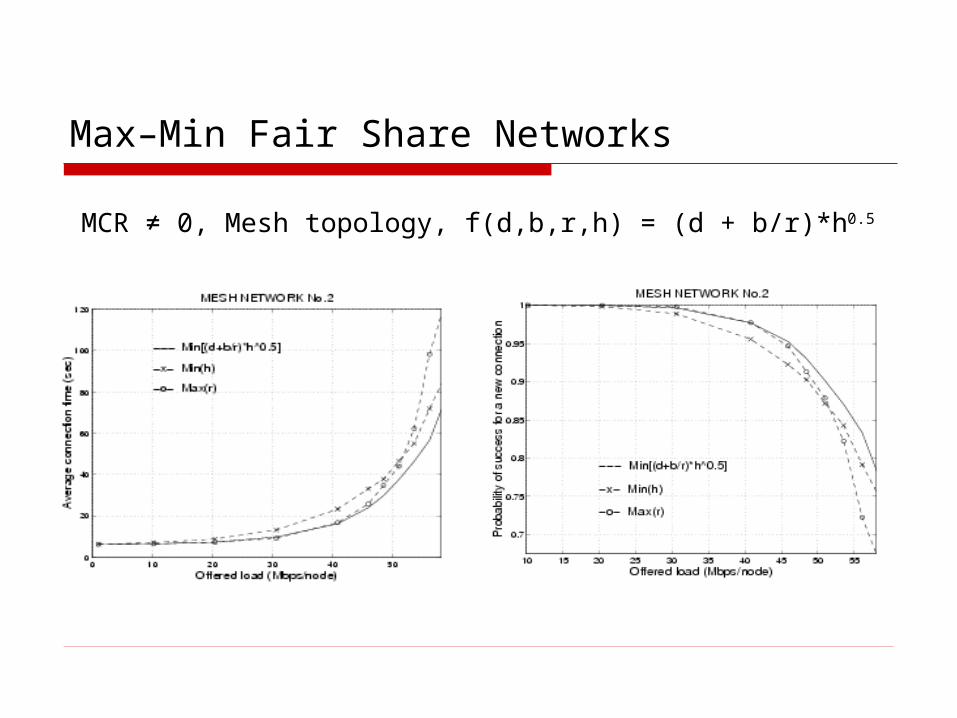
MaxndashMin Fair Share Networks
MCR ne 0 Mesh topology f(dbrh) = (d + br)h05
Simulation ResultsMaxndashMin Fair Share Networks
Capacity availability definition
MCR = 0 Mesh and Random topology f(dbrh) = (d + br)h05
Simulation ResultsMaxndashMin Fair Share Networks
Link utilization information updates (P = 10 50 100)
MCR = 0 transmission time gtgt propagation time Mesh topology f(dbrh) = (d + br)h05
Conclusionsfor Wireless Ad-Hoc Networks
Multi-cost algorithms that take energy into account result in
Increased network lifetime More evenly spread energy consumption Higher throughput
The SUMMIN energy-hop algorithm where the cost function is
gives the most balanced results (in terms of node residual
energy energy variance packets dropped depletion times number of hops on paths taken)
The performance benefits diminish when the limitation posed by the network capacity is approached
Pii
Pi
i
R
Th
min
f (h T R) =
Conclusions for OBS networks
The proposed multicost burst routing and scheduling algorithm and its heuristic variations significantly outperform other simulated algorithms
The optimal multicost algorithm is not polynomial but the proposed AW multicost heuristic algorithm has polynomial complexity and performance that is very close to that of the optimal algorithm
The improvements obtained are more significant for small propagation delays
Conclusionsfor max-min fare share networks
Multi-cost algorithms can result in
Lower blocking probability Lower average delay
The algorithm that uses the cost function
f(dbrh) = (d + br)h05 gives the best results
The term r is an estimate of the max min fair rate that would be obtained by the new connection if admitted
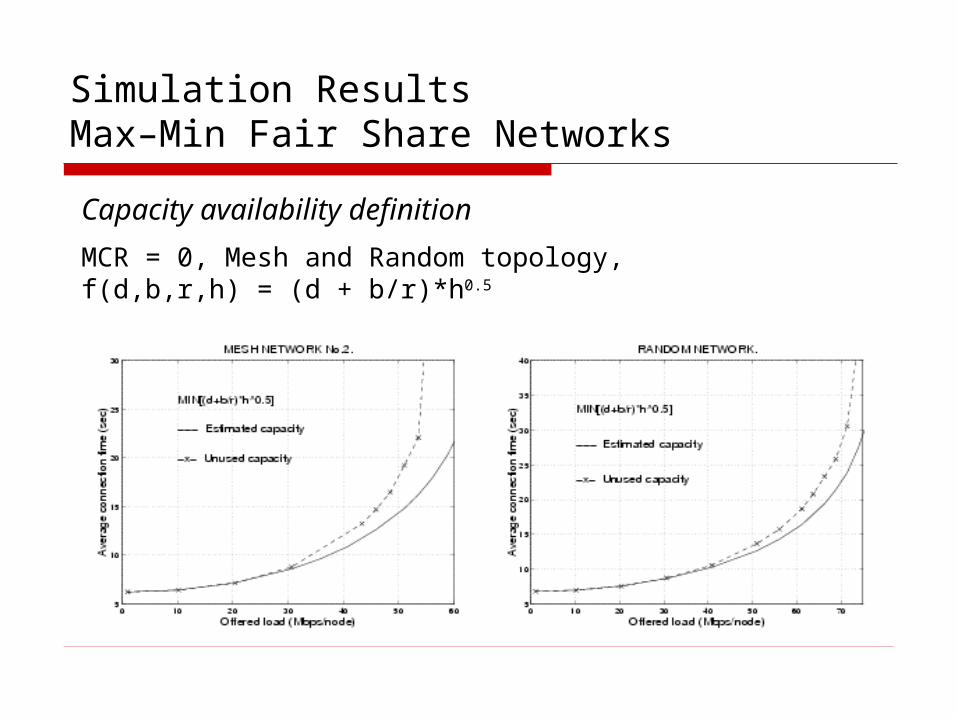
Simulation ResultsMaxndashMin Fair Share Networks
Capacity availability definition
MCR = 0 Mesh and Random topology f(dbrh) = (d + br)h05
Simulation ResultsMaxndashMin Fair Share Networks
Link utilization information updates (P = 10 50 100)
MCR = 0 transmission time gtgt propagation time Mesh topology f(dbrh) = (d + br)h05
Conclusionsfor Wireless Ad-Hoc Networks
Multi-cost algorithms that take energy into account result in
Increased network lifetime More evenly spread energy consumption Higher throughput
The SUMMIN energy-hop algorithm where the cost function is
gives the most balanced results (in terms of node residual
energy energy variance packets dropped depletion times number of hops on paths taken)
The performance benefits diminish when the limitation posed by the network capacity is approached
Pii
Pi
i
R
Th
min
f (h T R) =
Conclusions for OBS networks
The proposed multicost burst routing and scheduling algorithm and its heuristic variations significantly outperform other simulated algorithms
The optimal multicost algorithm is not polynomial but the proposed AW multicost heuristic algorithm has polynomial complexity and performance that is very close to that of the optimal algorithm
The improvements obtained are more significant for small propagation delays
Conclusionsfor max-min fare share networks
Multi-cost algorithms can result in
Lower blocking probability Lower average delay
The algorithm that uses the cost function
f(dbrh) = (d + br)h05 gives the best results
The term r is an estimate of the max min fair rate that would be obtained by the new connection if admitted
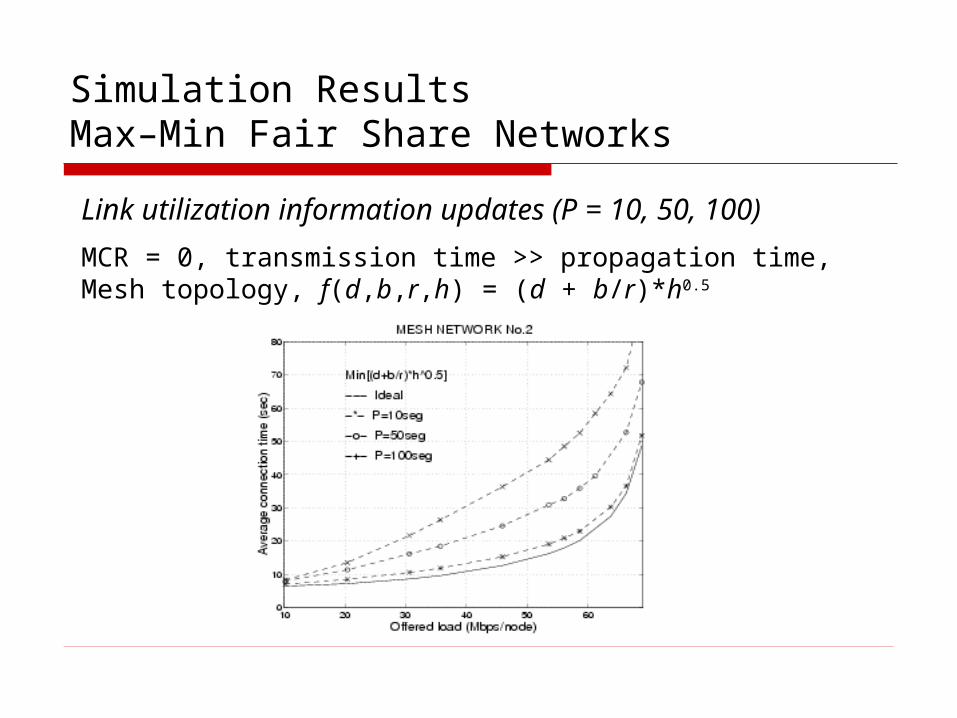
Simulation ResultsMaxndashMin Fair Share Networks
Link utilization information updates (P = 10 50 100)
MCR = 0 transmission time gtgt propagation time Mesh topology f(dbrh) = (d + br)h05
Conclusionsfor Wireless Ad-Hoc Networks
Multi-cost algorithms that take energy into account result in
Increased network lifetime More evenly spread energy consumption Higher throughput
The SUMMIN energy-hop algorithm where the cost function is
gives the most balanced results (in terms of node residual
energy energy variance packets dropped depletion times number of hops on paths taken)
The performance benefits diminish when the limitation posed by the network capacity is approached
Pii
Pi
i
R
Th
min
f (h T R) =
Conclusions for OBS networks
The proposed multicost burst routing and scheduling algorithm and its heuristic variations significantly outperform other simulated algorithms
The optimal multicost algorithm is not polynomial but the proposed AW multicost heuristic algorithm has polynomial complexity and performance that is very close to that of the optimal algorithm
The improvements obtained are more significant for small propagation delays
Conclusionsfor max-min fare share networks
Multi-cost algorithms can result in
Lower blocking probability Lower average delay
The algorithm that uses the cost function
f(dbrh) = (d + br)h05 gives the best results
The term r is an estimate of the max min fair rate that would be obtained by the new connection if admitted
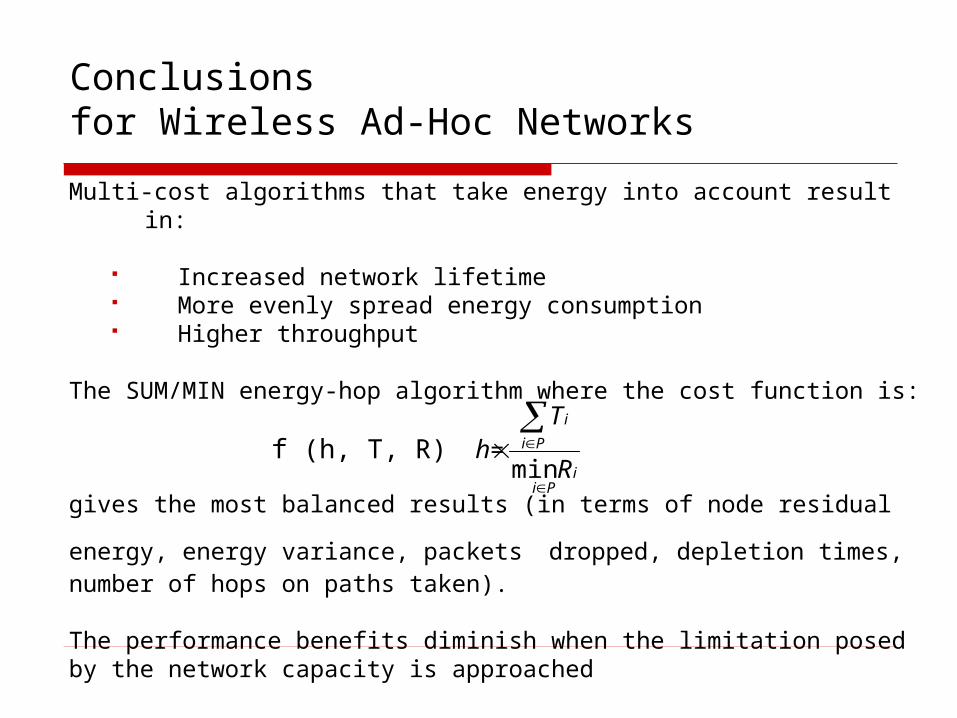