Embed Size (px)
Citation preview

Seediscussions,stats,andauthorprofilesforthispublicationat:https://www.researchgate.net/publication/281477438
Multi-criteriaandlandfillsiteselectionusingGIS:acasestudyfromPalestine
Article·January2010
CITATIONS
13
READS
33
2authors:
IbrahimMahamid
UniversityofHail
24PUBLICATIONS103CITATIONS
SEEPROFILE
SalemThawaba
BirzeitUniversity
27PUBLICATIONS46CITATIONS
SEEPROFILE
Availablefrom:IbrahimMahamid
Retrievedon:29September2016
The Open Environmental Engineering Journal, 2010, 3, 33-41 33
1874-8295/10 2010 Bentham Open
Open Access
Multi Criteria and Landfill Site Selection Using Gis: A Case Study From Palestine
I. Mahamid and S. Thawaba,*
Department of Civil Engineering, Birzeit University, Ramallah, Palestine
Department of Architectural Engineering, Birzeit University, Ramallah, Palestine
Abstract: Shortage of land for waste disposal and inappropriate landfill site is one of the biggest problems in most of
large urban areas. Therefore more efforts are needed to overcome this problem. Most of the landfill sites in Palestine are
selected randomly, and waste is burned and not treated, which impacts nature and human. The main aim of this research is
to determine a suitable landfill site with less impact on environment. In this research, a potential site for an appropriate
landfill area for Ramallah Governorate was determined by using geographic information system (GIS) as a tool to aid the
decision making process. To achieve this purpose, thematic layers and different tabular data such as topography, land use,
roads network, ground and surface water, infrastructure, and urban areas were collected from different institutions and
governmental agencies in Palestine. Thematic maps were used to create the vulnerability map for the area and the result
was compiled to the buffer zones around sensitive areas. By using multi-criteria analysis, a candidate site was allocated
taking into consideration the sensitive areas in order to find out the best location for the anticipated regional landfill site.
Keywords: Landfill, GIS, solid waste, Palestine, vulnerability, municipal waste, sustainable urban development.
1. BACKGROUND
Shortage of land for waste disposal and inappropriate landfill site is one of the biggest problems in most of large urban areas in the world which has its negative impact on human, and environment [1]. Therefore more efforts are needed to overcome this problem that leads different agen-cies and establishments to find common limitations to pro-tect human and environment from these concequences [2].
The U.S. Environmental Protection Agency [3] issued many regulations and limitations to control unfriendly envi-ronment projects, one of these is landfill site criteria, and also many agencies in different countries of the developed world were established to control this process. Developing countries just started to establish such agencies and institu-tions in this field [4].
The issue of landfill site selection was complicated and time consuming. During the last few decades and particu-larly when environmental planning emerged this issue be-came systematic and technical. The evolution of GIS made this field much easier and manageable. GIS gave the ability and functionality to find best location for certain purposes with many limitations.
GIS has very distinguishing, powerful functions and can play an important role in decision making and planning process. “The most distinguishing parts of a GIS are its func-tions for spatial analysis, i.e. operators that use spatial data to derive new geoinformation. Spatial queries and process models play an important role in satisfying user needs. The
*Address correspondence to this author at the Department of Architectural Engineering, Birzeit University, Ramallah, Palestine; Tel: 00970-599645050; Fax: 00970-2-2982984; E-mail: [email protected]
integration of database, GIS software, rules, and reasoning mechanism (implemented as a so-called inference engine) leads to what is sometimes called a spatial decision support system (SDSS)” [5].
2. STUDY SITE
Ramallah district is located in the middle part of the West Bank with a total area of 855 km [6]. It occupies approxi-mately 14.5% of the West Bank area. Currently only 4.35% of the District is inhabited by Palestinian built up area, while approximately 20.3% is occupied by either Israeli settle-ments, nature reserves or closed military areas [7].
The number of inhabitants in the District is about
284,960, in 15 municipalities and 53 village councils, 2 pro-
ject committees and 5 refuge camps [8]. In Ramallah district
a landfill site was established in the late 1960s, with an origi-
nal area of about 4500 m2. Although it was a random dump-
site, it was located far from urban areas. Burning the garbage
was common so that the total accumulation of solid waste
was limited. Since the early 1990s, however, the mu-
nicipality stopped burning wastes as the built-up areas ex-
panded toward the dumpsite and smoke and toxins spread
over residential and industrial areas [9]. As a result of that
many restrictions were imposed on the process of collecting
solid waste to minimize the amount gathered. In addition to
that the landfill site of al-Bireh (a twin city of Ramallah) was
closed. This situation has resulted in the spread of garbage in
the streets in addition to many randomly distributed dump-
sites in residential areas, threatening the environmental health of the Palestinian population.
The problem became more complicated when the nearby
town of Beituniya closed its landfill, as this site was also
located within the populated area which became harmful for

34 The Open Environmental Engineering Journal, 2010, Volume 3 Mahamid and Thawaba
public health, and began to use the Ramallah landfill in 1996 [9].
Al-Bireh city, adjacent to Ramallah city, had its own dumping site outside its boundaries since 1981. The landfill is considered to be in area C (controlled by the Israeli mili-tary) that closed the landfill after the Second Intifada in 2002. After closing both landfills in Ramallah and Albireh, more than 100,000 people became without any available proper landfill [10].
hrough the second Intifada (2000) the solid waste man-agement in the West Bank became worse because solid waste can not be transported to reach dump sites outside mu-nicipal boundaries. As a result of that many vacant areas within city limits were used as dump sites without taking any
measures into consideration [11]. Different types of solid waste are produced in Ramallah district like commercial, medical, agricultural, industrial, and domestic. The main one is the domestic solid waste; it forms more than 60% of the total solid waste while the other contributes with less than 40%. The solid waste generation in Ramallah district is esti-mated by 480 ton per day [12]. This leads to the urgent need to search for a landfill site to serve the governorate and to be allocated according to scientific standards that meets sustain-ability.
3. METHODOLOGY AND ANALYSIS
In this paper, GIS plays a major role in determining the "best location" for a landfill site according to predefined cri-teria based on scientific standards and measurements. The
Fig. (1). Methodology (layers prepared).
P. Factor
Field Capacity FC
Rainfall Recharge
R- Factor
Geology Subsoil (S.M) B. Factor
A. Factor
I. Factor P.I- Vulnerability Map
Israeli Settlement – Buffer (1Km)
Palestinian built-up
areas– Buffer
Natural Reserve–
Buffer (1Km)
Springs – Buffer (1.5Km)
Wells – Buffer (2Km)
Roads – Buffer (1Km)
Spatial Analysis
Forest Areas
Slope < 5%
Clay areas
Political A.B.C
Size > 10,000 sq m
Land fill Alternative sites
Landfill Best Location
Spatial Analysis

Multi Criteria and Landfill Site Selection Using Gis The Open Environmental Engineering Journal, 2010, Volume 3 35
aim is to avoid the need for impact mitigation and ongoing management by selecting a site where natural barriers protect environmental quality and where there will not be adverse impact on existing and future development [3].
To build a GIS model, the following layers were used (Fig. 1): Geological formation, rainfall, district boundary, built-up area, natural reserves, settlements, major roads, local roads, land use, springs, wells, ground water, Infiltration conditions (I)-map, and Protective cover (P)- map, soil type, and topography.
3.1. Groundwater Vulnerability
The origin-pathway-target model was adopted in order to come up with vulnerability map for the study area by PI Method. The PI Method is based on an origin-pathway-target model: The origin of the assumed hazard is the ground sur-face; the groundwater table in the uppermost aquifer is the target; the pathway includes the layers between the ground surface and the groundwater surface [13]. Thus, the PI method can be used for resource vulnerability mapping. However, if the resource vulnerability map is intersected with a map showing the flow route in the aquifer towards a spring or well, it can also be used for source vulnerability mapping.
P is divided into five classes. From P = 1 for a very low
degree of protection to P = 5 for very thick and protective
overlying layers. Where "I " describes the infiltration condi-
tions, particularly the degree to which the protective cover is
bypassed as a result of lateral surface and subsurface flow in
the catchment's of swallow holes and sinking streams. The
"I" factor is 1.0 if the infiltration occurs diffusely, e.g. on a
flat, highly permeable and free draining surface. In contrast,
the protective cover is completely bypassed by a swallow
hole, through which surface water may pass directly into the
karst aquifer the "I" factor is 0.0 in such a case. The catch-
ment's of a sinking stream is assigned a value between 0.0
and 1.0, depending on the proportion of lateral flow compo-
nents. The I map shows the spatial distribution of the I fac-tor.
The final protection factor is the product of P and I. It
is subdivided into five classes. A protective factor of 1
indicates a very low degree of protection and an extreme
vulnerability to contamination; = 5 indicates a high degree
of protection and a very low vulnerability.
The vulnerability map is obtained by intersecting the P map with the I map, where the P map shows the effective-ness of the productive cover as a function of the thickness and permeability of all the strata above the Groundwater surface, and the I map shows the degree to which the protec-tive cover is bypassed.
3.2. GIS Procedure for Landfill Site Allocation
To get the proper site for landfill in Ramallah district from the base map, the following procedure was followed:
Step 1: Create vulnerability map:
PTS = [T +{SM + BM}*R + A] (1)
Pts = total protective function
T = Field Capacity for top soil
S = Grain size distribution for subsoil
M = Thickness of each stratum in
B = Bedrock
R = Recharge
A = Artesian pressure
And so the following maps were created
• Apply the above equation to create the Pts map
• Apply the relation between Pts and P to create P map
• Multiply P map with I map to create the vulnerability map.
Other needed layers:
1. Field capacity for top soil 2.Rainfall recharge for Ramallah district 3.R-factor for geological formations 4. Subsoil (S) thickness (M) values for subsoil 5.Bedrock for geological formation 6. Sum of B*M
3.3. Artesian Pressure
1. Field Capacity Map
Field Capacity (FC) is the ability of the top soil to store water, increasing field capacity means high capacity to store water. The table below (Table 1) shows field capacity for soils found in the Ramallah District based on type of soil and effective field capacity (e FC), then map that shows the dif-ferent values of field capacity according to soil type was created.
Table 1. Field Capacity for Soil Found in the Ramallah District (HWE, 2007)
Types of Soil eFC (mm) Up to 1m Depth Field Capacity (T)
Grumusols 460 750
Terra Rossa, Brown Rendzinas &Pale rendizinas 446 750
Brown Rendzinas &Pale rendizinas 334 750
Brown Lithosols &Loessial arid brown soils 140-200 250
Loessial serozems 140-200 250
Brown lithosols &Loessial serozems 90-140 125
36 The Open Environmental Engineering Journal, 2010, Volume 3 Mahamid and Thawaba
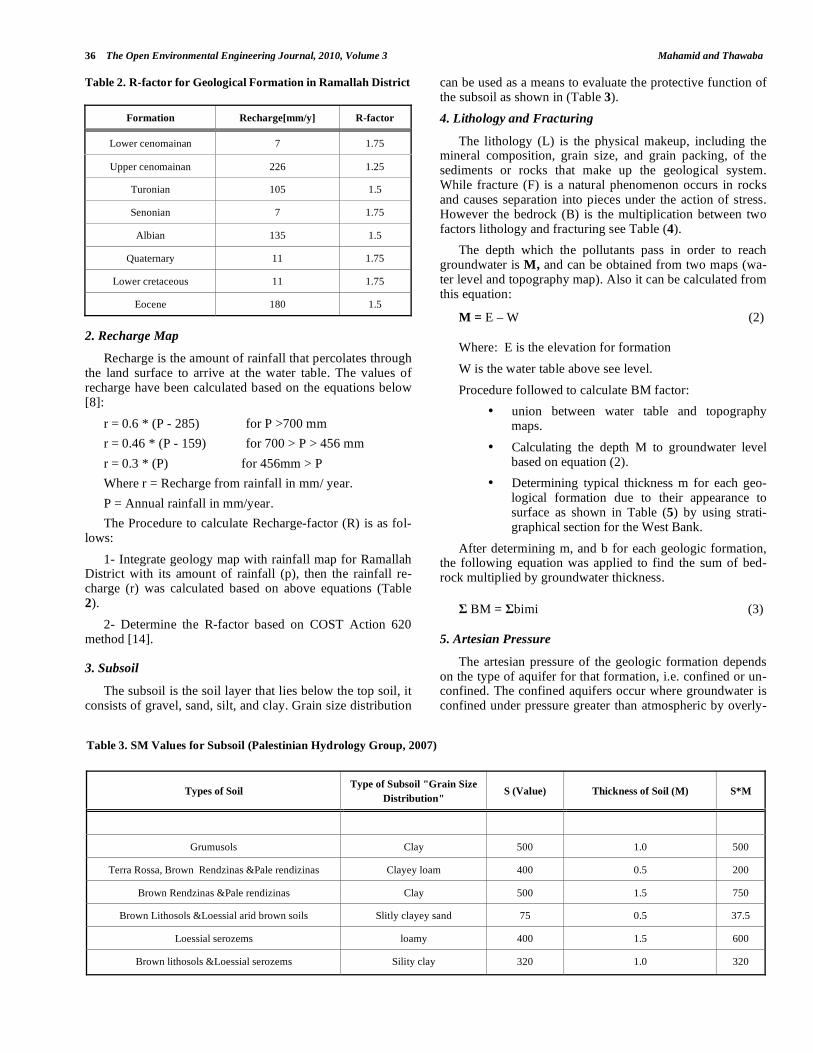
2. Recharge Map
Recharge is the amount of rainfall that percolates through the land surface to arrive at the water table. The values of recharge have been calculated based on the equations below [8]:
r = 0.6 * (P - 285) for P >700 mm
r = 0.46 * (P - 159) for 700 > P > 456 mm
r = 0.3 * (P) for 456mm > P
Where r = Recharge from rainfall in mm/ year.
P = Annual rainfall in mm/year.
The Procedure to calculate Recharge-factor (R) is as fol-lows:
1- Integrate geology map with rainfall map for Ramallah District with its amount of rainfall (p), then the rainfall re-charge (r) was calculated based on above equations (Table 2).
2- Determine the R-factor based on COST Action 620 method [14].
3. Subsoil
The subsoil is the soil layer that lies below the top soil, it consists of gravel, sand, silt, and clay. Grain size distribution
can be used as a means to evaluate the protective function of the subsoil as shown in (Table 3).
4. Lithology and Fracturing
The lithology (L) is the physical makeup, including the mineral composition, grain size, and grain packing, of the sediments or rocks that make up the geological system. While fracture (F) is a natural phenomenon occurs in rocks and causes separation into pieces under the action of stress. However the bedrock (B) is the multiplication between two factors lithology and fracturing see Table (4).
The depth which the pollutants pass in order to reach groundwater is M, and can be obtained from two maps (wa-ter level and topography map). Also it can be calculated from this equation:
M = E – W (2)
Where: E is the elevation for formation
W is the water table above see level.
Procedure followed to calculate BM factor:
• union between water table and topography maps.
• Calculating the depth M to groundwater level based on equation (2).
• Determining typical thickness m for each geo-logical formation due to their appearance to surface as shown in Table (5) by using strati-graphical section for the West Bank.
After determining m, and b for each geologic formation, the following equation was applied to find the sum of bed-rock multiplied by groundwater thickness.
BM = bimi (3)
5. Artesian Pressure
The artesian pressure of the geologic formation depends on the type of aquifer for that formation, i.e. confined or un-confined. The confined aquifers occur where groundwater is confined under pressure greater than atmospheric by overly-
Table 2. R-factor for Geological Formation in Ramallah District
Formation Recharge[mm/y] R-factor
Lower cenomainan 7 1.75
Upper cenomainan 226 1.25
Turonian 105 1.5
Senonian 7 1.75
Albian 135 1.5
Quaternary 11 1.75
Lower cretaceous 11 1.75
Eocene 180 1.5
Table 3. SM Values for Subsoil (Palestinian Hydrology Group, 2007)
Types of Soil Type of Subsoil "Grain Size
Distribution" S (Value) Thickness of Soil (M) S*M
Grumusols Clay 500 1.0 500
Terra Rossa, Brown Rendzinas &Pale rendizinas Clayey loam 400 0.5 200
Brown Rendzinas &Pale rendizinas Clay 500 1.5 750
Brown Lithosols &Loessial arid brown soils Slitly clayey sand 75 0.5 37.5
Loessial serozems loamy 400 1.5 600
Brown lithosols &Loessial serozems Sility clay 320 1.0 320

Multi Criteria and Landfill Site Selection Using Gis The Open Environmental Engineering Journal, 2010, Volume 3 37
ing relatively impermeable strata. While unconfined aquifer is one in which a water table varies in undulating form and in slope, depending on areas of recharge and discharge, pump age from wells and permeability as shown in Table (6).
P-Map
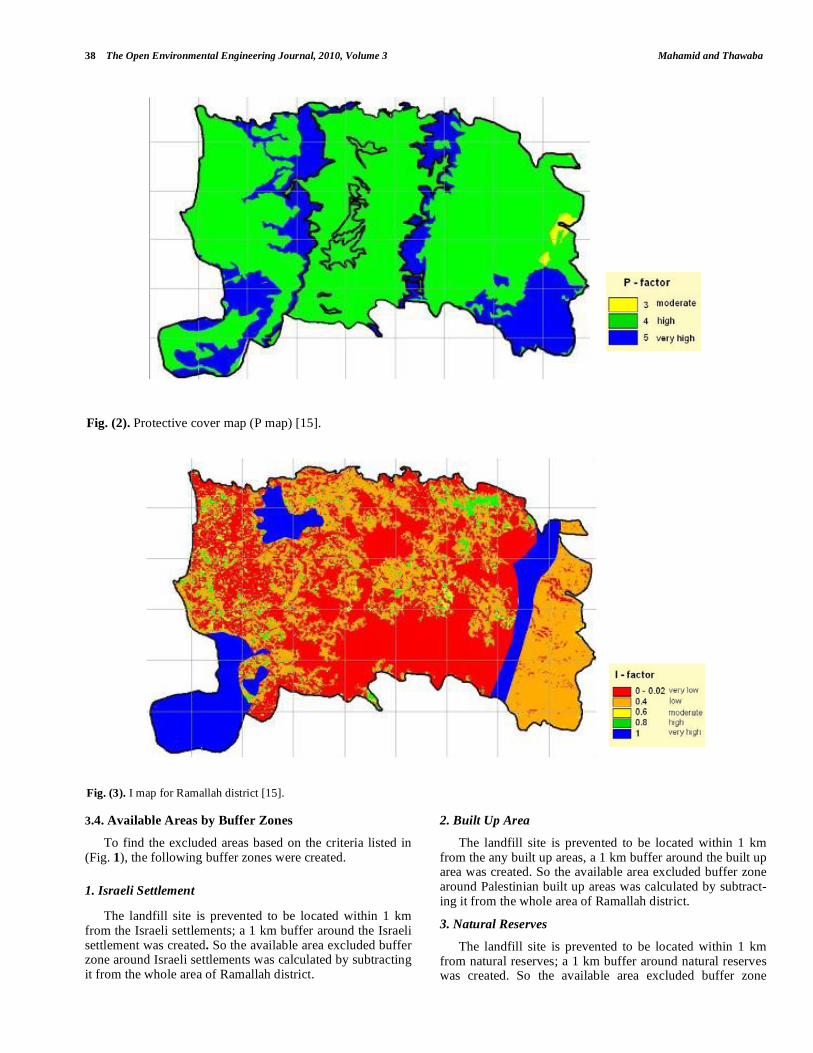
The total protective function (PTS) was calculated ac-cording to equation (1), then the p-factor was constructed according to cost action 620 method (Zwahlen, 2004) as fol-lows: for PTS between (1000-10000) that means it has high protective cover and has P -factor value 4 while the other classification was larger than (10000) which means that it has a very high protective cover and has P -factor value 5 and when PTS has value less than 1000, it gives P a value of 3 (Fig. 2).
I -map
I factor express the degree to which protective cover is bypassed by lateral surface and subsurface flow the spatial distribution of I factor was shown on I map (Fig. 3) (PHG, 2006).
Vulnerability Map
Finally Vulnerability map was obtained by making a un-ion between I map and P map which shows the intrinsic vul-nerability and the natural protection of the upper aquifers. PI factors ranges between 0.0 (high Vulnerability) and 5.0 (low Vulnerability) as shown in (Fig. 4).
Table 4. Lithology and Fracturing for Geological Formation (Water Authority, 2007)
Formation lithology L F B = L*F
Quaternary Nari (surface crust) and alluvium gravels and fan deposits 5 4.0 20
Miocene Conglomerates, Marl, chalk 5 20 100
Eocene Reefal limestone 5 0.5 1.5
Senonian Marl, chalk , chert 20 25.0 500
Turonian White limestone 5 0.5 1.5
Upper cenomainan Karstic Dolomite 5 0.3 1.5
Upper cenomainan Limestone and dolostone 5 0.3 1.5
Albian Reefal limestone 5 0.3 1.5
Table 5. Bedrock Values and Typical Thickness for Geological Formations
F b1 b2 b3 b4 b5 b6 b7 b8 m1 m2 m3 m4 m5 m6 m7
Q 1 20 1.5 500 1.5 1.5 100 20 1.5 155 380 278 115 330 330 497
E 2 20 1.5 500 1.5 1.5 100 20 1.5 0 380 278 115 330 330 497
S 3 20 1.5 500 1.5 1.5 100 20 1.5 0 0 278 115 330 330 497
T4 20 1.5 500 1.5 1.5 100 20 1.5 0 0 0 115 330 330 497
U.C 5 20 1.5 500 1.5 1.5 100 20 1.5 0 0 0 115 330 330 497
Y (e) 6 20 1.5 500 1.5 1.5 100 20 1.5 0 0 0 0 330 330 497
Y(w) 7 20 1.5 500 1.5 1.5 100 20 1.5 0 0 0 0 0 330 497
A 8 20 1.5 500 1.5 1.5 100 20 1.5 0 0 0 0 0 0 497
Where:
b: bedrock. m: thickness for each formation. Q: Quaternary. E: Eocene. S: Senonian.
T: Turonian. U.C: Upper cenomainan. Y (e): yata lower cenomainan, east. Y (w): yata lower cenomainan,weat. A : Albian.
Table 6. Types of Formation in Ramallah District Based on
Zwahlen (2004)
Formation Type A-value
Lower cenomainan Confined 1500
Upper cenomainan unconfined 0
Turonian unconfined 0
Senonian unconfined 0
Albian Confined 1500
Quaternary unconfined 0
Lower cretaceous Confined 1500
Eocene unconfined 0
38 The Open Environmental Engineering Journal, 2010, Volume 3 Mahamid and Thawaba
3.4. Available Areas by Buffer Zones
To find the excluded areas based on the criteria listed in (Fig. 1), the following buffer zones were created.
1. Israeli Settlement
The landfill site is prevented to be located within 1 km from the Israeli settlements; a 1 km buffer around the Israeli settlement was created. So the available area excluded buffer zone around Israeli settlements was calculated by subtracting it from the whole area of Ramallah district.
2. Built Up Area
The landfill site is prevented to be located within 1 km from the any built up areas, a 1 km buffer around the built up area was created. So the available area excluded buffer zone around Palestinian built up areas was calculated by subtract-ing it from the whole area of Ramallah district.
3. Natural Reserves
The landfill site is prevented to be located within 1 km from natural reserves; a 1 km buffer around natural reserves was created. So the available area excluded buffer zone
Fig. (2). Protective cover map (P map) [15].
Fig. (3). I map for Ramallah district [15].

Multi Criteria and Landfill Site Selection Using Gis The Open Environmental Engineering Journal, 2010, Volume 3 39
around natural reserves areas was calculated by subtracting it from the whole area of Ramallah district.
4. Springs
The landfill site is prevented to be located within 1.5 km from the springs; a 1.5 km buffer around springs was cre-ated. So the available area excluded buffer zone around
springs was calculated by subtracting it from the whole area of Ramallah district.
5. Wells
The landfill site is prevented to be located within 2 km from the wells; a 2 km buffer around wells was created. So the available area excluded buffer zone around wells areas
Fig. (4). Vulnerability map for Ramallah District [15].
Fig. (5). Available areas for landfill site.
40 The Open Environmental Engineering Journal, 2010, Volume 3 Mahamid and Thawaba
was calculated by subtracting it from the whole area of Ramallah district
AVAILABLE AREAS BY AREA CHARACTERISTICS
In this step a query was done to find the areas that meet the following conditions based on criteria adopted by Pales-tinian Agency for Environmental Affairs (2006) for best lo-cation of landfill as shown in (Fig. 5):
Area should meet the following criteria:
• Land use = forest
• Soil type = clay
• Slope < 5%
LANDFILL ALTERNATIVES
To find the best location for a landfill site in Ramallah district, two criteria were formulated, the first is the area needed to construct a landfill site as estimated by Ramallah municipality, the needed area for landfill site should be at least 10 donums (10,000 m ), so a query was done to allocate the available area for landfill with an area of 10 donums or more (Table 7).
The second is the political aspects based on (A,B, and C
regions);
According to Oslo agreement between Palestinian and Is-
raelis, West Bank and Gaza were divided into three areas A,
B, and C areas. ‘A’ areas, controlled by the Palestinian
Authority (PA), are mostly urbanized and not suitable for
landfills. ‘B’ areas are administratively operated by the PA,
but militarily controlled by the Israelis. ‘C’ areas are less
urbanized, far from populated areas, and would be poten-
tially adequate for constructing new landfill site but they are
fully controlled by Israelis and so landfill construction in
theses areas are restricted. So the landfill site should be
placed in area "B".
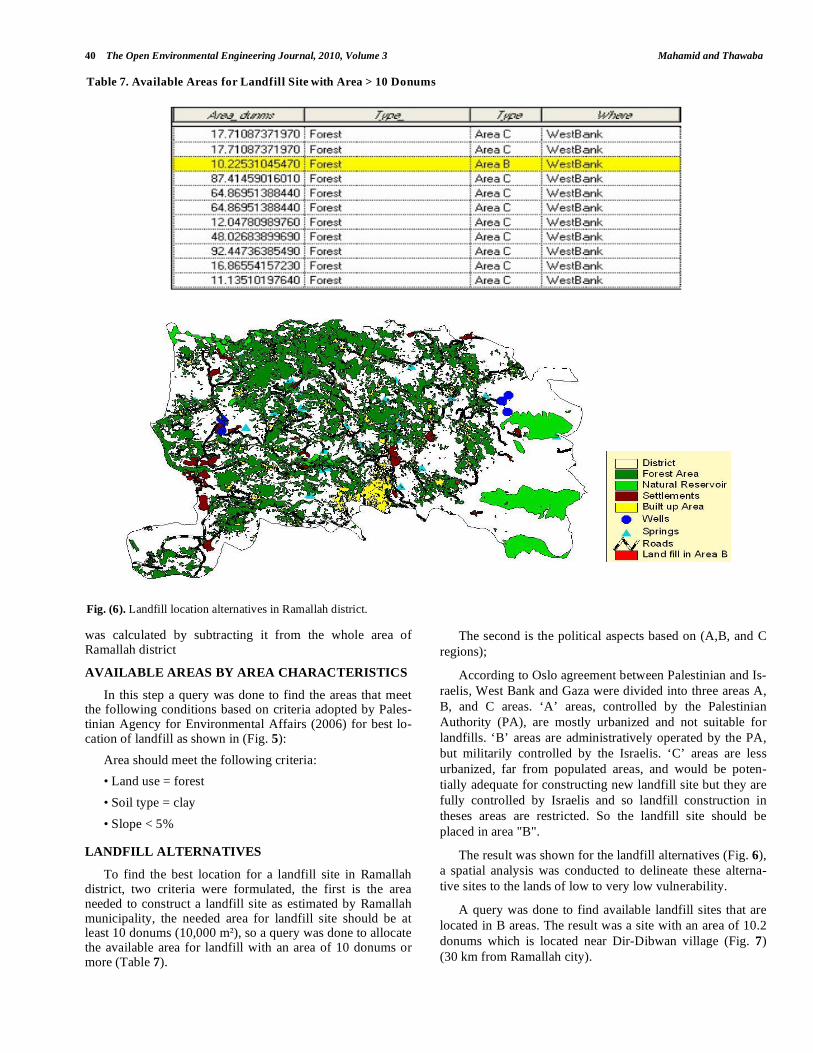
The result was shown for the landfill alternatives (Fig. 6),
a spatial analysis was conducted to delineate these alterna-
tive sites to the lands of low to very low vulnerability.
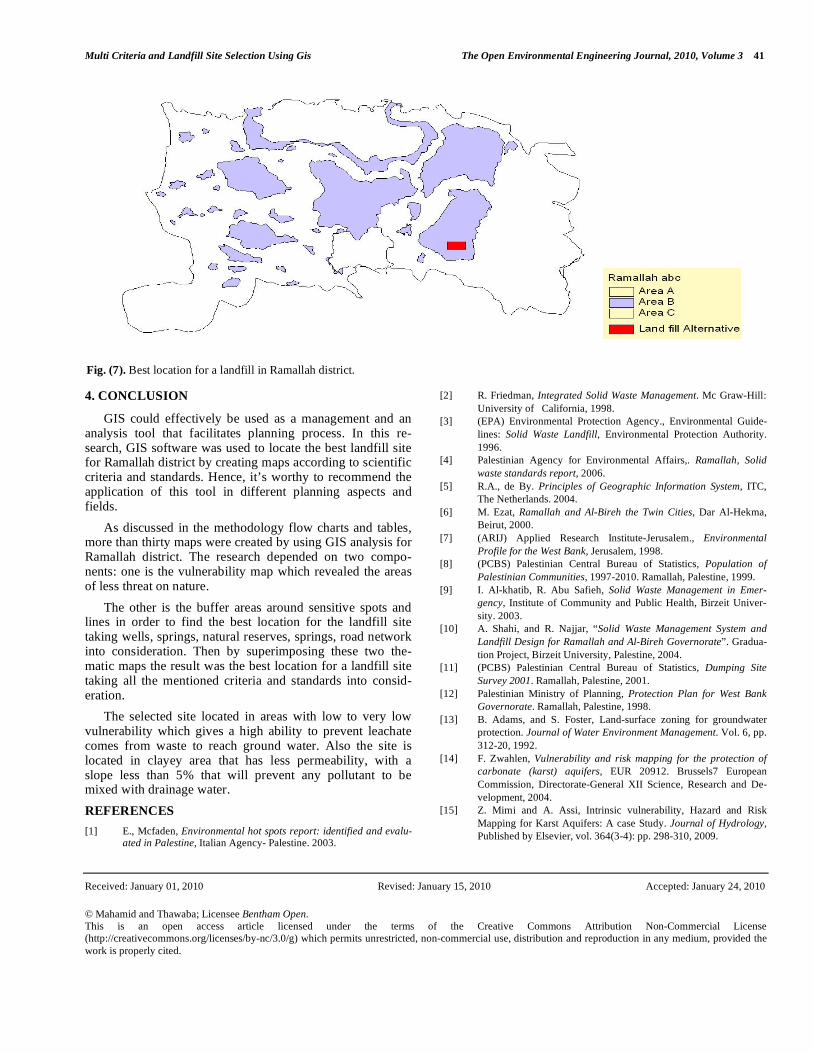
A query was done to find available landfill sites that are
located in B areas. The result was a site with an area of 10.2
donums which is located near Dir-Dibwan village (Fig. 7)
(30 km from Ramallah city).
Table 7. Available Areas for Landfill Site with Area > 10 Donums
Fig. (6). Landfill location alternatives in Ramallah district.
Multi Criteria and Landfill Site Selection Using Gis The Open Environmental Engineering Journal, 2010, Volume 3 41
4. CONCLUSION
GIS could effectively be used as a management and an analysis tool that facilitates planning process. In this re-search, GIS software was used to locate the best landfill site for Ramallah district by creating maps according to scientific criteria and standards. Hence, it’s worthy to recommend the application of this tool in different planning aspects and fields.
As discussed in the methodology flow charts and tables, more than thirty maps were created by using GIS analysis for Ramallah district. The research depended on two compo-nents: one is the vulnerability map which revealed the areas of less threat on nature.
The other is the buffer areas around sensitive spots and lines in order to find the best location for the landfill site taking wells, springs, natural reserves, springs, road network into consideration. Then by superimposing these two the-matic maps the result was the best location for a landfill site taking all the mentioned criteria and standards into consid-eration.
The selected site located in areas with low to very low vulnerability which gives a high ability to prevent leachate comes from waste to reach ground water. Also the site is located in clayey area that has less permeability, with a slope less than 5% that will prevent any pollutant to be mixed with drainage water.
REFERENCES
[1] E., Mcfaden, Environmental hot spots report: identified and evalu-ated in Palestine, Italian Agency- Palestine. 2003.
[2] R. Friedman, Integrated Solid Waste Management. Mc Graw-Hill:
University of California, 1998.
[3] (EPA) Environmental Protection Agency., Environmental Guide-
lines: Solid Waste Landfill, Environmental Protection Authority.
1996.
[4] Palestinian Agency for Environmental Affairs,. Ramallah, Solid
waste standards report, 2006.
[5] R.A., de By. Principles of Geographic Information System, ITC,
The Netherlands. 2004.
[6] M. Ezat, Ramallah and Al-Bireh the Twin Cities, Dar Al-Hekma,
Beirut, 2000.
[7] (ARIJ) Applied Research Institute-Jerusalem., Environmental
Profile for the West Bank, Jerusalem, 1998.
[8] (PCBS) Palestinian Central Bureau of Statistics, Population of
Palestinian Communities, 1997-2010. Ramallah, Palestine, 1999.
[9] I. Al-khatib, R. Abu Safieh, Solid Waste Management in Emer-
gency, Institute of Community and Public Health, Birzeit Univer-
sity. 2003.
[10] A. Shahi, and R. Najjar, “Solid Waste Management System and
Landfill Design for Ramallah and Al-Bireh Governorate”. Gradua-
tion Project, Birzeit University, Palestine, 2004.
[11] (PCBS) Palestinian Central Bureau of Statistics, Dumping Site
Survey 2001. Ramallah, Palestine, 2001.
[12] Palestinian Ministry of Planning, Protection Plan for West Bank
Governorate. Ramallah, Palestine, 1998.
[13] B. Adams, and S. Foster, Land-surface zoning for groundwater
protection. Journal of Water Environment Management. Vol. 6, pp.
312-20, 1992.
[14] F. Zwahlen, Vulnerability and risk mapping for the protection of
carbonate (karst) aquifers, EUR 20912. Brussels7 European
Commission, Directorate-General XII Science, Research and De-
velopment, 2004.
[15] Z. Mimi and A. Assi, Intrinsic vulnerability, Hazard and Risk
Mapping for Karst Aquifers: A case Study. Journal of Hydrology,
Published by Elsevier, vol. 364(3-4): pp. 298-310, 2009.
Received: January 01, 2010 Revised: January 15, 2010 Accepted: January 24, 2010
© Mahamid and Thawaba; Licensee Bentham Open.
This is an open access article licensed under the terms of the Creative Commons Attribution Non-Commercial License
(http://creativecommons.org/licenses/by-nc/3.0/g) which permits unrestricted, non-commercial use, distribution and reproduction in any medium, provided the
work is properly cited.
Fig. (7). Best location for a landfill in Ramallah district.