Embed Size (px)
Citation preview
Sanitary and Social Effects of Dear El Balah Landfill
(Gaza Strip-Palestine)
فلسطین) –قطاع غزه (اّالثار الصحیھ و االجتماعیھ لمكب نفایات دیر البلح
By
Mazen Fadel El Bana
Supervised By
Dr. Zeyad Abu Heen
A Thesis Submitted in Partial Fulfillment of the Requirement for the Degree of
Master of Science in Water Resources Management
The Islamic University – Gaza- Palestine
2011
غزة–الجامعة اإلسالمیة عمادة الدراسات العلیا
كلیة الھندسة المیاهادارة مصادر
The Islamic University –Gaza Deanery of Higher Education Faculty of Engineering Water Resources Management

i
Dedicated to:
My Dear Family.
My Dear Friends.
My Dear Colleagues.

ii
Acknowledgements
First of all praise Allah for blessings and guidance in fulfilling this research.
I would like to express my deep appreciation to my supervisor Dr. Zeyad Abu
Heen. Thanks also to Dr. Yasser El Nahhal for his well-considered advice
during the preparation of my study. I am always impressed by their academic
ability and unique personality.
My deepest thanks to Eng. Khalil Abu Jamous, Khamis El Mahlawi, WaelSafy
and Sami Lubad for their support and help during my study.
My thanks to the farmers living in Deir El Balah for their help during my study
especially Questionnaire.
Many thanks go to all my friends and colleagues in Environment and Earth
sciences Department for their support and help during my study.
iii
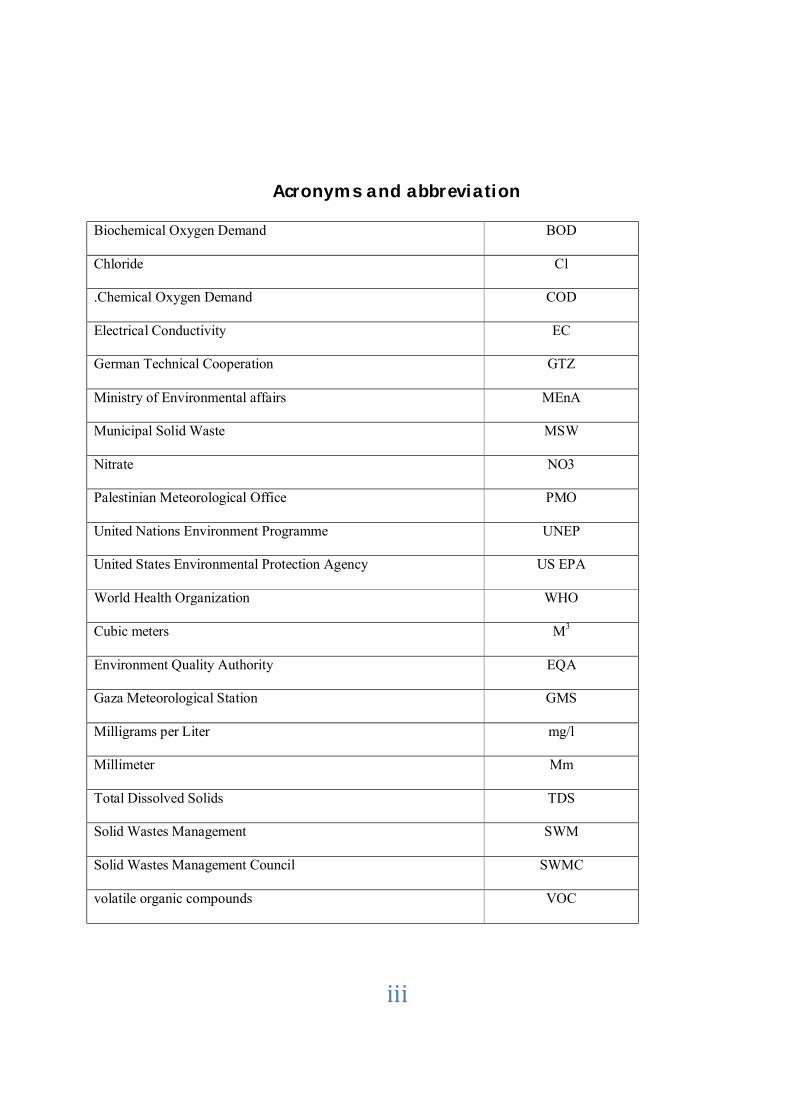
Acronyms and abbreviation
Biochemical Oxygen Demand BOD
Chloride Cl
.Chemical Oxygen Demand COD
Electrical Conductivity EC
German Technical Cooperation GTZ
Ministry of Environmental affairs MEnA
Municipal Solid Waste MSW
Nitrate NO3
Palestinian Meteorological Office PMO
United Nations Environment Programme UNEP
United States Environmental Protection Agency US EPA
World Health Organization WHO
Cubic meters M3
Environment Quality Authority EQA
Gaza Meteorological Station GMS
Milligrams per Liter mg/l
Millimeter Mm
Total Dissolved Solids TDS
Solid Wastes Management SWM
Solid Wastes Management Council SWMC
volatile organic compounds VOC
iv
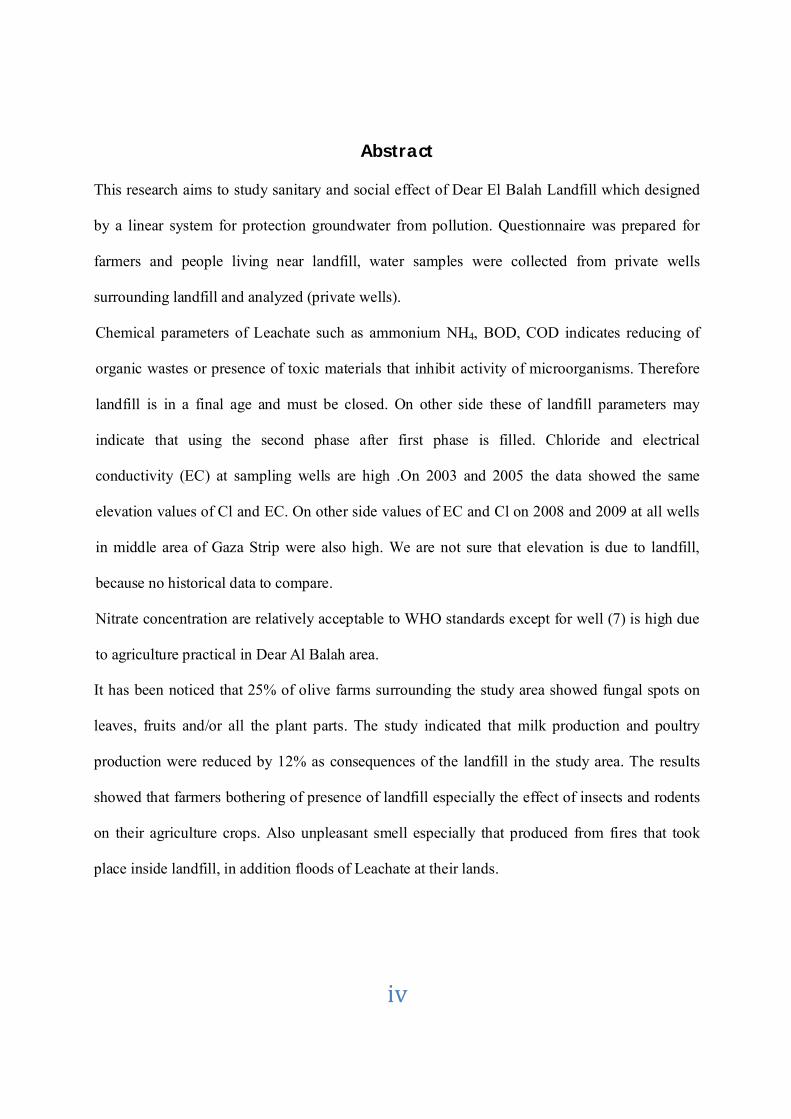
Abstract
This research aims to study sanitary and social effect of Dear El Balah Landfill which designed
by a linear system for protection groundwater from pollution. Questionnaire was prepared for
farmers and people living near landfill, water samples were collected from private wells
surrounding landfill and analyzed (private wells).
Chemical parameters of Leachate such as ammonium NH4, BOD, COD indicates reducing of
organic wastes or presence of toxic materials that inhibit activity of microorganisms. Therefore
landfill is in a final age and must be closed. On other side these of landfill parameters may
indicate that using the second phase after first phase is filled. Chloride and electrical
conductivity (EC) at sampling wells are high .On 2003 and 2005 the data showed the same
elevation values of Cl and EC. On other side values of EC and Cl on 2008 and 2009 at all wells
in middle area of Gaza Strip were also high. We are not sure that elevation is due to landfill,
because no historical data to compare.
Nitrate concentration are relatively acceptable to WHO standards except for well (7) is high due
to agriculture practical in Dear Al Balah area.
It has been noticed that 25% of olive farms surrounding the study area showed fungal spots on
leaves, fruits and/or all the plant parts. The study indicated that milk production and poultry
production were reduced by 12% as consequences of the landfill in the study area. The results
showed that farmers bothering of presence of landfill especially the effect of insects and rodents
on their agriculture crops. Also unpleasant smell especially that produced from fires that took
place inside landfill, in addition floods of Leachate at their lands.
v
الملخص
البحث إلى دراسة التأثیرات الصحیة واإلجتماعیة لمكب نفایات دیر البلح ، وھو الوحید في القطاع یھدف
النظام الخطى لجمع العصارة بحیث تحمي المیاه الجوفیة من التلوث المصمم بطریقة
تصمیم إستبیان للسكان ومقابلة المزارعین بجوار على جمع المعلومات ودلك من خالل اشتملت الدراسھ
أن عمق أظھرت النتائج ) ، ولك تم عمل تحالیل لآلبار المجاورة للمكب (آبار خاصةذمنطقة المكب ، وك
من حدوث التلوث للمیاه الجوفیة . المیاه الجوفیة وخصائص التربة في المنطقة تقلل
اما كانت عالیة (الكلوراید و الموصلیة الكھربائیة و مجموع أألمالح الذائبة) نتائج تحالیل المیاه بینما
لك الى النشاط الزراعي في ذتحالیل النترات كانت مناسبة للمعاییر العالمیة ما عدا بئرآ واحدآ وربما یرجع
وھي بعیدة 2009، 2008غزة لسنة تم جمع تحالیل لجمیع آبار المنطقة الوسطى في قطاع لقد المنطقة.
نسبیآ عن المكب وأظھرت النتائج أنھا أیضآ عالیة .
أیضآ انزعاج المزارعین والسكان من وجود المكب وخاصة تأثیر الحشرات والقوارض أظھرت النتائج
التي على المحاصیل الزراعیة والحیوانات وأیضآ الرائحة الكریھة والسیما الناتجة عن الحرائق المتكررة
أظھرت نتائج االستبیان ،كما إلضافة إلى فیضان العصارة على األراضي الزراعیةبا تحدث داخل المكب ،
من أشجار الزیتون قد أصیبت بالفطریات بینما انخفضت نسبة حلیب األغنام فى منطقة الدراسة % 25أن
% و كذلك انخفضت نسبة انتاج لحوم الدواجن بنفس النسبة12بنسبة
لك سببھ وجود المكب ، حیث التوجد تحالیل سابقة لمقارنتھا.ذمكن الجزم بأن الی

vi
Table of Contents
II III IV VI VII IX 1 1 1 2 2 3 3 4 5 8 9 9 9 9 10 10 11 13 13 13 13 14 14 14 16 16 16 21 23 25 28
Acknowledgements……………………………………………………………………. Acronyms and abbreviation …………………………………………………...…. …. Abstract……………………………………………………………..………………….. Table of Contents…………………………………………………………………….... List of Figures …………………………………………………………………………. List of Tables ……………………………………………………………………..……. CHAPTER (1): INTRODUCTION …………………………………………….……... 1.1 Introduction ………………………………………………………………………… 1.2 Problem Identification……………………………………………………….……… 1.3 Methodology………………………………………………………………………... 1.4 Thesis Outlines…………………………………………………………………...…. CHAPTER (2): LITERATURE REVIEW…………………………………………..…. 2.1 General Introduction ……………………………………………………………….. 2.2 Landfill Sitting…………………………………………………………………….... 2.3 Typical Anatomy of Sanitary Landfill……………………………………………… 2.4 Sanitary landfill compared with other methods ………………………………….… 2.5 Landfill Leachate ……………………………………………………………….….. 2.5.1 Factors Affecting the Composition of Landfill Leachate ……………………... 2.5.2 Collection of Leachate ………………………………………………………… 2.5.3 Extraction of Leachate ………………………………………………………… 2.5.4 Treatment of Leachate ………………………………………………………… 2.6 Factors Determine Contamination by Leachate ……………………………...…… 2.7 Landfill Gas ………………………………………………………………………. 2.8 Impacts of Gas Generated in Landfills …………………………………………… 2.8.1 Health Impacts ……………………………………………………………… 2.8.2 Global Warming …………………………………………………………….. 2.8.3 Fires and Explosion …………………………………………………………. 2.8.4 Unpleasant Odors …………………………………………………………. 2.8.5 Vegetation Damage ………………………………………………………. 2.8.6 Air Pollution………………………………………………………………. CHAPTER (3): Study Area Description ……………………………………………. 3.1 Location of Study Area …………………………………………………………… 3.2 Climate of the Study Area ………………………………………………………… 3.3 Geology of the Study Area ……………………………………………………….. 3.4 Hydrogeology ……………………………………………………………………..
vii
28 28
30 30 33 34 35 36 36 36 36 37 37 38 38 39 39 40 40 41 41 43 43 47 51 54 57 61 65 96
3.5 Soil Types ………………………………………………………………………… 3.6 Solid Wastes Dumpsite in Gaza Governorates……………………………………. 3.6.1 Solid Wastes Management in the Northern Governorate …………………. 3.6.2 Solid Wastes Management in the GazaCity ……………………………… 3.6.3 Solid Wastes Management in the Middle Area Governorate ……………… 3.6.3.1 Deir El Balah Official Landfill …………………………………………. 3.6.3.1.1 Construction of the Basal Sealing System ………………………………… 3.6.4 Solid Wastes managements in KhanYounis Governorate…………………….. 3.6.5 Rafah Governorate……………………………………………………………. CHAPTER (4): Methodology………………………………………………………… 4.1 Introduction ………………………………………………………………………. 4.2 Data Collection …………………………………………………………………… 4.2.1 Available Data in the Study Area………………………………. …………. 4.2.2 Field Visitation ……………………………………………………………… 4.3 Questionnaire ……………………………………………………………………… 4.4 Sampling Program ………………………………………………………………… 4.5 Tested Parameters …………………………………………………………………. 4.5.1 Physical Analysis ……………………………………………………………. 4.5.2 Chemical Analysis………………………………………………… … ……. 4.6 Leachate Collection ……………………………………………………………….. 4.7 Data Analysis………………………………………………………………………. CHAPTER (5): Results and Discussions………………………………………………. 5.1 Leachate Water Quantity ………………………………………………………….. 5.2 Leachate Water Quality…………………………………………………………….. 5.2.1Leachate Characterization ………………………………………………………… 5.2.2 Effects on Ground Water Quality ……………………………………………….. 5.3 Social Data ………………………………………………………………………… CHAPTER (6): Conclusions and Recommendations …..…… ……………………….. References………………………………………………………………………………. Annex (1): Questionnaire ………………………………………………………… ….. Annex (2): Questionnaire Results ……………………………………………………… Annex (3): Photos of the study area landfill fires and covering system……………….

viii
List of Figures
Figure (2.1): Schematic Cross Section in Sanitary Landfill………………….….. Figure (2.2): single lined landfill………………………………………………… Figure (2.3): Double linear landfill………………………………………………. Figure (2.4): Gas generated in typical sanitary landfill………………………….. Figure (2.5): exposure pathway to landfill gas. …………………………………. Figure (3.1): The study area location…………………………………………….. Figure (3.2): Average rainfall depth (1974-2005)……………………………….. Figure (3.3): Typical hydrogeological cross section of Gaza Strip……………… Figure (3.4): Main soil types with associated land forms and dominant land us… Figure (3.5): Location of solid waste dumping sites in Gaza Governorates………. Figure (3.6): The Existing system of SWMCM……………………………………. Figure (3.7): Engineering design of Deir Al Balah landfill……………………….. Figure (5.1): BOD, COD and NH3 dynamics during 4 years of study…………….. Figure (5.2) Change of (BOD/COD) Ratio with time……………………………
6 7 7 12 13 18 19 23 27 29 32 33 45 46

ix
List of Tables
Table (2. 1 ): Criteria for sanitary landfills…………………………………………….
Table (2.2) Typical landfill Gas composition………………………………………….
Table (3.1): Average rainfall (mm) and quantities of rains (Mm3) for Gaza Strip. …..
Table (3.2) : Amounts of solid wastes received landfill (ton/month) on 2006-2008.
Table (5.1): Recirculation performance of leachate……………………………………
Table (5.2): Physical and chemical properties of the leached water obtained from
the landfill site Deir EL-Balah in 1998-2005 …………………………………….……
Table (5.3): Heavy metal concentration of leached water obtained from the …………
landfill site deir EL-Balah in During from 2001 and 2005. ……………………………
Table (5.4): Groundwater characteristics for sampling well at Dear Al Balah in
2008……………………………………………………………………………………
Table (5.5): Physicochemical properties of water sample of monitoring well in 2003-
2005……………………………………………………………………………………...
Table (5.6): Some physical and chemical properties of drinking water samples in Deir
El Balah area. …………………………………………………………………………..
Table (5.7): Type of farms and effects of landfill in the quality and quantity of
products………………………………………………………………………………….
8
12
20
31
42
44
47
48
49
50
51

1
CHAPTER (1)
INTRODUCTION
1.1 Introduction:
Groundwater resources are critical to the Palestinian population and are susceptible to
contamination if human activities are not carefully managed. Inadequate management of waste
disposal sites is a prime potential cause of contaminated groundwater. Other negative impacts
that may be associated with waste disposal sites have serious consequences for public health and
for economicdevelopment. Therefore, it is highly important that all waste disposal sites are
properly rehabilitated in order to protect environment, public health and economic development
aspirations.
1.2 Problem identification:
Landfills are one option for municipal organic wastes disposable system. The
uses of landfills have generated leachate. This leachate may contain harmful
pathogens and chemical compounds which may be toxic to the human beings
and the eco-system. Furthermore, the biodegradation of wastes may produce
ammonia, hydrogen sulfide and particulate matter which are considered as
indicators pollutants according to the US-EPA. These materials may have
harmful effects to the local community. An example of this landfill is Deir El
Balah.
1.3 Objectives
1- Evaluate social and health impacts of the land fill on the people live

2
2- Evaluating the current social and sanitary effects of Deir Al-Balah
Landfill.
3- Identify the effect of land fill on quality of groundwater, air, soil, and agriculture.
1.4 Methodology:
To achieve the objectives of the study, the following methodology has been applied:
1 - Literature collection of the study area.
2 - sampling collection including landfill samples, water samples and soil samples.
3 - analyzing the collected samples.
4 – Questionnaire for the target group of people living near the study area.
5 – Data presentation using statistics, graphs, maps, etc….
1.5 Thesis outlines:
The thesis consists of six chapters as follows:
Chapter (1): Introduction.
Chapter (2): Literature review.
Chapter (3): Description of the study area.
Chapter (4): Methodology.
Chapter (5): Results and discussion.
Chapter (6): Recommendation.
3
CHAPTER (2)
LITERATURE REVIEW
2.1 General Introduction:
The environmental problems and the general state of the environment in Gaza Strip have
received much attention for the international donors and local researchers.
Part Two of the Environmental Profile (1995) describes the interactions between man and
environment. It presents the problems resulting from man's intervention in the environment and
from his exploitation of natural resources. One of these problems related with integrated solid
wastes managements such as collection, disposal.
One of the most common waste disposal methods is landfilling. Landfill refers to an engineered
facility for disposal municipal solid waste and is used to minimize public health problems and
adverse environmental impact.
Few sites are naturally ideal for landfill. Those sites have suitable soil permeability for waste
dumping. The infiltration of rainfall and surface water into a landfill coupled leachat.
Landfill site is the final disposal option for solid waste in Gaza Strip. The other alternatives such
as incineration, composting and others were not tried or very limited due to lack of finance in
Gaza Strip .There are three landfills in Gaza strip: in Rafah, Dear el Balah and Gaza city. They

4
are well located, but all are close to 1967 occupied Palestinian lands that cause problems for
landfill operation.
Emergency Action Plan for Solid Wastes at Gaza Strip prepared by Sha'at and Jouda in (1995)
assessed needs for future development of the sector as donor funded projects.
Desk Study on the Environments in the OccupiedPalestinianTerritories prepared by United
Nations Environment Program (2003) identifies critical environmental issues that despite the
current political difficulties in order to preserve natural resources and establish safe environment
for future generation. This study discussed solid wastes and dumpsites on West Bank and Gaza
Strip.
Japan International Cooperation Agency (JICA) and in cooperation with Environment Quality
Authority (EQA) funded a project for assessment of solid waste dumpsites in Gaza Strip (2007)
Studies and researches on solid wastes management on Gaza Strip are still rare, but few
published researches have been done such as: Solid Wastes Management in Gaza Strip:
Problems and Solutions by Abu El (Qomboz 2003). An Investigation into Geotechnical Aspects
of landfill " A case Study of Gaza (Mortaja, 1998), and Evaluating the Impact of Landfill
Leachate on Groundwater Aquifer in Gaza Strip Using Modeling Approach (Al Slaibi, 2009).
Analysis Report on the current status of solid waste management in Palestine (Ministry of
Planning and International Cooperation, 1997).
2.2 Landfill sitting: To achieve a good sitting process, several significant political and environmental obstacles have
to be overcome (Wells and Crooks, 1987), those are:
1. Required capacity: It depends on the generation rate, rate of population growth, density and
waste compacted at land fill and maximum place elevation.
5
2. Residents concerns: Including health, environmental risk, negative impact on aesthetics in
the area, increased traffic, noise and dust.
3. Hydrogeology: Landfills should not be sited in wetlands, and in flood plains, also depth to
water table must be deep.
4. Coast: Capital costs determine the type of facility that can be constructed and operating.
5. Geology : Topography, fault, rocks and seismic activity
6. Soil: Grain size, fracture in the clay layer, thickness, natural moisture content, degree of
saturation, soil stratification and permeability of soil site.
7. Climatic conditions: Include rain fall and wind.
8. Different cover material: Such as vegetation, soil, composite cap system (sand or gravel or a
thick plastic mesh) and compacted clay.
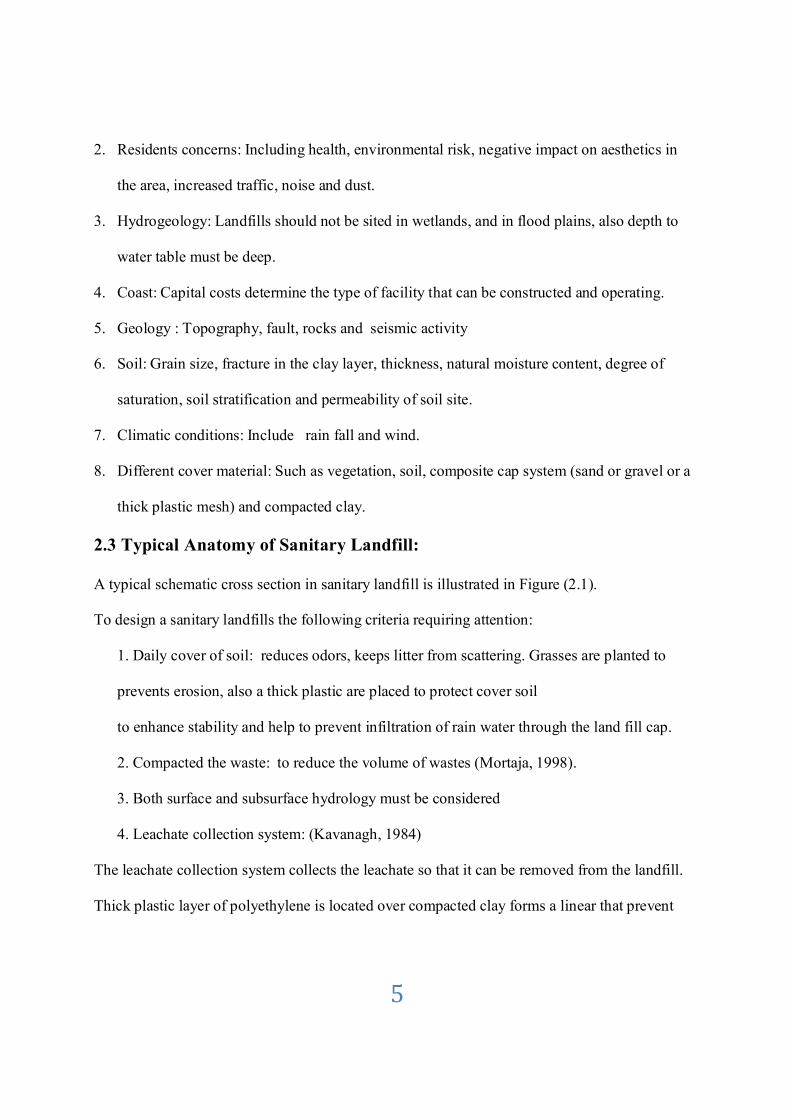
2.3 Typical Anatomy of Sanitary Landfill:
A typical schematic cross section in sanitary landfill is illustrated in Figure (2.1).
To design a sanitary landfills the following criteria requiring attention:
1. Daily cover of soil: reduces odors, keeps litter from scattering. Grasses are planted to
prevents erosion, also a thick plastic are placed to protect cover soil
to enhance stability and help to prevent infiltration of rain water through the land fill cap.
2. Compacted the waste: to reduce the volume of wastes (Mortaja, 1998).
3. Both surface and subsurface hydrology must be considered
4. Leachate collection system: (Kavanagh, 1984)
The leachate collection system collects the leachate so that it can be removed from the landfill.
Thick plastic layer of polyethylene is located over compacted clay forms a linear that prevent
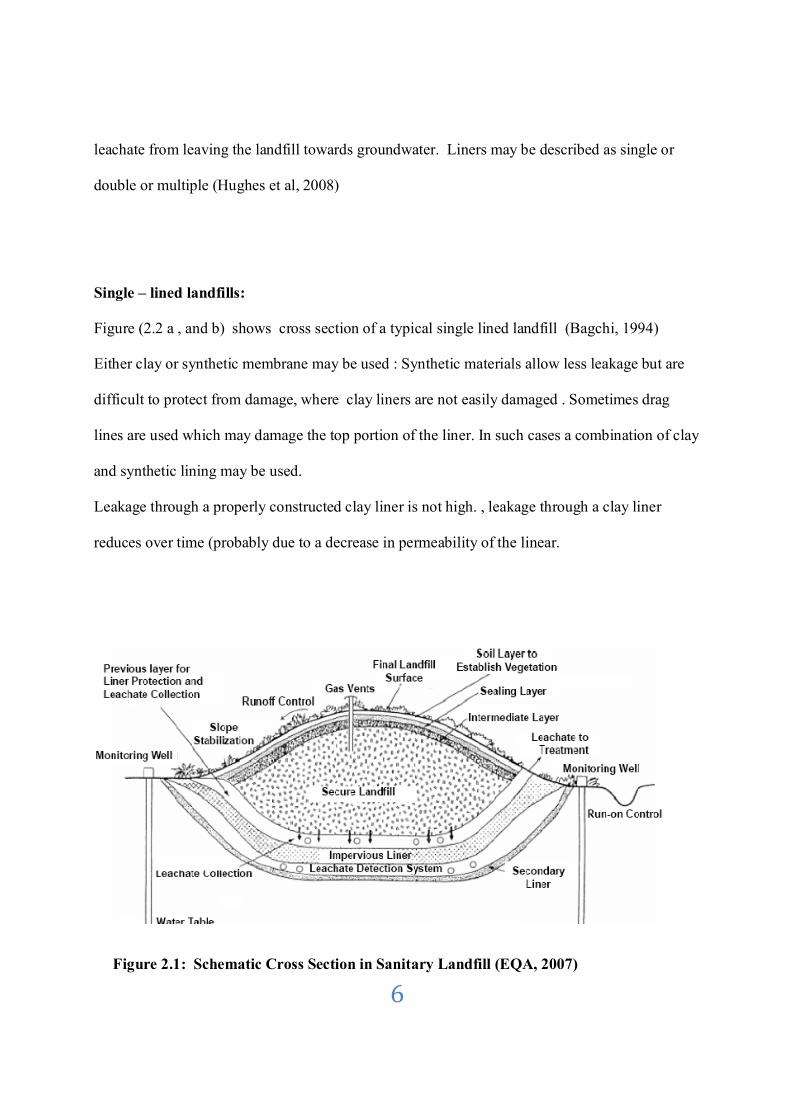
6
leachate from leaving the landfill towards groundwater. Liners may be described as single or
double or multiple (Hughes et al, 2008)
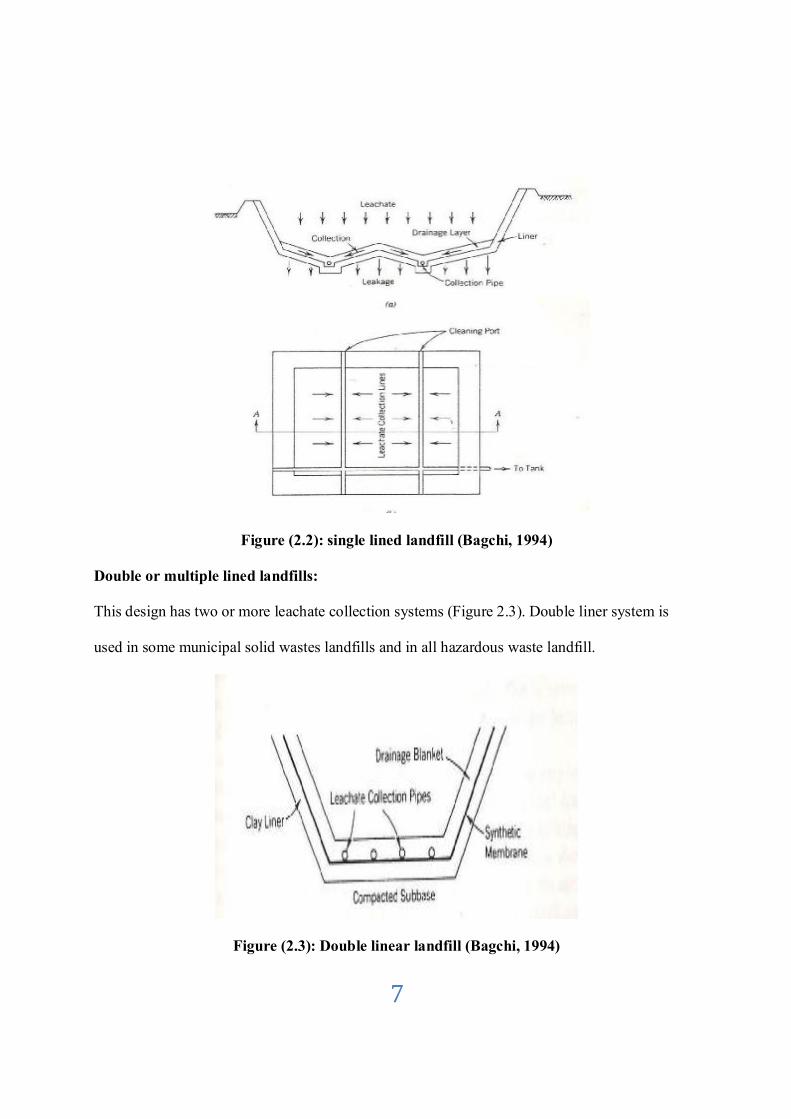
Single – lined landfills:
Figure (2.2 a , and b) shows cross section of a typical single lined landfill (Bagchi, 1994)
Either clay or synthetic membrane may be used : Synthetic materials allow less leakage but are
difficult to protect from damage, where clay liners are not easily damaged . Sometimes drag
lines are used which may damage the top portion of the liner. In such cases a combination of clay
and synthetic lining may be used.
Leakage through a properly constructed clay liner is not high. , leakage through a clay liner
reduces over time (probably due to a decrease in permeability of the linear.
Figure 2.1: Schematic Cross Section in Sanitary Landfill (EQA, 2007)
7
Figure (2.2): single lined landfill (Bagchi, 1994)
Double or multiple lined landfills:
This design has two or more leachate collection systems (Figure 2.3). Double liner system is
used in some municipal solid wastes landfills and in all hazardous waste landfill.
Figure (2.3): Double linear landfill (Bagchi, 1994)

8
2.4. Sanitary landfill compared with other methods:
According to Jabber and Nassar (2007), landfills will continue to be the most attractive disposal
route for solid waste and will remain as an integral part of most solid waste management plans.
Table (2.1) shows comprise sanitary landfill with other methods that used for disposing solid
wastes.
Under normal condition, sanitary landfills will be the least expensive disposal method followed
by (low-tech) composting. Incineration and advanced central sorting are the most expensive.
Furthermore, all treatment and disposal methods have a clear economy of scale.
Table (2, 1 ): Criteria for sanitary landfills (UNEP, 2003)
Aspect Sanitary landfill incineration Composting Advanced central sorting
Environmental impact
Acceptable (assessing proper
operation)
Good to very good
acceptable to good
Good to very good (high %
reject) Resource recovery
Acceptable (landfill gas)
Good to very good
Barely acceptable (soil
conditioner)
Good
Local operation and maintenance
capacity
Good to very good (appropriate
technology)
Not or barely
acceptable
Good (assuming low-tech solution)
Acceptable
Need/market for end product
Good to very good (LFG electricity +
reclaimed land)
Very good (electricity)
Good (compost as soil
conditioner)
Acceptable to good (difficult
market for recycled
materials)
Efficiency (% of total
municipal solid waste stream
handed
Very good (100%)
good (70-80%)
good (60-70%)
Acceptable to good
(30-40%)

9
2.5 Landfill leachate:
Leachate is formed when water passes through the waste in the landfill cell. The precipitation
can be from rain, melted snow or the waste itself. As the liquid moves through the landfill, many
organic and inorganic compounds, like heavy metals, are transported in the leachate.
The amount of leachate produced is directly linked to the amount of precipitation around the
landfill. The amount of liquid waste in the landfill also affects the quantity of leachate produced.
A large landfill site will produce greater amount of leachate than a smaller site (Monroe, 2001).
2.5.1 Factor affecting the composition of landfill leachate:
• The type of waste material.
• Landfill conditions include the pH, temperature, moisture, age and climate.
• Characteristics of precipitation entering the landfill.
• Final cover design. (Crawford and Smith, 1985).
2.5.2 Collection of leachate:
Leachate is collected from the bottom of modern landfills by a series of collection pipes installed
into the base of the landfill. The leachate percolates through the waste and into the pipes where it
collects. The leachate can then be recycled or pumped out of the landfill and placed in storage
areas or directly into the leachate treatment plant.
2.5.3 Extraction of leachate:
Two different methods are commonly used to extract the leachate (Eden, 1994)). These are:

10
Borehole pumps: These pump extracted leachate only to the point of collection. Borehole
pumps only run when leachate are present so there is a low energy demand. Individual
sensors are required in wells to switch the pumps on and off.
Educators: These function no matter whether liquid is present or not. Educators are part of
a circuit collection system. They are simple and reliable but use more energy. However, this
is still within acceptable limits as it is not necessary to run the educator for 24 hours a day.
This makes this option the favored choice for leachate extraction.
2.5.4 Treatment of leachate:
Studies have shown that discharge of raw municipal leachate into streams impacts aquatic life
and causes degradation of water quality (Bagchi, 1994)). The following traditional teqnique used
for waste water systems are also used for treating landfill leachate: biological treatment (aerobic
and anaerobic biological stabilization) and physical / chemical treatment (precipitation,
adsorption, coagulation, chemical oxidation, and reverse osmosis.
2.6 Factors determine contamination by leachate:
Here are several factors determined the contamination by leach ate (O'Leary and Walsh, 1997). It
is believed that the most factorsare follows:
1. Water table: If the water table is low (far below the ground surface), water will become
partially filtered as it percolated downward through the soil so contamination is less. If the water
table is high (close to the ground surface), contaminants can enter the groundwater directly
without filtration by soil.
2. Concentration of leachate: The higher the concentration of contaminants in the leachate the
higher the likelihood of groundwater pollution.
11
3. Soil type and structure: Permeability of the ground below the landfill affects the rate of
leachate escape. Sand has large pore size and so it allows greater groundwater flow. Clay is
tightly packed and so prevents the movement of groundwater and it is also more effective in
adsorbing out contaminants.
4. Leachate characteristics: Depending on characteristics of the landfill and the waste it
contains, the leachate may be relatively harmless or extremely toxic. Generally leachate has a
high biochemical oxygen demand (BOD) and high concentrations of organic solvents, and heavy
metals. Many other chemicals may be present, including pesticides, solvents, and heavy metals.
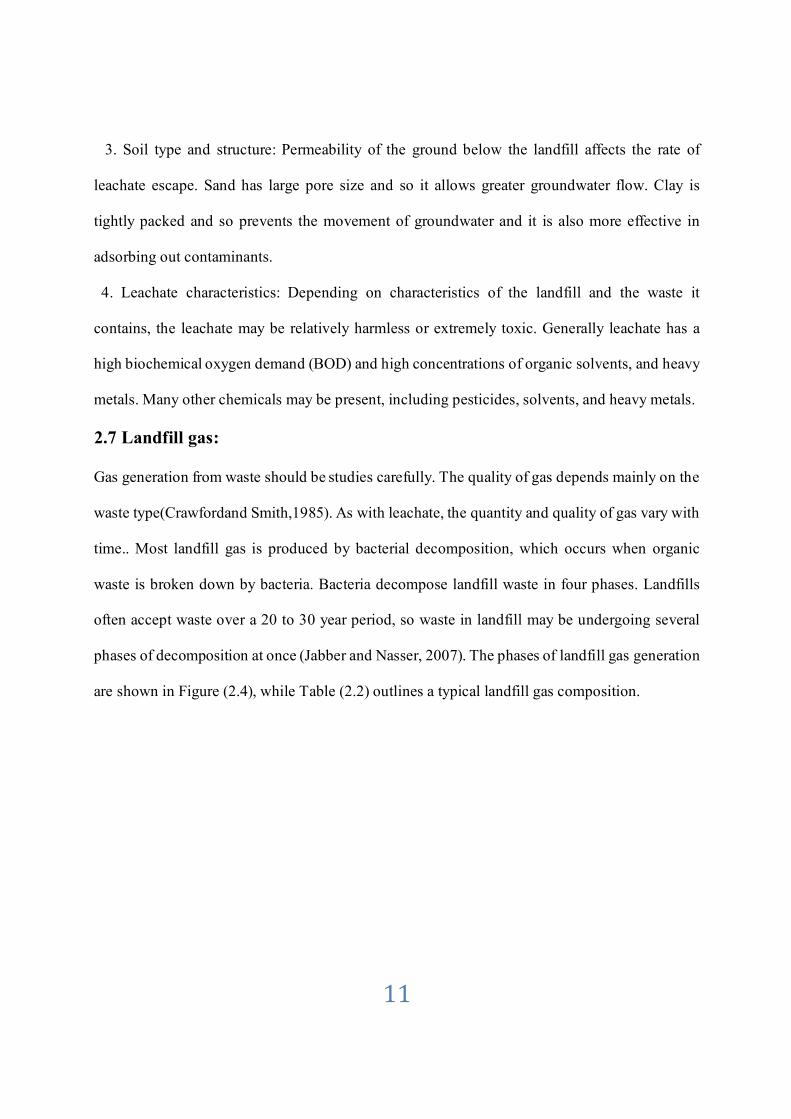
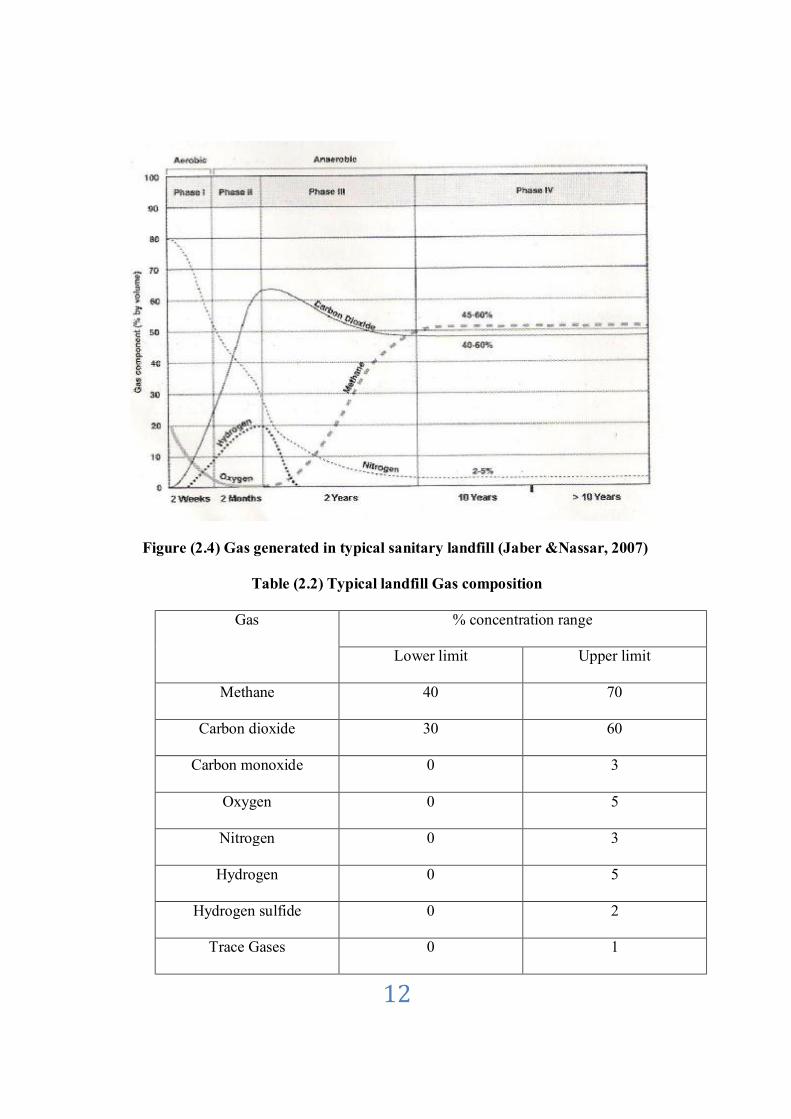
2.7 Landfill gas:
Gas generation from waste should be studies carefully. The quality of gas depends mainly on the
waste type(Crawfordand Smith,1985). As with leachate, the quantity and quality of gas vary with
time.. Most landfill gas is produced by bacterial decomposition, which occurs when organic
waste is broken down by bacteria. Bacteria decompose landfill waste in four phases. Landfills
often accept waste over a 20 to 30 year period, so waste in landfill may be undergoing several
phases of decomposition at once (Jabber and Nasser, 2007). The phases of landfill gas generation
are shown in Figure (2.4), while Table (2.2) outlines a typical landfill gas composition.
12
Figure (2.4) Gas generated in typical sanitary landfill (Jaber &Nassar, 2007)
Table (2.2) Typical landfill Gas composition
% concentration range Gas
Upper limit Lower limit
70 40 Methane
60 30 Carbon dioxide
3 0 Carbon monoxide
5 0 Oxygen
3 0 Nitrogen
5 0 Hydrogen
2 0 Hydrogen sulfide
1 0 Trace Gases

13
2.8 Impacts of Gas Generatedin Landfills:
2.8.1 Health Impacts:
In some cases, these gases found their way in to basements of houses and building and deaths
and injuries have asphyxiation, poisoning of from detonation of explosions of air methane
mixtures. Possible pathways of landfill gas are illustrated in Figure (2, 5).
2.8.2 Global Warming:
Methane has received recent attention as a contributor to global warming because on a molecular
basis, it has a relative effect 20 to 25 times greater than carbon dioxide.
2.8.3 Fires and Explosions:
Methane has the tendency to migrate away from the landfill boundaries by diffusion and
advection. The migrating gas finds its way into buildings and underground facilities erected on
or near to a landfill site where it forms gas pockets and creates potential explosive hazards.
Numerous incidents of fires and explosions due to lateral gas migration away from landfills have
been reported in the literature.
Figure (2.5) exposure pathway to landfill gas (EQA, 2007)
14
Onsite fires are common and many occur in the subsurface due to air entrainment into the landfill
and the formation of a mixture of methane and oxygen that can sustain a fire.
2.8.4 Unpleasant Odors:
The odorous nature of landfill gas may vary widely from relatively sweet to bitter and acid
depending on the concentration of the odorous constituents within the gas. These concentrations
will vary with waste composition and age. The extent to which odors spread away from the
landfill boundaries depends primarily on weather conditions; wind, temperature, pressure and
humidity.
2.8.5 Vegetation Damage:
Vegetation damage at or nearby to such sites is well documented in the literature.
The damage occurs primarily due to oxygen deficiency in the root zone resulting from a direct
displacement of oxygen by landfill gas. Roots are exposed to high concentrations of methane and
carbon dioxide; gas asphyxia. Methane oxidation near the surface by methane consuming
bacteria is factor that contributes to oxygen deficiency.
Heat release during methane oxidation increases the soil temperature creating a potential for
plant asphyxia. Other commonly reported factors that may affect growth of plants at landfill sites
include the presence of trace toxic compounds in landfill gas and cover soil characteristics such
as thickness, composition, compaction and moisture.
2.8.6 Air pollution:
Emissions of volatile organic compounds (VOCs) from landfills can be attributed to regular
household, co-disposal of light industrial wastes. The emission of VOCs is believed to have the
potential to increase cancer risks in local communities and contribute to ambient ozone
formation (Jouda, 1984).
16
CHAPTER (3)
STUDY AREA DESCRIPTION
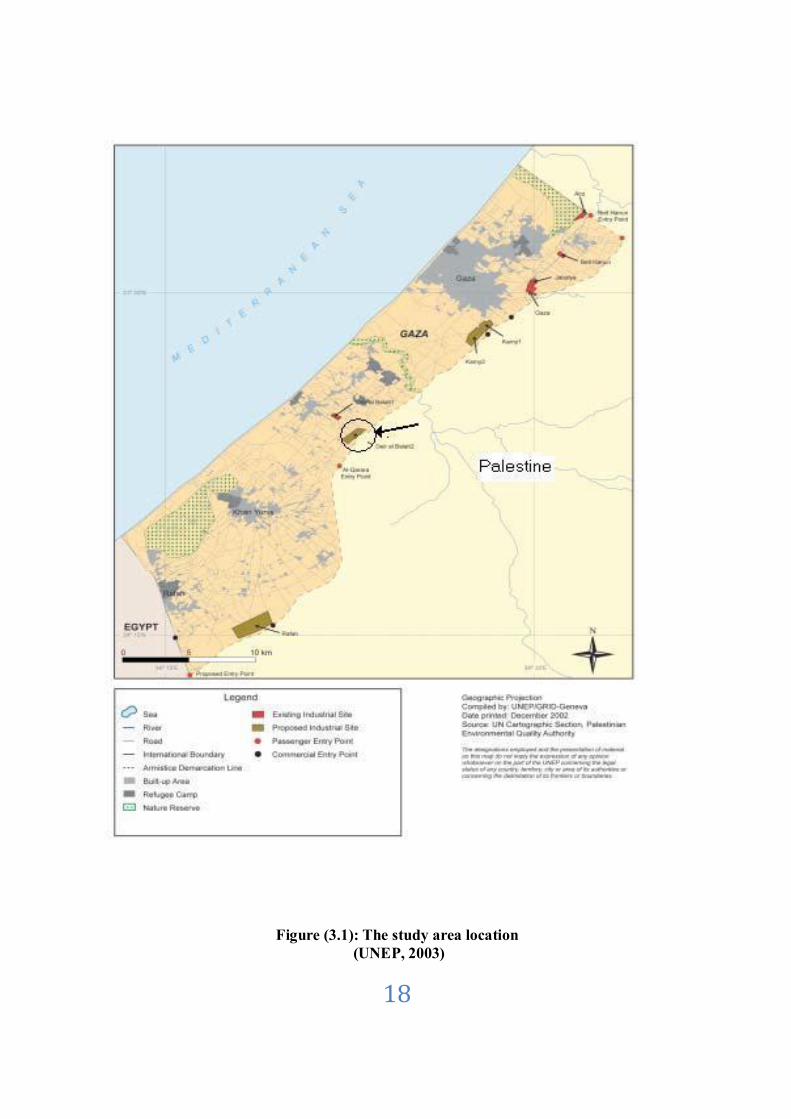
3.1 Location of the study area:
The study site located in Deir Al-Balah zone which situated in the middle area
of Gaza Strip (Figure3, 1) Furthermore, Gaza Strip constitutes the south west part of
Palestinian coastal plain of Mediterranean sea the strip is confines between the Mediterranean
sea in the west, Sinai of Egypt in the south, Negev desert in the east and green line in the north
.The Gaza strip area is about 365 km ² (MOPIC, 1994). The length is about 41 km on the western
Mediterranean cost and the width varying from 7 to 12 km. Gaza Strip is located in an arid to
semi-arid region. It is located on a latitude of 31º 16˝ to 31º 45˝ North and 34º 20 to 34º 25 East.
The study area in Dear El Balah city and the landfill is located closer to green line boundaries
(Figure3.1).
3.2 Climate of the study area:
The climate in Gaza strip has characteristically semi-arid climate , and is located in a transitional
zone between a temperature Mediterranean climate to the west and north , and arid Negev and
Sinai deserts to the east and south .There are two well-defined season : the wet season starting in
October and extend through April , and the dry season from April to September .
The average daily temperature in the Gaza strip range from 26 oC in the summer to 12 oC in
winter with the average daily maximum temperature range from 29 oC to 17 oC , and the
minimum temperature range from 21 oC to 9 oC in the summer and winter respectively (GMS,
2009 )
17
Mean daily evaporation ranges between (21-6.3) mm per day in July and December respectively.
The high potential evaporation is induced by high solar radiation incident over the Gaza Strip at
190 kg – calories / cm2 / year ( US. National Academy of Science, 1999). The actual amount of
evaporated water greatly depends on the nature of the soil , the vegetation and the availability
ground water table. Rainfall occurs in the winter period which is between October to March. The
period for June to September is dry with no rainfall. The average rainfall varies between 200-400
mm(PMO, 2008).Table (3.1) and figure (3.2) represents the rainfall amounts in the study area.
18
Figure (3.1): The study area location (UNEP, 2003)

19
Figure (3,2): Average rainfall depth (1974-2005 ).

20
Table (3.1): Average rainfall (mm) and quantities of rains (Mm3) for Gaza Strip
Station .Name
Rain 02/03 (mm)
Rain 03/04 (mm)
Rain 04/05 (mm)
Quantities in 02/03
(Mm3)
Quantities in 03/04
(Mm3)
Quantities in 04/05
(Mm3)
Avg. Annual Rain (mm)
Avg. annual
Quantities (Mm3)
Beit-Hanoun
801.5 349.9 358.7 23.2 10.1 10.4 393 11.4
Beit-Lahia 724 383.0 320.6 10.3 5.5 4.6 414 5.9
Shati 627 334.9 296.6 11.1 5.9 5.3 376 6.7
Gaza-City 599 374.4 316 7.8 4.9 4.1 439 5.7 Tuffah 653.5 421.3 345 15.2 9.8 8.0 343 8.0
Moghraqa 790.7 493.6 323.5 27.7 17.3 11.3 355 12.4
Nusseirat 446.2 318.0 405 13.2 9.4 11.9 336 9.9
Deir El Balah
372.6 312.9 345.5 14.3 12.0 13.3 310 11.9
Khanyunis 298 203.7 369.5 24.9 17.0 30.9 283 23.6
Khuzaa 261.2 184.5 365.7 11.1 7.8 15.5 267.5 11.4
Rafah 220.8 172.0 358.2 8.6 6.7 13.9 228 8.8
Total 167.4 106.4 129.2 317 115.8

21
3.3. Geology of the study area:
Geology of Gaza strip is a part of geology of Palestine. Several authors have described geology
of Palestine. Abed and Wishahi (1999) summarized the geology of Palestine in his titled book
(Geology of Palestine). Gaza Strip is a south west part of the coastal aquifer of Palestine.
Summary of Gaza Strip geology is given below.
The coastal aquifer of the Gaza Strip consists of the Pleistocene age Kurkar and recent
(Holocene age) sand dunes. The Kurkar Group consists of marine and Aeolian calcareous
sandstone (“Kurkar”), reddish silty sandstone, silts, clays, unconsolidated sands, and
conglomerates.
Regionally, the Kurkar Group is distributed in a belt parallel to the coastline, from north of Haifa
to the Sinai in the south. Near the Gaza Strip, the belt extends about 15-20 km inland, where it
un-conformably overlies Eocene age chalks and limestone, or the Miocene-Pliocene age Saqiye
Group, a 400-1000 m thick sequence of marls, marine shale, and claystones. The transition from
the Kurkar Group to the Saqiye Group is sometimes obscured by the presence of a thin, basal
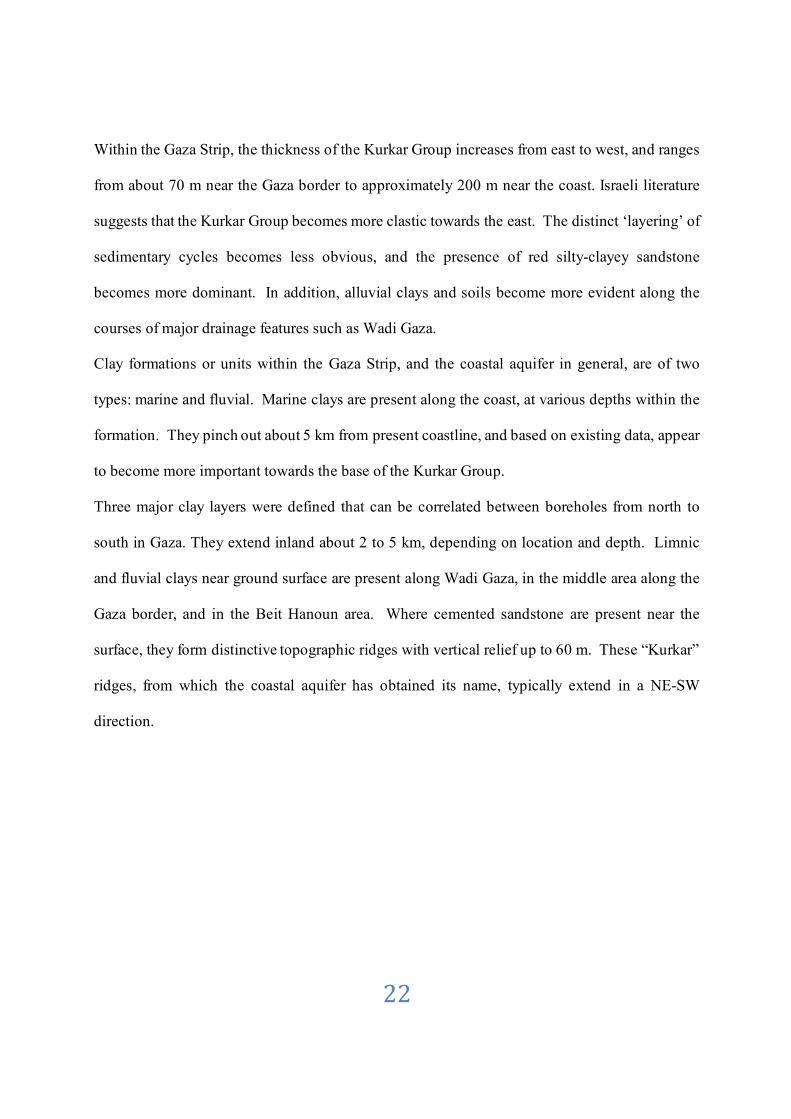
conglomerate. Figure (3.3) presents typical hydrogeological cross-section of the coastal aquifer
(PWA, 2000).
The Kurkar Group consists of a complex sequence of coastal, near-shore and marine sediments.
Marine calcareous sandstone forms the base of each transgressive sequence, and marine clays
form the end of regressions.
Cycles of deposition may be incomplete, depending on location; hence sedimentary sequences
may be truncated and rest unconformable on one another. The calcareous sandstone are
interbedded with irregular layers and pockets of uncemented sand, thin red-brown sands and silty
sands, and especially at greater depth, marine silts and clays.
22
Within the Gaza Strip, the thickness of the Kurkar Group increases from east to west, and ranges
from about 70 m near the Gaza border to approximately 200 m near the coast. Israeli literature
suggests that the Kurkar Group becomes more clastic towards the east. The distinct ‘layering’ of
sedimentary cycles becomes less obvious, and the presence of red silty-clayey sandstone
becomes more dominant. In addition, alluvial clays and soils become more evident along the
courses of major drainage features such as Wadi Gaza.
Clay formations or units within the Gaza Strip, and the coastal aquifer in general, are of two
types: marine and fluvial. Marine clays are present along the coast, at various depths within the
formation. They pinch out about 5 km from present coastline, and based on existing data, appear
to become more important towards the base of the Kurkar Group.
Three major clay layers were defined that can be correlated between boreholes from north to
south in Gaza. They extend inland about 2 to 5 km, depending on location and depth. Limnic
and fluvial clays near ground surface are present along Wadi Gaza, in the middle area along the
Gaza border, and in the Beit Hanoun area. Where cemented sandstone are present near the
surface, they form distinctive topographic ridges with vertical relief up to 60 m. These “Kurkar”
ridges, from which the coastal aquifer has obtained its name, typically extend in a NE-SW
direction.
23
Figure (3.3): Typical hydrogeological cross section of Gaza Strip (PWA, 2000)
The dune sands (and loess soils) which overlie the Kurkar Formation consist of mostly fine,
well-sorted sands of Aeolian origin. They are predominantly present in the north and along the
Mawasi area in the southwest. Thickness of these sands and loess range from a few meters to 15
m. In addition, alluvial sediments, consisting of sand, loess and gravel beds, are present along
Wadi courses. In Wadi Gaza, the reported thickness of alluvial sediments is between 30 to 40 m.
3.4 Hydrogeology:
Gaza’s water resources are essentially limited to that part of the coastal aquifer that underlies its
365 km2 area. The coastal aquifer is the only aquifer in the Gaza Strip and is composed of
Pleistocene marine sand and sandstone, intercalated with clayey layers. The maximum thickness
of the different bearing horizons occurs in the northwest along the coast (150 m) and decreasing
gradually toward the east and southeast along the eastern border of Gaza Strip to less that10 m.
The base of coastal aquifer system is formed of impervious clay shade rocks of Neogene age

24
(Saqiyah formation. Depth to water level of the coastal aquifer varies between few meters in the
low land area along the shoreline and about 70m along the eastern border.
The coastal aquifer holds approximately 5x10⁹ m3 of groundwater of different quality. However,
only 1.4 x10⁹ m3 of this is “freshwater”, with chloride content of less than 500mg/ (Al Jamal &
Al Yaqubi, 2002) This fresh groundwater typically occurs in the form of lenses that float on the
top of the brackish and/or saline ground water. That means that approximately 70% of the
aquifer is brackish or saline water and only 30% is fresh water.
The major source of renewable groundwater to the aquifer is rainfall. Rainfall is sporadic across
Gaza and generally varies from 400mm/yr in the North to about 200 mm/yr in the south (figure
3.4 and table 3.1). The total rainfall recharge to the aquifer is estimated to be approximately
45Mm3/yr (PMO, 2008). The remaining rainwater evaporates or dissipates as run-off during the
short periods of heavy rainstorms.
The layered stratigraphy of the Kurkar Group within the Gaza Strip subdivides the coastal
aquifer into 4 separate sub aquifers near the coast. Further east, the marine clays pinch out and
the coastal aquifer can be regarded as one hydrogeological unit. The upper sub aquifer “A” is
unconfined, whereas sub aquifers “B1, B2, and C” become increasingly confined towards the
sea.
The thickness of the entire coastal aquifer sequence at the coastline is on average about 120 m.
At the eastern Gaza border, the saturated thickness is about 60 m in the north, and only 5-10 m in
the south near Rafah. Localized perched conditions may exist in the unsaturated zone
throughout the Gaza Strip, due to the presence of shallow fluvial and limnic clays.
The transmissivity values of the upper 20-30m tested saturated part interval of the aquifer are
ranging between 700 and 5,000 m2/d. The corresponding values of hydraulic conductivity (K)

25
are within a relatively narrow range, 20-80 m/d, with a few outliers greater than 100 m/d. Based
on lithology and information from studies carried out in Israel, the specific yield of the
unconfined coastal aquifer is in the 0.15-0.3 range.
3.5 Soil types:
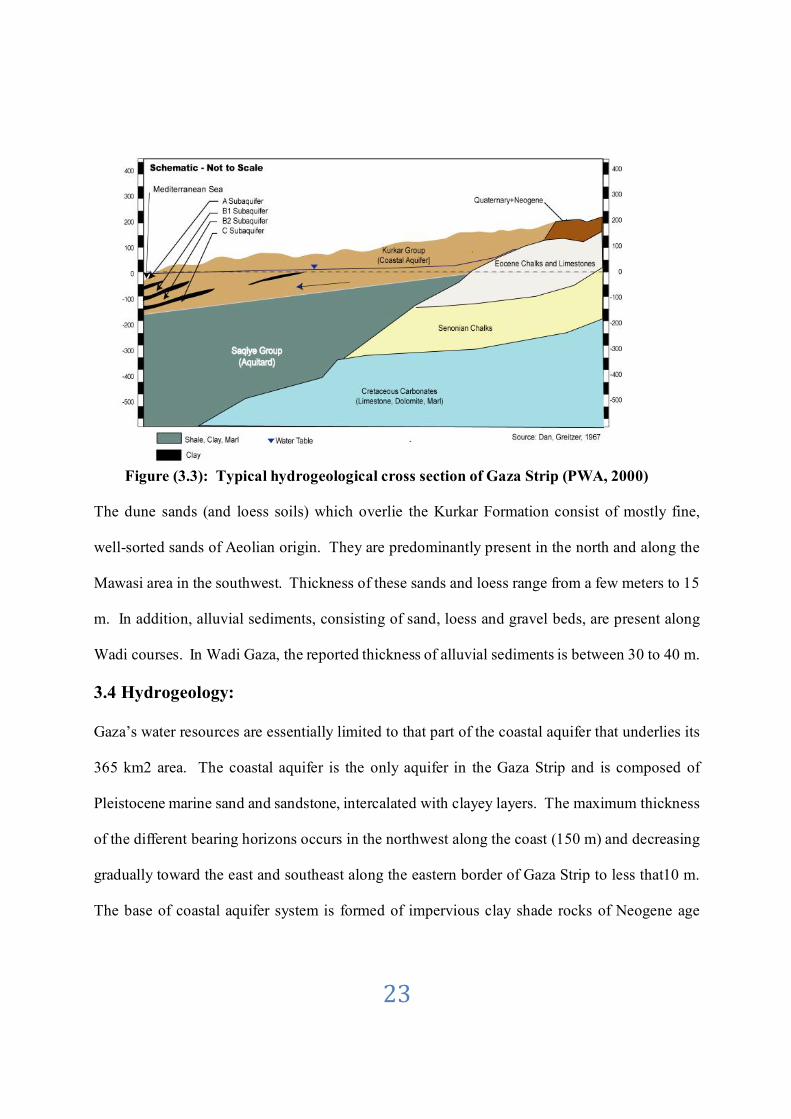
The Gaza Strip is 365 km2 and has several major soil types (Figure 3.4).Shomaret. al (2005)
described in details these soil types. Arenosolic, Calcaric, Rhegosolic, and CalcaricFluvisolic
soils are examples of these soils. Arenosolic (sandy) soils of dune accumulations are Regosols
without a marked profile. The soils are moderately calcareous (5–8% CaCO3), with low organic
matter.
CalcaricArenosols (loessy sandy soils) can be found some 5 km inland in the central and
southern part of the Strip, in a zone along Khan Yunes toward Rafah, parallel to the coast. This
belt forms a transitional zone between the Arenosolic soils and the Calcaric (loess) soils. Typical
Calcaric soils are found in the area between the city of Gaza and the Wadi Gaza and contain 8–
12% CaCO3. ArenosolicCalcaric (sandy loess) soils are transitional soils, characterized by a
lighter texture. These soils can be found in the depression between the Calcareous (Kurkar)
ridges of Deir El Balah. Apparently, windblown sands have been mixed with Calcareous
deposits. Deposition of these two types of windblown materials originating from different
sources has occurred over time and more or less simultaneously. These soils have a rather
uniform texture. Another transitional form is the Arenosols over Calcaric soils. These are loess
or loessial soils (sandy clay loam) that have been covered by a layer (0.20–0.50 m) of dune sand.
These soils can be found east of Rafah and Khan Yunis.
Fluvisols (alluvial) and Vertisols (grumosolic), which are dominated by loamy clay textures, are
found on the slopes of the northern depressions between Beit Hanoun and Wadi Gaza. Borings

26
east of El Montar ridge have revealed that alluvial deposits of about 25m in thickness occur. At
some depth, calcareous concentrations are present. The CaCO3 content can be approximately
15–20%. Some of the soils have been strongly eroded, and the reddish-brown subsoil may be
exposed on the tops of ridges and along slopes. The alluvial sediments are underlain by a
calcareous layer.
27
Figure (3.4): Main soil types with associated land forms and dominant land use.
(EQA, 2004)
28
3.6 Solid waste dumpsites in Gaza governorates
3.6.1 Solid waste management in the Northern governorates :
The four municipalities (Jabalia, Beitlahia, BeitHanon, and Om Al Naser) are working together
and sharing most of the activities of the solid waste management council in the north (SWMCN).
Beit Hanon dump site is the only open dump site located on the north border which is located on
the top of a good water aquifer. This site was closed officially in the year 2002. So after the
formation of the north council all the waste is transferred to the official dump site in Gaza city.
Different open random dump sites are available in the northern governorate which is as follow:
1. A Nada Random Dump site
2. Al Manshia Dump site.
3. Om Al Nser Dump site.
4. Wade BeitHanon Dump site.
5. BeitHanon Dump site.
6. Jabalia Dump site
3.6.2 Solid waste management in Gaza City:
Johor Al dick official Dump site:
The area of this dump site is approximately 140 dunums. Its located in the eastern part of Gaza
City ( Figure 3.5). The ground water depth is estimated to be more than 100 m. Part of this dump
site is designed and constructed to the disposal of hazardous waste. This site serving the whole
municipalities of the Gaza governorate as well as the northern governorate in addition to
UNWRA.

29
Figure (3.5): Location of solid waste dumping sites in Gaza Governorates
(UNEP, 2003)
30
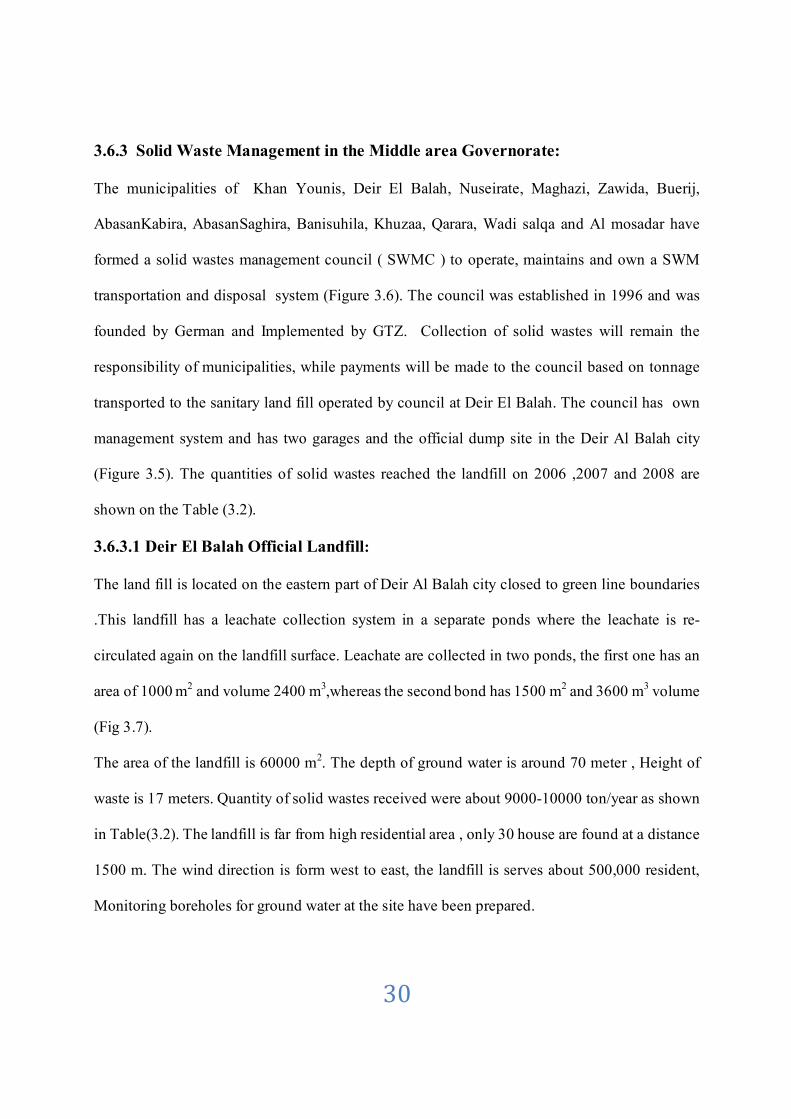
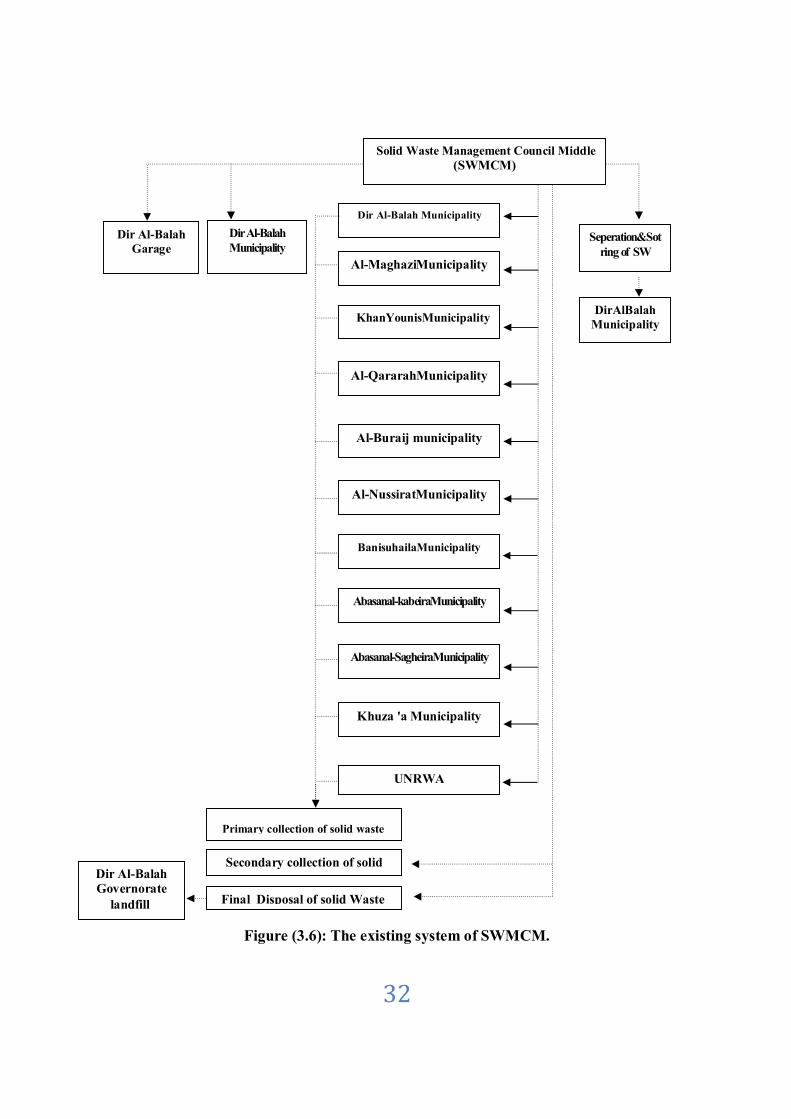
3.6.3 Solid Waste Management in the Middle area Governorate:
The municipalities of Khan Younis, Deir El Balah, Nuseirate, Maghazi, Zawida, Buerij,
AbasanKabira, AbasanSaghira, Banisuhila, Khuzaa, Qarara, Wadi salqa and Al mosadar have
formed a solid wastes management council ( SWMC ) to operate, maintains and own a SWM
transportation and disposal system (Figure 3.6). The council was established in 1996 and was
founded by German and Implemented by GTZ. Collection of solid wastes will remain the
responsibility of municipalities, while payments will be made to the council based on tonnage
transported to the sanitary land fill operated by council at Deir El Balah. The council has own
management system and has two garages and the official dump site in the Deir Al Balah city
(Figure 3.5). The quantities of solid wastes reached the landfill on 2006 ,2007 and 2008 are
shown on the Table (3.2).
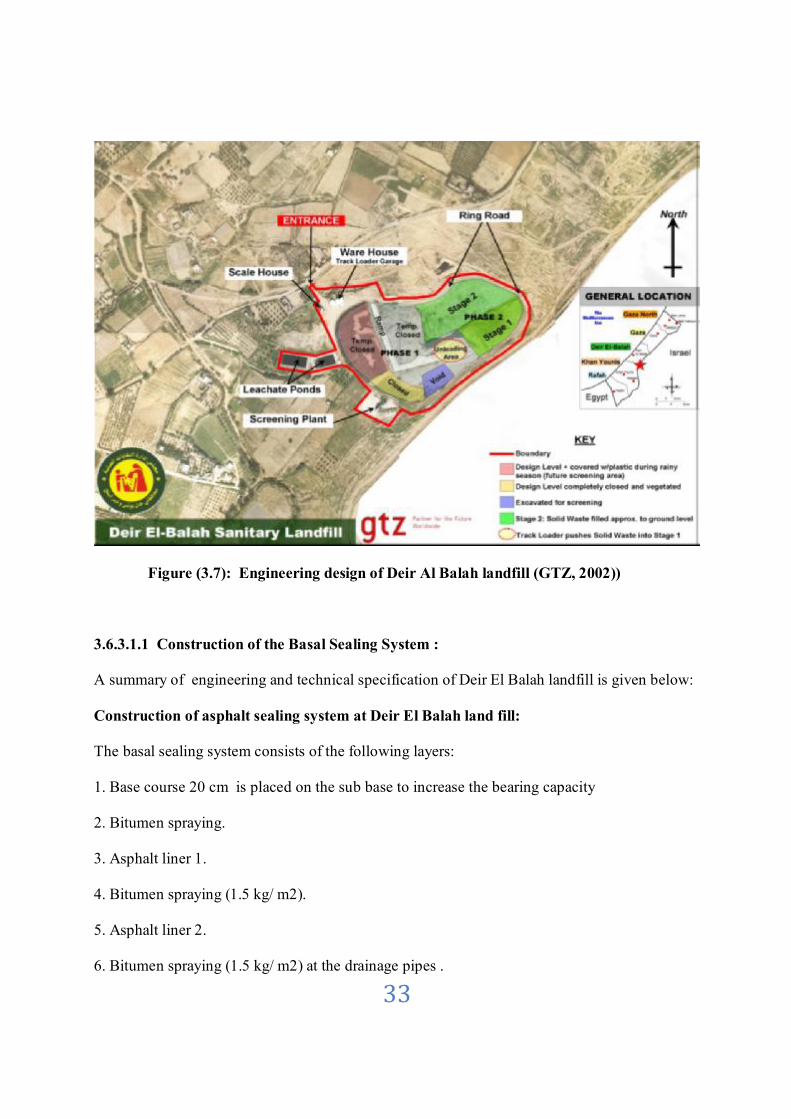
3.6.3.1 Deir El Balah Official Landfill:
The land fill is located on the eastern part of Deir Al Balah city closed to green line boundaries
.This landfill has a leachate collection system in a separate ponds where the leachate is re-
circulated again on the landfill surface. Leachate are collected in two ponds, the first one has an
area of 1000 m2 and volume 2400 m3,whereas the second bond has 1500 m2 and 3600 m3 volume
(Fig 3.7).
The area of the landfill is 60000 m2. The depth of ground water is around 70 meter , Height of
waste is 17 meters. Quantity of solid wastes received were about 9000-10000 ton/year as shown
in Table(3.2). The landfill is far from high residential area , only 30 house are found at a distance
1500 m. The wind direction is form west to east, the landfill is serves about 500,000 resident,
Monitoring boreholes for ground water at the site have been prepared.
31
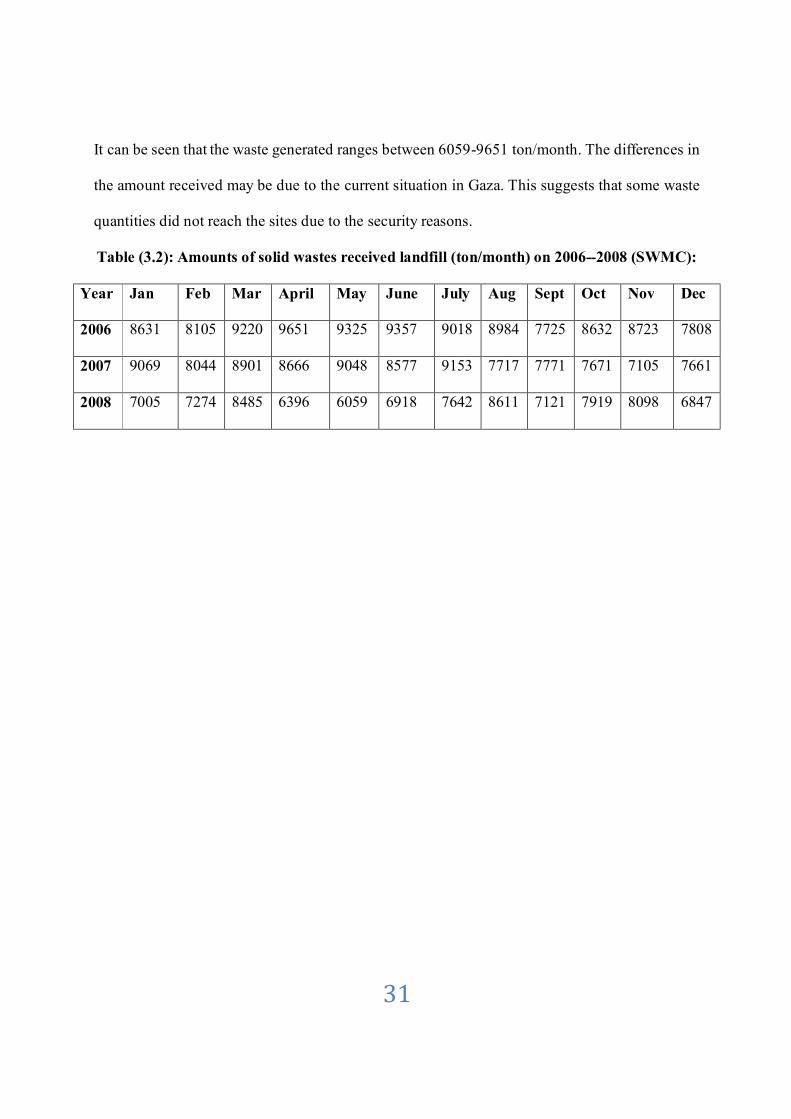
It can be seen that the waste generated ranges between 6059-9651 ton/month. The differences in
the amount received may be due to the current situation in Gaza. This suggests that some waste
quantities did not reach the sites due to the security reasons.
Table (3.2): Amounts of solid wastes received landfill (ton/month) on 2006--2008 (SWMC):
Year Jan Feb Mar April May June July Aug Sept Oct Nov Dec
2006 8631 8105 9220 9651 9325 9357 9018 8984 7725 8632 8723 7808
2007 9069 8044 8901 8666 9048 8577 9153 7717 7771 7671 7105 7661
2008 7005 7274 8485 6396 6059 6918 7642 8611 7121 7919 8098 6847
32
Figure (3.6): The existing system of SWMCM.
Secondary collection of solid waste
Dir Al-Balah Municipality
Dir Al-Balah Garage
Dir Al-Balah Municipality
Al-MaghaziMunicipality
KhanYounisMunicipality
Al-QararahMunicipality
Al-Buraij municipality
Al-NussiratMunicipality
UNRWA
Khuza 'a Municipality
Abasanal-SagheiraMunicipality
BanisuhailaMunicipality
Abasanal-kabeiraMunicipality
Solid Waste Management Council Middle (SWMCM)
Seperation&Sotring of SW
DirAlBalahMunicipality
Primary collection of solid waste
Final Disposal of solid Waste
Dir Al-Balah Governorate
landfill
33
Figure (3.7): Engineering design of Deir Al Balah landfill (GTZ, 2002))
3.6.3.1.1 Construction of the Basal Sealing System :
A summary of engineering and technical specification of Deir El Balah landfill is given below:
Construction of asphalt sealing system at Deir El Balah land fill:
The basal sealing system consists of the following layers:
1. Base course 20 cm is placed on the sub base to increase the bearing capacity
2. Bitumen spraying.
3. Asphalt liner 1.
4. Bitumen spraying (1.5 kg/ m2).
5. Asphalt liner 2.
6. Bitumen spraying (1.5 kg/ m2) at the drainage pipes .

34
The detailed requirement to the component of the liner system are described in the Technical
Specification.
Sealing layers have to comply with the following specification :
Asphalt liner 1 being a binding layer on the base course
Grain size 0 to 3/4”
Bitumen content 5.5%
Bitumen B60-70
Thickness 5 cm
Void ratio <=5 %
Asphalt liner 2 being the sealing layer on asphalt liner 1 :
Grain size 0 to 3/8”
Bitumen content 6%
Thickness 4 cm
Bitumen B60-70
Void ratio <=3%
The materials and characteristics of the asphalt liners correspond to conventional road
construction. A layer of hot bitumen ( bitumen spraying ) is applied between the two asphalt
liners which provides an impermeable connection of the two layers .(SWMC)
3.6.4 Solid waste management in Khan Yunes Governorate:
There are two open illegal dump site :
1. Al Hai Al Namsawi dump site .
2. Al mawassi dump site.
3.6.5 Rafah Governorate :Rafah Municipality landfill is located near sofa with an area of
27000 m. Four municipalities are sharing this site. There is no leachate collection and the height
of the waste reach more than 15 meter.
36
CHAPTER (4)
METHODOLOGY 4.1 Introduction
The study covered Deir El Balah landfill in Gaza Strip which has a linear system. The first
purpose of this study was to identify the effect of landfill on quality of groundwater, air, soil and
agriculture.
Analysis of water for wells surrounding landfill are made, historical data from previous
monitoring wells were collected to deduce the trend of past and current system operation and
ground water quality. The second purpose to study social and health impacts of the landfill on
the people live, questionnaire for target group are made.
4.2 Data Collection:
The data and information used in this thesis have been collected as follows:
4.2.1 Available Data in the Study Area:
Historical data for well surrounding landfill are not found because wells are not recorded and
drilled by farmers. Recorded wells are found far from landfill, therefore historical information
for groundwater quality around landfill are poor.
Only two wells (Mohna well and Ben Said well) have records. Sampling and analysis were made
by German Technical Cooperation (GTZ) on 2003 and 2005. Data of most recorded wells in
middle area in Gaza Strip were analyzed in Public Health laboratory on 2007 and 2008.
No historical data for analysis of leachate except for on 1988, 1999, 2001 and 2005. Only these
data were obtained from GTZ and SWMC.
37
4.2.2 Field visitation:
several visits has been done to German Technical Cooperation (GTZ) in Gaza Strip and Solid
Waste Management Council (SWMC) to obtain information about landfill such as composition
of linear system, volumes of solid wastes, problems that facing SWMC and municipalities
related gathering and dumping solid wastes.
4.3 Questionnaire: The study area is located very closed to the Green Line. Technical
regulations for the establishment of a landfill should be considered: to be far from major
population centers and location must be suitable in terms of wind directions.
The social effects of the Leachate on the local community were collected through
questionnaire. The questionnaire consists of 30 questions related to the soil
type, irrigation system, agricultural activity, water well information, such as
distance from the Leachate site, depth of water table, rainwater type, ammonia
emission, hydrogen sulfide smells, intensity of smells, health status of the
farmers, insects and birds. More details are shown in (Annex 1). However, data
collection includes available data in the study area, and data collected by field visits to target
landfill area office of solid wastes management council (SWMC) also from German technical
cooperation (GTZ).
The surrounding area of Deir El Balah Landfills considered agricultural area. It is not highly
populated. Field survey for the houses surrounding the landfill classified the area as follows:
Zone 1: including the houses at a radius of about 300 m from the landfill (3 houses).
Zone 2: including the houses at a radius of about 500 m from the landfill (6 houses).
Zone 3: including the houses at a radius of about 700 m from the landfill (8 houses).
Zone 4: including the houses at a radius of about 1000 m from the landfill (about 120 houses).
38
About of 25 questionnaire samples have been conducted in the study as follows:
3 questionnaires for zone1 (12%).
3 questionnaires for zone 2 (12% ).
5 questionnaires for zone 3 (20% ).
14 questionnaires for zone 4 (56% ).
4.4 Sampling program:
On September 2008 groundwater samples were collected from 8 selected wells surrounding Deir
Al Balah landfill and analyzed in laboratories of Islamic University of Gaza.
The wells located in the west side of the landfill represented the downstream side as the lateral
flow direction of Gaza Strip is form east to west. The wells distance from the landfill are
varying between about 200-500m.
4. 5 Tested Parameters:
A group of physical and chemical parameters were tested in groundwater samples. The physical
parameters including:
• Temperature
• pH
• electrical conductivity (EC)
• Total dissolved solids (T.D.S).
The chemical parameters include:
• Nitrate (NO3)
• Ammonia (NH4), and
• Chloride (Cl).
39
4. 5.1 Physical analysis:
1- Temperature
Temperature was taken synchronously with pH value using the device
( Hanna 8424) by selection of their modes
2- pH Combined portable meter( Hanna 8424) was used for measuring PH and temperature.
3- Electrical conductivity (EC).
Measuring conductivity was carried out using EC meter (Hanna, TH-2400) Voltage is
Applied between the two electrodes immersed in the solution, and the voltage drop caused by
the resistance of the solution is used to calculate conductivity. The display of the EC value is
also automatically compensated for temperature. The basic unit of measuring conductivity is
micro Siemens (Mslcm).
4- Total dissolved solids (T.D.S):
Measuring T.D.S was carried out using T.D.S meter.
4. 5.2 Chemical analysis:
1- Nitrate (NO3): was measured with Spectrophotometer device. Nitrate measuring process is
achieved by taking samples of a known concentrations and using the resulted calibration curve,
and then by matching technique.
2- Chloride determination (Cl):
After the sample was diluted 1ml, potassium chromate solution added. The mixture is then
titrated with silver nitrate solution until the color changes form yellow to reddish brown.

40
3- Ammonia (NH4):
Sufficient amount of sodium hydroxide - thiosulfate reagent was added to the
flask (pink layer is formed) . The flask is then connected to distillation
apparatus, mixed thoroughly and 200 ml was distilled into boric acid
absorbing solution. Aliquot of the distillate was titrated with 0.02 N standard
sulfuric acid until the indicator turned pale lavender. The following formula
was used to calculate the ammonia as total Kjeldahl Nitrogen :
Mg/L ammonia = ((A-B).280)/ml sample.
A = Volume of sulfuric acid titrated for the sample.
B = Volume of sulfuric acid titrated for the blank.
4.6 Leachate Collection:
Leachate samples were collected directly from the landfill site in Deir Al-Balah. The land fill
collection system was designed from a concrete structure and has a pipeline that collect the
Leachate in a separate room. The Leachate were re-added to the new solid waste that will come
in the next day to enhance the biodegradation. Samples of these Leachate were collected
manually using glass bottles and were sent to the laboratory in the Islamic University of Gaza for
chemical analysis.
4.7 Data Analysis:
Data analysis has been done software programs involving the use of :
1- Excel for drawing graphs, and tables.
2- SPSS program to analysis questionnaire.
41
CHAPTER (5)
RESULTS AND DISCUSSIONS
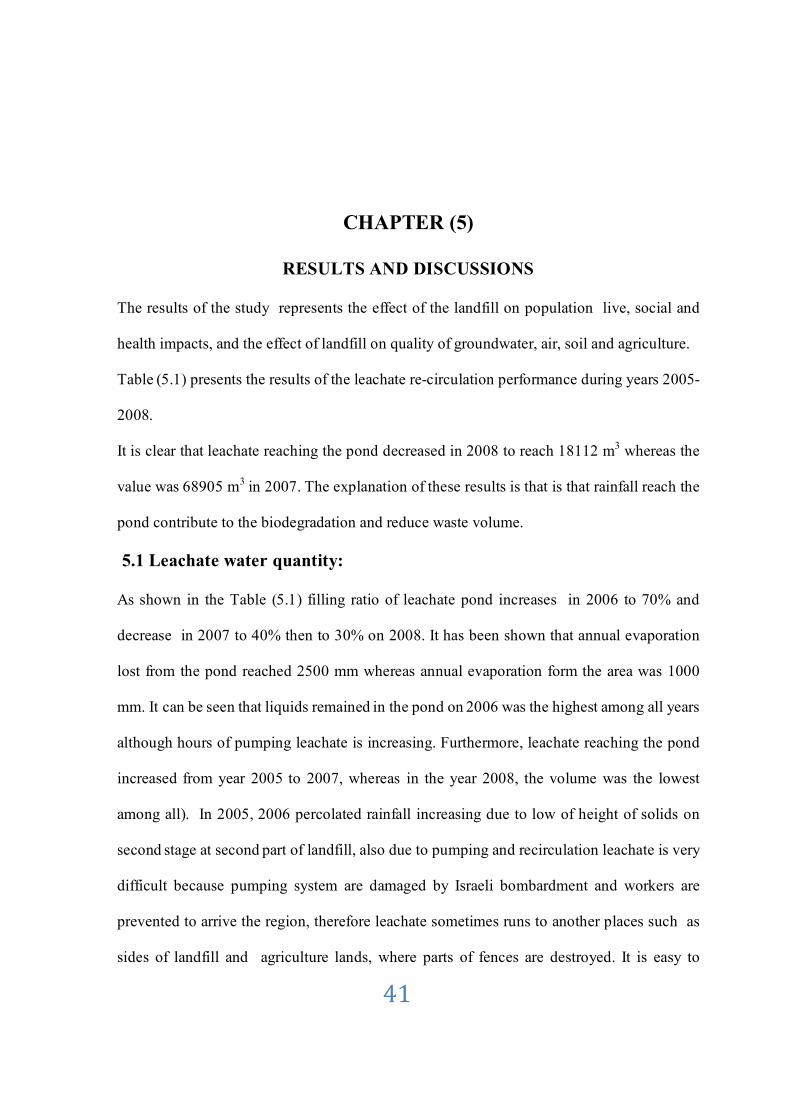
The results of the study represents the effect of the landfill on population live, social and
health impacts, and the effect of landfill on quality of groundwater, air, soil and agriculture.
Table (5.1) presents the results of the leachate re-circulation performance during years 2005-
2008.
It is clear that leachate reaching the pond decreased in 2008 to reach 18112 m3 whereas the
value was 68905 m3 in 2007. The explanation of these results is that is that rainfall reach the
pond contribute to the biodegradation and reduce waste volume.
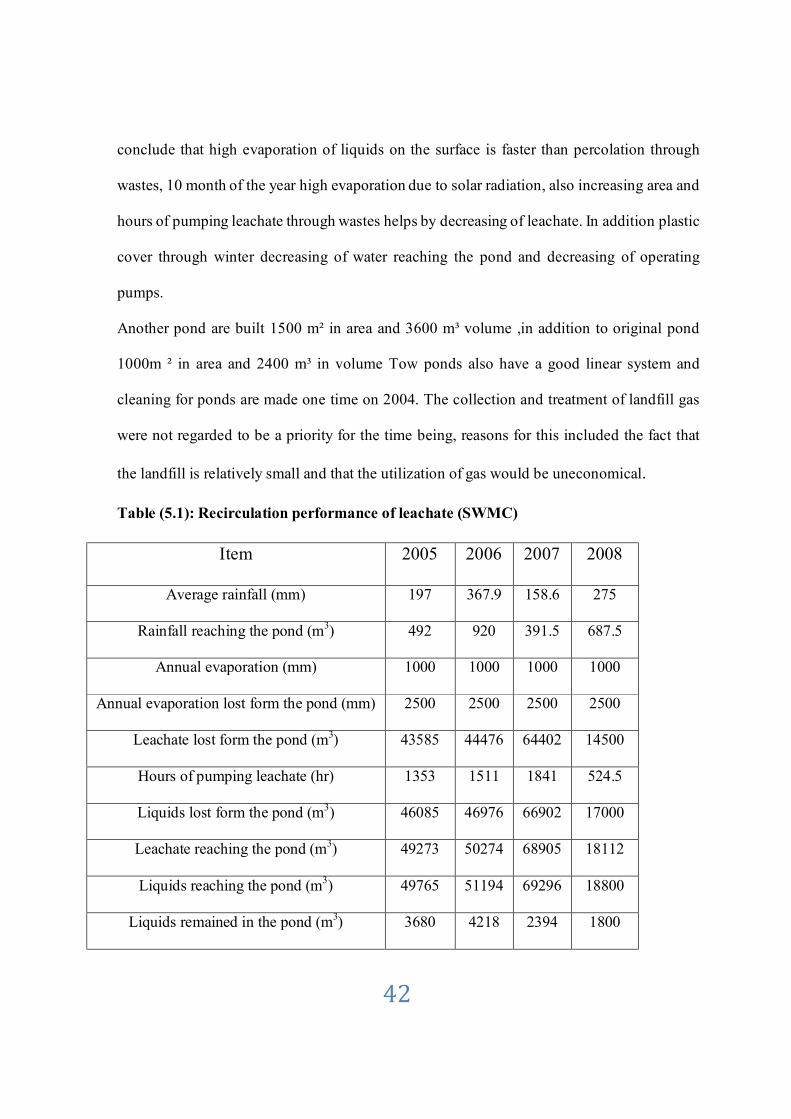
5.1 Leachate water quantity:
As shown in the Table (5.1) filling ratio of leachate pond increases in 2006 to 70% and
decrease in 2007 to 40% then to 30% on 2008. It has been shown that annual evaporation
lost from the pond reached 2500 mm whereas annual evaporation form the area was 1000
mm. It can be seen that liquids remained in the pond on 2006 was the highest among all years
although hours of pumping leachate is increasing. Furthermore, leachate reaching the pond
increased from year 2005 to 2007, whereas in the year 2008, the volume was the lowest
among all). In 2005, 2006 percolated rainfall increasing due to low of height of solids on
second stage at second part of landfill, also due to pumping and recirculation leachate is very
difficult because pumping system are damaged by Israeli bombardment and workers are
prevented to arrive the region, therefore leachate sometimes runs to another places such as
sides of landfill and agriculture lands, where parts of fences are destroyed. It is easy to
42
conclude that high evaporation of liquids on the surface is faster than percolation through
wastes, 10 month of the year high evaporation due to solar radiation, also increasing area and
hours of pumping leachate through wastes helps by decreasing of leachate. In addition plastic
cover through winter decreasing of water reaching the pond and decreasing of operating
pumps.
Another pond are built 1500 m² in area and 3600 m³ volume ,in addition to original pond
1000m ² in area and 2400 m³ in volume Tow ponds also have a good linear system and
cleaning for ponds are made one time on 2004. The collection and treatment of landfill gas
were not regarded to be a priority for the time being, reasons for this included the fact that
the landfill is relatively small and that the utilization of gas would be uneconomical.
Table (5.1): Recirculation performance of leachate (SWMC)
Item 2005 2006 2007 2008
Average rainfall (mm) 197 367.9 158.6 275
Rainfall reaching the pond (m3) 492 920 391.5 687.5
Annual evaporation (mm) 1000 1000 1000 1000
Annual evaporation lost form the pond (mm) 2500 2500 2500 2500
Leachate lost form the pond (m3) 43585 44476 64402 14500
Hours of pumping leachate (hr) 1353 1511 1841 524.5
Liquids lost form the pond (m3) 46085 46976 66902 17000
Leachate reaching the pond (m3) 49273 50274 68905 18112
Liquids reaching the pond (m3) 49765 51194 69296 18800
Liquids remained in the pond (m3) 3680 4218 2394 1800

43
Percentage of filling pond of liquids (%) 61% 70% 40% 30%
5.2 Leachate water quality:
Leachate has elevated concentrations of numerous organic and inorganic pollutants. Landfill
accept waste since about 15 year, so waste in landfill may be undergoing several phases of
decomposition at once (Jabber and Nasser, 2007), and leachate varies in its chemical
composition.
5.2.1 Leachate characterization:
The physical and chemical parameters leachate samples collected from Deir AL Balah landfill
are shown in Table (5.2).
It can be seen that the color of the leachate varies from dark green olive to very dark green,
whereas the turbidity remains dark in all years of investigation, the smell was also the same as
well.
It is also appears that pH values range between 8-8.7 indicating the alkaline reaction of the
leachate. The EC range was 29.9-55.4 ms. indication high salinity.
The values of BOD and COD were extremely high in all years of measurements, indicating high
pollution. The value of total organic carbon (TOC) range between 1.5-10 g/l indicating low
fraction of TOC. However, the dissolved organic carbon ranges between 2.3-9.5 g/l indicating
high fraction of DOC. Furthermore, the value of DOC may indicate high fraction of low
molecule weight of organic compounds. These data are due to possible biodegradation of the
solid waste.
44
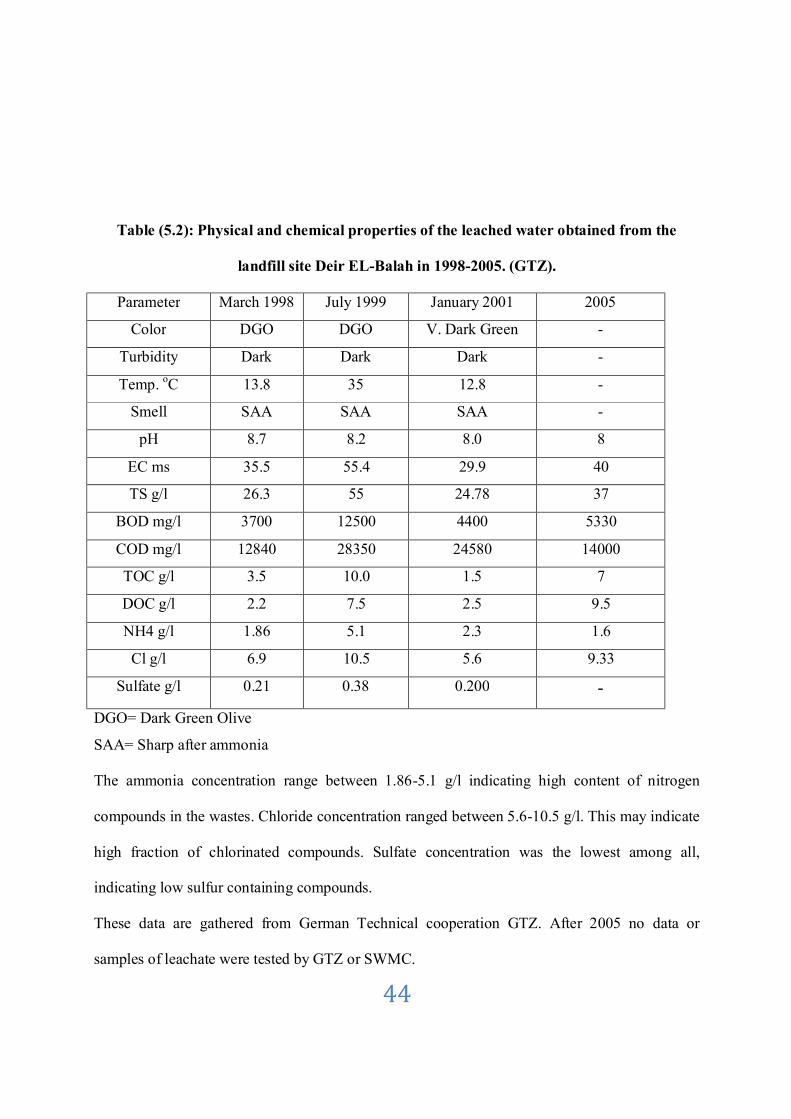
Table (5.2): Physical and chemical properties of the leached water obtained from the
landfill site Deir EL-Balah in 1998-2005. (GTZ).
Parameter March 1998 July 1999 January 2001 2005
Color DGO DGO V. Dark Green -
Turbidity Dark Dark Dark -
Temp. oC 13.8 35 12.8 -
Smell SAA SAA SAA -
pH 8.7 8.2 8.0 8
EC ms 35.5 55.4 29.9 40
TS g/l 26.3 55 24.78 37
BOD mg/l 3700 12500 4400 5330
COD mg/l 12840 28350 24580 14000
TOC g/l 3.5 10.0 1.5 7
DOC g/l 2.2 7.5 2.5 9.5
NH4 g/l 1.86 5.1 2.3 1.6
Cl g/l 6.9 10.5 5.6 9.33
Sulfate g/l 0.21 0.38 0.200 -
DGO= Dark Green Olive SAA= Sharp after ammonia
The ammonia concentration range between 1.86-5.1 g/l indicating high content of nitrogen
compounds in the wastes. Chloride concentration ranged between 5.6-10.5 g/l. This may indicate
high fraction of chlorinated compounds. Sulfate concentration was the lowest among all,
indicating low sulfur containing compounds.
These data are gathered from German Technical cooperation GTZ. After 2005 no data or
samples of leachate were tested by GTZ or SWMC.

45
Furthermore we present year variations of NH4, COD and BOD values in Figure (5.1) shown
below.
Figure (5.1): BOD, COD and NH4 dynamics during 4 years of study.
It is obvious that the most interesting point is that the increase of the values from year 1998 and
reached the maximum in year 1999 then decreased again. The explanation of these results is that
biodegradation increased in year 1999 to the highest level. Then probably some toxic materials
were produced by the bacterial degradation. These toxic materials may stand behind the
reduction of the values in the following year.
These results are in accord with the data in Table (5.3) which contains nearly high fraction of
heavy metals which may have some toxicity to aerobic bacteria.
Figure (5.1) shows the variation of Ammonia concentration with time which increase on 1999
and start to decrease in years 2001, 2005, due to the anaerobic conditions which in return
contributed to nitrate reduction towards ammonia gas phase .These concentrations are very toxic
to the microorganisms that responsible for the anaerobic processes.
The variation of BOD and COD concentration with time have the same behavior which increase
on 1999 comparative to 1998 value then decrease on 2001 ,and then start to increase on 2005 .
0
5000
10000
15000
20000
25000
30000
35000
1996 1998 2000 2002 2004 2006
conc
mg/
L
Years
BOD mg/lCOD mg/lNH3 g/l
46
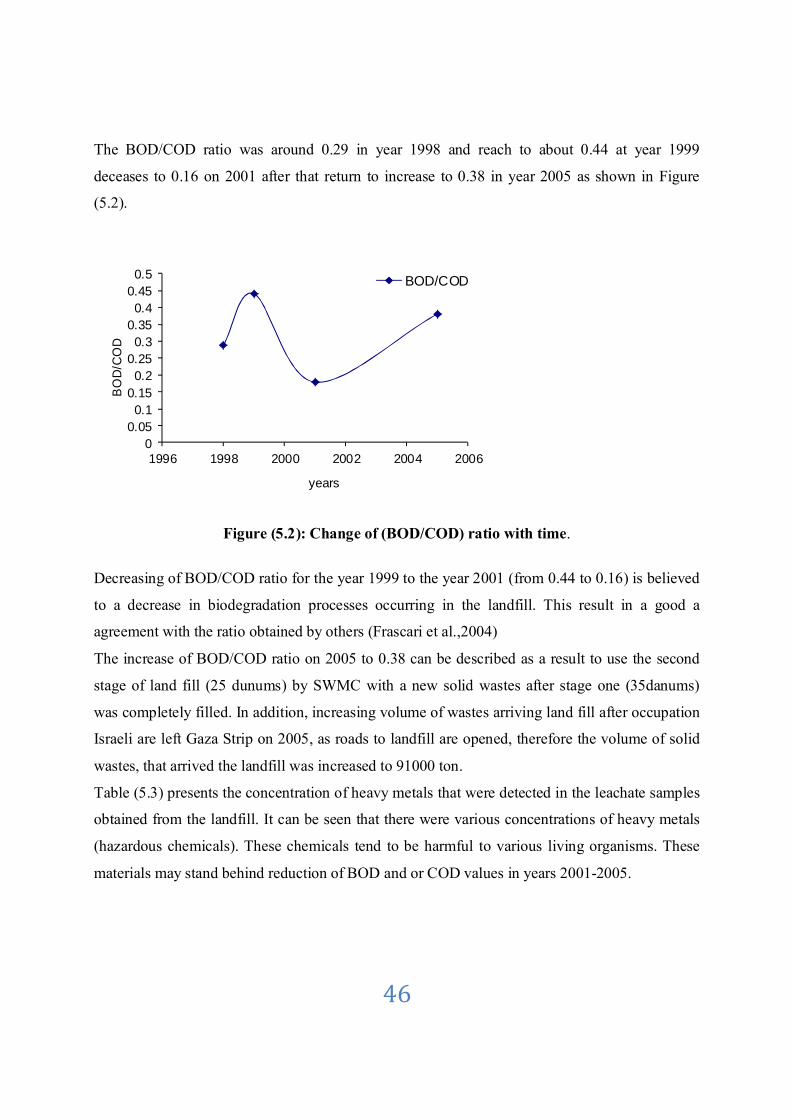
The BOD/COD ratio was around 0.29 in year 1998 and reach to about 0.44 at year 1999
deceases to 0.16 on 2001 after that return to increase to 0.38 in year 2005 as shown in Figure
(5.2).
Figure (5.2): Change of (BOD/COD) ratio with time.
Decreasing of BOD/COD ratio for the year 1999 to the year 2001 (from 0.44 to 0.16) is believed
to a decrease in biodegradation processes occurring in the landfill. This result in a good a
agreement with the ratio obtained by others (Frascari et al.,2004)
The increase of BOD/COD ratio on 2005 to 0.38 can be described as a result to use the second
stage of land fill (25 dunums) by SWMC with a new solid wastes after stage one (35danums)
was completely filled. In addition, increasing volume of wastes arriving land fill after occupation
Israeli are left Gaza Strip on 2005, as roads to landfill are opened, therefore the volume of solid
wastes, that arrived the landfill was increased to 91000 ton.
Table (5.3) presents the concentration of heavy metals that were detected in the leachate samples
obtained from the landfill. It can be seen that there were various concentrations of heavy metals
(hazardous chemicals). These chemicals tend to be harmful to various living organisms. These
materials may stand behind reduction of BOD and or COD values in years 2001-2005.
00.050.1
0.150.2
0.250.3
0.350.4
0.450.5
1996 1998 2000 2002 2004 2006
BO
D/C
OD
years
BOD/COD

47
Table (5.3): Heavy metal concentration of leached water obtained from the landfill site
deir EL-Balah in during from 2001 and 2005 (GTZ)
2005 2001 Heavy metals mg/l
>0.1 0.004 Pb
0.08 >0.10 Cd
0.5 <0.01 Cu
1.5 1 Ni 1.1 <0.01 Zn
0.006 <0.01 Hg
1.5 <0.01 Bo
2 <0.01 Cr
5.2.2 Effects on ground water quality: The chemical properties of water samples collected from the selected wells of ground water in
Deer Al-Balah are shown in Table (5.4).
It can be seen that pH values of all the sampling wells around Deir AL Balah land fill were in the
normal of the range 7.28-7.6 whereas, the EC values were high in all monitoring wells and have
a range between 1475-3600 ms/cm. The EC values were above WHO suggested levels (900
ms/cm) at all samples. However, according to (Abu-Rukah and AL-kofahi, 2001), EC value
within 1000 ms/cm is suitable for irrigation purpose. We are not sure that high values of EC is
due to presence of the landfill. All values of EC in middle area of Gaza strip are high.
Furthermore, C1 values around Deir AL Balah landfill have averages between 322 and 900 mg/l
(Table 5.4) .The highest values measured were in wells W2, W5, W6 and W7 are not acceptable
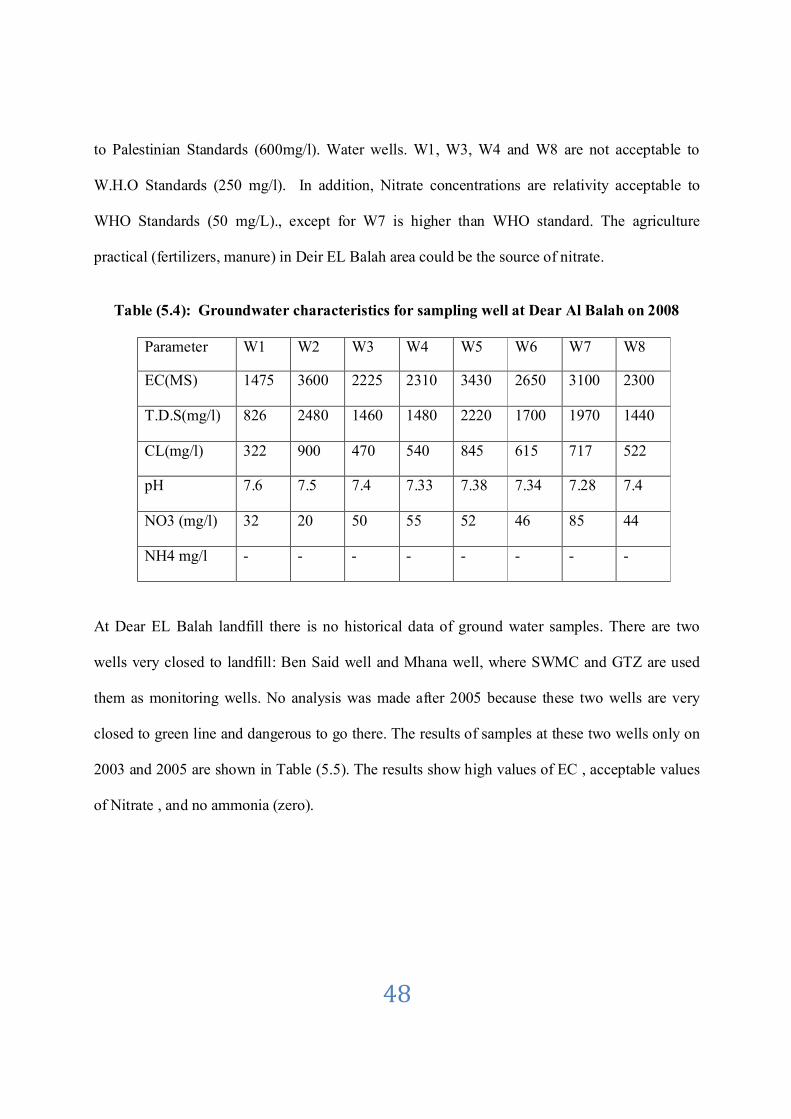
48
to Palestinian Standards (600mg/l). Water wells. W1, W3, W4 and W8 are not acceptable to
W.H.O Standards (250 mg/l). In addition, Nitrate concentrations are relativity acceptable to
WHO Standards (50 mg/L)., except for W7 is higher than WHO standard. The agriculture
practical (fertilizers, manure) in Deir EL Balah area could be the source of nitrate.
Table (5.4): Groundwater characteristics for sampling well at Dear Al Balah on 2008
W8 W7 W6 W5 W4 W3 W2 W1 Parameter
2300 3100 2650 3430 2310 2225 3600 1475 EC(MS)
1440 1970 1700 2220 1480 1460 2480 826 T.D.S(mg/l)
522 717 615 845 540 470 900 322 CL(mg/l)
7.4 7.28 7.34 7.38 7.33 7.4 7.5 7.6 pH
44 85 46 52 55 50 20 32 NO3 (mg/l)
- - - - - - - - NH4 mg/l
At Dear EL Balah landfill there is no historical data of ground water samples. There are two
wells very closed to landfill: Ben Said well and Mhana well, where SWMC and GTZ are used
them as monitoring wells. No analysis was made after 2005 because these two wells are very
closed to green line and dangerous to go there. The results of samples at these two wells only on
2003 and 2005 are shown in Table (5.5). The results show high values of EC , acceptable values
of Nitrate , and no ammonia (zero).

49
Table (5.5): Physicochemical properties of water sample of monitoring well on 2003-2005
(SWMC)
It can be seen that parameters have high values except pH, NO3, Ca, Mg, and K. This suggests
that those parameters lay in the acceptable level, but infact we have to consider the other
parameters together. Accordingly, it would be difficult to lay them in the acceptable level of
WHO standards.
Mhana well Ben Said well Test
2005 2003 2005 2003
5 >5 5 >5 Color
5 >5 5 >5 Turgidity
7.89 7.55 7.8 7.53 Ph
4110 4310 3320 3370 EC
2548 2672 2058 2089 TDS
52.73 43.8 38.91 40.5 NO3 ppm
1006 488.3 821.7 772.6 Cl (ppm)
410 462,8 275.8 357 SO4 (ppm)
259.2 252 252 238 Alkalinity (ppm)
470.1 469 311.8 378 Hardness (ppm)
69.83 71.1 53.67 55.4 Ca (ppm)
71.73 70.6 43.1 57.9 Mg (ppm)
4.6 4.6 3.7 3.2 K (ppm)
760 800 567 620 Na (ppm)

50
Table (5.6): properties of drinking water samples in Deir El Balah area
(Ministry of Health, 2009)
Code no 2008 2009
pH EC NO3 Cl pH EC NO3 Cl S/69 7.5 2310 41.8 523.5 7.96حسن سعید
2300 48 516
k-21 6.88 2370 107.6 502 7.72 1628 99 279
k-20 7.11 2370 124.3 537.8 7.1 2310 124 423
j-32 7.48 5230 184.6 1276 6.92 5390 186 1255 j/146 7.63 3003 66.9 697.7 8.1 3120 33.4 702
EL-Sahel 4 6.51 1547 68.3 272.5 7.76 1323 142 208
EL-Sahel5 6.49 1566 64.6 265.3 7.81 1544 39.5 179.3
EL-Sahel3 6.93 2560 68.9 595.2 7.64 1992 72.8 358.6
EL-Sahel 2 7.5 4990 114.6 1269 7.55 3840 136.5 839
s/82 6.48 1014 46.7 186.4 7.84 1069 46.9 211.7
s/80 7.49 3180 50.1 747.2 7.45 2980 36.21 717
s/71 7.46 2570 43.9 556.5 7.67 2600 33.42 589.9
H-95 7.11 3760 117 860.5 7.25 3530 77.83 860.5
H-60 7.21 5030 195 1190 7.25 4940 114.8 1262
G/49 7.19 4680 130 1113 7.63 4550 64.8 1112
G/45 7.37 4860 171.7 1155 7.55 4800 101 1183
G/30 7.34 4160 191.2 1133 7.69 4006 41.6 1004
F/208 7.32 2610 62.3 567.9 8.74 2290 65.8 473.3الزھراء
F/203 7.21 2140 55 467.5 8.42 1735 38.6 351.4
S-72 7.45 4240 40 1036 7.32 4399 55.1 1076
51
In addition, some properties of drinking water samples collected from 20 wells around the
landfill and analyzed in year 2008 and 2009 are shown in Table (5.6).
5.3 Social Data
Influence of landfill in the human health and social parameters are discussed below.
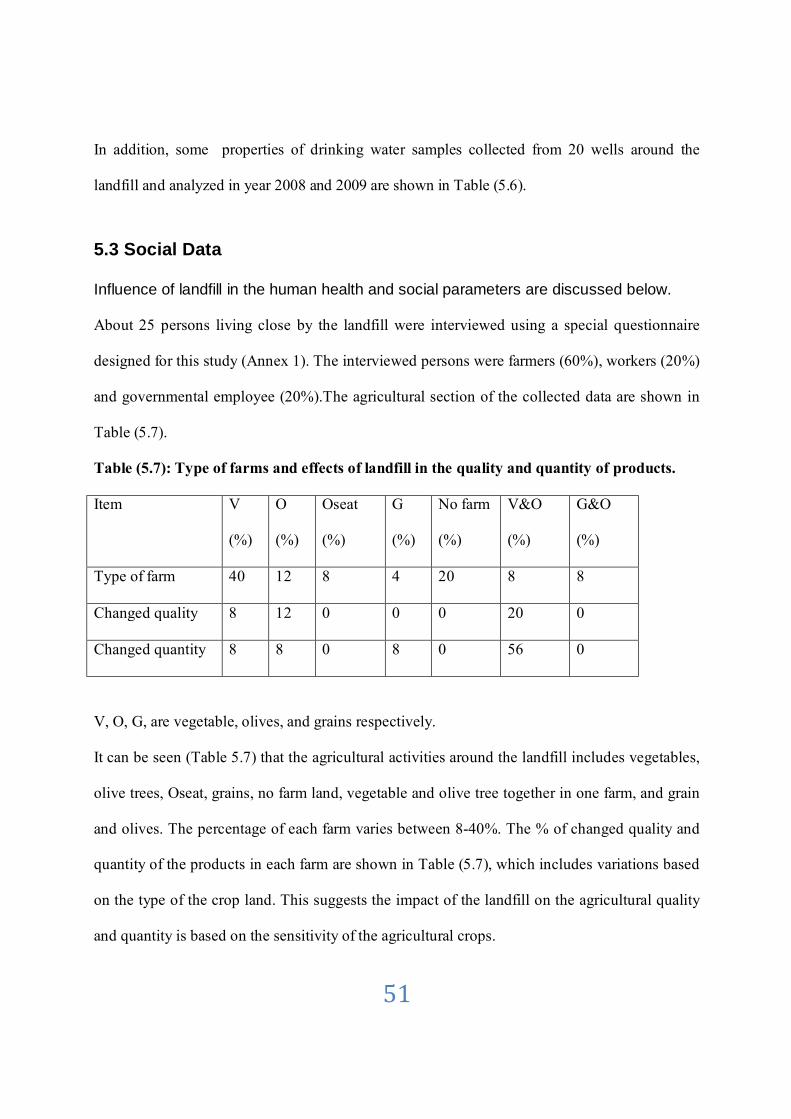
About 25 persons living close by the landfill were interviewed using a special questionnaire
designed for this study (Annex 1). The interviewed persons were farmers (60%), workers (20%)
and governmental employee (20%).The agricultural section of the collected data are shown in
Table (5.7).
Table (5.7): Type of farms and effects of landfill in the quality and quantity of products.
Item V
(%)
O
(%)
Oseat
(%)
G
(%)
No farm
(%)
V&O
(%)
G&O
(%)
Type of farm 40 12 8 4 20 8 8
Changed quality 8 12 0 0 0 20 0
Changed quantity 8 8 0 8 0 56 0
V, O, G, are vegetable, olives, and grains respectively.
It can be seen (Table 5.7) that the agricultural activities around the landfill includes vegetables,
olive trees, Oseat, grains, no farm land, vegetable and olive tree together in one farm, and grain
and olives. The percentage of each farm varies between 8-40%. The % of changed quality and
quantity of the products in each farm are shown in Table (5.7), which includes variations based
on the type of the crop land. This suggests the impact of the landfill on the agricultural quality
and quantity is based on the sensitivity of the agricultural crops.

52
Furthermore, it has been noticed that 25% of olive farms showed fungal spots on leaves, fruits
and/or all the plant parts. An interesting notice is that 75% of the olive farms were free from any
fungal spots.
In addition, the collected data indicated that the soil texture of the farm lands are sand, clay and
sand clay with the following percentage 60%, 24% and 8% respectively. Furthermore, 56% of
those farms used organic manure and only 12% from the whole farms used chemical fertilizers.
In addition, only 64% of the farms applied pesticides to protect the crops from pest infestation.
It was also noticed that water wells around the landfill area have different depths. Water wells
with 50 meters depth and/or below represent 32% from the wells whereas those with depths
above 50 meters are 48%. It was also appeared that 48% of the wells belong to private sectors
whereas 16% of the wells belong to governmental organization. Only 12% of the wells were
used for rain collection.
Only, 40% of the interviewed population noticed the arrival of rain water from the landfill to
their farms, whereas 54% of the interviewed population noticed a flooding of leachate pools
occurred several times.
About 12% of the interviewed population indicated that they bread sheep and 40% of them
indicated that they bread poultry. They also indicated that milk production from their sheep
reduced by 12% and poultry production reduced by 12% as consequences of the landfill.
Furthermore, 44% of the interviewed population indicated that their home lay within the distance
of 700 m away from the landfill whereas 56% of the homes lay within 1500 m away from the
landfill. About 80% of those population indicated that they have unpleasant smell during day and
night, whereas 20% of them reported that they have the unpleasant smell not usually.
53
In addition, 80% of the interviewed population noticed insects (flies, mosquitoes) and only 8% of
them noticed some rodents. Furthermore, 56% of the interviewed population indicated that they
noticed a municipal body spraying insecticides.
Regarding solid waste collection, 40% of the interviewed population noticed waste scattered
along the way. This suggests improper waste transport.
In addition about 100% of the interviewed population noticed a fire within the landfill, 60% of
the population indicated that the Israeli Shells stand behind thos fire. Furthermore, 60% of them
indicated that fire put under control within 7-10 days.
About 36% of the interviewed population indicated that only 25% of the landfill area is covered
by sand or plastic cover.
In addition 20% the interviewed population indicated that farmers used leachate as a fertilizer,
whereas 60% of the interviewed population indicated that an overflow of the leachate cover
Wadi Al salqa and some farms.

54
CHAPTER (6)
CONCLUSIONS AND RECOMMENDATIONS
6.1 Conclusions:
Landfill is an option of waste disposal method. It based on dumping the controlled wastes into
dump or engineered landfill. The appropriate design and operation aspects such as Deir El Balah
landfill is well considered to protect the aquifer from contaminated by leachate. The design
includes double lined landfills, but its large part is covered. Covers are placed only when the
stage of landfill is filled where bed of soil is placed and grassy. In winter time the landfill may be
covered with a plastic layer to protect it from rainwater.
Leachate is collected in two ponds 60 m³ in volume and with area 2500 m² by a series of
collection pipes. The leachate can be recycled or pumped to landfill. Water depth in study area is
not too deep, about 50-70 m, so water will become partially filtered through the sandy soil or
loamy soil. Permeability for soils below the landfill is low due to clay lenses through sand
aquifer , so contamination is less, In addition the down steam side as the lateral flow direction of
Gaza Strip is from east to west dilution may took place.
On other hand leachate is flood to agricultures area and Wadi El Salqa on winter where many of
trees are died. Also Israeli rockets and pumps damaged recirculation pipes and fence of landfill,
therefore large amount of leachate runs through slopes of land fill to agriculture area.
Due to calculation of SWMC the percentage of fully Leachate ponds is reduced from 70℅ on
2005 to 30℅ on 2008 because increasing height of wastes that effect on rainfall that percolated,
in addition runoff due to slop of wastes, also plastic cover in parts of landfill.
55
Chemical parameters of Leachate such as NH4, BOD, COD indicates reducing of organic wastes
or presence of toxic materials that prevent action of microorganisms. Therefore landfill is in a
final age and must be closed. On other hand the mentioned chemical parameters may indicate
that using the second phase after first phase is filled.
Chloride and electrical parameters at sampling wells are high, we are not sure that elevation is
due to landfill.
In 2003 and 2005 the data showed the same elevation values of Cl and EC. On other side values
of EC and CL on 2008 and 2009 at all wells in middle area of Gaza Strip are high.
Nitrate concentration values are relatively acceptable to WHO standards except for well 7.
The interviewed persons were farmers (60%), workers (20%) and governmental employee
(20%). The agricultural activities around the landfill includes vegetables, olive trees, Oseat,
grains, no farm land, vegetable and olive tree together in one farm, and grain and olives. The
percentage of each farm varies between 8-40%.
An interesting notice is that 75% of the olive farms were free from any fungal spots.
The collected data indicated that the soil texture of the farm lands are sand, clay and sand clay
with the following percentage 60%, 24% and 8% respectively. Only small percentage ( 12% ) of
farms used chemical fertilizers . In contrast high percentage ( 64% ) of farms applied pesticides
to protect the crops from pest infestation , and 80% of the interviewed population noticed
insects (flies, mosquitoes) and only 8% of them noticed some rodents. Furthermore, 56% of the
interviewed population noticed a municipal body spraying insecticides.
The study indicated that milk and poultry production reduced by 12% as consequences of the
landfill in the study area. In addition about 100% of the interviewed population noticed a fire
within the landfill, 60% of the population indicated that the Israeli Shells stand behind that fire.
56
6.2 Recommendations:
1- In Gaza Strip, the three official waste disposal sites are approaching their capacity and
plans have not been made for future disposal of waste. In the absence of such plans and
their subsequent implementation, it is likely that existing sites will continue to be used in
ways that are unsustainable from both public health and environmental perspectives.
2- In Gaza Strip the close proximity of official waste disposal sites to major population
centers and important groundwater resources suggests that site rehabilitation should be
carefully considered and applied.
3- Recycling and composting initiatives are to be supported and encouraged so this would
increase the life span of the sanitary landfill.
4- Clear plan should be developed to start as soon as possible for the rehabilitation of the
Dear El Balah Landfill and to the scattered dumpsites all over Gaza Strip.
5- Upgrading of the existing disposal sites to controlled disposal sites taking into
consideration that rehabilitation works and after-care measures will be designed and
undertaken to allow desired future uses and which address risks to public health and
environment in ways that are locally appropriate in technical, financial and social terms.
6- Analysis of groundwater samples for wells adjacent to landfills must be done
continuously.
7- Landfill must be covered especially in winter.
8- Development and implementation of public awareness programs to the peoples near and
around the landfill areas.

57
REFERENCES
• Abed, A.M. and Wishahi, S. (1999): Geology of Palestine, First edition, Palestinian
Hydrological Group, Jerusalem, Palestine.
• Abu El Qompoz, Y. (2003): Solid Wastes Management in Gaza Strip, Problems and
Solution., PhD teethes, IHE, Netherland.
• Abu Rukah Y., and Al-Kofahi, O. (2001). : The assessment of the effect of landfill
leachate on ground water quality, a case study El-Elkader landfill North Jordan. Journal of
Arid Environments, 49: 615 – 630.
• AL-Jamal, Kh. and Al –Yaqubi, A. (2002): Prospects for Water Desalination in Gaza.
• As alibi, T. (2009): Evaluating the Impact of Landfill Leachate on Groundwater Aquifer
in Gaza Strip using Modeling Approach, Msc. Thesis, Islamic University, Gaza.
• Bagchi, A. (1994): Design, Construction, and Monitoring of Landfills .Second Edition
Awiley- Interscience Publication John Wiley and Sons, Inc, New York.
• Crawford, J. and Smith P. (1985): landfill Technology, John F Crawford & Paul G Smith
1985.
• Eden, C. (1994): Combined Landfill Gas and Leachate Extraction System, UKPS Ltd,
England, UK.
• EQA (2004): Strengthening the Palestinian Environmental Action Programme (Phase
IV), Gaza.
58
• Frascari, D. ,Bronzini,F. ,Giordano,G., Tedioli,G. and Noccntini,M., (2004) : Long-term
characterization, lagoon treatment and migration potential of landfill leachate : a case
study in an active Italian landfill , Chemosphere, 54: 335-343.
• GTZ (1996): Solid waste management-Gaza middle area-Landfill design.
• Hughes, K. Christy A. and Heimlich J. (2008): Landfill Types and Liner Systems. Ohio
State University Extension Fact Sheet CDFS-138-05. Available online:
http://ohioline.osu.edu.
• Jaber, A. and Nasser, A. (2007) : Assessment of solid waste dumpsites in Gaza Strip.
Gaza Strip. JICA & EQA.
• Jarnous, K. and Magdalawi, M. (2006): Annual report of year 2006 Solid Waste
Management Council for Kanunes and Dear AL Balah. Gaza Strip.
• Jarnous, K. and Magdalawi, M. (2007): Annual report of year 2007. Soild Waste
Management Council for Kanunes and Dear AL Balah. Gaza Strip.
• Jarnous, K. and Magdalawi, M. (2008): Annual report of year 2008. Soild Waste
Management Council for Kanunes and Dear AL Balah. Gaza Strip.
• Jouda, A.(1984) :Solid Waste Management in Developing Countries Msc thesis, London
University, UK.
• Kavanangh, P. (1984): Design Sanitary Landfill Mobilization Construction (1984),
Washington, D.C.20314.
• Ministry of Environmental Affairs (Mena), (1998): Palestinian Environmental Strategy.
Palestinian National Authority, Ministry Environmental of Affair, Gaza.
• Ministry of Planning and International Cooperation, (1997): Analysis Report on the
current status of solid waste management in Palestine.
59
• Ministry of Transport and Communications GMS, (2005): Data Bank from Gaza
Meteorological Station, Gaza. Palestine.
• Monroe, M. (2002): Landfill Leachate Treatment. www.vsep.com/.
• MOPIC, (1994): Gaza Environmental Profile, Part I. Environmental Planning Directorate
(EPD), Ministry of Planning and International Co-operation (MOPIC), Gaza, Palestine.
• MOPIC, (1996): Gaza Environmental Profile, Part 2. Environmental Planning Directorate
(EPD), Ministry of Planning and International Co-operation (MOPIC), Gaza, Palestine.
• Mortaja, R. (1998): An Investigation into Geotechnical Aspects of Landfilling (case
study of Gaza). MSc thesis, Loughbouroh University, UK.
• Ministry of Transport and Communication GMS, (2005): Data Bank from Gaza
Meteorological Station, Gaza, Palestine.
• Ministry of Health, Gaza, Palestine.
• O’Leary, p. and Walsh, p. (1997): Introduction to Solid Waste Landfill, Solid and
Hazardous Waste Education Center, University of Wisconsin-Madison USA.
• Palestinian Meteorological Office (PMO) (2008) Software data, Gaza, Palestine.
• Palestinian Standard for Drinking Water (PS) (2000). Gaza, Palestine.
• Palestinian water Authority (PWA), (1999): Hydrochemical study for Gaza Strip,
Unpublished report, Gaza, Palestine.
• Schwartz, J. (1982): Water Resources in Judea, Samaria and Gaza Strip, American
Enterprise Institute, Washington & London.
• Shaat, A. and Juda, A. (1995): Emergency Action Plan for Solid Wastes at Gaza Strip.
• Shomar B.H, G. Mu ller, A. Yahya (2005) : Geochemical Features of top soils in the Gaza Strip: Natural occurrence and anthropogenic inputs. Environmental Research 98,
60
372- 382. • U.S .National Academy of Sciences, (1999): Water for the Future. The West Bank and
Gaza Strip, Israel and Jordan. Washington, D.C. Environmental Management Journal
54:131_142.
• United Nations Environmental program (UNEP) (2003): Desk Study on the
Environmental in the Occupied Palestine Territories.
• Wells, A. and Crooks, M.(1987) : Solid Waste Landfill Design Manual, Olympia,
Publication No. 87-13,Washington,USA
• WHO, (2003) Guidelines for Drinking Water Quality. Volume 2, Second Edition, Health
Criteria and Other Supporting Information (WHO/EOS/2003.I), World Health
Organization, Geneva.

61
Annex 1: Questionnaire
1 - What are your profession (A) Employee (b) Farmer(c) worker 2 What are the types of crops that you grow? (A) Vegetables, (b) Olive (c) Oseat (D) grain (h) No farm (g) Vegetables and Olive (f) grain and olive 3 - What are the crops, which noted the change in quality? (A) vegetables, (b) Olive (c) Oseat (D) grain (h) No farm (g) does not note the change 4 – What are the crops, which noted the change of agricultural production (A) vegetables, (b) Olive (c) Oseat (D) grain (h) No farm (g) does not note the change 5 - What are you noticed on the olive trees (A) spots on olive leaves and flowers (b) spots on the fruits of the olive (C) fungi and patches on the leaves of olive (d) All of the above (h) None of the above 6 - What kind of soil: (A) sand (b) clay (C) sandy clay (d) Do not know 7 - What kind of fertilizers used in agriculture (A) Organic (b) chemical (c) none (d) No farm 8 - Do you use pesticides (A) Yes (b)no (c) sometimes (d) I'm not a farmer 9 – What are the depth of agricultural wells (approximately) (A) 50 meters (b) 60 meters ( c) 70 meters (d) Do not know 10 - What are the sources of irrigation in the region (A) private wells (b) wells-governmental organizations (c) rain water (d) Do not know 11 - Have you noticed the arrival of rain water from the landfill to agricultural land (A) Yes, in winter (b) sometimes (c) does not note 12 - How many times a flood was occurred by leachate pools to agricultural land (A) much (b) three times (c) 4 times (d) does not notice it 13 - What are livestock that you rear (A) sheep (b) Poultry (c) birds (d) None of the 14 - Is livestock production was affected (A) Affected by less production of milk (b) affected poultry (C) not affected by something (d) does not raise Pets 15 - Are you or any other do examination of water (A) I do it (b) others (c) None of the 16 - What are the animals and birds, which suffer from the presence in the region (A) stray dogs (b) birds of prey (c) dogs and birds (d) None of the above 17 - Do you are bother of presence birds of prey (A) Yes, they hurt the poultry farmers (B) Yes, because they tear nylon used in agriculture (C) does not hurt because I am relatively free of the landfill 18 - Do you suffer from the following diseases?

62
(A) Shortness of breath (b) the psychological impact because of the smell and mosquitoes And (c) itching of the skin (d), vomiting and diarrhea in infants (H) does not suffer from these diseases 19 - How far is your place of residence for the landfill? (A) about 300 meters (b) 500 m (C) about 700 meters (d) about 1500 meters 20 - What are the times that you feel the presence of an unpleasant smell (A) on day (b) at night (C) always (d) sometimes? 21 - What are the insects and rodents that suffer from deployment (A) rats (b) flies (c) mosquito (D) flies and mosquitoes (e) All of (f) is not something which stated 22 - How many times used the municipal body spray (insects) (A) only once (b) twice (C) more than that (D) Do not know 23 - What do you think of the performance of vehicles transporting waste to landfill (A) waste scattered along the way (b) to assume the appropriate load (C) None of the d) Do not know 24 - Have you noticed a fire within the landfill (A) Yes, this happened several times (b) Yes, and this year twice (c) did not occur 25 - What is the cause of afire in the landfill in your mind (A) Israeli shells (b) waste residues are burned in containers (C) Do not know (d) All of the above 26 - When the fire under control within the landfill (A) quickly (b) After a week (C) more than ten days (d) Do not know 27 - What is the area of the landfill that is covered (A) 0.25 Area (b) 0.5Area (C)all space (d) Do not know 28 - When do covering a waste in the landfill (A) sometimes in winter (b) only when the full part of the landfill (c) Do not know 29 - Have you seen people use leachate as a fertilizer (A) Yes, a few farmers (b) I did not see (c) do not know because I live away from leachate pools 30 - Where is leachate overflowing (A) to Wadi al Salqa (b) to some agricultural land (c) I don’t know 31 - Have you noticed random dumps (A) Yes (b) no (C) a little (d) Do not Know
63
Arabic version of the questionnaire
ما ھي المھنة - 1 (ج) عامل (أ) موظف (ب) مزارع
ما ھي أنواع المحاصیل الزراعیة التي تزرع : 2 (أ)خضروات (ب) زیتون (ج) لوزیات
(د) حبوب (ح) ال أزرع (ز) خضروات وزیتون (و) حبوب وزیتون ما ھي المحاصیل الزراعیة التي الحظت فیھا تغیر في نوعیتھا : - 3
(أ)خضروات (ب) زیتون (ج) لوزیات (د) حبوب (ح) ال أزرع (ز) ال أالحظ تغیر
في أي من المحاصیل الزراعیة تغیر في االنتاج الزراعي - 4 (أ)خضروات (ب) زیتون (ج) لوزیات تغیر (د) حبوب (ح) ال أزرع (ز) ال أالحظ
ماذا الحظت على أشجار الزیتون - 5 (أ) بقع على أوراق وأزھار الزیتون (ب) بقع على ثمار الزیتون
(ج) فطریات وبقع على أوراق الزیتون (د) جمیع ما سبق (ح) ال شيء مما سبق ما نوع التربة الزراعیة : - 6 طینیة (ج) طینیة رملیة (د) ال أعرف (أ)رملیة (ب) ما نوع األسمده المستعملة في الزراعة - 7 (أ)عضویة (ب) كیماویة (ج) ال شيء (د) ال أزرع ھل تستعمل المبیدات الزراعیة - 8 (أ)نعم (ب) ال (ج) أحیانا (د) لست مزارعًا كم عمق اآلبار الزراعیة - 9 متر تقریبا (د) ال أعرف 70متر تقریبا (ج) 60متر تقریبا (ب) 50(أ)
ما ھي مصادر الري في المنطقة - 10 (أ)أبار خاصة (ب) أبار حكومیة (ج) میاه األمطار (د) ال أعرف
مطار من جھة المكب إلى األراضي الزراعیةھل الحظت وصول میاه األ - 11 (أ) نعم في فصل الشتاء (ب) أحیانًا (ج) ال أالحظ
كم مرة حدث فیضان للعصارة من بركة تجمیع العصارة إلى األراضي الزراعیة - 12 مرات (د) ال أالحظ ذلك 4(ب) ثالث مرات (ج) (أ) كثیرا
ما ھي األحیاء التي تربیھا - 13 (أ)أغنام (ب) دواجن (ج) طیور (د) ال شيء مما ذكر
ھل تأثر اإلنتاج الحیواني - 14 (أ) تأثر حیث قل إنتاج الحلیب (ب) تأثرت تربیة الدواجن ألیفة(ج) لم یتأثر شيء (د) ال أربي حیوانات
ھل تقوم أنت أو أي جھة أخرى بفحص المیاه - 15 (أ) أنا أقوم بذلك (ب) جھات أخرى (ج) ال شيء مما ذكر
ما ھي الحیوانات والطیور التي تعاني من وجودھا في المنطقة - 16 (أ) كالب ضالة (ب) طیور جارحة (ج) ال شيء مما ذكر
تزعجك وجود الطیور الجارحة ھل - 17

64
(أ) نعم ألنھا تؤذي طیور المزارعین (ب) نعم ألنھا تمزق النایلون المستعمل في الزراعة (ج) ال تؤذي ألنني بعید نسبیًا عن المكب
ھل تعاني من األمراض اآلتیة : - 18 ة والبعوض (أ) ضیق في التنفس (ب) تأثیر نفسي بسبب الرائح (ج) حكة في الجلد ( د) قيء وإسھال عند األطفال الرضع (ح) ال أعاني من ھذه األمراض
كم یبعد مكان سكنك عن المكب : - 19 متر 500متر (ب) 300(أ) حوالي
متر 1500متر (د) حوالي 700(ج) حوالي ما ھي األوقات التي تشعر فیھا بوجود رائحة كریھة - 20
(أ) في النھار (ب) في اللیل (ج) دائمًا (د) أحیانًا
ما ھي الحشرات والقوارض التي تعاني من انتشارھا - 21 (أ) فئران (ب) ذباب (ج) بعوض
(د) ذباب وبعوض (ھـ) جمیع ما ذكر (و) ال شي مما ذكر كم مرة استعملت البلدیة جھاز الرش ( الحشرات ) - 22
(ب) مرتین (أ) مرة واحدة فقط (ج) أكثر من ذلك (د) ال أعرف
ما رأیك في أداء سیارات نقل النفایات إلى المكب - 23 (أ) تبعثر النفایات على طول الطریق (ب) تحمل حمولتھا المناسبة
(ج) ال شيء مما ذكر (د) ال أعرف ھل الحظت حدوث حریق في داخل المكب - 24
(أ) نعم حدث ذلك عدة مرات (ب) نعم وفي ھذا العام مرتین (ج) لم یحدث ما سبب الحریق في داخل المكب في رأیك - 25
(أ) القذائف اإلسرائیلیة (ب) بقایا نفایات محروقة في الحاویات (ج) ال أعرف (د) جمیع ما سبق
متى یتم السیطرة على الحریق داخل المكب - 26 بعد أسبوع (أ) بسرعة (ب)
(ج) أكثر من عشرة أیام (د) ال أعرف ما ھي مساحة المكب المغطاة تقریبًا - 27 المساحة 2\1المساحة (ب) 4\1(أ)
(ج) كل المساحة (د) الاعرف متى یتم تعطیھ النفایات في المكب - 28
في فصل الشتاء (ب) فقط عند امتالء جزء من المكب (ج) ال أعرف (أ) أحیانًا ھل شاھدت أناسًا یستعملون العصارة كسماد زراعي - 29
(أ) نعم قلیل من المزارعین (ب) لم أشاھد (ج) ال أعرف ألنني أسكن بعیدًا عن بركة العصارة أین تفیض العصارة - 30
(ج) ال أعراف ( أ) إلى وادي السلقا (ب ) إلى بعض األراضي الزراعیة ھل الحظت وجود مكبات عشوائیة - 31
(ب) ال ( أ) نعم (د) ال أعرف (ج) قلیًال
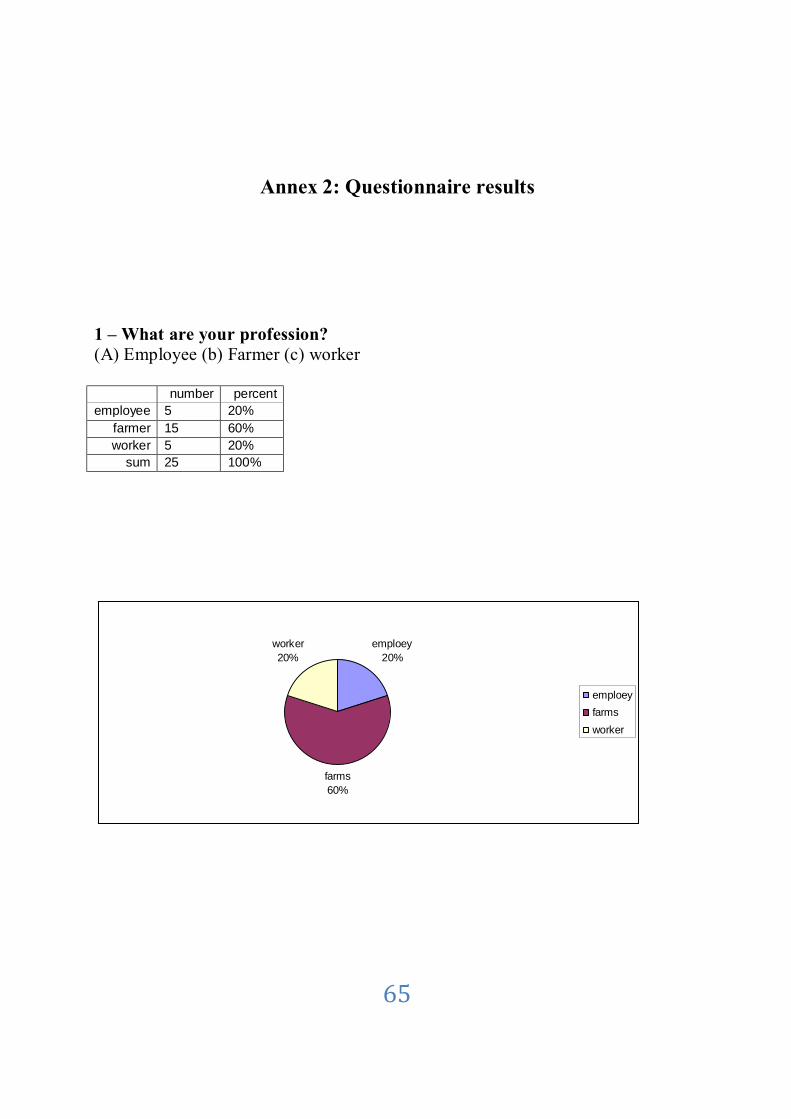
65
Annex 2: Questionnaire results
?professionWhat are your –1 (A) Employee (b) Farmer (c) worker
number percent
employee 5 20% farmer 15 60% worker 5 20%
sum 25 100%
emploey20%
farms60%
worker20%
emploeyfarmsworker
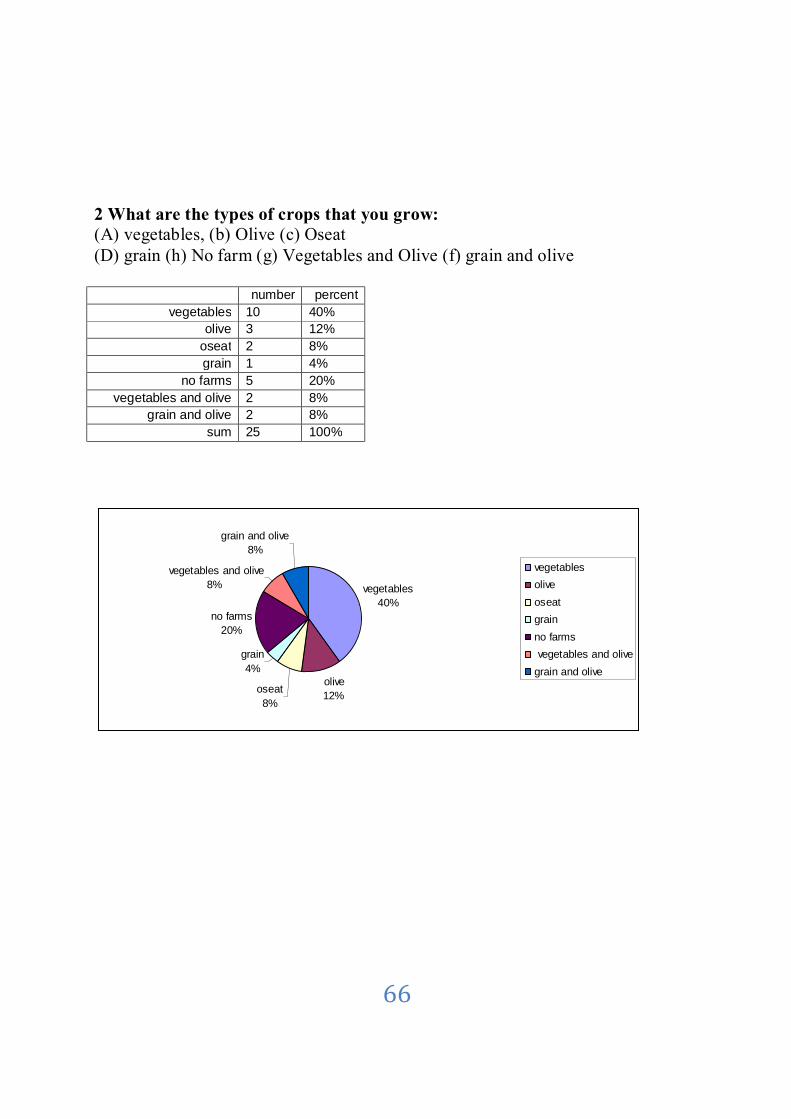
66
2 What are the types of crops that you grow: (A) vegetables, (b) Olive (c) Oseat (D) grain (h) No farm (g) Vegetables and Olive (f) grain and olive
number percent
vegetables 10 40% olive 3 12%
oseat 2 8% grain 1 4%
no farms 5 20% vegetables and olive 2 8%
grain and olive 2 8% sum 25 100%
vegetables40%
olive12%oseat
8%
grain4%
no farms20%
vegetables and olive8%
grain and olive8%
vegetablesoliveoseatgrainno farms vegetables and olivegrain and olive
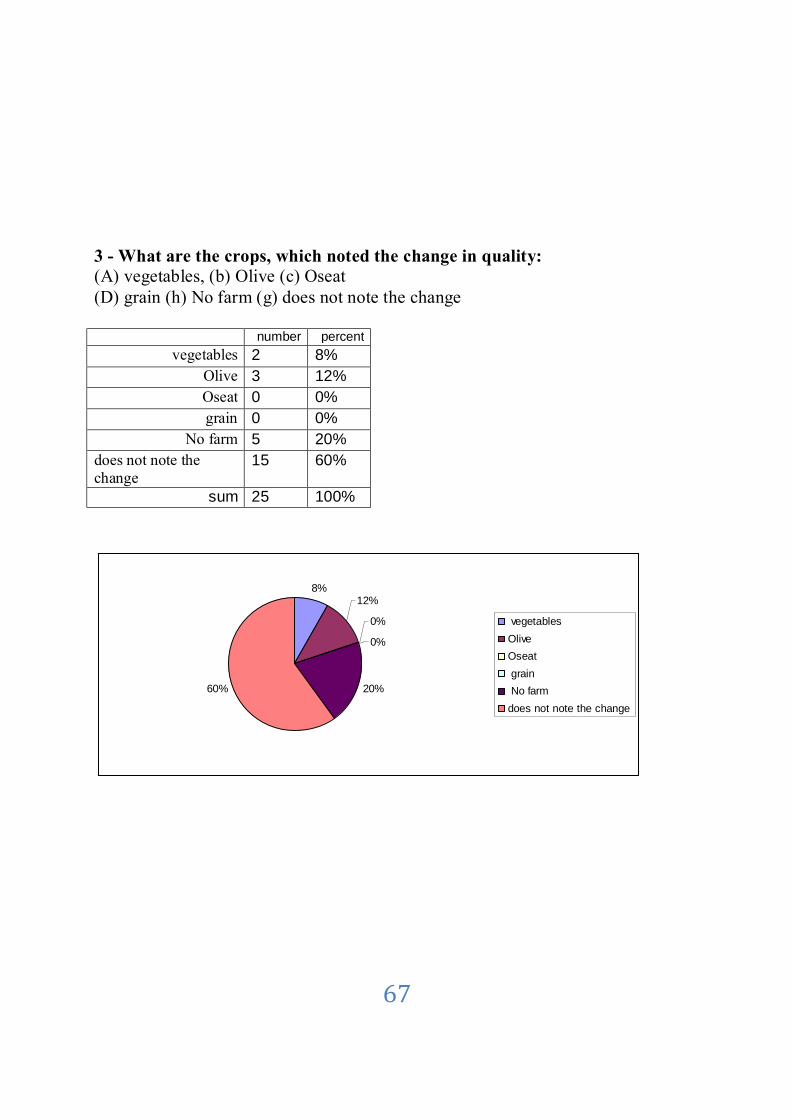
67
What are the crops, which noted the change in quality: -3 Oseat(A) vegetables, (b) Olive (c)
(D) grain (h) No farm (g) does not note the change
number percent vegetables 2 8%
Olive 3 12% Oseat 0 0% grain 0 0%
No farm 5 20% does not note the change
15 60%
sum 25 100%
8%12%
0%
0%
20%60%
vegetablesOliveOseat grain No farmdoes not note the change
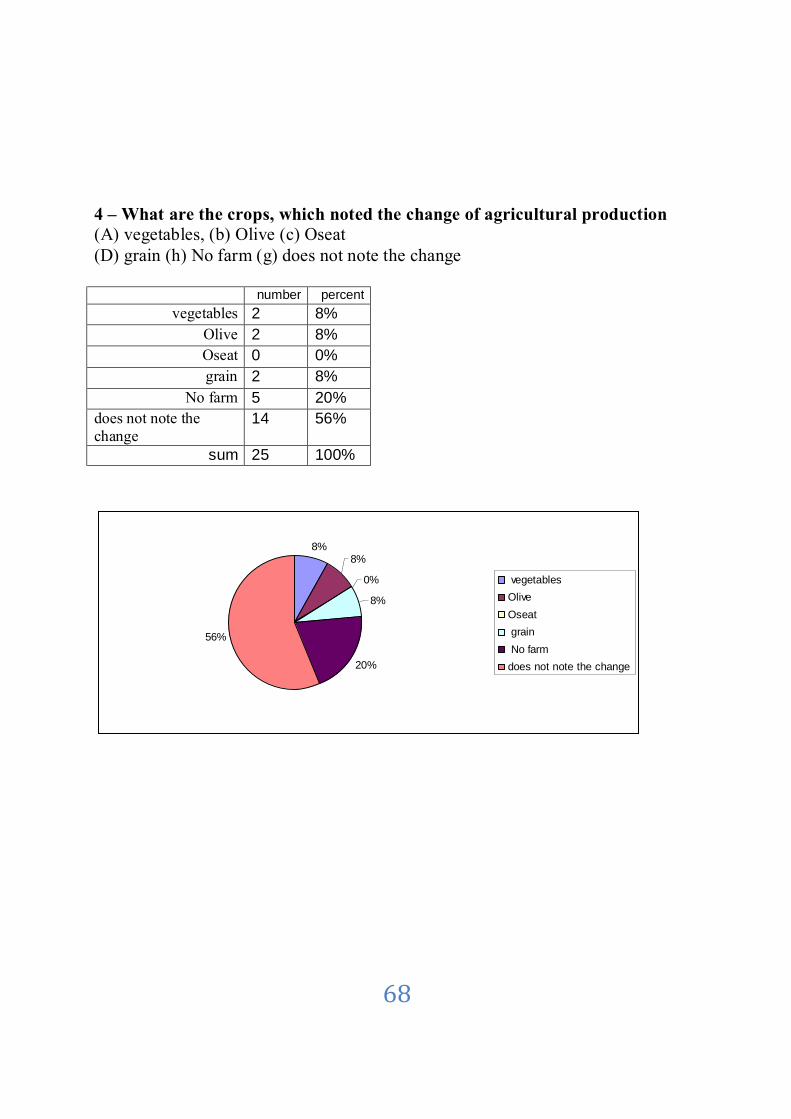
68
What are the crops, which noted the change of agricultural production –4 (A) vegetables, (b) Olive (c) Oseat (D) grain (h) No farm (g) does not note the change
number percent
vegetables 2 8% Olive 2 8% Oseat 0 0% grain 2 8%
No farm 5 20% does not note the change
14 56%
sum 25 100%
8%8%
0%
8%
20%
56%
vegetablesOliveOseat grain No farmdoes not note the change

69
What are you noticed on the olive trees -5 (A) spots on olive leaves and flowers (b) spots on the fruits of the olive
(h) None of the (C) fungi and patches on the leaves of olive (d) All of the above above
number percent spots on olive leaves and flowers 2 10%
spots on the fruits of the olive 1 5% fungi and patches on the leaves of
olive 1 5%
All of the above 1 5% None of the above 15 75%
Sum 25 100%
10%5%
5%
5%
75%
spots on olive leaves and flowers
spots on the fruits of the olive
fungi and patches on the leaves ofolive All of the above
None of the above
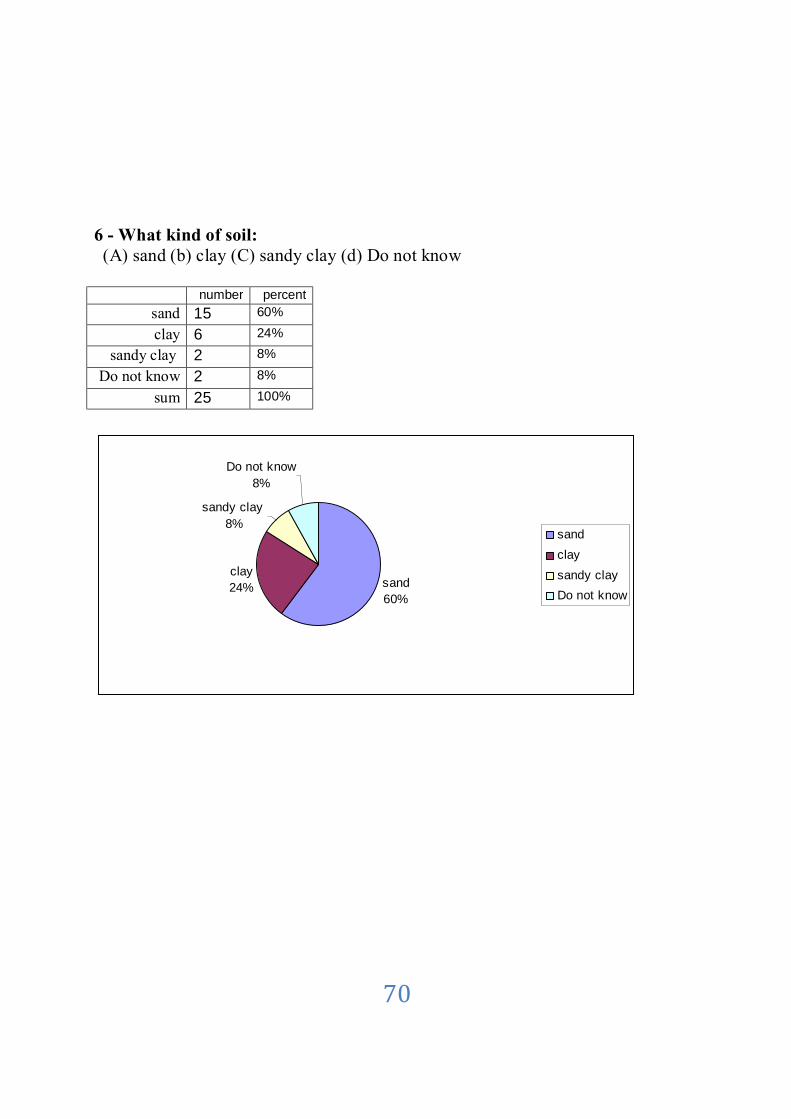
70
6 - What kind of soil: (A) sand (b) clay (C) sandy clay (d) Do not know
number percent
sand 15 60%
clay 6 24%
sandy clay 2 8%
Do not know 2 8%
sum 25 100%
sand60%
clay24%
sandy clay 8%
Do not know8%
sandclaysandy clay Do not know

71
7 - What kind of fertilizers used in agriculture (A) Organic (b) chemical (c) none (d) No farm
number percent
Organic 14 56%
chemical 3 12%
none 3 12%
No farm 5 20%
Sum 25 100%
Membership 56%
chemical 12%
none 12%
No farm20%
Membership chemical none No farm
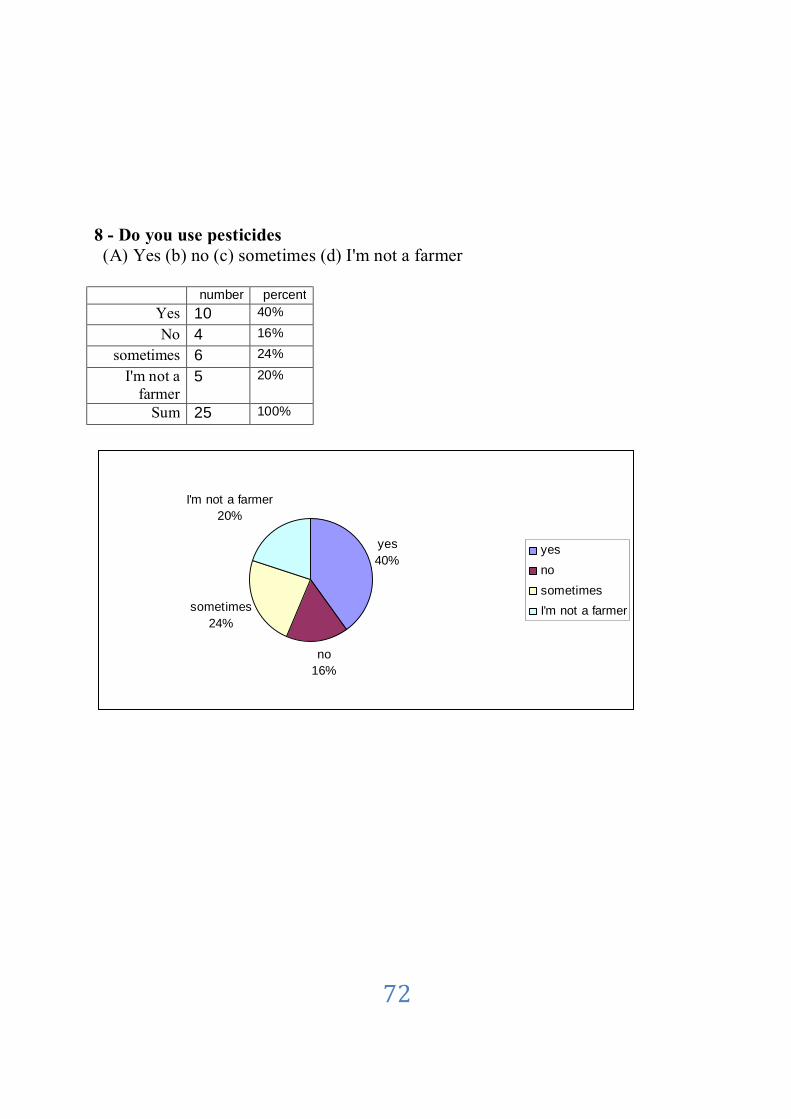
72
8 - Do you use pesticides (A) Yes (b) no (c) sometimes (d) I'm not a farmer
number percent
Yes 10 40%
No 4 16%
sometimes 6 24%
I'm not a farmer
5 20%
Sum 25 100%
yes40%
no16%
sometimes24%
I'm not a farmer20%
yesnosometimesI'm not a farmer

73
9 – What is the depth of agricultural wells (approximately?)
(A) 50 meters (b) 60 meters (c) 70 meters (d) Do not know
50 meters 32%
60 meters 28%
70 meters 20%
Do not know 20%
50 meters 60 meters 70 meters Do not know
number percent 50 meters 8 32%
60 meters 7 28%
70 meters 5 20%
Do not know 5 20%
sum 25 100%

74
10 - What are the sources of irrigation in the region (A) private wells (b) wells-governmental organizations (c) rain water (d) Do not know
number percent
private wells 12 48%
wells-governmental organizations
4 16%
rain water 3 12%
Do not know 6 24%
sum 25 100%
private wells 48%
wells-governmental organizations
16%
rain water 12%
Do not know 24%
private wells
wells-governmentalorganizations rain water
Do not know

75
11 - Have you noticed the arrival of rain water from the landfill to agricultural land (A) Yes, in winter (b) sometimes (c) does not note
number percent
Yes, in winter 6 24%
sometimes 4 16%
does not note
15 60%
sum 25 100%
Yes, in winter 24%
sometimes 16%
does not note 60%
Yes, in winter sometimes does not note
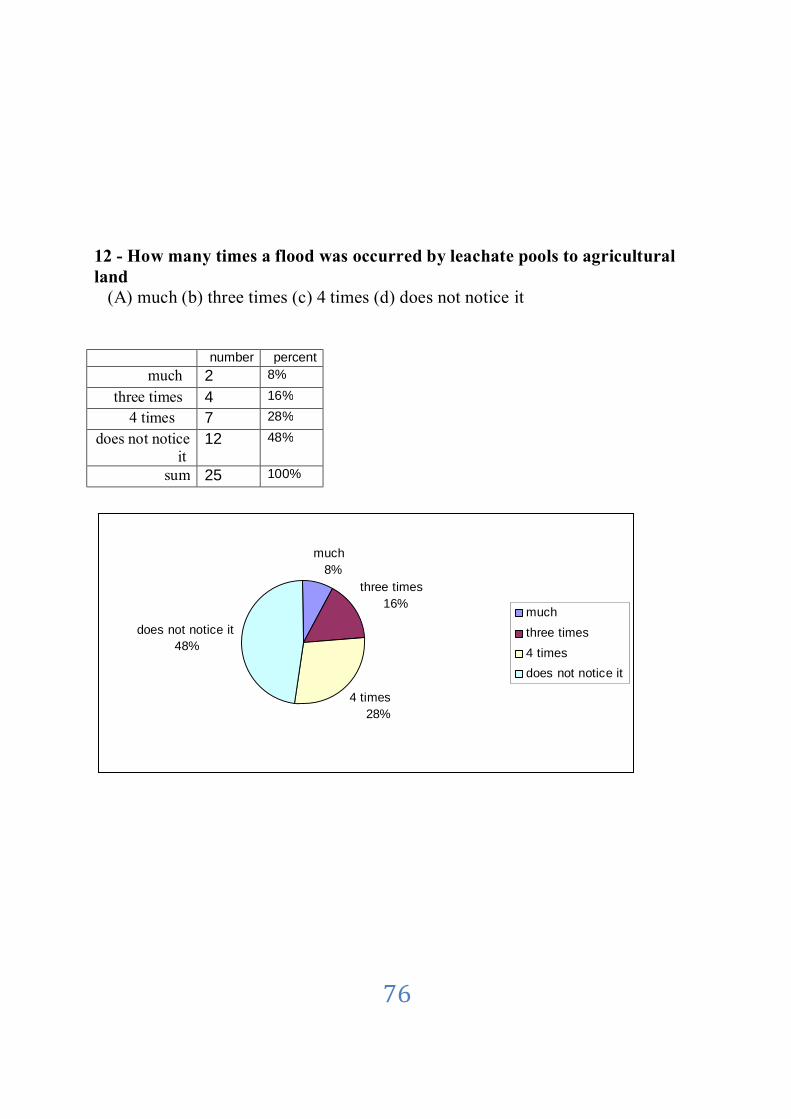
76
12 - How many times a flood was occurred by leachate pools to agricultural land (A) much (b) three times (c) 4 times (d) does not notice it
number percent much 2 8%
three times 4 16%
4 times 7 28%
does not notice it
12 48%
sum 25 100%
much 8%
three times 16%
4 times 28%
does not notice it 48%
much three times 4 times does not notice it

77
13 - What are livestock that you rear (A) sheep (b) Poultry (c) birds (d) None of the
number percent
sheep 3 12%
Poultry 5 20%
birds 5 20%
None of the 12 48%
sum 25 100%
sheep 12%
Poultry 20%
birds 20%
None of the 48%
sheep Poultry birds None of the
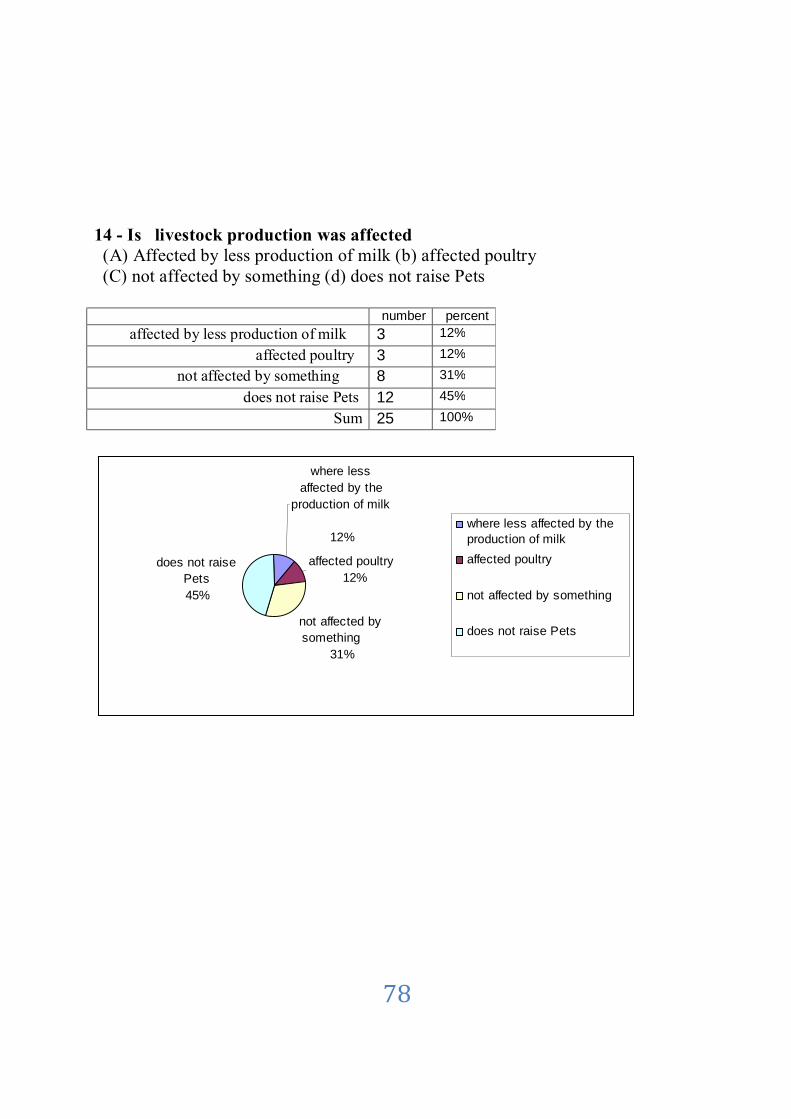
78
14 - Is livestock production was affected (A) Affected by less production of milk (b) affected poultry (C) not affected by something (d) does not raise Pets
number percent
affected by less production of milk 3 12%
affected poultry 3 12%
not affected by something 8 31%
does not raise Pets 12 45%
Sum 25 100%
where less
affected by the production of milk
12%
affected poultry 12%
not affected by something
31%
does not raise Pets 45%
where less affected by theproduction of milk affected poultry
not affected by something
does not raise Pets

79
15 - Are you or any other do examination of water (A) I do it (b) others (c) None of the
number percent
I do it 0 0%
Others 0 0%
None of the
25 100%
Sum 25 100%
I do so 0%
others 0%
None of the 100%
I do so others None of the

80
16 - What are the animals and birds, which suffer from the presence in the region (A) stray dogs (b) birds of prey (c) dogs and birds (d) None of the above
stray dogs 28%
birds of prey 28%
dogs and brids8%
None of the 36% stray dogs
birds of prey dogs and bridsNone of the
number percent stray dogs 7 28%
birds of prey
7 28%
dogs and brides
2 8%
None of the above
9 36%
sum 25 100%

81
17 - Do you are bothering of presence birds of prey (A) Yes, they hurt the poultry farmers (B) Yes, because they tear nylon used in agriculture (C) does not hurt because I am relatively free of the landfill
number percent
Yes, they hurt the poultry farmers 6 24%
Yes, because they tear nylon used in agriculture 5 20%
does not hurt because I am relatively free of the landfill
14 56%
sum 25 100%
Yes, they hurt the poultry farmers
24%
Yes, because they tear nylon
used in agriculture
20%
does not hurt because I am
relatively free of the landfill
56%
Yes, they hurt the poultryfarmers Yes, because they tearnylon used in agriculture does not hurt because I amrelatively free of the landfill

82
18 - Do you suffer from the following diseases: (A) shortness of breath (b) the psychological impact because of the smell and mosquitoes and (c) itching of the skin (d), vomiting and diarrhea in infants (H) does not suffer from these diseases
number percent
shortness of breath 3 12%
the psychological impact because of the smell and mosquitoes
5 20%
itching of the skin 4 16%
vomiting and diarrhea in infants 4 16%
does not suffer from these diseases 9 36%
sum 25 100%
shortness of breath
12%
the psychological impact because of the smell and
mosquitoes 20%
itching of the skin 16%
vomiting and diarrhea in infants
16%
does not suffer from these diseases
36%
shortness of breath
the psychological impactbecause of the smell andmosquitoes itching of the skin
vomiting and diarrhea ininfants
does not suffer from thesediseases

83
19 - How far is your place of residence for the landfill: (A) about 300 meters (b) 500 m (C) about 700 meters (d) about 1500 meters
number percent
about 300 meters 3 12%
500 m 3 12%
about 700 meters 5 20%
about 1500 meters
14 56%
sum 25 100%
about 300 meters
12%
500 m 12%
about 700 meters 20%
about 1500 meters
56%
about 300 meters 500 m about 700 meters about 1500 meters
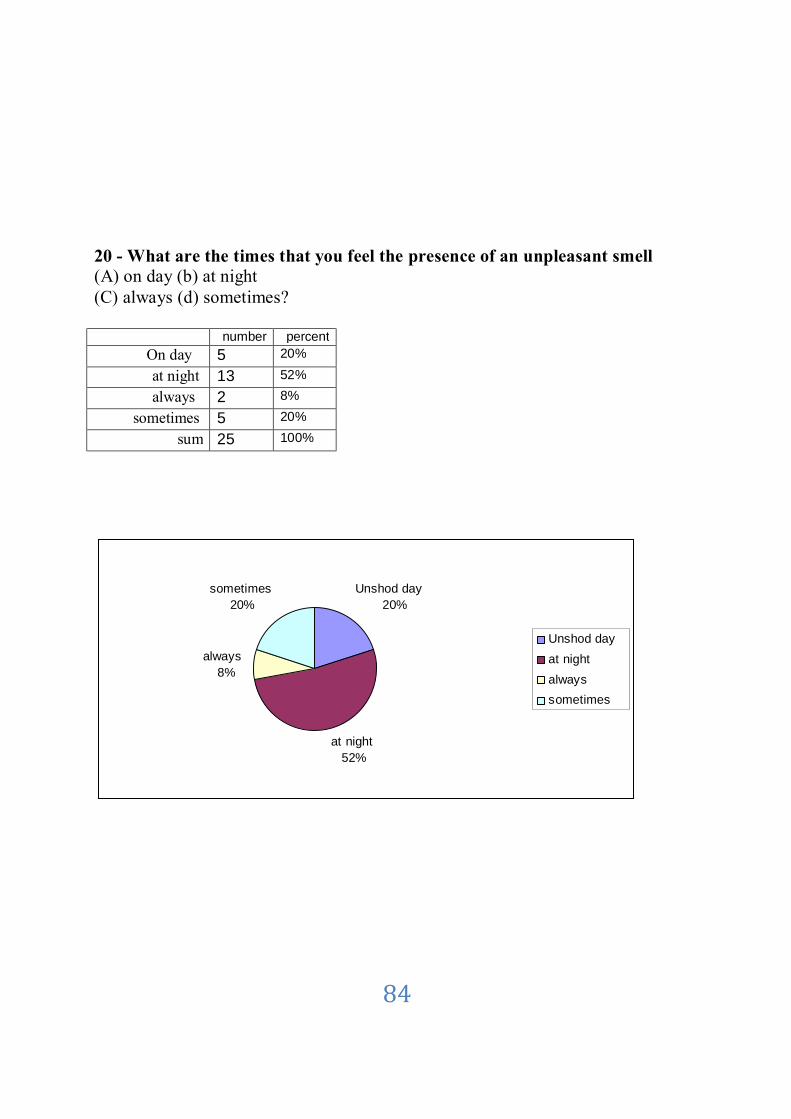
84
20 - What are the times that you feel the presence of an unpleasant smell (A) on day (b) at night (C) always (d) sometimes?
number percent
On day 5 20%
at night 13 52%
always 2 8%
sometimes 5 20%
sum 25 100%
Unshod day 20%
at night 52%
always 8%
sometimes 20%
Unshod day at night always sometimes

85
21 - What are the insects and rodents that suffer from deployment (A) rats (b) flies (c) mosquito (D) flies and mosquitoes (e) All of (f) is not something which stated
number percent Rats 2 8%
flies 9 36%
mosquito 6 24%
flies and mosquitoes 3 12%
All of 2 8%
is not something which stated
3 12%
sum 25 100%
mice 8%
flies 36%
mosquito 24%
flies and mosquitoes
12%
All of 8%
is not something which stated
12%
mice
flies
mosquito
flies and mosquitoes
All of
is not something whichstated

86
22 - How many times used the municipal body spray (insects) (A) only once (b) twice (C) more than that (D) Do not know
Number percent only once 8 30%
twice 2 7%
more than that
0 19%
Do not know 12 44%
sum 25 100%
only once and
30%
twice 7%
more than that 19%
Do not know44%
only once and twice more than that Do not know
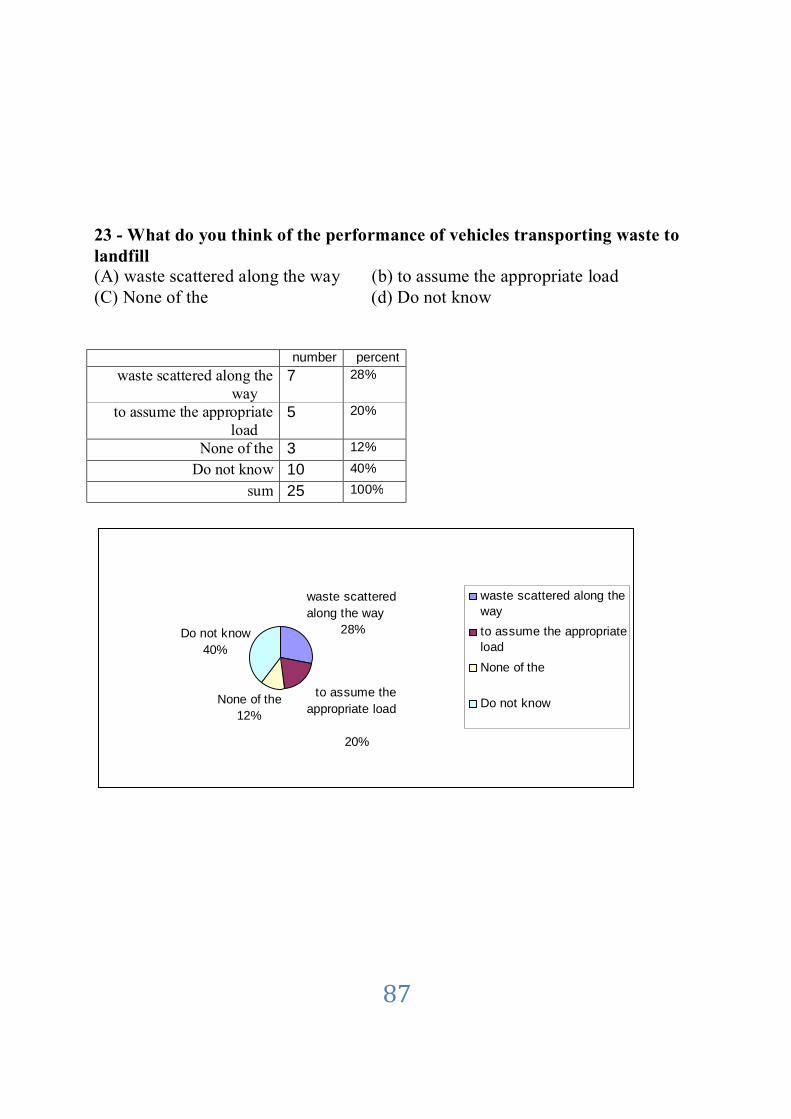
87
What do you think of the performance of vehicles transporting waste to -23 landfill (A) waste scattered along the way (b) to assume the appropriate load (C) None of the (d) Do not know
number percent waste scattered along the
way 7 28%
to assume the appropriate load
5 20%
None of the 3 12%
Do not know 10 40%
sum 25 100%
waste scattered along the way
28%
to assume the appropriate load
20%
None of the12%
Do not know40%
waste scattered along theway to assume the appropriateload None of the
Do not know

88
Have you noticed a fire within the landfill -24 (A) Yes, this happened several times (b) Yes, and this year twice
(c) Did not occur number percent
Yes, this happened several times
10 40%
Yes, and this year twice 15 60%
did not occur 0 0%
Sum 25 100%
Yes, this happened several
times 40%
Yes, and this year twice
60%
did not occur0%
Yes, this happened severaltimes Yes, and this year twice
did not occur

89
What is the cause of afire in the landfill in your mind -25 (A) Israeli shells (b) waste residues are burned in containers
the above(C) Do not know (d) All of number percent
Israeli shells 15 60%
waste residues are burned in containers
5 20%
Do not know 5 20%
All of the above 0 0%
sum 25 100%
Israeli shells
60%
waste residues are burned in containers
20%
Do not know 20%
All of the above0%
Israeli shells
waste residues are burned incontainers Do not know
All of the above
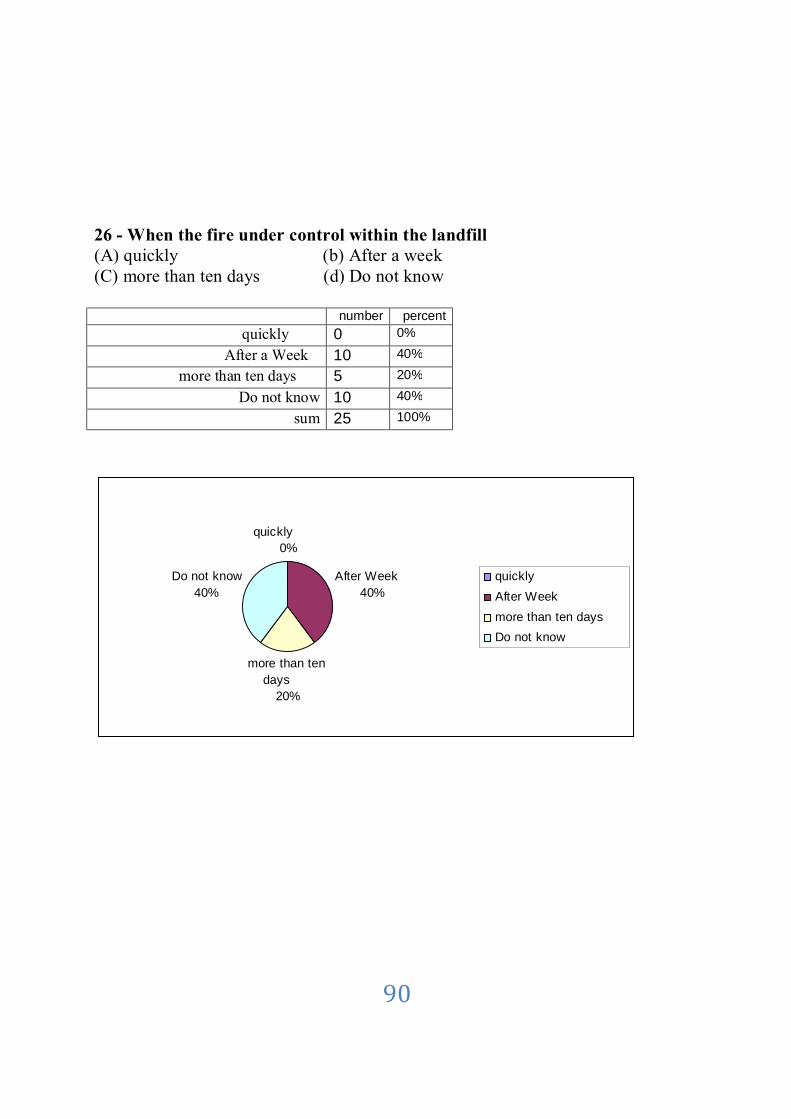
90
When the fire under control within the landfill -26 (A) quickly (b) After a week (C) more than ten days (d) Do not know
number percent
quickly 0 0%
After a Week 10 40%
more than ten days 5 20%
Do not know 10 40%
sum 25 100%
quickly 0%
After Week 40%
more than ten days
20%
Do not know40%
quickly After Week more than ten days Do not know

91
27 - What is the area of the landfill that is covered (A) 0.25 Area (b) 0.5Area (C) all space (d) Do not know
number percent
0.25 Area 9 36%
0.5Area 0 0%
all space 0 0%
Do not know 16 64%
sum 25 100%
0.25 Area
36%
0.5Area 0%
all space 0%
Do not know64%
0.25 Area 0.5Area all space Do not know
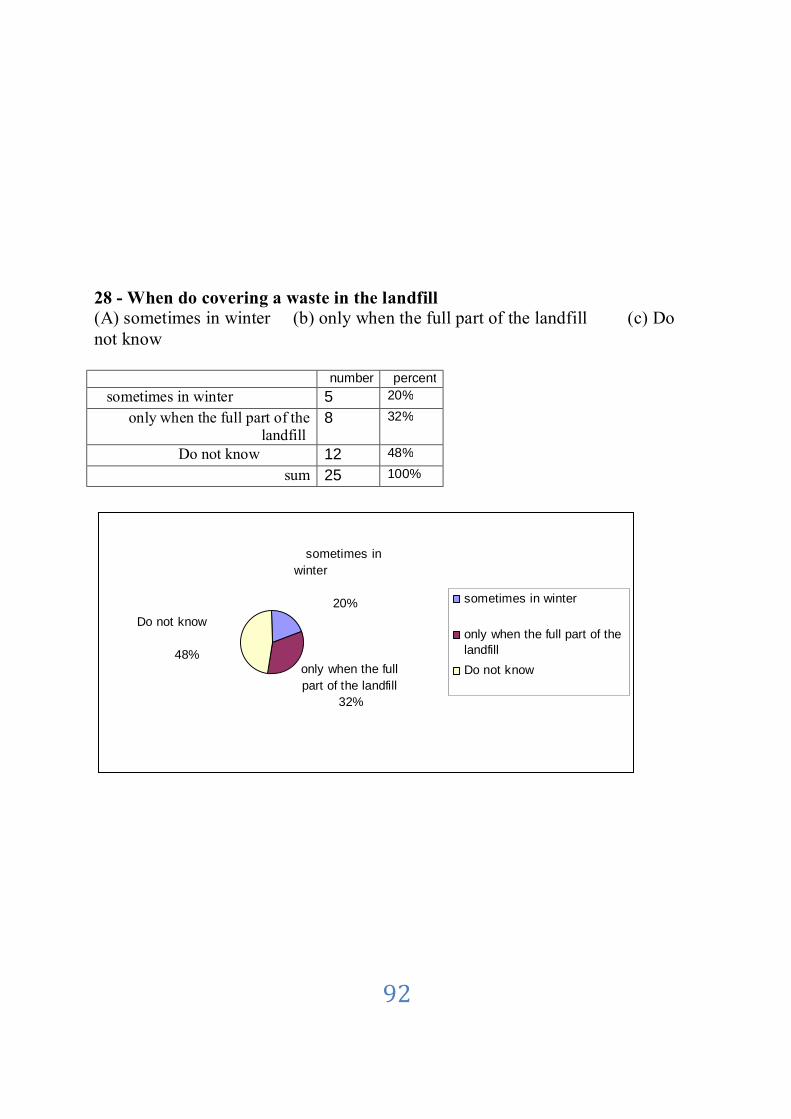
92
When do covering a waste in the landfill -28 (A) sometimes in winter (b) only when the full part of the landfill (c) Do not know
number percent
sometimes in winter 5 20%
only when the full part of the landfill
8 32%
Do not know 12 48%
sum 25 100%
sometimes in winter
20%
only when the full part of the landfill
32%
Do not know 48%
sometimes in winter
only when the full part of thelandfill Do not know

93
Have you seen people use leachate as a fertilizer -29 (A) Yes, a few farmers (b) I did not see (c) do not know because I live away from leachate ponds
number percent Yes, a few farmers 5 20%
I did not see 5 20%
do not know because I live away from leachate ponds 15 60%
sum 25 100%
Yes, a few farmers
20%
I did not see 20%
do not know because I live away from the pool Squeezer
60%
Yes, a few farmers
I did not see
do not know because I liveaway from the pool Squeezer

94
Where are leachate overflowing -30 (b) to some agricultural land (c) I don’t know (A) to Wadi al Salqa
number percent to Wadi al Salqa 10 40%
to some agricultural land
5 20%
I don’t know 10 40%
sum 25 100%
to Wadi al 40%
to some agricultural land
20%
norms 40% to Wadi al
to some agricultural land norms
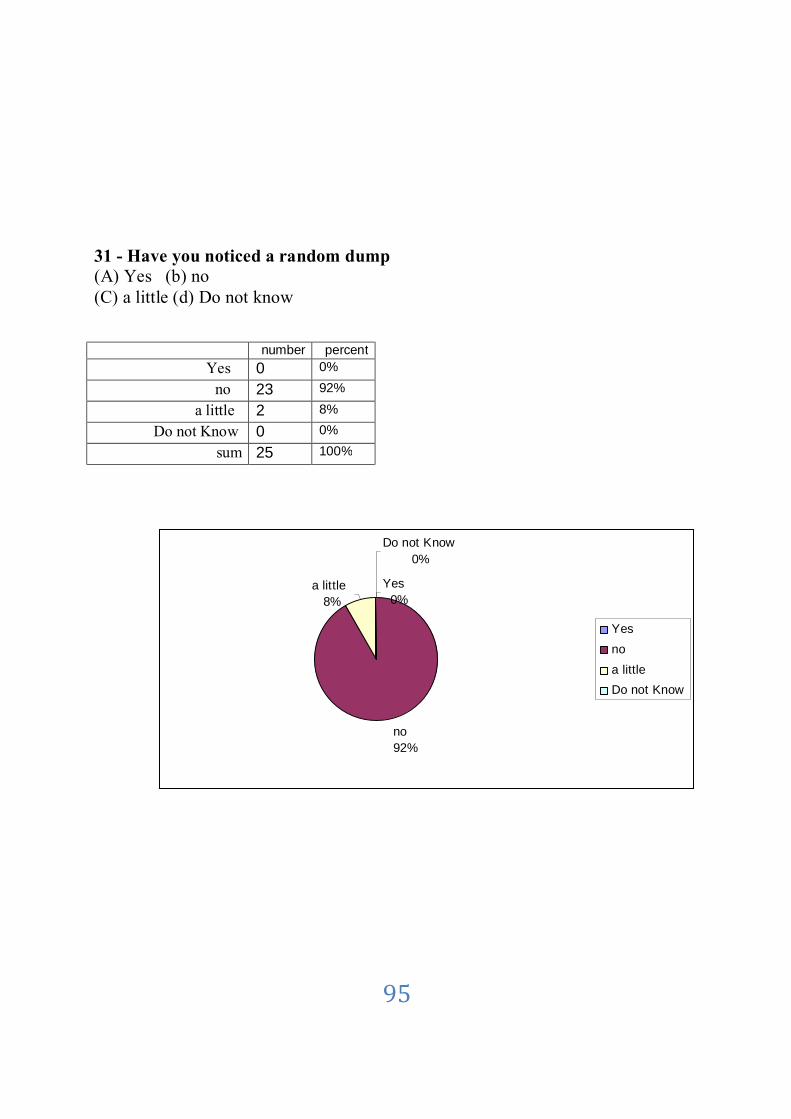
95
Have you noticed a random dump -31 (A) Yes (b) no (C) a little (d) Do not know
number percent Yes 0 0%
no 23 92%
a little 2 8%
Do not Know 0 0%
sum 25 100%
Yes 0%
no 92%
a little 8%
Do not Know 0%
Yes no a little Do not Know

Annex 3 some photos of the studied area.
Photo (1) Fire and Smoke in the Landfill area.
Photo (2) fire and Smoke in the Landfill area.
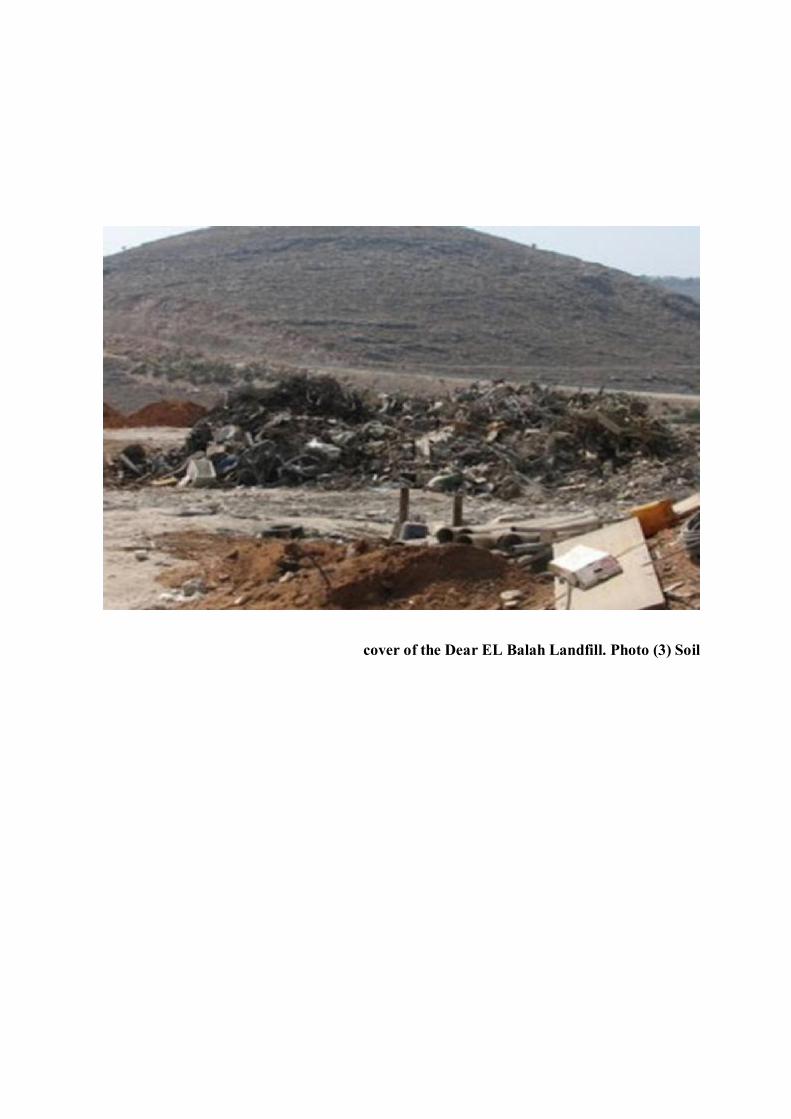
Photo (3) Soil cover of the Dear EL Balah Landfill.
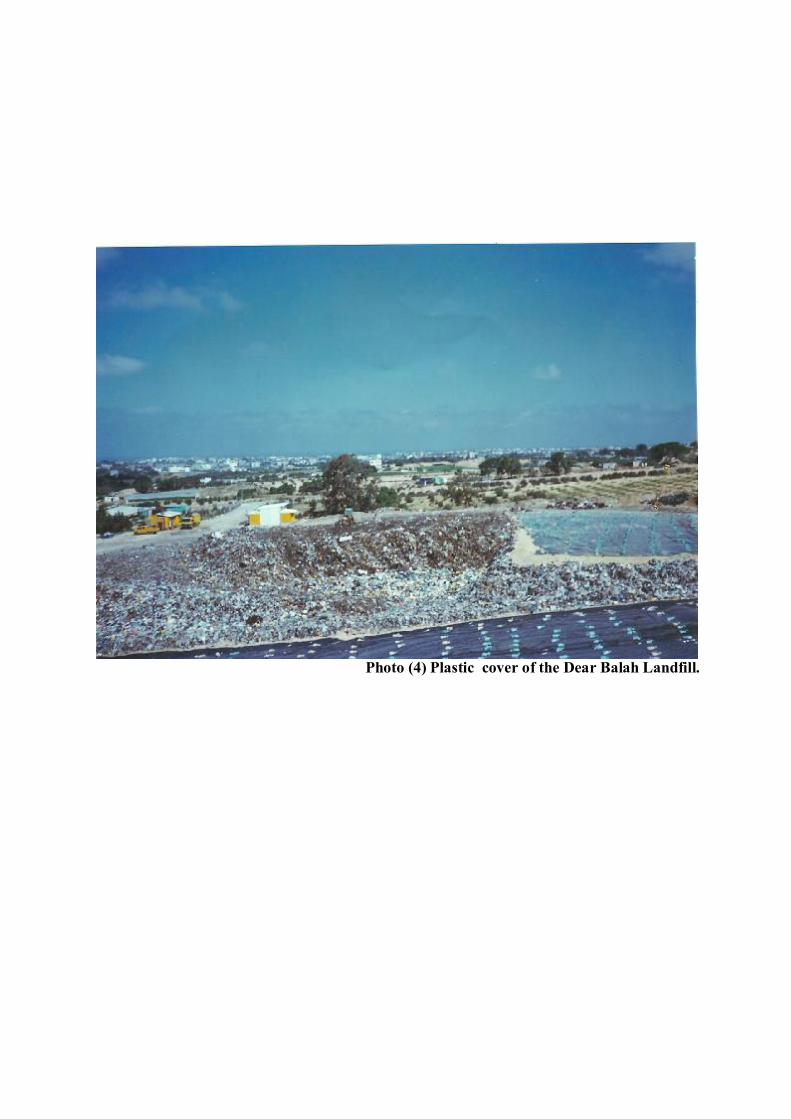
Photo (4) Plastic cover of the Dear Balah Landfill.

Photo (5) Soil cover of the Dear Balah Landfill