Embed Size (px)
Citation preview

MULTI-DISCIPLINARY OPTIMISATION OF MEDIUM ALTITUDELONG ENDURANCE UAVS
Dries Verstraete∗∗School of Aerospace, Mechanical and Mechatronic Engineering, The University of Sydney
Keywords: multi-disciplinary optimisation, MALE, UAV, fuel cell, piston engine
Abstract
While electric propulsion is generally preferredfor small unmanned aerial vehicles, medium alti-tude long endurance unmanned vehicles typicallyemploy piston engines due to the limited energydensity of batteries. Fuel cells could enable elec-tric propulsion for medium altitude UAVs. Thecurrent article presents a multidisciplinary designand optimisation framework that allows a com-parison between piston engines and fuel cells asa propulsion system for medium altitude long en-durance UAVs. Models are developed for bothpropulsion technologies and applied to the designof a typical medium altitude long endurance. Theresults of the study show that fuel-cell-poweredUAVs can be considerably lighter than UAVspowered by piston engines regardless of whetherhydrogen fuel is stored as compressed gas or inliquid form. For a given take-off weight the useof fuel cells almost doubles the endurance of theUAV and endurances over 60 hours are achiev-able with take-off gross weights less than 1000kg.
1 Introduction
Unmanned aerial vehicles (UAVs) are increas-ingly the platform of choice for a varietyof reconnaissance and remote-sensing missions,aerial photography, environmental monitoring,disaster relief, and search and rescue operations.Small UAVs primarily use electrical propulsionsystems because of their comparatively high ef-ficiency, low cost, and high reliability [1–7], as
well as low infra-red and noise levels [8]. LargerUAVs are, on the other hand, predominantly pow-ered by piston engine or gas turbines as the en-ergy density of current battery technology wouldlead to an excessive take-off gross weight fortypical endurances of medium altitude long en-durance (MALE) UAVs.
Fuel cells offer a considerably higher energydensity than batteries [9] and could enable elec-tric propulsion for MALE UAVs. However theirintegration needs to be properly addressed asfuel cell performance characteristics differ signif-icantly from those of piston engines. Fuel cellefficiency, for instance, increases at part load [9]and the lower operating pressure at altitude canhave a significant impact on fuel cell power levels[10–12]. To assess those differences properly amulti-disciplinary design environment is needed.
The current article presents a multidisci-plinary design and optimisation framework thatenables investigation of these integration differ-ences. The UAV design and performance anal-ysis framework is detailed first. After this de-tailed performance models for piston engines andfuel cells are described. Those models are thencoupled with the UAV design framework and ap-plied to a nominal MALE UAV design. For bothpropulsion technologies the UAV wing area andaspect ratio are optimised to minimise the maxi-mum gross take-off weight of the UAV.
1
DRIES VERSTRAETE
2 UAV Design and Performance AnalysisFramework
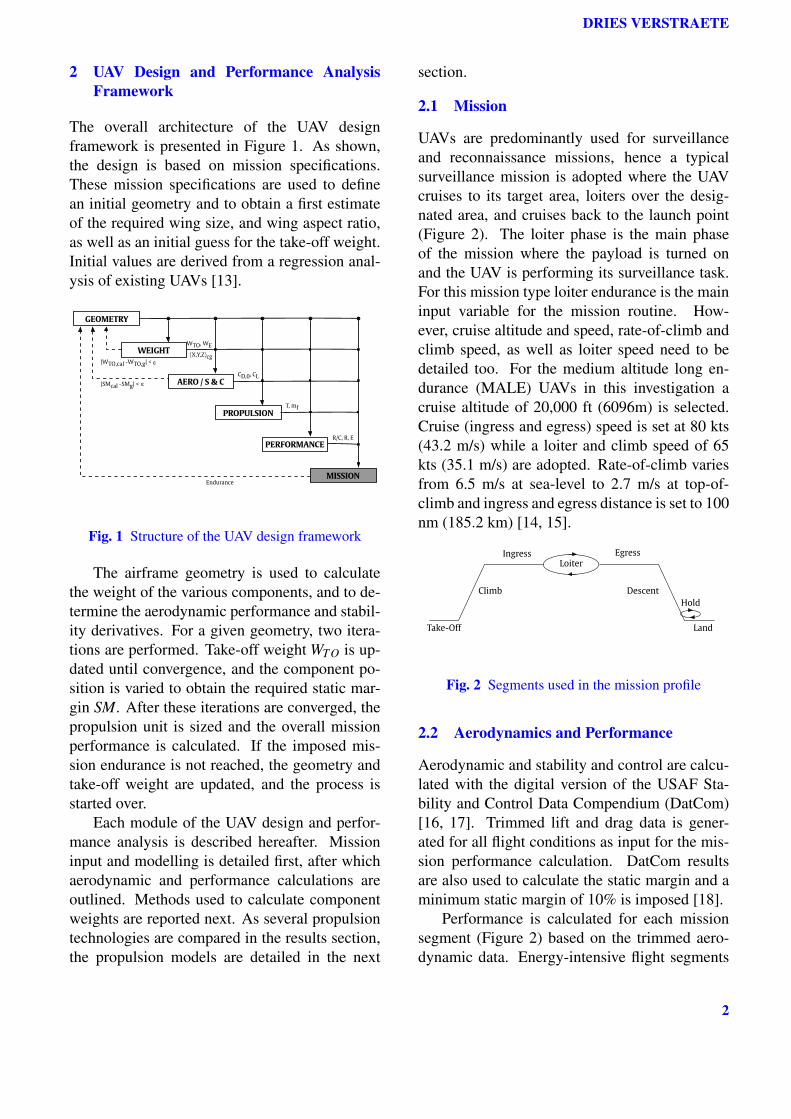
The overall architecture of the UAV designframework is presented in Figure 1. As shown,the design is based on mission specifications.These mission specifications are used to definean initial geometry and to obtain a first estimateof the required wing size, and wing aspect ratio,as well as an initial guess for the take-off weight.Initial values are derived from a regression anal-ysis of existing UAVs [13].
GEOMETRY
WEIGHT
AERO / S & C
PROPULSION
PERFORMANCE
MISSION
WTO, WE
|WTO,cal -WTO,g| < ε
Endurance
(X,Y,Z)cg
CD,0, CL
T, mf
R/C, R, E
|SMcal -SMg| < ε
Fig. 1 Structure of the UAV design framework
The airframe geometry is used to calculatethe weight of the various components, and to de-termine the aerodynamic performance and stabil-ity derivatives. For a given geometry, two itera-tions are performed. Take-off weight WTO is up-dated until convergence, and the component po-sition is varied to obtain the required static mar-gin SM. After these iterations are converged, thepropulsion unit is sized and the overall missionperformance is calculated. If the imposed mis-sion endurance is not reached, the geometry andtake-off weight are updated, and the process isstarted over.
Each module of the UAV design and perfor-mance analysis is described hereafter. Missioninput and modelling is detailed first, after whichaerodynamic and performance calculations areoutlined. Methods used to calculate componentweights are reported next. As several propulsiontechnologies are compared in the results section,the propulsion models are detailed in the next
section.
2.1 Mission
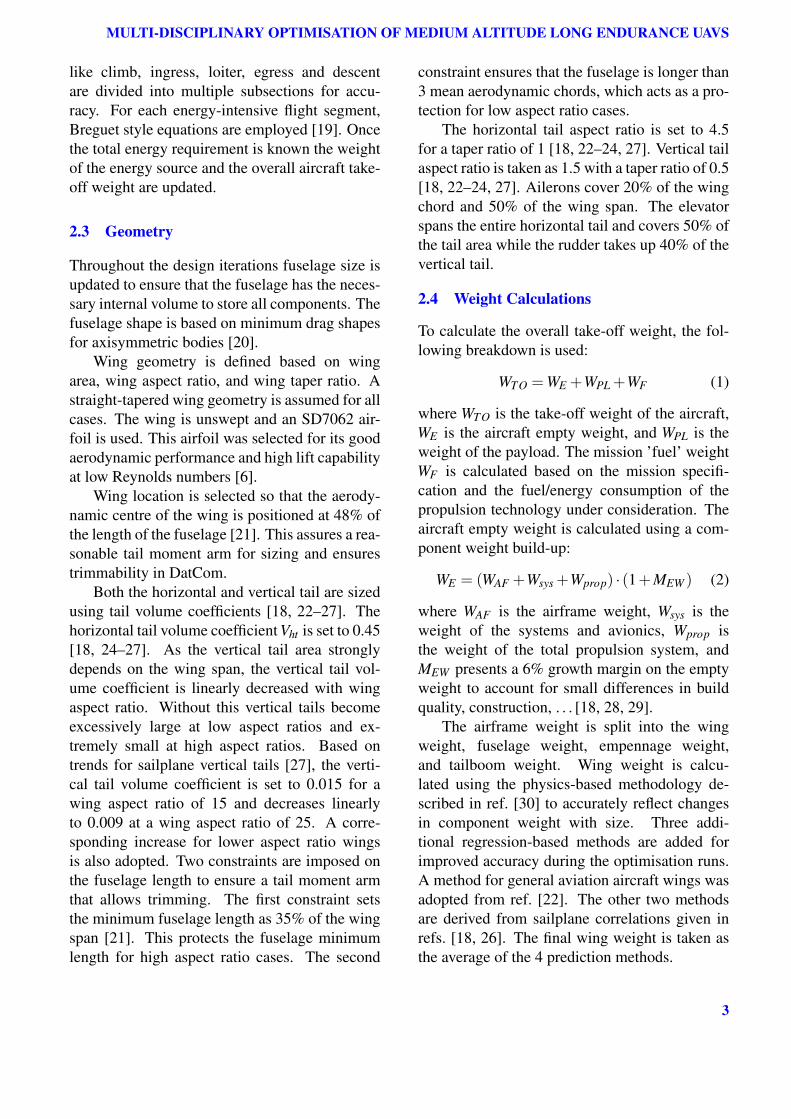
UAVs are predominantly used for surveillanceand reconnaissance missions, hence a typicalsurveillance mission is adopted where the UAVcruises to its target area, loiters over the desig-nated area, and cruises back to the launch point(Figure 2). The loiter phase is the main phaseof the mission where the payload is turned onand the UAV is performing its surveillance task.For this mission type loiter endurance is the maininput variable for the mission routine. How-ever, cruise altitude and speed, rate-of-climb andclimb speed, as well as loiter speed need to bedetailed too. For the medium altitude long en-durance (MALE) UAVs in this investigation acruise altitude of 20,000 ft (6096m) is selected.Cruise (ingress and egress) speed is set at 80 kts(43.2 m/s) while a loiter and climb speed of 65kts (35.1 m/s) are adopted. Rate-of-climb variesfrom 6.5 m/s at sea-level to 2.7 m/s at top-of-climb and ingress and egress distance is set to 100nm (185.2 km) [14, 15].
Take-Off
Climb
Ingress Egress
Descent
Land
Loiter
Hold
Fig. 2 Segments used in the mission profile
2.2 Aerodynamics and Performance
Aerodynamic and stability and control are calcu-lated with the digital version of the USAF Sta-bility and Control Data Compendium (DatCom)[16, 17]. Trimmed lift and drag data is gener-ated for all flight conditions as input for the mis-sion performance calculation. DatCom resultsare also used to calculate the static margin and aminimum static margin of 10% is imposed [18].
Performance is calculated for each missionsegment (Figure 2) based on the trimmed aero-dynamic data. Energy-intensive flight segments
2
MULTI-DISCIPLINARY OPTIMISATION OF MEDIUM ALTITUDE LONG ENDURANCE UAVS
like climb, ingress, loiter, egress and descentare divided into multiple subsections for accu-racy. For each energy-intensive flight segment,Breguet style equations are employed [19]. Oncethe total energy requirement is known the weightof the energy source and the overall aircraft take-off weight are updated.
2.3 Geometry
Throughout the design iterations fuselage size isupdated to ensure that the fuselage has the neces-sary internal volume to store all components. Thefuselage shape is based on minimum drag shapesfor axisymmetric bodies [20].
Wing geometry is defined based on wingarea, wing aspect ratio, and wing taper ratio. Astraight-tapered wing geometry is assumed for allcases. The wing is unswept and an SD7062 air-foil is used. This airfoil was selected for its goodaerodynamic performance and high lift capabilityat low Reynolds numbers [6].
Wing location is selected so that the aerody-namic centre of the wing is positioned at 48% ofthe length of the fuselage [21]. This assures a rea-sonable tail moment arm for sizing and ensurestrimmability in DatCom.
Both the horizontal and vertical tail are sizedusing tail volume coefficients [18, 22–27]. Thehorizontal tail volume coefficient Vht is set to 0.45[18, 24–27]. As the vertical tail area stronglydepends on the wing span, the vertical tail vol-ume coefficient is linearly decreased with wingaspect ratio. Without this vertical tails becomeexcessively large at low aspect ratios and ex-tremely small at high aspect ratios. Based ontrends for sailplane vertical tails [27], the verti-cal tail volume coefficient is set to 0.015 for awing aspect ratio of 15 and decreases linearlyto 0.009 at a wing aspect ratio of 25. A corre-sponding increase for lower aspect ratio wingsis also adopted. Two constraints are imposed onthe fuselage length to ensure a tail moment armthat allows trimming. The first constraint setsthe minimum fuselage length as 35% of the wingspan [21]. This protects the fuselage minimumlength for high aspect ratio cases. The second
constraint ensures that the fuselage is longer than3 mean aerodynamic chords, which acts as a pro-tection for low aspect ratio cases.
The horizontal tail aspect ratio is set to 4.5for a taper ratio of 1 [18, 22–24, 27]. Vertical tailaspect ratio is taken as 1.5 with a taper ratio of 0.5[18, 22–24, 27]. Ailerons cover 20% of the wingchord and 50% of the wing span. The elevatorspans the entire horizontal tail and covers 50% ofthe tail area while the rudder takes up 40% of thevertical tail.
2.4 Weight Calculations
To calculate the overall take-off weight, the fol-lowing breakdown is used:
WTO =WE +WPL +WF (1)
where WTO is the take-off weight of the aircraft,WE is the aircraft empty weight, and WPL is theweight of the payload. The mission ’fuel’ weightWF is calculated based on the mission specifi-cation and the fuel/energy consumption of thepropulsion technology under consideration. Theaircraft empty weight is calculated using a com-ponent weight build-up:
WE = (WAF +Wsys +Wprop) · (1+MEW ) (2)
where WAF is the airframe weight, Wsys is theweight of the systems and avionics, Wprop isthe weight of the total propulsion system, andMEW presents a 6% growth margin on the emptyweight to account for small differences in buildquality, construction, . . . [18, 28, 29].
The airframe weight is split into the wingweight, fuselage weight, empennage weight,and tailboom weight. Wing weight is calcu-lated using the physics-based methodology de-scribed in ref. [30] to accurately reflect changesin component weight with size. Three addi-tional regression-based methods are added forimproved accuracy during the optimisation runs.A method for general aviation aircraft wings wasadopted from ref. [22]. The other two methodsare derived from sailplane correlations given inrefs. [18, 26]. The final wing weight is taken asthe average of the 4 prediction methods.
3

DRIES VERSTRAETE
Fuselage and empennage weight are calcu-lated using the average of two regression meth-ods [18, 31]. The weight of the systems andavionics, electrical wiring, and electrical systemsis calculated based on the methods presented inrefs. [18, 21]. An autopilot weight of 10 lbs isused [18], and a power consumption of 15 W perlb of system is assumed for the avionics [32].Propeller weight is calculated using the methodfrom refs. [18, 33]. Finally, where applicable, theweight of the brushless DC motor is determinedfrom a regression analysis on a large database ofbrushless DC motors [34] while the weight ofthe electronic speed controller is taken as 0.04kg/kW [18, 35].
2.5 Propeller
While a detailed sizing and optimisation of thepropeller is beyond the scope of this article, thevariation in propeller efficiency with flight condi-tion can have a significant impact on the perfor-mance estimates [36]. A method is thus adoptedthat allows a rapid evaluation of the propellerefficiency while still providing accuracy acrossthe entire mission. The adopted methodology isbased on the so-called propeller polar [37]:
CP
J2 =
(m+n
CT
J2
)(3)
where CP represents the power coefficient of thepropeller, J is the propeller advance ratio, andCT is the thrust coefficient. Based on measuredpropeller performance [38] it is furthermore as-sumed that the thrust coefficient varies linearlywith the advance ratio:
CT = a+bJ (4)
Whereas this assumption is not valid at lowadvance ratios, it gives an accurate approxima-tion of the propeller performance across the ex-pected operating range for the main flight phases.Combining the two previous equations further-more allows a simple expression for the propellerefficiency:
η =aJ+bJ2
mJ2 +nbJ+na(5)
This expression is used to fit data of a typ-ical variation in normalised propeller efficiencywith a normalised advance ratio [22]. The ad-vance ratio is normalised by its value at the peakefficiency while efficiency is normalised by itspeak value. Using a non-linear least squares fiton the data of ref. [22] results in the follow-ing coefficients:a = 0.9106; b = −0.641; m =0.06075; n = 0.7772. The efficiency at the dif-ferent flight conditions can be determined oncethe normalisation values for both advance ratioand efficiency are known. Here, peak efficiencyis set to 83% while the advance ratio at which thepeak efficiency occurs is, on the other hand, setat the mid-loiter point so that the propeller op-erates close to its peak efficiency for the mostenergy-demanding phase of the flight. For off-design operation the rotational speed to deliverthe required thrust is calculated. The propellerdiameter is determined using the method fromrefs. [22, 39]. The diameter is calculated forclimb, ingress, egress and loiter and the maxi-mum value of all 4 flight conditions is taken.
3 Propulsion Systems Modelling
As a comparison is made between piston enginesand fuel-cell-based propulsion system, a detaileddescription of the modelling method adopted forboth technologies is given next. Piston enginemodels are detailed first, while fuel cell, brush-less DC motors and hydrogen storage models aresubsequently described.
3.1 Piston Engines
The current section describes scaling laws anda performance model for piston engines. Scal-ing laws are derived from a database of 488 pis-ton engines. Of those, 294 are two-stroke en-gines, and 194 use a four-stroke cycle. Entriesin the database range from small hobby-marketengines to large engines used on general aviationaircraft1. Regression dilution is avoided using the
1Manufacturers in the database include a.o. 3W, Conti-nental, Desert Aircraft, DL Engines, Enya, Evolution En-gines, Hirth, Honda, Limbach, Lycoming, Northwest UAV,
4

MULTI-DISCIPLINARY OPTIMISATION OF MEDIUM ALTITUDE LONG ENDURANCE UAVS
techniques described in ref. [13].
3.1.1 Engine Power and Mass
As suggested in ref. [40], engine physical andperformance properties are analysed with respectto the engine displacement volume. As will beshown, this leads to good correlations and identi-fiable trends for all considered parameters. How-ever, engine displacement is of little use when de-signing an aircraft or calculating its performance.In a first step engine displacement is thereforecorrelated with engine peak power and a powerlaw regression is performed [40]:
Vd = APBeng (6)
where Vd is the total engine displacement, andPeng is the engine peak power. A good corre-lation is obtained between peak power and totaldisplacement (Figure 3). This is reflected by thesmall relative uncertainty (R.U.) on the regres-sion fits (Table 1).
1,0000.1 1 10 100
10,000
1
1,000
10
100
Engine Peak Power [kW]Engi
ne T
otal
Dis
plac
emen
t [c
m3 ]
Two-StrokeFour-Stroke
Fig. 3 Engine displacement as function of enginepeak power.
A large spread exists on each of the datasets,and the data for the different engine types showsa significant overlap. The identified correlationsare nonetheless statistically different, as shownby a two-sample t-test on the two datasets (per-formed using the MATLAB R© ttest2 func-tion, without assuming equal variances of thedatasets).
OS Engines, RCV Engines Ltd., Rotax Engines, Saito,Thunder Tiger, and Zenoah.
Table 1 Regression coefficients for power-law fitsof engine displacement as a function of enginepeak power, where Vd is in cm3 and P in kW. 2Sindicates two-stroke engines while 4S stands forfour-stroke.
A B R2 R.U.2S 8.6163 1.1540 0.9708 3.5%4S 11.8987 1.2242 0.9847 5.2%
Note that the accuracy of the fit for two-strokeengines reduces for small engine displacements(Figure 3). For small engines, friction losses andcharge leakage through the cylinder-piston gapnamely become dominant [41]. Care must thusbe taken when engine power is less than approx-imately 500 W.
With the engine displacement volume known,engine mass can be determined next. A similarpower law regression analysis was performed toobtain engine mass (meng) as function of enginedisplacement (Figure 4 and Table 2):
meng = AV Bd (7)
10,0001 1,00010 100
1,000
0.01
0.1
1
10
100
Engine Total Displacement [cm3]
Engi
ne M
ass
[kg]
Four-StrokeTwo-Stroke
Fig. 4 Engine mass as function of engine dis-placement.
3.1.2 Torque and Rotational Speed
Engine rotational speed and torque need to be de-termined so that the engine and propeller can bematched. To allow engine scaling, a regressionanalysis was performed on the rotational speedand torque at peak power. Both correlate wellwith engine displacement for the two-stroke and
5

DRIES VERSTRAETE
Table 2 Regression coefficients for power-law fitsof engine mass as a function of engine total dis-placement, where meng is in kg and Vd in cm3. 2Sindicates two-stroke engines, while 4S stands forfour-stroke
A B R2 R.U.2S 0.1029 0.8667 0.9580 3.8%4S 0.0532 0.9126 0.9893 3.5%
four-stroke engines (Figures 5 and 6). For bothparameters a power-law fit was determined:
RPMpeak = AV Bd (8)
Qpeak = AV Bd (9)
10,0001 1,00010 100
105
103
104
Engine Total Displacement [cm3]Peak
Pow
er R
otat
iona
l Spe
ed [R
PM]
Two-StrokeFour-Stroke
Fig. 5 Engine rotational speed at peak power asfunction of engine displacement.
The regression coefficients for rotationalspeed and torque are given in Tables 3 and 4 re-spectively. A good fit is obtained for both param-eters with goodness-of-fit values above 0.9 forall but the regression for rotational speed for thetwo-stroke engine. The relative uncertainty val-ues for both regressions are below 10% for thetwo engine types which makes the laws suitablefor use in early design stages. Note that the threeoutliers for two-stroke engines of small displace-ment are not considered when determining thecorrelation but are included in the figures to in-dicate the spread on the data.
Table 3 Regression coefficients for power-law fitsof engine rotational speed as function of enginedisplacement, where RPMpeak is in RPM and Vdin cm3.
A B R2 R.U.2S 19394 -0.1843 0.7892 5.2%4S 19175 -0.2217 0.9349 7.6%
10,0001 1,00010 100
1000
0.1
1
10
100
Engine Total Displacement [cm3]Pe
ak P
ower
Tor
que
[Nm
] Two-StrokeFour-Stroke
Fig. 6 Engine torque at peak power as functionof engine displacement.
Table 4 Regression coefficients for power-law fitsengine torque at peak power as function of enginedisplacement, where Qpeak is in Nm and Vd incm3.
A B R2 R.U.2S 7.732 ·10−2 1.0571 0.9829 7.4%4S 6.425 ·10−2 1.0355 0.9956 3.6%
3.1.3 Engine Efficiency
While data on engine power, displacement, mass,torque and rotational speed are readily available,efficiency is typically not given by manufacturersfor all but the largest (general aviation) engines[40]. While efficiency generally decreases grad-ually when scaling down engines, it has further-more been shown that a simple power law loosesaccuracy for engines with a displacement below10 cm3 [40]. The following modified power lawis therefore adopted [40]:
6
MULTI-DISCIPLINARY OPTIMISATION OF MEDIUM ALTITUDE LONG ENDURANCE UAVS
η =AV B
d ·(
1−CV−2/3d
)100
(10)
where η is the thermal efficiency of the engine atpeak power, and A and B are the standard power-law regression coefficients. The additional re-gression coefficient C is introduced to account forthe rapid decline in efficiency for small engines[40]. For engines with displacement larger than10 cm3, C is taken as zero while two values areproposed for smaller engines: 0.84 when the en-gine has a muffler, or 0.24 for engines withoutmufflers [40]. Note that those values are derivedfor glow engines.
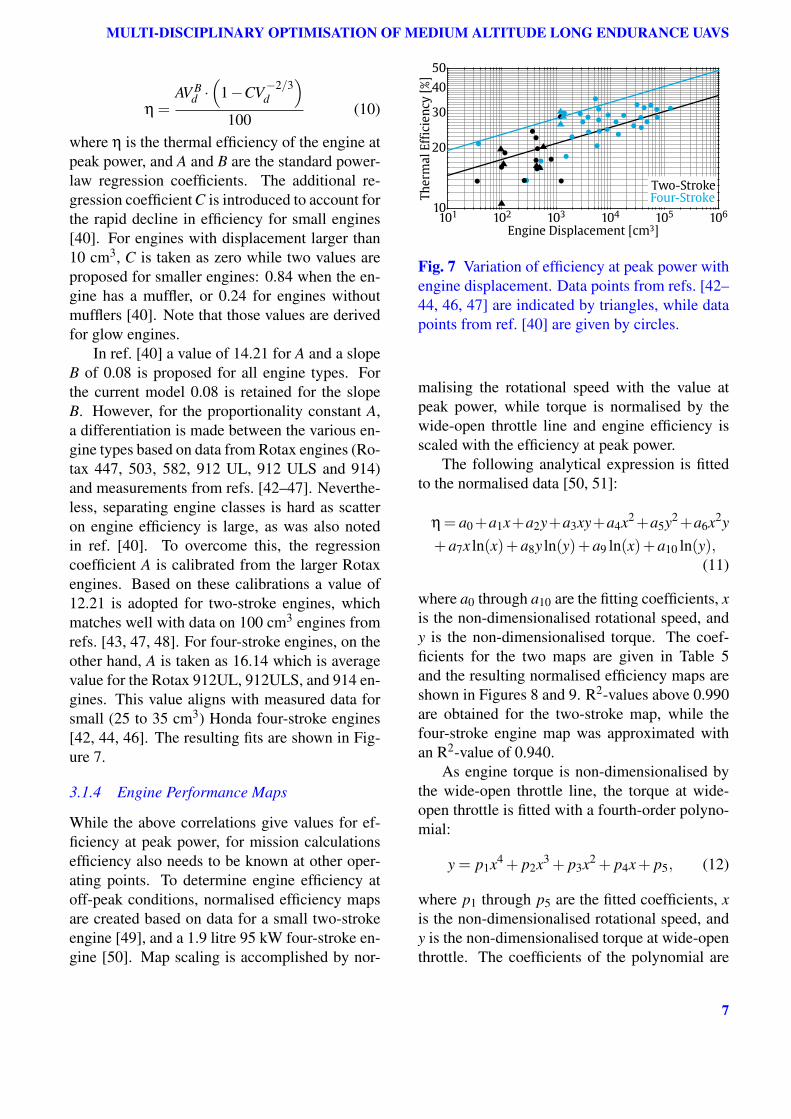
In ref. [40] a value of 14.21 for A and a slopeB of 0.08 is proposed for all engine types. Forthe current model 0.08 is retained for the slopeB. However, for the proportionality constant A,a differentiation is made between the various en-gine types based on data from Rotax engines (Ro-tax 447, 503, 582, 912 UL, 912 ULS and 914)and measurements from refs. [42–47]. Neverthe-less, separating engine classes is hard as scatteron engine efficiency is large, as was also notedin ref. [40]. To overcome this, the regressioncoefficient A is calibrated from the larger Rotaxengines. Based on these calibrations a value of12.21 is adopted for two-stroke engines, whichmatches well with data on 100 cm3 engines fromrefs. [43, 47, 48]. For four-stroke engines, on theother hand, A is taken as 16.14 which is averagevalue for the Rotax 912UL, 912ULS, and 914 en-gines. This value aligns with measured data forsmall (25 to 35 cm3) Honda four-stroke engines[42, 44, 46]. The resulting fits are shown in Fig-ure 7.
3.1.4 Engine Performance Maps
While the above correlations give values for ef-ficiency at peak power, for mission calculationsefficiency also needs to be known at other oper-ating points. To determine engine efficiency atoff-peak conditions, normalised efficiency mapsare created based on data for a small two-strokeengine [49], and a 1.9 litre 95 kW four-stroke en-gine [50]. Map scaling is accomplished by nor-
106101 102 103 104 105
50
10
20
30
40
Engine Displacement [cm3]
Ther
mal
Eff
icie
ncy
[%]
Two-StrokeFour-Stroke
Fig. 7 Variation of efficiency at peak power withengine displacement. Data points from refs. [42–44, 46, 47] are indicated by triangles, while datapoints from ref. [40] are given by circles.
malising the rotational speed with the value atpeak power, while torque is normalised by thewide-open throttle line and engine efficiency isscaled with the efficiency at peak power.
The following analytical expression is fittedto the normalised data [50, 51]:
η= a0+a1x+a2y+a3xy+a4x2+a5y2+a6x2y+a7x ln(x)+a8y ln(y)+a9 ln(x)+a10 ln(y),
(11)
where a0 through a10 are the fitting coefficients, xis the non-dimensionalised rotational speed, andy is the non-dimensionalised torque. The coef-ficients for the two maps are given in Table 5and the resulting normalised efficiency maps areshown in Figures 8 and 9. R2-values above 0.990are obtained for the two-stroke map, while thefour-stroke engine map was approximated withan R2-value of 0.940.
As engine torque is non-dimensionalised bythe wide-open throttle line, the torque at wide-open throttle is fitted with a fourth-order polyno-mial:
y = p1x4 + p2x3 + p3x2 + p4x+ p5, (12)
where p1 through p5 are the fitted coefficients, xis the non-dimensionalised rotational speed, andy is the non-dimensionalised torque at wide-openthrottle. The coefficients of the polynomial are
7

DRIES VERSTRAETE
Fig. 8 Normalised efficiency map for two-strokeengines. Contour levels indicate normalised ther-mal efficiency, with normalisation performed us-ing the thermal efficiency at peak power.
Fig. 9 Normalised efficiency map for four-strokeengines. Contour levels indicate normalised ther-mal efficiency, with normalisation performed us-ing the thermal efficiency at peak power.
Table 5 Regression coefficients for the non-dimensionalised efficiency maps.
2S 4S 2S 4Sa0 -1.503 0.6824 a6 2.931 0.5358a1 -1.002 0.717 a7 0.1971 -3.66a2 -0.9827 0.8585 a8 2.129 3.048a3 1.703 -0.6433 a9 -6.341 -0.451a4 -0.06857 1.258 a10 0.7024 0.7318a5 -1.324 -2.492
given in Table 6. R2-values above 0.995 are ob-tained for each WOT line.
The non-dimensionalised maps and wide-open throttle lines can be used in combinationwith the regression fits for RPM, torque, and ef-ficiency at peak power (equations 8, 9 and 10)
Table 6 Regression coefficients for the non-dimensionalised wide-open throttle line.
2S 4Sp1 -3.423 -4.211p2 11.75 10.27p3 -15.38 -9.348p4 8.188 3.821p5 -0.1326 0.4742
to create unscaled maps of engines of a differentdisplacement.
3.2 Altitude Effects
As reciprocating engines use atmospheric airboth the power output and efficiency of the en-gine are affected by the operating pressure. Al-titude effects on power can be accounted forthrough the Gagg-Farrar correction [21, 37, 52]:
φ(σ) =σ−D1−D
(13)
where D is 0.12 for typical piston engines [37],and σ represents the ratio of the air density at theconsidered altitude to the air density at sea level.Power at altitude is then given by:
P(σ) = φ(σ)PSL (14)
and it is assumed that this correction factor ap-plies equally across the entire engine map [21,37, 52].
Brake specific fuel consumption (BSFC), orengine efficiency, is also corrected for altitude[21]:
FBSFC =σ · (1−E)(σF −E)
(15)
where E is 0.065 and F is 1.117 for large generalaviation ICEs [21]. In the absence of detailed in-formation, this altitude correction is assumed toapply to all engine types. Brake specific fuel con-sumption at altitude (BSFCalt) is then given by:
BSFCalt = FBSFCBSFCSL (16)
where BSFCSL is the fuel consumption at sea-level.
8

MULTI-DISCIPLINARY OPTIMISATION OF MEDIUM ALTITUDE LONG ENDURANCE UAVS
3.3 Protom Exchange Membrane Fuel CellModel
The current section describes the model used tosize the proton exchange membrane (PEM) fuelcells. The weight and dimensions of the fuel cellare determined based on the required peak powerof the fuel cell. Fuel cells need to be combinedwith brushless DC motors. Their performance ismodeled here using the methodology describedin ref. [34]. Variations in the zero-load current,motor armature resistance, and motor speed con-stant with continuous output power are modelledusing correlations based on a regression analysisof 1743 outrunner motors from 12 manufacturers.
3.3.1 Fuel Cell Weight and Dimensions
Fuel cell sizes and weights have reduced consid-erably over the last decade due to major devel-opment programs in the automotive sector. Asa consequence, current fuel cell technology hasa comparable size and weight as internal com-bustion engines (ICE) as shown on Figure 10.The figure shows that automotive fuel cells areon par or even outperform ICE for both specificpower and power density. For the investigationsreported here a specific power of 2500 W/kg anda power density of 3.7 W/cm3 are adopted for a90 kW fuel cell.
The power density and specific power canthen be used, in conjunction with the fuel cellpeak power (which is derived from the missionunder consideration), to determine the fuel celldimensions. Before this can be done, howeverthe number of cells in the stack needs to be deter-mined first.
For large PEM fuel cells data is taken from[59, 60] to derive trends. For fuel cells rangingfrom 5 kW to 180 kW the number of cells scalesalmost linearly with output power. The followingexpression was therefore adopted:
N = 3 ·Ppeak (17)
Fuel cell stack height on the other hand isfound to correlate well with the number of cells:
hstack = 0.857 · (N −75)+0.25 (18)
100.01 0.1 1
10,000
10
100
1000
Power Density [W/cm3]
Spec
ific
Pow
er [W
/kg]
LynTech Gen IV
Honda 2003
Honda 2006Automotive 2012
ICE
Murphy1998
Nissan 2011
Honda 1999
(Helios)
Honda 2001
HyPM-HD
NuCellSys Hy-80Chalk2006
HorizonMendez2014Datta2012
Fig. 10 Ragone plot to indicate progress infuel cell technology (adapted from [53] with au-tomotive data from [54, 55]). Additional datafrom [55–60] is added as indicated in the legend.Adopted value is indicated by the cyan star.
The cell area is on the other hand determinedas function of the peak power to meet the speci-fied power density. Fuel cell weight is calculatedfrom the specified specific power. To accountfor scaling effects, the nominal power densityand specific power are adjusted for fuel cell sizebased on trends identified in [59]. Adjustmentfactors are given in Table 7 where SPF stands forspecific power factor and PDF denotes the powerdensity factor. A linear interpolation between thevalues reported in Table 7 is used for intermediatepowers [59].
Table 7 Adjustment Factors for Specific Power(SP) and Power Density
Ppeak [kW] SPF PDF10 0.833 0.730 0.815 0.80890 1 1
150 1.158 1.167
3.3.2 Fuel Cell Efficiency
The efficiency of a PEM fuel cell will, in con-trast to most reciprocating engines, improve atpart load. In contrast to small fuel cells, effi-ciency for large fuel cells furthermore depends onthe size (power) of the fuel cell. Large fuel cells
9
DRIES VERSTRAETE
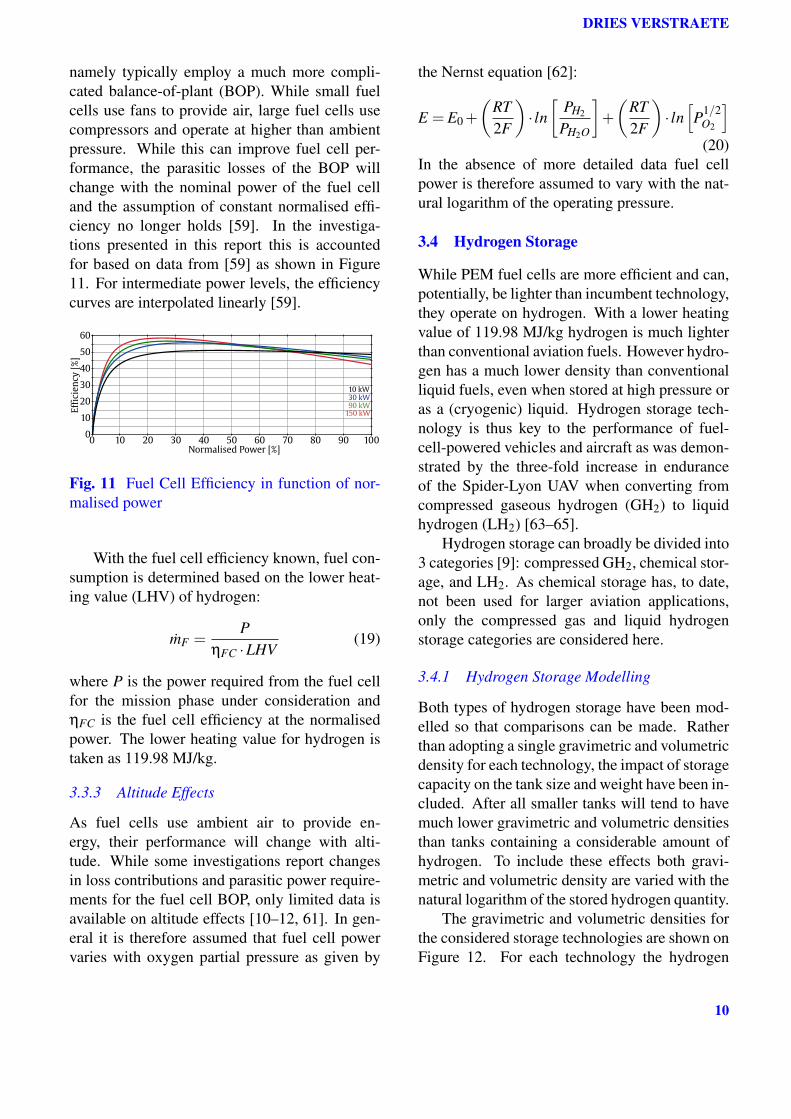
namely typically employ a much more compli-cated balance-of-plant (BOP). While small fuelcells use fans to provide air, large fuel cells usecompressors and operate at higher than ambientpressure. While this can improve fuel cell per-formance, the parasitic losses of the BOP willchange with the nominal power of the fuel celland the assumption of constant normalised effi-ciency no longer holds [59]. In the investiga-tions presented in this report this is accountedfor based on data from [59] as shown in Figure11. For intermediate power levels, the efficiencycurves are interpolated linearly [59].
1000 10 20 30 40 50 60 70 80 90
60
0
10
20
30
40
50
Normalised Power [%]
Effi
cien
cy [%
]
10 kW30 kW90 kW
150 kW
Fig. 11 Fuel Cell Efficiency in function of nor-malised power
With the fuel cell efficiency known, fuel con-sumption is determined based on the lower heat-ing value (LHV) of hydrogen:
mF =P
ηFC ·LHV(19)
where P is the power required from the fuel cellfor the mission phase under consideration andηFC is the fuel cell efficiency at the normalisedpower. The lower heating value for hydrogen istaken as 119.98 MJ/kg.
3.3.3 Altitude Effects
As fuel cells use ambient air to provide en-ergy, their performance will change with alti-tude. While some investigations report changesin loss contributions and parasitic power require-ments for the fuel cell BOP, only limited data isavailable on altitude effects [10–12, 61]. In gen-eral it is therefore assumed that fuel cell powervaries with oxygen partial pressure as given by
the Nernst equation [62]:
E = E0+
(RT2F
)· ln[
PH2
PH2O
]+
(RT2F
)· ln[P1/2
O2
](20)
In the absence of more detailed data fuel cellpower is therefore assumed to vary with the nat-ural logarithm of the operating pressure.
3.4 Hydrogen Storage
While PEM fuel cells are more efficient and can,potentially, be lighter than incumbent technology,they operate on hydrogen. With a lower heatingvalue of 119.98 MJ/kg hydrogen is much lighterthan conventional aviation fuels. However hydro-gen has a much lower density than conventionalliquid fuels, even when stored at high pressure oras a (cryogenic) liquid. Hydrogen storage tech-nology is thus key to the performance of fuel-cell-powered vehicles and aircraft as was demon-strated by the three-fold increase in enduranceof the Spider-Lyon UAV when converting fromcompressed gaseous hydrogen (GH2) to liquidhydrogen (LH2) [63–65].
Hydrogen storage can broadly be divided into3 categories [9]: compressed GH2, chemical stor-age, and LH2. As chemical storage has, to date,not been used for larger aviation applications,only the compressed gas and liquid hydrogenstorage categories are considered here.
3.4.1 Hydrogen Storage Modelling
Both types of hydrogen storage have been mod-elled so that comparisons can be made. Ratherthan adopting a single gravimetric and volumetricdensity for each technology, the impact of storagecapacity on the tank size and weight have been in-cluded. After all smaller tanks will tend to havemuch lower gravimetric and volumetric densitiesthan tanks containing a considerable amount ofhydrogen. To include these effects both gravi-metric and volumetric density are varied with thenatural logarithm of the stored hydrogen quantity.
The gravimetric and volumetric densities forthe considered storage technologies are shown onFigure 12. For each technology the hydrogen
10

MULTI-DISCIPLINARY OPTIMISATION OF MEDIUM ALTITUDE LONG ENDURANCE UAVS
quantities used to determine the lines on the Fig-ure are included between brackets. They roughlyindicate the applicability of the technology. Atank length-to-diameter ratio of 3 is assumed forall tanks in this investigation.
250 5 10 15 20
80
0
10
20
30
40
50
60
70
Gravimetric H2 density [mass%]
Volu
men
tric
H2
dens
ity
[kg
m-3
]
Liquid H2 (20.3 K)
H2 physisorbed on carbon
5 g
cm-3
2 g
cm-3
compositesteel
13
12080
50
20
500 200
1320
50
80
1 g cm-3 0.7 g cm-3
50 NRLLeachmanIon Tiger
Liquid (100g-100kg)
Gaseous (15g-2kg)
Fig. 12 Adopted models for the different storagetechnologies (adapted from [66] with additionaldata from [9, 67, 68])
As fuel cells require the use of brushless DC
4 Results
MALE UAVs have widely varying quoted timeson-station. Endurances range from 6 hours forsmaller platforms to 24-40 hours for larger scaleMALE UAVs. For the investigations in this worktime-on-station was thus varied from 6 to 70hours so that a large range of platform sizes canbe explored and differences between propulsiontechnologies become more apparent. For eachtechnology and endurance value, the wing areaand wing platform are optimised so that the air-craft with minimal take-off gross weight is found.Optimisation is initiated using a latin hypercubedesign with a population size of 45 and is evolvedover 5 generations with the MATLAB R© in-builtparticle swarm optimisation algorithm. A popu-lation based algorithm is used to initiate the op-timisation to ensure that a global minimum isfound rather than a local minimum. Once the5 generations are computed, the solution is fur-ther refined using the MATLAB R© gradient-basedfmincon algorithm. Constraints are applied toensure that a sufficient margin is obtained over
the stall speed of the aircraft and to restrict oper-ation to reasonable Reynolds numbers [6].
The baseline MALE UAV is sized to house apayload of 100 kg that draws 1500 W of power.This is a typical operational payload of a PredatorA mission [21] and allows to carry both EO/IRand a full SAR payload. For instance, a Ver-satron Skyball EO/IR with supporting electronicsand a Lynx SAR payload have a combine weightof 82.1 kg [21]. Results of this investigation aregiven in Figures 13 to 14.
Figure 13 shows that the weight of the plat-forms that use an internal combustion enginerises much more rapidly than that of those whoare powered by fuel cells. For the comparativelylarge fuel weights of those platforms the weightreduction due to the much higher LHV of hy-drogen more than compensates the increase intank mass. Take-off weights around 1500 kg arereached for an endurance around 30 to 40 hoursfor the piston engine powered vehicles. For fuel-cell powered vehicles, on the other hand, take-offgross weight is about half this value at this en-durance. Even for a much larger endurance theMTOW of the MALE UAV with PEM fuel cellsdoes not exceed 1000 kg. As the hydrogen stor-age capacity of the tanks becomes significant, liq-uid hydrogen storage shows a significant advan-tage over gaseous compressed storage. Even for aloiter endurance of 70 hours, the maximum take-off weight with liquid hydrogen only reaches 560kg.
750 5 10 15 20 25 30 35 40 45 50 55 60 65 70
1,500
250
500
750
1000
1250
Endurance [hr]
MTO
W [k
g]
PEM LH2
Four-Stroke
PEM GH2
Two-Stroke
Fig. 13 Take-Off Weight for the MALE UAV cat-egory
Figure 14 shows that the large reduction infuel mass also influences the empty weight ofthe vehicle. The empty weight of the MALE
11

DRIES VERSTRAETE
UAVs which use fuel cells is lower than that ofthe piston-powered vehicles. A large part of thevehicle empty weight is namely influenced by thetake-off weight. Wing weight, for instance, in-creases with wing area and the drastic reductionin fuel weight (and take-off weight) leads to amuch smaller wing area. Wing loadings for allconsidered propulsion systems are namely verysimilar (around 90-95 kg/m2). Similar observa-tions can be made for the weights of the othercomponents of the airframe.
750 5 10 15 20 25 30 35 40 45 50 55 60 65 70
1,000
0
250
500
750
Endurance [hr]
Empt
y W
eigh
t [k
g] PEM LH2
Four-Stroke
PEM GH2
Two-Stroke
Fig. 14 Empty Weight for the MALE UAV category
The significant impact of the fuel weight alsoinfluences the size of the engine / motor, asshown on Figure 15. The overall reduction intake-off weight more than compensates the morerapid loss of power with altitude for the fuel cells,and a much smaller motor is required for the fuelcell vehicles. Despite the lower engine power, thepower-to-weight ratio for the fuel-cell-poweredvehicles increased to around 150-160 W per kgof MTOW. The UAVs with internal combustionengines, on the other hand, have a power-to-weight ratio that varies from 130 W/kg at lowendurances down to 100 W/kg at the highest con-sidered endurance.
750 5 10 15 20 25 30 35 40 45 50 55 60 65 70
160
40
60
80
100
120
140
Endurance [hr]
Engi
ne P
ower
[kW
] PEM LH2PEM GH2
Two-StrokeFour-Stroke
Fig. 15 Engine Power for the MALE UAV category
The impact of payload weight was also in-vestigated for MALE UAVs. After all, this cate-gory has a wide range of advertised payload ca-pabilities. The baseline payload weight was dou-bled to 200 kg and the required payload powerwas increased accordingly (to 3000 W). Resultsof this investigation are shown in Figure 16. Fig-ure 16 shows that the increased payload weighthas a strong influence on the overall maximumtake-off mass, especially for the vehicles with in-ternal combustion engines. The endurance at atake-off gross weight of 1500 kg decreases by 10to 15 hours for all internal combustion engines.The impact on the fuel-cell powered vehicle withcompressed gas storage is equally significant.While the take-off gross weight of the UAVswith liquid hydrogen storage also increases, theMTOW still stays within bounds even at 70 hoursendurance.
The increase in MTOW has a significant im-pact on the required engine power. At low en-durances engine power increases from 50 kWto approximately 80 kW. At an endurance of70 hours, the fuel cell powered vehicle requiresa motor with approximately 140 kW of power,while the MALE UAV with the smaller payloadonly required 80 kW.
750 5 10 15 20 25 30 35 40 45 50 55 60 65 70
1,500
250
500
750
1000
1250
Endurance [hr]
MTO
W [k
g]
PEM LH2
Four-Stroke
PEM GH2
Two-Stroke
Fig. 16 Take-Off Weight for the MALE UAV cat-egory with Larger Payload
5 Conclusion
The current article presents a multidisciplinarydesign and optimisation framework that allowsa comparison between piston engines and fuelcells as a propulsion system for medium alti-tude long endurance UAVs. While medium alti-
12
MULTI-DISCIPLINARY OPTIMISATION OF MEDIUM ALTITUDE LONG ENDURANCE UAVS
tude long endurance unmanned vehicles are typ-ically powered by piston engines, it is shownthat fuel cells can offer significantly higher en-durance. For a given take-off weight the useof fuel cells almost doubles the endurance ofthe UAV and endurances well over 60 hours areachievable with take-off gross weights less than1000 kg. While compressed gaseous hydrogenstorage offers weight reductions compared to pis-ton engines, liquid hydrogen allows for muchmore significant weight reductions especially forlarger payload weights.
References
[1] O. Gur, A. Rosen, Optimizing electric propulsion systems for un-manned aerial vehicles, Journal of Aircraft 46 (4) (2009) 1340–1353.
[2] K. Kim, T. Kim, K. Lee, S. Kwon, Fuel cell systems with sodiumborohydride as hydrogen source for unmanned aerial vehicles, Jour-nal of Power Sources 196 (2011) 9069–9075.
[3] D. Verstraete, K. Lehmkuehler, A. Gong, J. Harvey, G. Brian,J. Palmer, Characterisation of a hybrid, fuel-cell-based propulsionsystem for small unmanned aircraft, Journal of Power Sources 250(2014) 204–211.
[4] D. Verstraete, A. Gong, D.-C. Lu, J. Palmer, Experimental investi-gation of the role of the battery in the aerostack hybrid, fuel-cell-based propulsion system for small unmanned aircraft systems, In-ternational Journal of Hydrogen Energy 40 (2015) 1598–1606.
[5] A. Gong, J. L. Palmer, G. Brian, J. R. Harvey, D. Verstraete, Perfor-mance of a hybrid, fuel-cell-based power system during simulatedsmall unmanned aircraft missions, International Journal of Hydro-gen Energy 41 (26) (2016) 11418–11426.
[6] D. Verstraete, L. Cazzato, G. Romeo, Preliminary design of a fuel-cell-based hybrid-electrical uav, in: 28th International Congress ofthe Aeronautical Sciences, Vol. 1, ICAS-2012-654, 2012, pp. 422–431.
[7] A. Gong, D. Verstraete, Fuel cell propulsion in small fixed-wingunmanned aerial vehicles: Current status and research needs, Inter-national Journal of Hydrogen Energy 42 (33) (2017) 21311 – 21333.
[8] C. Riboldi, F. Gualdoni, An integrated approach to the prelimi-nary weight sizing of small electric aircraft, Aerospace Science andTechnology 58 (2016) 134–149.
[9] A. Gong, D. Verstraete, Fuel cell propulsion in small fixed-wingunmanned aerial vehicles: Current status and research needs, Inter-national Journal of Hydrogen Energy 42 (33) (2017) 21311–21333.
[10] J. Pratt, J. Brouwer, G. Samuelsen, Experimental performance ofan air-breathing pem fuel cell at high altitude conditions, in: 43rdAIAA Aerospace Sciences Meeting and Exhibit, Aerospace Sci-ences Meetings, American Institute of Aeronautics and Astronau-tics, 2005.
[11] J. Pratt, J. Brouwer, G. Samuelsen, Performance of proton exchangemembrane fuel cell at high-altitude conditions, J. Propul. Power23 (2) (2007) 437–444.
[12] T. Hordé, P. Achard, R. Metkemeijer, Pemfc application for avia-tion: Experimental and numerical study of sensitivity to altitude,Int. J. Hydrogen Energy 37 (14) (2012) 10818–10829.
[13] D. Verstraete, J. Palmer, M. Hornung, Preliminary sizing correla-tions for fixed-wing uav characteristics, Journal of Aircraft 55 (2)(2018) 715–726.
[14] R. Austin, Unmanned Aircraft Systems: UAVS Design, Develop-ment and Deployment, Aerospace Series, Wiley, 2010.
[15] NATO, Fuel Cells and Other Emerging Manportable Power Tech-nologies for the NATO Warfighter – Part II: Power Sources for Un-
manned Applications, no. STO-TR-SET-173, NATO Science andTechnology Organization, 2014.
[16] R. Fink, Usaf stability and control datcom, Tech. rep., AFWAL-TR-83-3048, McDonnell Douglas Corporation, Douglas Aircraft Divi-sion, for the Flight Controls Division, Air Force Flight DynamicsLaboratory, Wright-Patterson AFB (1978).
[17] USAF, The usaf stability and control digital datcom, volume i, usersmanual., Tech. rep., USAF Technical report AFFDL-TR-79-3032(1979).
[18] J. Gundlach, Designing Unmanned Aircraft Systems: A Com-prehensive Approach, AIAA Education Series, AIAA, New York,2011.
[19] T. Nam, D. Soban, D. Mavris, A Generalized Aircraft SizingMethod and Application to Electric Aircraft, American Institute ofAeronautics and Astronautics, 2005.
[20] J. S. Parsons, R. E. Goodson, The optimum shaping of axisymmetricbodies for minimum drag in incompressible flow, Tech. rep., PurdueUniversity (1972).
[21] J. Gundlach, Multi-disciplinary design optimization of subsonicfixed-wing unmanned aeroial vehicles projected through 2025,Ph.D. thesis, Virginia Polytechnic Institue and State University(2004).
[22] D. Raymer, Aircraft Design: A Conceptual Approach, 4th Edition,AIAA Education Series, AIAA, New York, 2006.
[23] J. Roskam, Airplane Design Parts I-VIII, DARcorporation, 1997.[24] L. M. Nicolai, G. Carichner, Fundamentals of Aircraft and Airship
Design: Volume 1 Aircraft Design, AIAA Education Series, AIAA,2010.
[25] H. Chevalier, Model Airplane Design and Performance for the Mod-eler, Challenge Engineering, New Baden, TX, 1993.
[26] C. L. Needham, Sailplanes Their Design, Construction and Pilotage,Chapman and Hall Ltd., 1937.
[27] F. Thomas, Fundamentals of Sailplane Design, College Park Press,1999.
[28] J. Gundlach, R. J. Foch, Unmanned Aircraft Systems Innovation atthe Naval Research Laboratory, Library of Flight, American Insti-tute of Aeronautics and Astronautics, Reston , VA, 2014. doi:10.2514/4.102592.
[29] A. Chaput, Conceptual design of unmanned aircraft systems, Tech.rep., Kansas University Continuing Education (2007).
[30] S. Gudmundsson, General Aviation Aircraft Design: Applied Meth-ods and Procedures, Elsevier, Waltham, MA, 2014.
[31] Z. Yi, W. Heping, A study of structure weight estimating for highaltitude long endurence (hale) unmanned aerial vehicle (uav), in:25th International Congress of the Aeronautical Sciences, Hamburg,Germany, 2006.
[32] M. Bailey, M. Bower, High altitude solar power platform, Tech. rep.,NASA-TM-103578 (1992).
[33] C. Roessler, Conceptual design of unmanned aircraft with fuel cellpropulsion system, Ph.D. thesis, Lehrstuhl fuer Luftfahrtsysteme,Technical University Munich (2012).
[34] R. MacNeill, D. Verstraete, Propeller optimisation for anelectrically-powered tactical uas, in: Proceedings of the 31st
Congress of the International Council of the Aeronautical Sciences,Belo Horizonte, Brasil, 2018.
[35] A. Noth, Design of solar powered airplanes for continuous flight,Ph.D. thesis, ETH Zurich (2008).
[36] M. McCrink, J. W. Gregory, Range and Endurance Estimation forLow-Re Electric UAS, American Institute of Aeronautics and As-tronautics, 2017.
[37] J. T. Lowry, Performance of Light Aircraft, AIAA Education Series,AIAA, 1999.
[38] Selig. Uiuc propeller database [online] (2016) [cited June 2016].[39] M. Simons, Model Aircraft Aerodynamics, 4th Edition, Special In-
terest Model Books, 1999.[40] S. Menon, C. P. Cadou, Scaling of miniature piston-engine perfor-
mance, part 1: Overall engine performance, Journal of Propulsionand Power 29 (4) (2013) 774–787.
[41] E. Sher, I. Sher, Theoretical limits of scaling-down internal com-bustion engines, Chemical Engineering Science 66 (3) (2011) 260 –267.
13

DRIES VERSTRAETE
[42] J. K. Ausserer, Integration, testing, and validation of small hybrid-electric remotely-piloted aircraft, Master’s thesis, Air Force Insti-tute of Technology (2012).
[43] S. C. Crosbie, Increasing reliability of a small 2-stroke internal com-bustion engine for dynamically changing altitudes, Master’s thesis,Air Force Institute of Technology (2012).
[44] F. G. Harmon, Neural network control of a parallel hybrid-electricpropulsion system for a small unmanned aerial vehicle, Ph.D. thesis,University of California, Davis (2005).
[45] R. M. Hiserote, Analysis of hybrid-electric propulsion system de-signs for small unmanned aircraft systems, Master’s thesis, AirForce Institute of Technology (2010).
[46] I. H. Mengistu, Small internal combustion engine testing for ahybrid-electric remotely-piloted aircraft, Master’s thesis, Air ForceInstitute of Technology (2011).
[47] N. L. Moulton, Performance measurement and simulation of a smallinternal combustion engine, Master’s thesis, University of Maryland(2007).
[48] A. Ravi, A. S. Arena, Uav power plant performance evaluation, in:Proceedings of the 49th AIAA Aerospace Sciences Meeting includ-ing the New Horizons Forum and Aerospace Exposition, no. AIAA-2011-1263, 2011.
[49] S. P. Hendrickson, A miniature powerplant for very small, very longrange autonomous aircraft, Tech. rep., The Insitu Group, Final Re-port to the United States Department of Energy (1999).
[50] K. B. Wipke, M. R. Cuddy, S. D. Burch, Advisor 2.1: a user-friendly advanced powertrain simulation using a combined back-ward/forward approach, IEEE Transactions on Vehicular Technol-ogy 48 (6) (1999) 1751–1761.
[51] T. Markel, A. Brooker, T. Hendricks, V. Johnson, K. Kelly,B. Kramer, M. O’Keefe, S. Sprik, K. Wipke, Advisor: a sys-tems analysis tool for advanced vehicle modeling, Journal of PowerSources 110 (2) (2002) 255 – 266.
[52] D. Stinton, The Design of the Aeroplane, 2nd Edition, BlackwellScientific, 2001.
[53] E. D. Wachsman, K. T. Lee, Lowering the temperature of solid oxidefuel cells, Science 334 (2011) 935–939.
[54] Oak Ridge National Laboratory, Status and Prospects of the GlobalAutomotive Fuel Cell Industry and Plans for Deployment of FuelCell Vehicles and Hydrogen Refueling Infrastructure.
[55] T. Lukaczyk, A. D. Wendor, E. Botero, T. MacDonald, T. Momose,A. Variyar, J. M. Vegh, M. Colonno, T. D. Economon, J. J. Alonso,Suave: An open-source environment for multi-fidelity conceptualvehicle design, in: Proceedings of the 16th AIAA/ISSME Multidis-ciplinary Analysis and Optimization Conference, no. AIAA-2015-3087, 2015.
[56] O. J. Murphy, A. Cisar, E. Clarke, Low-cost light weight high powerdensity pem fuel cell stack, Electrochimica Acta 43 (24) (1998)3829–3840.
[57] S. G. Chalk, J. F. Miller, Key challenges and recent progress in bat-teries, fuel cells, and hydrogen storage for clean energy systems,Journal of Power Sources 159 (2006) 73–80.
[58] Horizon Energy Systems. Horizon Energy Systems Aeropak Spec-ifications [online] (2016) [cited February 2016].
[59] I. L. Sarioglu, B. Czapnik, E. Bostanci, O. P. Klein, H. Schroeder,F. Kucukay, Optimum design of a fuel-cell powertrain based onmultiple design criteria, Journal of Power Sources 266 (2014) 7–21.
[60] Hydrogenics, Hypm-hd power modules for light and heavy dutymobility, Tech. rep., Hydrogenics (2016).
[61] V. Chang, J. Gallman, Altitude testing of fuel cell systems for air-craft applications, in: Proceedings of the Power Systems Confer-ence, SAE Technical Paper 2004-01-3200, SAE Technical Paper2004-01-3200, 2004.
[62] J. Larminie, A. Dicks, Fuel Cell Systems Explained, 2nd Edition,Wiley, 2003.
[63] R. Stroman, M. Schuette, Design challenges and modeling foran efficient liquid hydrogen storage tank for autonomous systems,11AIChE - 2011 AIChE Annual Meeting, Conference Proceedings.
[64] K. Swider-Lyons, J. Mackrell, J. Rodgers, G. Page, M. Schuette,R. Stroman, Hydrogen fuel cell propulsion for long endurance small
UAVs, AIAA Centennial of Naval Aviation Forum "100 Years ofAchievement and Progress".
[65] K. Swider-Lyons, R. Stroman, J. Rodgers, D. Edwards, J. Mack-rell, M. Schuette, G. Page, Liquid hydrogen fuel system for smallunmanned air vehicles, 51st AIAA Aerospace Sciences Meeting in-cluding the New Horizons Forum and Aerospace Exposition 2013.
[66] A. Züttel, Hydrogen storage methods, Naturwissenschaften 91 (4)(2004) 157–172.
[67] R. O. Stroman, M. W. Schuette, K. Swider-Lyons, J. A. Rodgers,D. J. Edwards, Liquid hydrogen fuel system design and demonstra-tion in a small long endurance air vehicle, International Journal ofHydrogen Energy 39 (21) (2014) 11279–11290.
[68] P. Adam, J. Leachman, Design of a reconfigurable liquid hydrogenfuel tank for use in the Genii unmanned aerial vehicle, Transactionsof the Cryogenic Engineering Conference-CEC: Advances in Cryo-genic Engineering 1573 (1) (2014) 1299–1304.
Contact Author Email Address
Copyright Statement
The authors confirm that they, and/or their companyor organization, hold copyright on all of the origi-nal material included in this paper. The authors alsoconfirm that they have obtained permission, from thecopyright holder of any third party material includedin this paper, to publish it as part of their paper. Theauthors confirm that they give permission, or have ob-tained permission from the copyright holder of thispaper, for the publication and distribution of this pa-per as part of the ICAS proceedings or as individualoff-prints from the proceedings.
14


![MULTI-DISCIPLINARY OPTIMISATION OF MEDIUM ALTITUDE …€¦ · [16, 17]. Trimmed lift and drag data is gener-ated for all flight conditions as input for the mis-sion performance](https://img.pdfslide.net/doc/110x75/5f19ac1ce899eb28f9785bb8/multi-disciplinary-optimisation-of-medium-altitude-16-17-trimmed-lift-and-drag.jpg)