Embed Size (px)
Citation preview
Multichannel Analysis of Surface Waves (MASW) for Offshore Geotechnical Investigations
McGrath, T.1, O’Connor, P.
2, Trafford, A.
2, Long, M.
1
1School of Civil, Structural & Environmental Engineering, University College Dublin,
2 APEX Geoservices Limited, Knockmullen Business Park, Gorey, Wexford, Ireland
Equipment
Numerous components were required for use in the field trials of offshore MASW. A 12cu.in MINI
G air gun (Figure 4) and a 40cu.in MINI G air gun acted as pneumatic sources and later used to
compare frequency ranges produced by air guns of different capacity. This was accompanied by a
source controller unit which managed the triggering functions of the air guns. High pressure air
was provided using dive cylinders and a regulating manifold to maintain a working pressure of
100bar. The receivers for data collection consisted of a Geometrics DHA-7 24 channel hydrophone
cable (figure 5), which was laid on the sea bed to record the transmitted surface waves, and was
connected to a Geode seismograph (figure 6(b)). The seismograph converted the recorded data
and transferred it to a computer for on site review and processing where possible.
To access the designated sites in Dublin Bay, INFOMAR agreed to hire one of their research ves-
sels, the R.V. Geo, for the first set of trials to be conducted in Dublin Bay. With the aid of its experi-
enced crew and their relevant knowledge, a suitable equipment setup and method of deployment/
recovery was quickly determined and successfully tested. See Figure 3 for final set up.
Site
The first stage of offshore practical work was performed in various locations in Dublin Bay (Figure
1), analysing numerous line segments, to ensure a comprehensive survey of the site and to max-
imise the quality of the data obtained.
An arbitrary area was chosen in a shallow, sheltered area to the west of Dun Laoghaire Harbour
for testing the equipment configuration and deployment/recovery procedures. Some trials were al-
so performed in the intertidal zone at Dollymount, to be used for comparison with a traditional on-
shore MASW investigation. Finally the primary area for investigation consists of two lines of bore-
holes, both extending from South Bull Wall by the Poolbeg Generating station. The first line ex-
tends from west to east, while the second is in a more south-easterly direction.
These site locations were chosen as a good variety of subsurface layers with varying soil and
properties is present, determined from good pre-existing geotechnical data for the area, which has
been supplied by Geological Survey Ireland.
Data Processing
Having completed the field trials, the focus of the project switched to processing the data. SurfSeis 4.0 Seismic
Processing Software was required as a package capable of MASW processing. It’s processes include reading
seismic recordings and producing a dispersion plot. The investigator would use this plot to pick a suitable dis-
persion curve (usually only the fundamental curve was visible in the plot) which the software would then per-
form an inversion upon to produce a curve of shear wave velocity (Vs) in ms-1
versus depth in metres. To
demonstrate the effectiveness of these curves all SPT values taken from the boreholes were converted to
small strain shear modulus values (Gmax), using curves produced by M.A. Stroud (the Penetration Test—Its Ap-
plications and Interpretation, 1989). These in turn were converted these to shear wave velocities using the for-
mula: Gmax = ρVs2.
Acknowledgements
This project is funded by the Irish Shelf Petroleum Studies Group (ISPSG) of the Irish Petroleum Infrastructure Programme (PIP) Group 4. The ISPSG comprises: Atlantic Petroleum (Ireland) Ltd, Cairn Energy Plc, Chrysaor E&P Ireland Ltd, Chevron North Sea Limited, ENI Ireland BV, Europa Oil and Gas (Holdings) Plc, ExxonMobil E&P Ireland (Offshore) Ltd, Kosmos Energy LLC, Maersk Oil North Sea UK Ltd, Petroleum Affairs Division of the Department of Communications, Energy and Natural Resources, Providence Resources Plc, Repsol Exploración SA, San Leon Energy Plc, Serica Energy Plc, Shell E&P Ireland Ltd, Sosina Exploration Ltd, Statoil (UK) Ltd, Tullow Oil Plc and Woodside Energy (Ireland) Pty Ltd.
Objectives
To generate shear wave profiles from collected data
To determine small strain shear modulus values
To compare these results with data obtained from borehole measurements throughout the test sites
To identify limitations for using MASW in marine environments (e.g. noise)
To investigate the feasibility of stationary and/or mobile MASW Figure 2: INFOMAR’s R.V. Geo
Figure 1: Dublin Bay site locations
Figure 3: Stage 1 survey set up
Borehole and Offshore MASW Comparison Testing Site
Preliminary Testing Area
Onshore vs Offshore Testing Site
Dun Laoghaire Harbour
Figure 6: (a) Computer, (b) Geode Seismograph, (c) MINI G Source controller
Figure 5: Geometrics DHA-7 hydrophone cable
a
b
c
Figure 4: 12cu.in MIN G air gun
Results and Conclusions
Figure 7 illustrates a seismic recording produced from offshore
field trials. While this shot recording appears to have a significant
amount of noise, when compared to a traditional onshore MASW
shot, the surface waves are still clearly evident running through
the recording. It should be noted that unlike onshore MASW there
is no clear evidence of the P-wave arrivals as these have been
masked by the higher amplitudes of the direct wave and air wave.
Many of the dispersions curves produced look similar to that in
figure 8, with good amplitude and a frequency range from as low
as 6Hz to as high as 30 Hz, allowing for more confidence and
penetration depth.
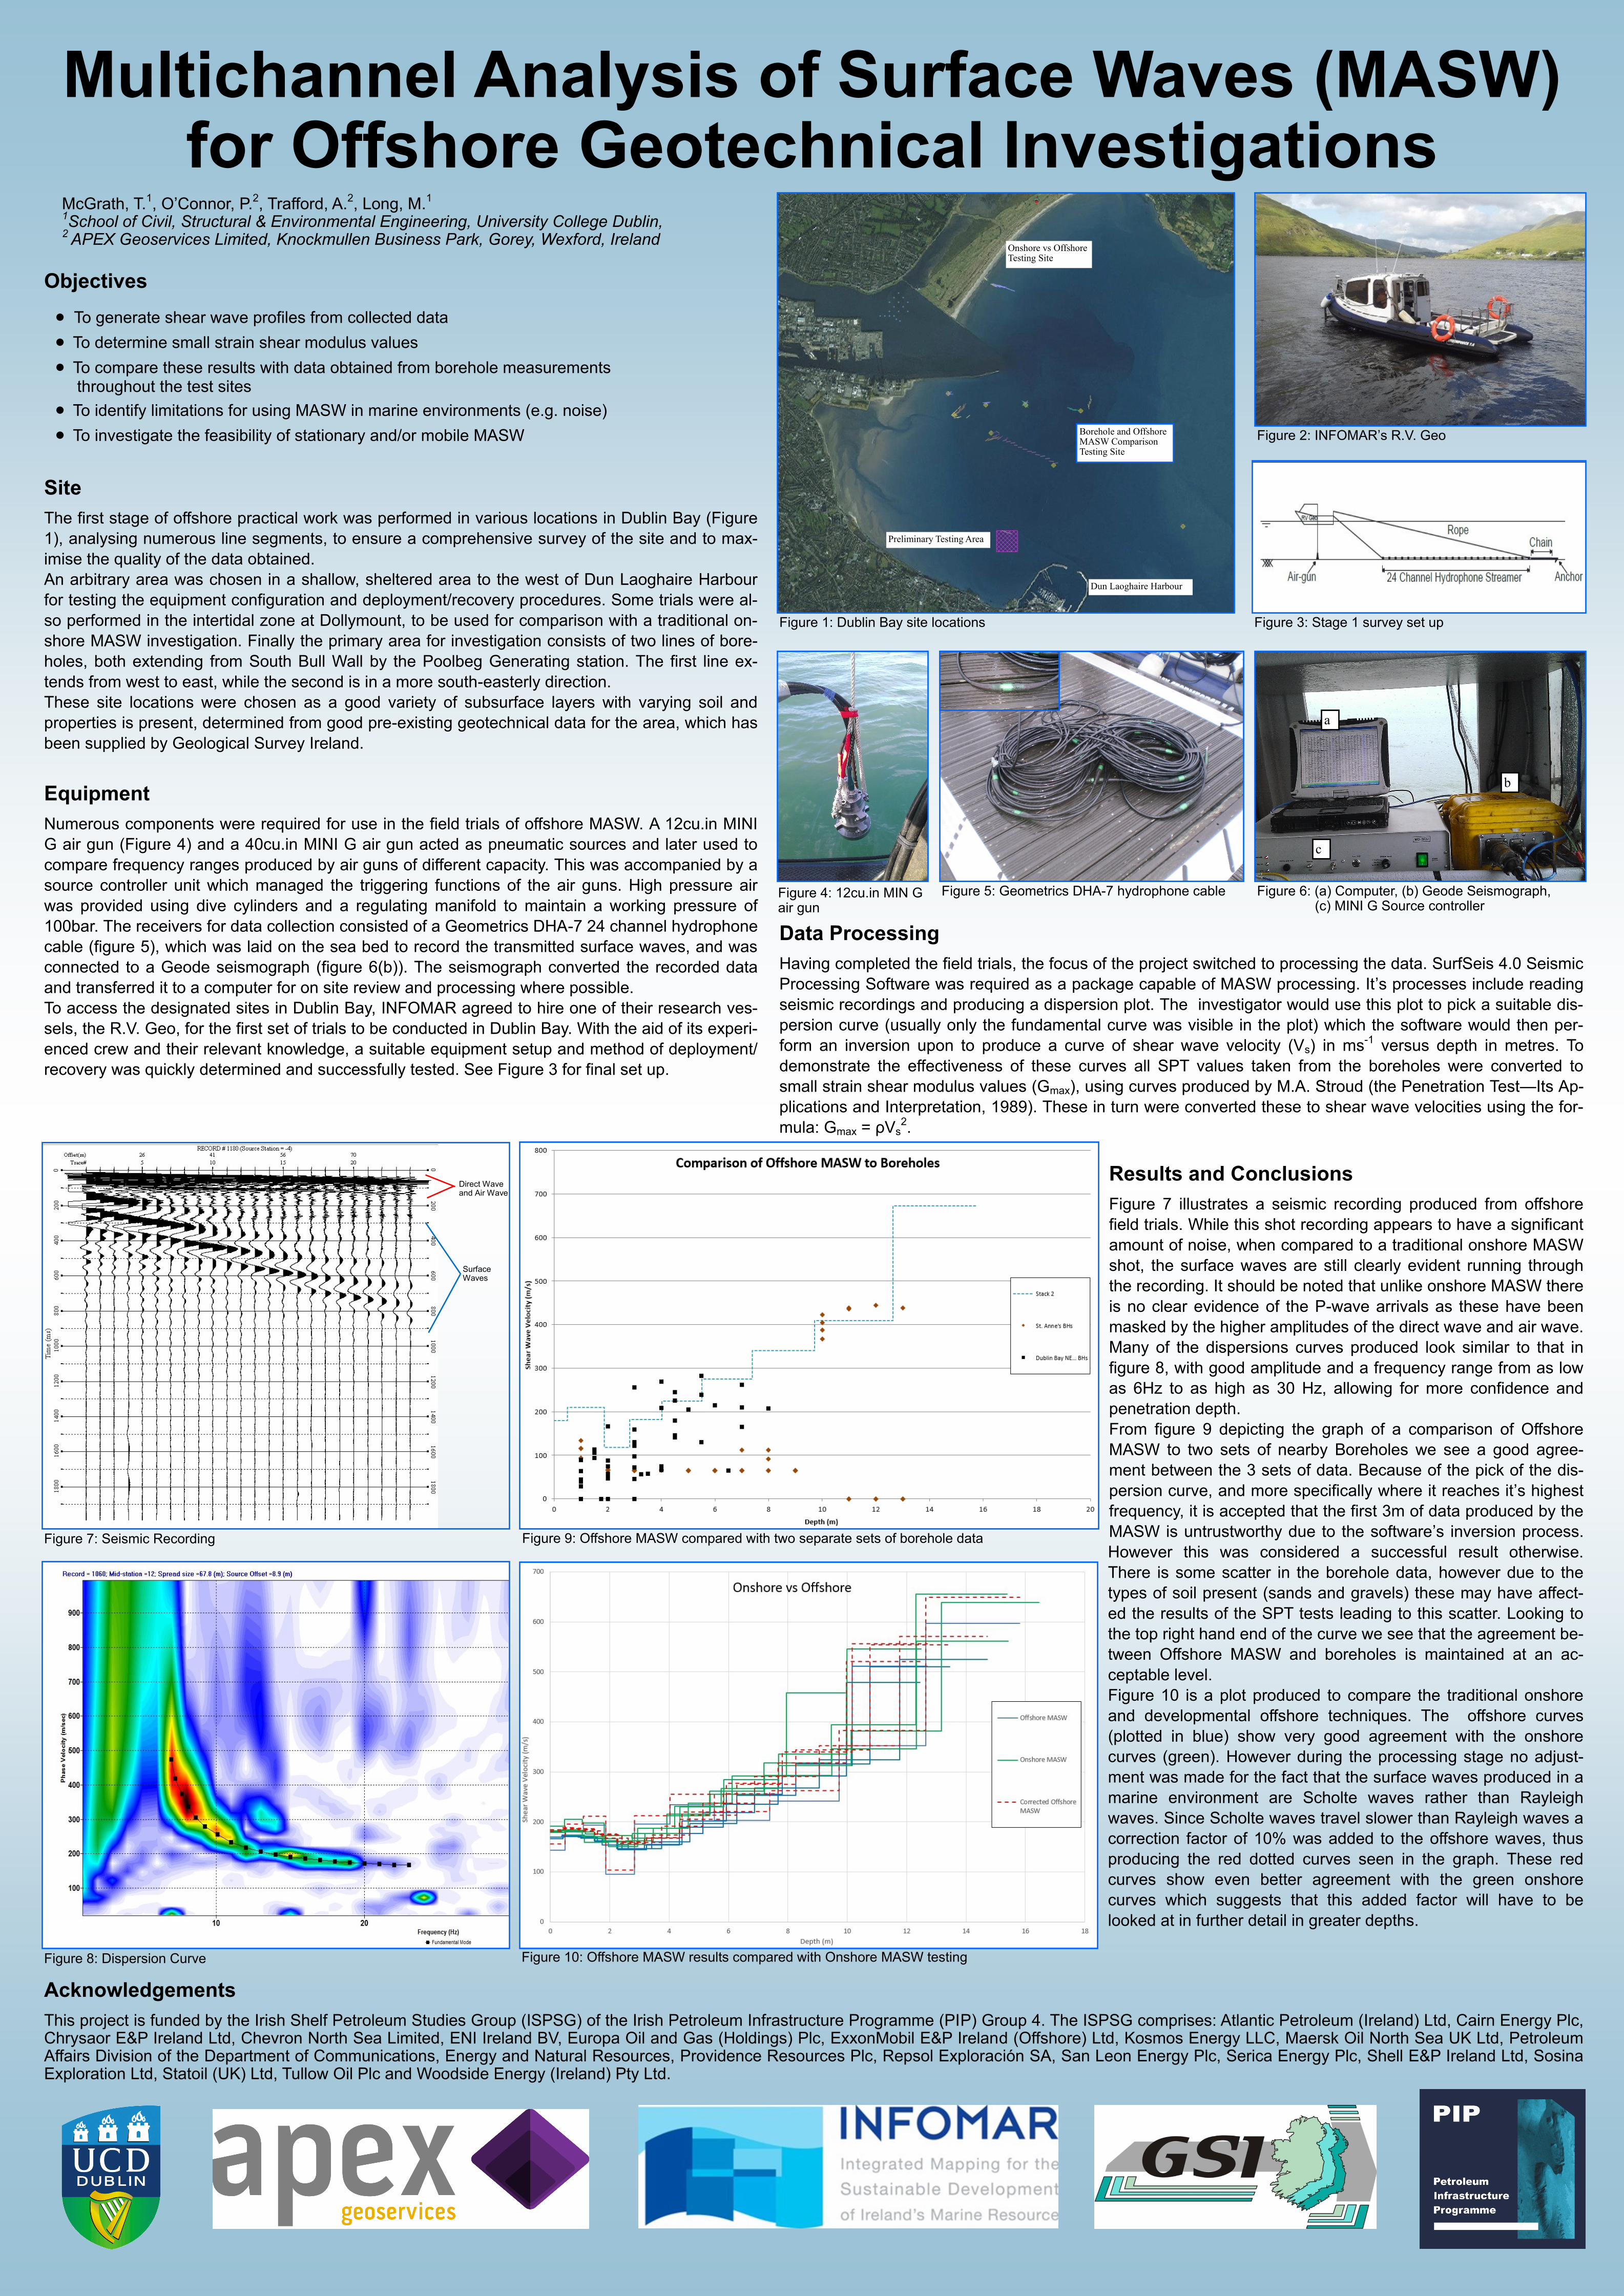
From figure 9 depicting the graph of a comparison of Offshore
MASW to two sets of nearby Boreholes we see a good agree-
ment between the 3 sets of data. Because of the pick of the dis-
persion curve, and more specifically where it reaches it’s highest
frequency, it is accepted that the first 3m of data produced by the
MASW is untrustworthy due to the software’s inversion process.
However this was considered a successful result otherwise.
There is some scatter in the borehole data, however due to the
types of soil present (sands and gravels) these may have affect-
ed the results of the SPT tests leading to this scatter. Looking to
the top right hand end of the curve we see that the agreement be-
tween Offshore MASW and boreholes is maintained at an ac-
ceptable level.
Figure 10 is a plot produced to compare the traditional onshore
and developmental offshore techniques. The offshore curves
(plotted in blue) show very good agreement with the onshore
curves (green). However during the processing stage no adjust-
ment was made for the fact that the surface waves produced in a
marine environment are Scholte waves rather than Rayleigh
waves. Since Scholte waves travel slower than Rayleigh waves a
correction factor of 10% was added to the offshore waves, thus
producing the red dotted curves seen in the graph. These red
curves show even better agreement with the green onshore
curves which suggests that this added factor will have to be
looked at in further detail in greater depths. Figure 10: Offshore MASW results compared with Onshore MASW testing
Figure 9: Offshore MASW compared with two separate sets of borehole data
Figure 8: Dispersion Curve
Figure 7: Seismic Recording
Direct Wave and Air Wave
Surface Waves