Embed Size (px)
Citation preview
(1 of 11) 1700349© 2017 Wiley-VCH Verlag GmbH & Co. KGaA, Weinheim www.small-journal.com
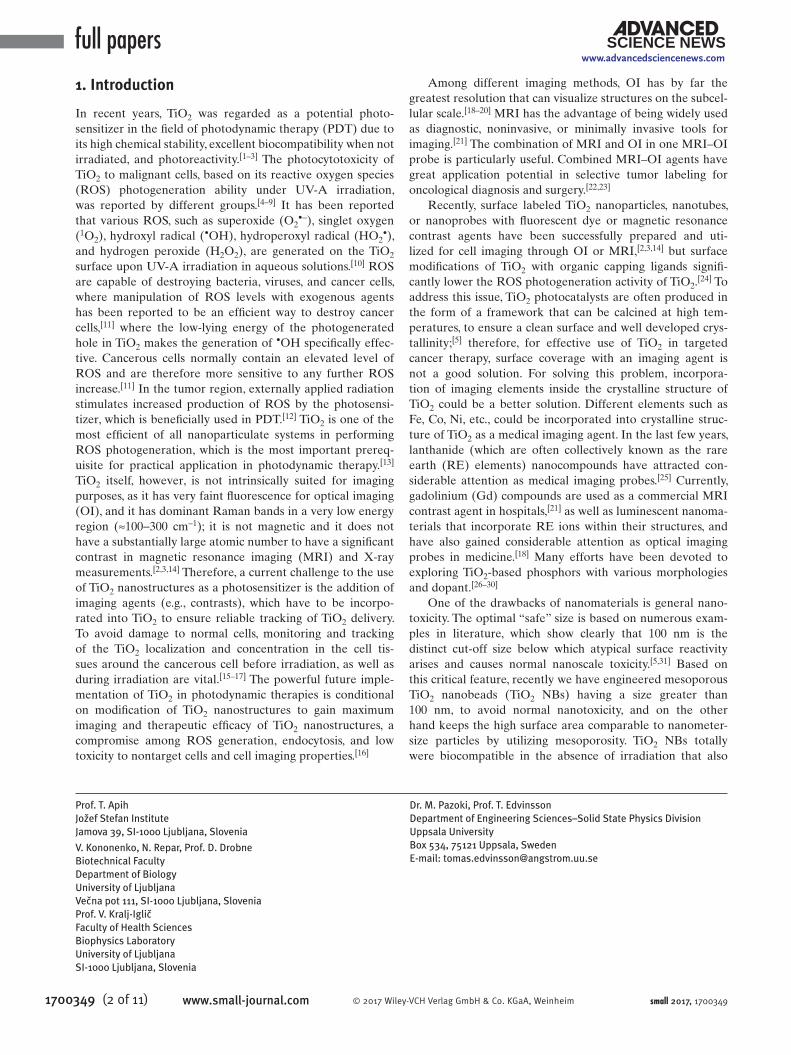
Multifunctional Gadolinium-Doped Mesoporous TiO2 Nanobeads: Photoluminescence, Enhanced Spin Relaxation, and Reactive Oxygen Species Photogeneration, Beneficial for Cancer Diagnosis and Treatment
Roghayeh Imani, Ralf Dillert, Detlef W. Bahnemann, Meysam Pazoki, Tomaz Apih, Veno Kononenko, Neza Repar, Veronika Kralj-Iglic, Gerrit Boschloo, Damjana Drobne, Tomas Edvinsson,* and Ales Iglic*
DOI: 10.1002/smll.201700349
Materials with controllable multifunctional abilities for optical imaging (OI) and magnetic resonant imaging (MRI) that also can be used in photodynamic therapy are very interesting for future applications. Mesoporous TiO2 sub-micrometer particles are doped with gadolinium to improve photoluminescence functionality and spin relaxation for MRI, with the added benefit of enhanced generation of reactive oxygen species (ROS). The Gd-doped TiO2 exhibits red emission at 637 nm that is beneficial for OI and significantly improves MRI relaxation times, with a beneficial decrease in spin–lattice and spin–spin relaxation times. Density functional theory calculations show that Gd3+ ions introduce impurity energy levels inside the bandgap of anatase TiO2, and also create dipoles that are beneficial for charge separation and decreased electron–hole recombination in the doped lattice. The Gd-doped TiO2 nanobeads (NBs) show enhanced ability for ROS monitored via •OH radical photogeneration, in comparison with undoped TiO2 nanobeads and TiO2 P25, for Gd-doping up to 10%. Cellular internalization and biocompatibility of TiO2@xGd NBs are tested in vitro on MG-63 human osteosarcoma cells, showing full biocompatibility. After photoactivation of the particles, anticancer trace by means of ROS photogeneration is observed just after 3 min irradiation.
Photocatalysis
Dr. R. Imani, Prof. R. Dillert, Prof. D. W. BahnemannInstitut fuer Technische ChemieGottfried Wilhelm Leibniz Universitaet HannoverCallinstrasse 3, D-30167 Hannover, Germany
Dr. R. Imani, Prof. G. BoschlooDepartment of Chemistry–Physical Chemistry Division
Ångström LaboratoryUppsala UniversityBox 523, Lägerhyddsvägen 1, 75120 Uppsala, Sweden
Dr. R. Imani, Prof. A. IglicFaculty of Electrical EngineeringBiophysics LaboratoryUniversity of Ljubljana SI-1000, SloveniaE-mail: [email protected]
Prof. R. DillertLaboratory of Nano and Quantum EngineeringUniversity of HannoverSchneiderberg 39, 30167 Hannover, Germany
Prof. D. W. BahnemannLaboratory “Photoactive Nanocomposite Materials”Saint-Petersburg State UniversitySaint-Petersburg 198504, Russia
Dr. M. PazokiDepartment of Chemistry–Structural Chemistry DivisionÅngström Laboratory, Uppsala UniversityBox 538, Lägerhyddsvägen 1, 75120 Uppsala, Sweden
small 2017, 1700349
www.advancedsciencenews.com
full papers
1700349 (2 of 11) www.small-journal.com © 2017 Wiley-VCH Verlag GmbH & Co. KGaA, Weinheim
1. Introduction
In recent years, TiO2 was regarded as a potential photosensitizer in the field of photodynamic therapy (PDT) due to its high chemical stability, excellent biocompatibility when not irradiated, and photoreactivity.[1–3] The photocytotoxicity of TiO2 to malignant cells, based on its reactive oxygen species (ROS) photogeneration ability under UVA irradiation, was reported by different groups.[4–9] It has been reported that various ROS, such as superoxide (O2
•−), singlet oxygen (1O2), hydroxyl radical (•OH), hydroperoxyl radical (HO2
•), and hydrogen peroxide (H2O2), are generated on the TiO2 surface upon UVA irradiation in aqueous solutions.[10] ROS are capable of destroying bacteria, viruses, and cancer cells, where manipulation of ROS levels with exogenous agents has been reported to be an efficient way to destroy cancer cells,[11] where the lowlying energy of the photogenerated hole in TiO2 makes the generation of •OH specifically effective. Cancerous cells normally contain an elevated level of ROS and are therefore more sensitive to any further ROS increase.[11] In the tumor region, externally applied radiation stimulates increased production of ROS by the photosensitizer, which is beneficially used in PDT.[12] TiO2 is one of the most efficient of all nanoparticulate systems in performing ROS photogeneration, which is the most important prerequisite for practical application in photodynamic therapy.[13] TiO2 itself, however, is not intrinsically suited for imaging purposes, as it has very faint fluorescence for optical imaging (OI), and it has dominant Raman bands in a very low energy region (≈100−300 cm−1); it is not magnetic and it does not have a substantially large atomic number to have a significant contrast in magnetic resonance imaging (MRI) and Xray measurements.[2,3,14] Therefore, a current challenge to the use of TiO2 nanostructures as a photosensitizer is the addition of imaging agents (e.g., contrasts), which have to be incorporated into TiO2 to ensure reliable tracking of TiO2 delivery. To avoid damage to normal cells, monitoring and tracking of the TiO2 localization and concentration in the cell tissues around the cancerous cell before irradiation, as well as during irradiation are vital.[15–17] The powerful future implementation of TiO2 in photodynamic therapies is conditional on modification of TiO2 nanostructures to gain maximum imaging and therapeutic efficacy of TiO2 nanostructures, a compromise among ROS generation, endocytosis, and low toxicity to nontarget cells and cell imaging properties.[16]
Among different imaging methods, OI has by far the greatest resolution that can visualize structures on the subcellular scale.[18–20] MRI has the advantage of being widely used as diagnostic, noninvasive, or minimally invasive tools for imaging.[21] The combination of MRI and OI in one MRI–OI probe is particularly useful. Combined MRI–OI agents have great application potential in selective tumor labeling for oncological diagnosis and surgery.[22,23]
Recently, surface labeled TiO2 nanoparticles, nanotubes, or nanoprobes with fluorescent dye or magnetic resonance contrast agents have been successfully prepared and utilized for cell imaging through OI or MRI,[2,3,14] but surface modifications of TiO2 with organic capping ligands significantly lower the ROS photogeneration activity of TiO2.
[24] To address this issue, TiO2 photocatalysts are often produced in the form of a framework that can be calcined at high temperatures, to ensure a clean surface and well developed crystallinity;[5] therefore, for effective use of TiO2 in targeted cancer therapy, surface coverage with an imaging agent is not a good solution. For solving this problem, incorporation of imaging elements inside the crystalline structure of TiO2 could be a better solution. Different elements such as Fe, Co, Ni, etc., could be incorporated into crystalline structure of TiO2 as a medical imaging agent. In the last few years, lanthanide (which are often collectively known as the rare earth (RE) elements) nanocompounds have attracted considerable attention as medical imaging probes.[25] Currently, gadolinium (Gd) compounds are used as a commercial MRI contrast agent in hospitals,[21] as well as luminescent nanomaterials that incorporate RE ions within their structures, and have also gained considerable attention as optical imaging probes in medicine.[18] Many efforts have been devoted to exploring TiO2based phosphors with various morphologies and dopant.[26–30]
One of the drawbacks of nanomaterials is general nanotoxicity. The optimal “safe” size is based on numerous examples in literature, which show clearly that 100 nm is the distinct cutoff size below which atypical surface reactivity arises and causes normal nanoscale toxicity.[5,31] Based on this critical feature, recently we have engineered mesoporous TiO2 nanobeads (TiO2 NBs) having a size greater than 100 nm, to avoid normal nanotoxicity, and on the other hand keeps the high surface area comparable to nanometersize particles by utilizing mesoporosity. TiO2 NBs totally were biocompatible in the absence of irradiation that also
Prof. T. ApihJozef Stefan InstituteJamova 39, SI-1000 Ljubljana, Slovenia
V. Kononenko, N. Repar, Prof. D. DrobneBiotechnical FacultyDepartment of BiologyUniversity of LjubljanaVecna pot 111, SI-1000 Ljubljana, SloveniaProf. V. Kralj-IglicFaculty of Health SciencesBiophysics LaboratoryUniversity of LjubljanaSI-1000 Ljubljana, Slovenia
Dr. M. Pazoki, Prof. T. EdvinssonDepartment of Engineering Sciences–Solid State Physics DivisionUppsala UniversityBox 534, 75121 Uppsala, SwedenE-mail: [email protected]
small 2017, 1700349
www.advancedsciencenews.com
(3 of 11) 1700349© 2017 Wiley-VCH Verlag GmbH & Co. KGaA, Weinheim www.small-journal.com
possesses a high ability for ROS photogeneration and cancer cell destruction under UVA irradiation.[5,32] Here we report doping of TiO2 NBs with the rare earth element Gd to add multifunctional OI–MRI properties, as well enhanced ROS photogeneration capacity to the TiO2 NBs.
The photocatalytic activities of the TiO2@xGd NBs in terms of ROS photogeneration were quantified via •OH radical measurement with fluorescence probe and compared with a standard TiO2 powder (P25). The details of the bandgap states introduced by the Gddoping, and the consequences for the photoluminescence (PL) and photo catalytic enhancement are investigated and supported by density functional theory (DFT) calculations. Finally, the MG63 in vitro cell culture was used to study the internalization potential and cytotoxicity of TiO2@xGd NBs. We discuss the advantage of TiO2@xGd NBs for simultaneous imaging and PDT of cancer cells. Data presented here, proving a notable biocompatibility and multifunctionality of TiO2@xGd NBs for cancer diagnosis and treatment, are very interesting for future applications.
2. Results and Discussion
2.1. Morphological and Structural Description of TiO2@xGd NBs
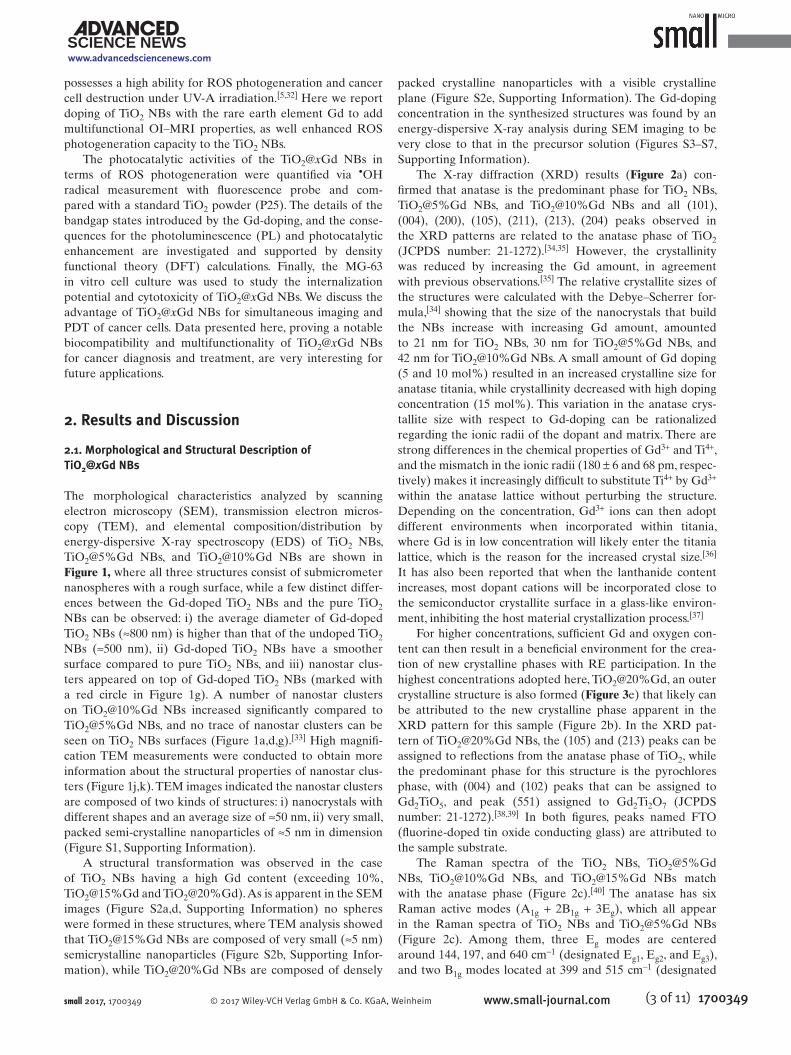
The morphological characteristics analyzed by scanning electron microscopy (SEM), transmission electron microscopy (TEM), and elemental composition/distribution by energydispersive Xray spectroscopy (EDS) of TiO2 NBs, TiO2@5%Gd NBs, and TiO2@10%Gd NBs are shown in Figure 1, where all three structures consist of submicrometer nanospheres with a rough surface, while a few distinct differences between the Gddoped TiO2 NBs and the pure TiO2 NBs can be observed: i) the average diameter of Gddoped TiO2 NBs (≈800 nm) is higher than that of the undoped TiO2 NBs (≈500 nm), ii) Gddoped TiO2 NBs have a smoother surface compared to pure TiO2 NBs, and iii) nanostar clusters appeared on top of Gddoped TiO2 NBs (marked with a red circle in Figure 1g). A number of nanostar clusters on TiO2@10%Gd NBs increased significantly compared to TiO2@5%Gd NBs, and no trace of nanostar clusters can be seen on TiO2 NBs surfaces (Figure 1a,d,g).[33] High magnification TEM measurements were conducted to obtain more information about the structural properties of nanostar clusters (Figure 1j,k). TEM images indicated the nanostar clusters are composed of two kinds of structures: i) nanocrystals with different shapes and an average size of ≈50 nm, ii) very small, packed semicrystalline nanoparticles of ≈5 nm in dimension (Figure S1, Supporting Information).
A structural transformation was observed in the case of TiO2 NBs having a high Gd content (exceeding 10%, TiO2@15%Gd and TiO2@20%Gd). As is apparent in the SEM images (Figure S2a,d, Supporting Information) no spheres were formed in these structures, where TEM analysis showed that TiO2@15%Gd NBs are composed of very small (≈5 nm) semicrystalline nanoparticles (Figure S2b, Supporting Information), while TiO2@20%Gd NBs are composed of densely
packed crystalline nanoparticles with a visible crystalline plane (Figure S2e, Supporting Information). The Gddoping concentration in the synthesized structures was found by an energydispersive Xray analysis during SEM imaging to be very close to that in the precursor solution (Figures S3–S7, Supporting Information).
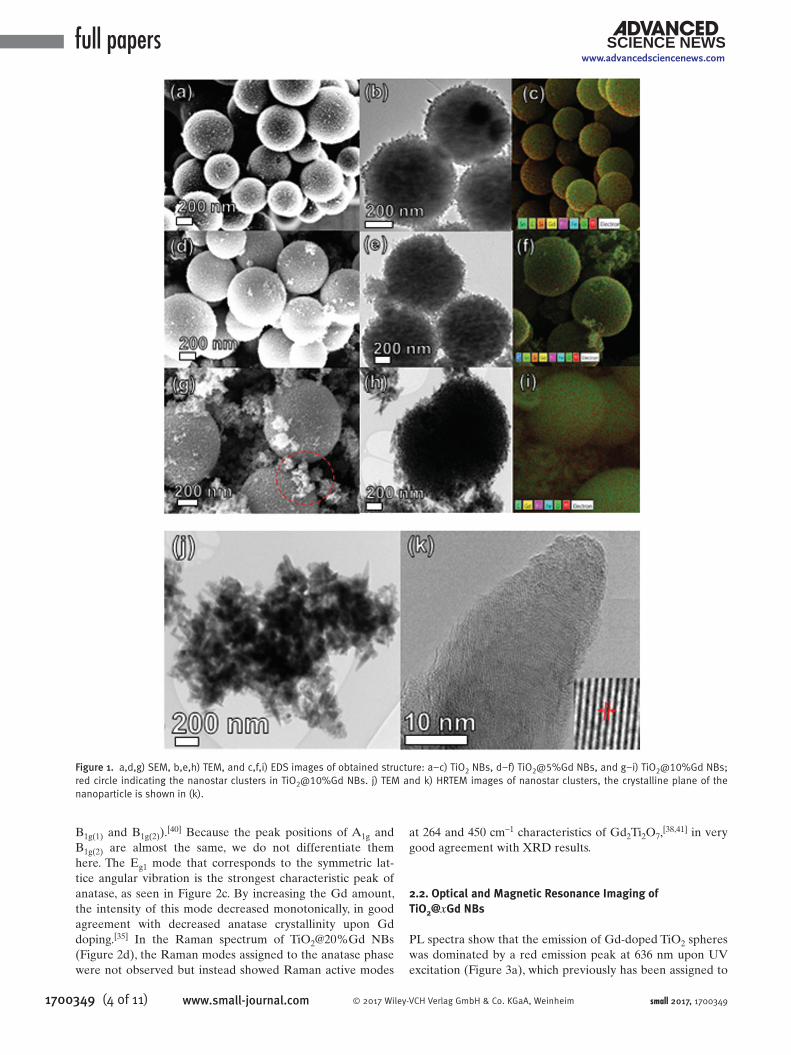
The Xray diffraction (XRD) results (Figure 2a) confirmed that anatase is the predominant phase for TiO2 NBs, TiO2@5%Gd NBs, and TiO2@10%Gd NBs and all (101), (004), (200), (105), (211), (213), (204) peaks observed in the XRD patterns are related to the anatase phase of TiO2 (JCPDS number: 211272).[34,35] However, the crystallinity was reduced by increasing the Gd amount, in agreement with previous observations.[35] The relative crystallite sizes of the structures were calculated with the Debye–Scherrer formula,[34] showing that the size of the nanocrystals that build the NBs increase with increasing Gd amount, amounted to 21 nm for TiO2 NBs, 30 nm for TiO2@5%Gd NBs, and 42 nm for TiO2@10%Gd NBs. A small amount of Gd doping (5 and 10 mol%) resulted in an increased crystalline size for anatase titania, while crystallinity decreased with high doping concentration (15 mol%). This variation in the anatase crystallite size with respect to Gddoping can be rationalized regarding the ionic radii of the dopant and matrix. There are strong differences in the chemical properties of Gd3+ and Ti4+, and the mismatch in the ionic radii (180 ± 6 and 68 pm, respectively) makes it increasingly difficult to substitute Ti4+ by Gd3+ within the anatase lattice without perturbing the structure. Depending on the concentration, Gd3+ ions can then adopt different environments when incorporated within titania, where Gd is in low concentration will likely enter the titania lattice, which is the reason for the increased crystal size.[36] It has also been reported that when the lanthanide content increases, most dopant cations will be incorporated close to the semiconductor crystallite surface in a glasslike environment, inhibiting the host material crystallization process.[37]
For higher concentrations, sufficient Gd and oxygen content can then result in a beneficial environment for the creation of new crystalline phases with RE participation. In the highest concentrations adopted here, TiO2@20%Gd, an outer crystalline structure is also formed (Figure 3e) that likely can be attributed to the new crystalline phase apparent in the XRD pattern for this sample (Figure 2b). In the XRD pattern of TiO2@20%Gd NBs, the (105) and (213) peaks can be assigned to reflections from the anatase phase of TiO2, while the predominant phase for this structure is the pyrochlores phase, with (004) and (102) peaks that can be assigned to Gd2TiO5, and peak (551) assigned to Gd2Ti2O7 (JCPDS number: 211272).[38,39] In both figures, peaks named FTO (fluorinedoped tin oxide conducting glass) are attributed to the sample substrate.
The Raman spectra of the TiO2 NBs, TiO2@5%Gd NBs, TiO2@10%Gd NBs, and TiO2@15%Gd NBs match with the anatase phase (Figure 2c).[40] The anatase has six Raman active modes (A1g + 2B1g + 3Eg), which all appear in the Raman spectra of TiO2 NBs and TiO2@5%Gd NBs (Figure 2c). Among them, three Eg modes are centered around 144, 197, and 640 cm−1 (designated Eg1, Eg2, and Eg3), and two B1g modes located at 399 and 515 cm−1 (designated
small 2017, 1700349
www.advancedsciencenews.com
full papers
1700349 (4 of 11) www.small-journal.com © 2017 Wiley-VCH Verlag GmbH & Co. KGaA, Weinheim
B1g(1) and B1g(2)).[40] Because the peak positions of A1g and B1g(2) are almost the same, we do not differentiate them here. The Eg1 mode that corresponds to the symmetric lattice angular vibration is the strongest characteristic peak of anatase, as seen in Figure 2c. By increasing the Gd amount, the intensity of this mode decreased monotonically, in good agreement with decreased anatase crystallinity upon Gd doping.[35] In the Raman spectrum of TiO2@20%Gd NBs (Figure 2d), the Raman modes assigned to the anatase phase were not observed but instead showed Raman active modes
at 264 and 450 cm−1 characteristics of Gd2Ti2O7,[38,41] in very
good agreement with XRD results.
2.2. Optical and Magnetic Resonance Imaging of TiO2@xGd NBs
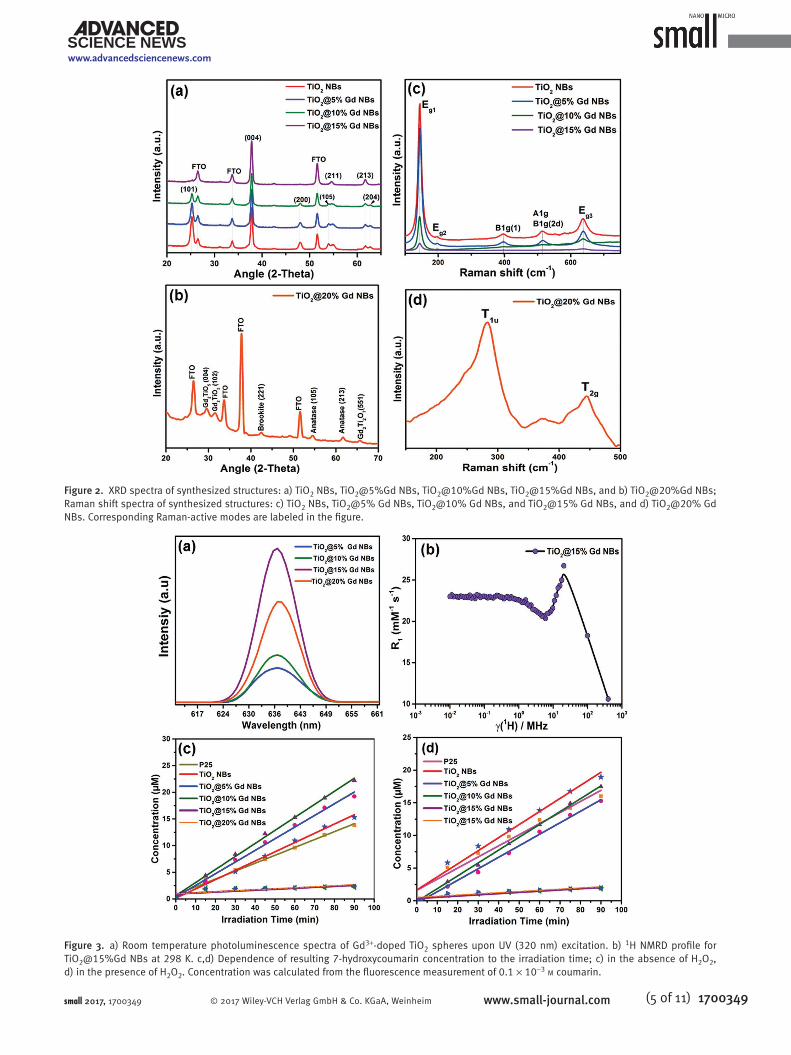
PL spectra show that the emission of Gddoped TiO2 spheres was dominated by a red emission peak at 636 nm upon UV excitation (Figure 3a), which previously has been assigned to
small 2017, 1700349
www.advancedsciencenews.com
Figure 1. a,d,g) SEM, b,e,h) TEM, and c,f,i) EDS images of obtained structure: a–c) TiO2 NBs, d–f) TiO2@5%Gd NBs, and g–i) TiO2@10%Gd NBs; red circle indicating the nanostar clusters in TiO2@10%Gd NBs. j) TEM and k) HRTEM images of nanostar clusters, the crystalline plane of the nanoparticle is shown in (k).
(5 of 11) 1700349© 2017 Wiley-VCH Verlag GmbH & Co. KGaA, Weinheim www.small-journal.comsmall 2017, 1700349
www.advancedsciencenews.com
Figure 3. a) Room temperature photoluminescence spectra of Gd3+-doped TiO2 spheres upon UV (320 nm) excitation. b) 1H NMRD profile for TiO2@15%Gd NBs at 298 K. c,d) Dependence of resulting 7-hydroxycoumarin concentration to the irradiation time; c) in the absence of H2O2, d) in the presence of H2O2. Concentration was calculated from the fluorescence measurement of 0.1 × 10⁻³ m coumarin.
Figure 2. XRD spectra of synthesized structures: a) TiO2 NBs, TiO2@5%Gd NBs, TiO2@10%Gd NBs, TiO2@15%Gd NBs, and b) TiO2@20%Gd NBs; Raman shift spectra of synthesized structures: c) TiO2 NBs, TiO2@5% Gd NBs, TiO2@10% Gd NBs, and TiO2@15% Gd NBs, and d) TiO2@20% Gd NBs. Corresponding Raman-active modes are labeled in the figure.
full papers
1700349 (6 of 11) www.small-journal.com © 2017 Wiley-VCH Verlag GmbH & Co. KGaA, Weinheim
an atomiclike f–f transition.[29] In line with this, we observe an increasing emission intensity with increasing Gd amount, and the strongest emission was observed in the case of TiO2@15%Gd NBs, which is attributed to the structure of the NBs. According to XRD, TEM, and the Raman results, we can conclude that the TiO2@15%Gd NBs are primarily a mixture of anatase and amorphous phases. It has been suggested that the semicrystalline TiO2 structure is an excellent host for RE3+[37] and here seen to show highest PL intensity for 15% Gd, while higher Gd content instead shows a Gd2Ti2O7 structure from Raman and XRD. The rich spectral properties of certain RE ions, when incorporated in host materials, are highly attractive in many ways. However, RE ions alone are weakly fluorescent due to the parity forbidden f–f transitions.[51] Lanthanides possess a unique orbital arrangement resulting in a large Stoke’s shift and a narrow emission and have therefore been a natural choice for imparting photoluminescence. TiO2 lattices have proved to be an excellent host material for RE ions due to their good thermal, chemical, and mechanical stabilities.[42] Titania nanocrystals surrounded by regions of amorphous titania have previously been proposed to act as effective lightharvesting antennae to absorb light and transfer energy to RE ions, which emit intense sharp luminescence,[29,30] and also that a halffilled electronic configuration of RE dopant is beneficial for improving the photo catalytic activity of TiO2.
[43]
Paramagnetic gadolinium(III) ions (Gd3+) possess seven unpaired electrons, which can efficiently alter the relaxation time of surrounding water protons, and have been widely used in routine clinical imaging as MRI contrast agents.[21] To investigate how Gd3+ doped TiO2 NBs would function as contrast agent in MRI, the relaxation times (T1, T2) of TiO2@xGd NBs were measured in a static magnetic field at 400 MHz (Table S1, Supporting Information). Both the spin–lattice relaxation time (T1) and the spin–spin relaxation time (T2) were shortened for Gd3+ doped TiO2 NBs in comparison with pure TiO2 NBs. However, relaxation rates R1 = 1/T1 and R2 = 1/T2 enhancements expressed as millimolar relaxivities r1 and r2 were significantly different for various samples where shape, size, crystallinity, and surface arrangement of the MRI contrast agent have a strong effect on longitudinal and transverse relaxation times.[21] Based on the data presented in Table S1 (Supporting Information), there was no high T1 shortening effect in the cases of TiO2@5%Gd NBs, TiO2@10%Gd NBs, and TiO2@20%Gd NBs, while TiO2@15%Gd NBs encountered a quite high T1 shortening effect, with relaxivity being a few times greater than in commercial materials.[44] The accessibility of water to Gd3+ ions is the main factor in the shortening of T1. It has previously been suggested that a rigid crystal lattice could greatly reduce the Gd3+ ions’ water accessibility, resulting in a limited contribution to T1 shortening.[45] The XRD and Raman results are presented above confirmed that TiO2@5%Gd NBs and TiO2@10%Gd NBs are well crystallined structures and therefore have limited contribution to T1 shortening; however, the TiO2@15%Gd NBs here show a retained anatase structure from Raman and partly amorphous character from the broad background in XRD and TEM images, thus TiO2@15%Gd NBs seem to be around the
optimum composition for delivering the best MRI response as well as PL intensity.
Data in Table S1 of the Supporting Information show the same trend as T1 was the shortest; T2 relaxation time was found for TiO2@15%Gd MBs. T2 is related to the magnetic moment of the imaging contrast agents and thereby to their size. The magnetic moment of nanoparticles rapidly decreases as their sizes decrease due to the reduction in the volume magnetic anisotropy and spin disorders on the surface of the nanoparticles.[46] In general, controlling the size of nanoparticles is critical for achieving a strong R2 = 1/T2 enhancement, where the theoretically predicted maximum of r2 relaxivity can be approached by optimizing the overall size of contrast agent.[46] The relaxivity recorded for the TiO2@15%Gd NBs was surprisingly high (r2 = 126 mm−1 s−1) compared to a commonly available contrast agent for T2 shortening,[21] and could thus be promising for use as efficient MRI contrast agent. An NMRD measurement was conducted for this sample to obtain more information about its MRI function. The field dependence of the proton relaxation rate for (NMRD profile) TiO2@15%Gd NBs is shown in Figure 3b. As expected, the undoped TiO2 NBs show a flat NMR profile (not shown in the figure) while the 15% Gddoped TiO2 relaxivity is strongly increased and resembles a typical NMRD profile of the MRI contrast agents,[47] with highest relaxivity r1 = 27 mm−1 s−1 at 20 MHz. It has been previously reported that densely packed nanoparticles have high magnetizations, and it is likely that the high relaxivities of TiO2@15%Gd NBs also here can be attributed to the packing of the local structure, i.e., densely packed nanoparticles in cluster form as observed from Figure S1b of the Supporting Information.
2.3. Photocatalytic Activity of TiO2@xGd NBs
To evaluate cancer cell destruction capability (based on ROS photogeneration) of synthesized structures, the photocatalytic activities of synthesized structures were quantified using a fluorescence probe method with coumarin, which is regarded as a viable indirect detection method for the presence of hydroxyl radicals.[48] •OH is an extremely important species, being frequently assigned as the major reactant responsible for the photocatalytic oxidation of organic compounds and deactivation of microorganisms.[49] The formation of •OH radicals on the synthesized structure surface was probed by measuring the fluorescence intensity of 7hydroxycoumarin that is formed upon the reaction of coumarin with •OH radicals.[50] Figure 3a shows the amount of 7hydroxycoumarin, produced by different synthesized structures under irradiation with UVA, as a function of the irradiation time. Moreover, the effect of H2O2 on the formation of •OH radicals was investigated, and the result was presented in Figure 3b. Linear increases in the concentration of 7hydroxycoumarin were observed as a function of the UVA illumination time for all experiments (Figure 3a,b) where the •OH generation rate (r), without and with H2O2, was calculated from the slope of the lines[51] (Table 1). A common parameter to determine and compare photocatalytic activities is the photo nic efficiency (ζ) for which the •OH generation is calculated
small 2017, 1700349
www.advancedsciencenews.com
(7 of 11) 1700349© 2017 Wiley-VCH Verlag GmbH & Co. KGaA, Weinheim www.small-journal.com
from the rate of •OH generation (r) divided by the incident photon flux (I0), according to the following equation[52,53]
ζ( ) 100 = 01
4 r I (1)
The photonic efficiencies of •OH generation, without and with H2O2, are summarized in Table 1.
The results show that in the absence of H2O2 the photonic efficiencies of •OH generation with TiO2@5%Gd NBs and TiO2@10%Gd NBs are significantly higher than TiO2 NBs and P25.[53] Presence of 0.1 × 10⁻³ m H2O2 had a contradictory effect on the formation of •OH on the different nanobeads, where the addition of 0.1 × 10⁻³ m H2O2 led to a significant increase of photonic efficiencies of •OH generation with P25 and pure TiO2 NBs.[50] On the other hand, for TiO2@5%Gd NBs and TiO2@10%Gd NBs, adding 0.1 × 10⁻³ m H2O2 had a negative effect. In the absence as well presence of H2O2, photonic efficiencies of •OH generation with TiO2@15%Gd NBs and TiO2@20%Gd NBs were negligible compared to other structures. From the results it is clear that low concentrations
of Gd (5%–10% Gd) are beneficial for ROS generation in the photocatalytic activity of TiO2 NBs, with a maximum ROS photogeneration for 10% Gd doping, while the higher concentrations of 15% and 20% Gd lead to much lower anatase crystallinity[54] and reduce the ROS photogeneration dramatically (Table 1 and Figure 3). The enhancement of photocatalytic activity after Gddoping can be assigned to the higher adsorption, improved chargetransfer efficiency, and the prevention of electron–hole recombination.[1] To further explore how the electronic changes in the Gddoped TiO2 affect the absorption and possibly improved charge transfer and electron–hole recombination, DFT calculations were performed and analyzed for undoped and Gddoped anatase TiO2.
[36,55]
2.4. DFT Calculations
Corresponding unit cells of undoped and Gddoped TiO2 anatase are depicted in Figure 4a,d. In the case of doping, the
small 2017, 1700349
www.advancedsciencenews.com
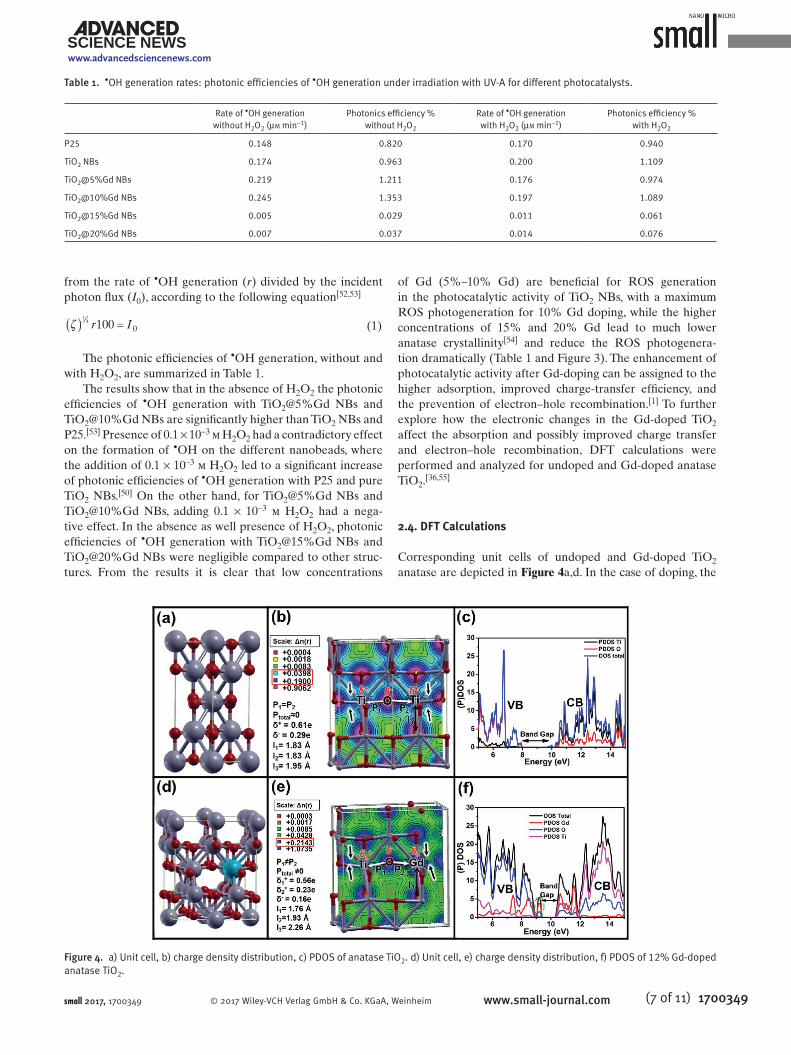
Table 1. •OH generation rates: photonic efficiencies of •OH generation under irradiation with UV-A for different photocatalysts.
Rate of •OH generation without H2O2 (µm min−1)
Photonics efficiency % without H2O2
Rate of •OH generation with H2O2 (µm min−1)
Photonics efficiency % with H2O2
P25 0.148 0.820 0.170 0.940
TiO2 NBs 0.174 0.963 0.200 1.109
TiO2@5%Gd NBs 0.219 1.211 0.176 0.974
TiO2@10%Gd NBs 0.245 1.353 0.197 1.089
TiO2@15%Gd NBs 0.005 0.029 0.011 0.061
TiO2@20%Gd NBs 0.007 0.037 0.014 0.076
Figure 4. a) Unit cell, b) charge density distribution, c) PDOS of anatase TiO2. d) Unit cell, e) charge density distribution, f) PDOS of 12% Gd-doped anatase TiO2.
full papers
1700349 (8 of 11) www.small-journal.com © 2017 Wiley-VCH Verlag GmbH & Co. KGaA, Weinheim
replacement of Ti with Gd within the anatase lattice is accompanied by structural changes, due to a different cation radius and charge of Gd that further affect groundstate charge density distribution and the density of states (DOS).[56] Figure 4 compares the charge density distribution within the lattice of anatase and Gddoped anatase (Figure 4b,e), and also the corresponding calculated DOS and partial DOS (PDOS) (Figure 4c,f). By considering the atoms in the lattice as charged ions, Löwdin charge analysis can be used for estimation of the dipole moments in the lattice,[57] providing the relative magnitudes and directions of the dipoles in the doped and undoped lattices. Regarding the data presented in Figure 4, the inplane dipole moment for the TiO2 lattice was zero (due to the symmetry illustrated in Figure 4b); however, for the Gddoped TiO2 it was estimated to be 1.1 Debye (Figure 4e).
The comparison of our calculated PDOS and total DOS of anatase TiO2 and Gddoped anatase TiO2 (Figure 4c,f) reveals that the Gd3+ ions introduced impurity energy levels (IELs) inside the bandgap (at the top of valence band), and that, consequently, the bandgap is slightly narrowed by Gd doping. IELs inside the bandgap of anatase TiO2 consist of RE 4f states, RE 5d states, and RE 6s2 states, which influence the positions, widths, and DOS of CB and VB of anatase TiO2, consistent with previous work with RE in TiO2.
[55]
The full photocatalysis reaction is a complicated process, including light absorption, excitation, and migration of photoexcited charge carriers, redox reaction on the surface with possible chemical species interaction and surface reconstructions, as well as mass transport limitations and back reactions.[1] Some parts of this reaction, such as the charge separation efficiency, charge transfer, and charge recombination at the TiO2 surface, can be affected by Gddoping.[58] The presence of Gd induces some structural changes in the unit cell by distorting the metaloxide octahedron bond lengths and angles (summarized in Table S2 of the Supporting Information for the case of 12% doping as examples). The changes in cell volume, bond length, and charge on atoms result that the center of gravity of negative electric charges deviates from the position of the Ti4+ ion in the TiO6 octahedron, and its dipole moment is consequently no longer zero.[57] Charge imbalance and local permanent dipoles would facilitate more efficient charge separation upon excitation and subsequent charge transport, but it may also help OH adsorption on the surface and retard the recombination,[1] and consequently enhance the ROS photogeneration. In addition to nonzero dipole moment induced by doping (as depicted in Figure 4d by white arrows), after doping, the distribution of charge density along the covalent bond of metal–oxygen is enhanced. This is in agreement with the calculated Löwdin charge of the atoms (presented in Table S2 of the Supporting Information) and shows less ionic and more covalent nature of the bonds that can facilitate the charge transport from the bulk to the surface of the particle.[59]
2.5. Biocompatibility of TiO2@xGd NBs and Photocatalytic Treatments of Cancer Cells: In Vitro Study
The relatively low ROS photogeneration activity of the TiO2@15%Gd and TiO2@20%Gd NBs would make them less
promising candidates for single use in PDT, but instead very promising for MRI contrast. Application of TiO2@xGd NBs in PDT with simultaneous therapeutic and imaging efficacies is desirable for the future,[16] and therefore TiO2 NBs doped with high concentration were neglected, and just TiO2 NBs, TiO2@5%Gd NBs, and TiO2@10% Gd NBs were considered for in vitro studies.
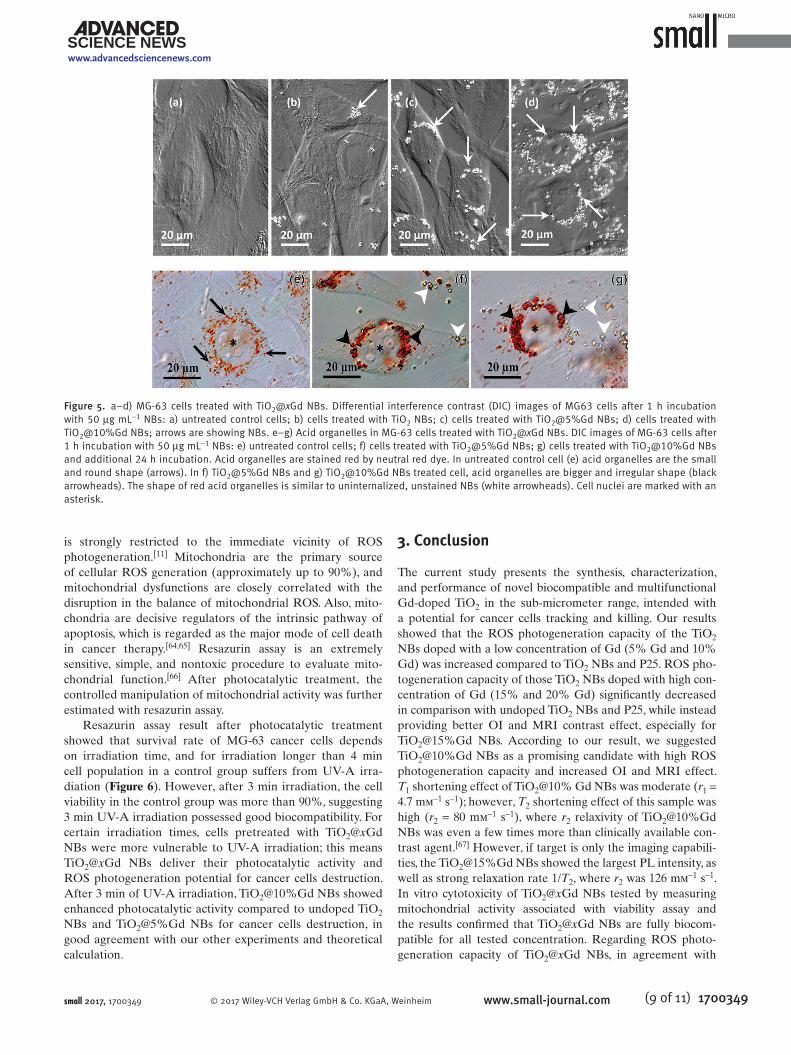
Cytotoxicity of TiO2@xGd NBs was tested by Resazurin assay and the results presented in the Figure S10 of the Supporting Information. The cytotoxicity results (Figure S10, Supporting Information) show that viability of the cell was not affected by TiO2@xGd NBs for all tested concentrations (10, 50, 75, 100, 200 µg mL−1) and TiO2@xGd NBs fully biocompatible. There is a reverse relation between biocompatibility and size of nanostructures; smaller nanostructures with a higher surface area are more active for ROS generation, however they show more cytotoxicity. Engineered TiO2@xGd NBs avoid cytotoxicity, having a size greater than 100 nm; while, on the other hand, TiO2@xGd NBs, keeping high surface area and mesoporosity, have a high capacity for ROS photogeneration. Morphological alteration of MG63 cells treated with different TiO2@xGd NBs was monitored with light and differential interference contrast (DIC) microscopy. Microscopy images (Figure 5b–d) proved that the morphology of MG63 cells treated with TiO2@xGd NBs did not differ from the morphology of untreated control cells (Figure 5a), which could be explained as high biocompatibility. The most significant finding of our work is cellular internalization of TiO2@xGd NBs (Figure 5b–d), which is much more significant in the case of TiO2@10%Gd NBs compared to the TiO2@5%Gd NBs or undoped TiO2 NBs, although all cells were treated with the same TiO2@xGd NBs concentration (50 µg mL−1). We noticed that the majority of TiO2@xGd NBs were located around the cell nuclei (Figure 5b–d). More experiments were done to examine acid organelles after cellular treatment with TiO2@xGd NBs. Cells treated with 50 µg mL−1 of TiO2@xGd NBs and incubated for 24 h had enlarged acid organelles and compared to untreated control cells (Figure 5e–g). We speculate that enlarged acid organelles are filled with NBs, indicating that MG63 human cancer cells endocytose NBs.[60–62] The flat/spread appearance of the cells gives room for cellular inclusions only around the nucleus in a domeshaped central part of the cell. TEM analysis was performed to confirm the internalization of NBs. Figure S11 of the Supporting Information shows a perinuclear region with TiO2@10%Gd NBs inclusions.
Since MG63 human cancer cells endocytose TiO2@xGd NBs, they could concentrate TiO2@xGd NBs and this can significantly improve specificity for imaging and damage cancerous cells, together with low systemic toxicity.[63] MG63 cells incubated with TiO2@xGd NBs were irradiated with an LED lamp for a different period (3, 4, 5 min) to specific photocatalytic ROS generation inside of MG63 cells. Upon irradiation, the excited TiO2@xGd NBs transfer energy to the surrounding O2 and H2O to generate ROS, which can be exploited to destroy cancer cells.[5] The produced ROS exhibits an extremely short lifespan and severely limited diffusion distance, so the damage of ROS to biomolecules
small 2017, 1700349
www.advancedsciencenews.com
(9 of 11) 1700349© 2017 Wiley-VCH Verlag GmbH & Co. KGaA, Weinheim www.small-journal.comsmall 2017, 1700349
www.advancedsciencenews.com
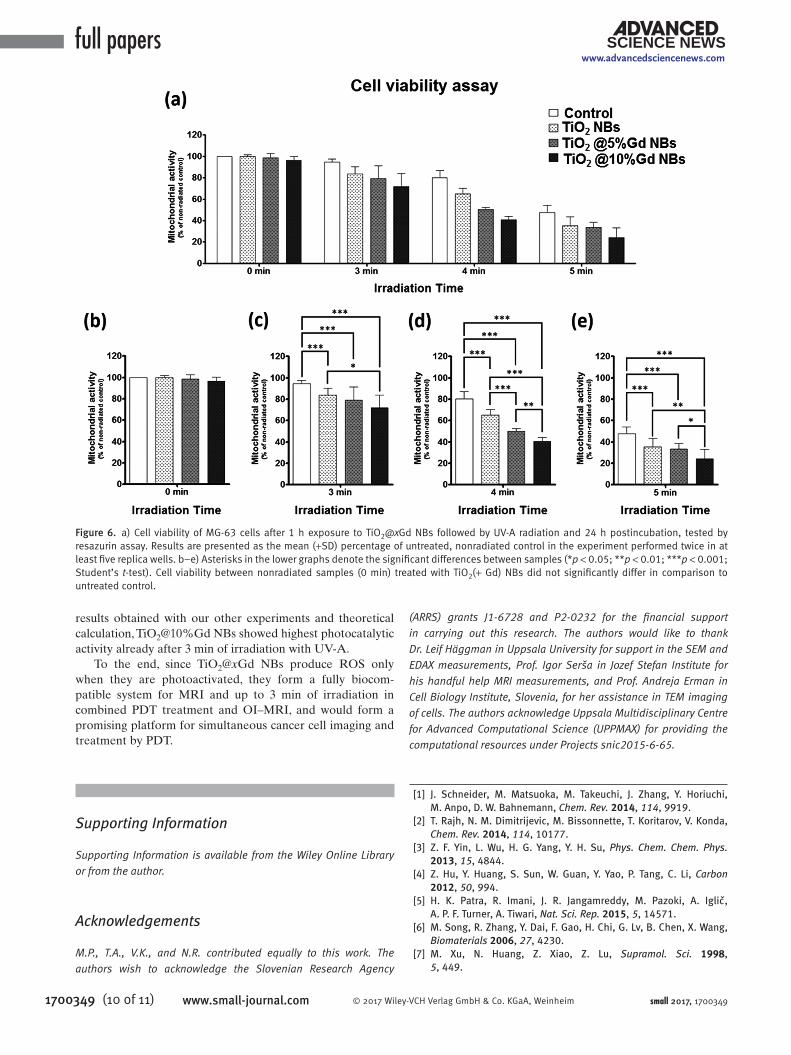
is strongly restricted to the immediate vicinity of ROS photogeneration.[11] Mitochondria are the primary source of cellular ROS generation (approximately up to 90%), and mitochondrial dysfunctions are closely correlated with the disruption in the balance of mitochondrial ROS. Also, mitochondria are decisive regulators of the intrinsic pathway of apoptosis, which is regarded as the major mode of cell death in cancer therapy.[64,65] Resazurin assay is an extremely sensitive, simple, and nontoxic procedure to evaluate mitochondrial function.[66] After photocatalytic treatment, the controlled manipulation of mitochondrial activity was further estimated with resazurin assay.
Resazurin assay result after photocatalytic treatment showed that survival rate of MG63 cancer cells depends on irradiation time, and for irradiation longer than 4 min cell population in a control group suffers from UVA irradiation (Figure 6). However, after 3 min irradiation, the cell viability in the control group was more than 90%, suggesting 3 min UVA irradiation possessed good biocompatibility. For certain irradiation times, cells pretreated with TiO2@xGd NBs were more vulnerable to UVA irradiation; this means TiO2@xGd NBs deliver their photocatalytic activity and ROS photogeneration potential for cancer cells destruction. After 3 min of UVA irradiation, TiO2@10%Gd NBs showed enhanced photocatalytic activity compared to undoped TiO2 NBs and TiO2@5%Gd NBs for cancer cells destruction, in good agreement with our other experiments and theoretical calculation.
3. Conclusion
The current study presents the synthesis, characterization, and performance of novel biocompatible and multifunctional Gddoped TiO2 in the submicrometer range, intended with a potential for cancer cells tracking and killing. Our results showed that the ROS photogeneration capacity of the TiO2 NBs doped with a low concentration of Gd (5% Gd and 10% Gd) was increased compared to TiO2 NBs and P25. ROS photogeneration capacity of those TiO2 NBs doped with high concentration of Gd (15% and 20% Gd) significantly decreased in comparison with undoped TiO2 NBs and P25, while instead providing better OI and MRI contrast effect, especially for TiO2@15%Gd NBs. According to our result, we suggested TiO2@10%Gd NBs as a promising candidate with high ROS photogeneration capacity and increased OI and MRI effect. T1 shortening effect of TiO2@10% Gd NBs was moderate (r1 = 4.7 mm−1 s−1); however, T2 shortening effect of this sample was high (r2 = 80 mm−1 s−1), where r2 relaxi vity of TiO2@10%Gd NBs was even a few times more than clinically available contrast agent.[67] However, if target is only the imaging capabilities, the TiO2@15%Gd NBs showed the largest PL intensity, as well as strong relaxation rate 1/T2, where r2 was 126 mm−1 s−1. In vitro cytotoxicity of TiO2@xGd NBs tested by measuring mitochondrial activity associated with viability assay and the results confirmed that TiO2@xGd NBs are fully biocompatible for all tested concentration. Regarding ROS photogeneration capacity of TiO2@xGd NBs, in agreement with
Figure 5. a–d) MG-63 cells treated with TiO2@xGd NBs. Differential interference contrast (DIC) images of MG63 cells after 1 h incubation with 50 µg mL−1 NBs: a) untreated control cells; b) cells treated with TiO2 NBs; c) cells treated with TiO2@5%Gd NBs; d) cells treated with TiO2@10%Gd NBs; arrows are showing NBs. e–g) Acid organelles in MG-63 cells treated with TiO2@xGd NBs. DIC images of MG-63 cells after 1 h incubation with 50 µg mL−1 NBs: e) untreated control cells; f) cells treated with TiO2@5%Gd NBs; g) cells treated with TiO2@10%Gd NBs and additional 24 h incubation. Acid organelles are stained red by neutral red dye. In untreated control cell (e) acid organelles are the small and round shape (arrows). In f) TiO2@5%Gd NBs and g) TiO2@10%Gd NBs treated cell, acid organelles are bigger and irregular shape (black arrowheads). The shape of red acid organelles is similar to uninternalized, unstained NBs (white arrowheads). Cell nuclei are marked with an asterisk.
full papers
1700349 (10 of 11) www.small-journal.com © 2017 Wiley-VCH Verlag GmbH & Co. KGaA, Weinheim small 2017, 1700349
www.advancedsciencenews.com
results obtained with our other experiments and theoretical calculation, TiO2@10%Gd NBs showed highest photocatalytic activity already after 3 min of irradiation with UVA.
To the end, since TiO2@xGd NBs produce ROS only when they are photoactivated, they form a fully biocompatible system for MRI and up to 3 min of irradiation in combined PDT treatment and OI–MRI, and would form a promising platform for simultaneous cancer cell imaging and treatment by PDT.
Supporting Information
Supporting Information is available from the Wiley Online Library or from the author.
Acknowledgements
M.P., T.A., V.K., and N.R. contributed equally to this work. The authors wish to acknowledge the Slovenian Research Agency
(ARRS) grants J1-6728 and P2-0232 for the financial support in carrying out this research. The authors would like to thank Dr. Leif Häggman in Uppsala University for support in the SEM and EDAX measurements, Prof. Igor Serša in Jozef Stefan Institute for his handful help MRI measurements, and Prof. Andreja Erman in Cell Biology Institute, Slovenia, for her assistance in TEM imaging of cells. The authors acknowledge Uppsala Multidisciplinary Centre for Advanced Computational Science (UPPMAX) for providing the computational resources under Projects snic2015-6-65.
[1] J. Schneider, M. Matsuoka, M. Takeuchi, J. Zhang, Y. Horiuchi, M. Anpo, D. W. Bahnemann, Chem. Rev. 2014, 114, 9919.
[2] T. Rajh, N. M. Dimitrijevic, M. Bissonnette, T. Koritarov, V. Konda, Chem. Rev. 2014, 114, 10177.
[3] Z. F. Yin, L. Wu, H. G. Yang, Y. H. Su, Phys. Chem. Chem. Phys. 2013, 15, 4844.
[4] Z. Hu, Y. Huang, S. Sun, W. Guan, Y. Yao, P. Tang, C. Li, Carbon 2012, 50, 994.
[5] H. K. Patra, R. Imani, J. R. Jangamreddy, M. Pazoki, A. Iglic, A. P. F. Turner, A. Tiwari, Nat. Sci. Rep. 2015, 5, 14571.
[6] M. Song, R. Zhang, Y. Dai, F. Gao, H. Chi, G. Lv, B. Chen, X. Wang, Biomaterials 2006, 27, 4230.
[7] M. Xu, N. Huang, Z. Xiao, Z. Lu, Supramol. Sci. 1998, 5, 449.
Figure 6. a) Cell viability of MG-63 cells after 1 h exposure to TiO2@xGd NBs followed by UV-A radiation and 24 h postincubation, tested by resazurin assay. Results are presented as the mean (+SD) percentage of untreated, nonradiated control in the experiment performed twice in at least five replica wells. b–e) Asterisks in the lower graphs denote the significant differences between samples (*p < 0.05; **p < 0.01; ***p < 0.001; Student’s t-test). Cell viability between nonradiated samples (0 min) treated with TiO2(+ Gd) NBs did not significantly differ in comparison to untreated control.
(11 of 11) 1700349© 2017 Wiley-VCH Verlag GmbH & Co. KGaA, Weinheim www.small-journal.comsmall 2017, 1700349
www.advancedsciencenews.com
[8] J. W. Seo, H. Chung, M. Y. Kim, J. Lee, I. H. Choi, J. Cheon, Small 2007, 3, 850.
[9] J. Petkovic, T. Küzma, K. Rade, S. Novak, M. Filipic, J. Hazard. Mater. 2011, 196, 145.
[10] a) T. Tachikawa, M. Fujitsuka, T. Majima, J. Phys. Chem. C 2007, 111, 5259; b) D. M. Blake, P.-C. Maness, Z. Huang, E. J. Wolfrum, J. Huang, W. A. Jacoby, Sep. Purif. Methods 1999, 28, 1.
[11] D. Trachootham, J. Alexandre, P. Huang, Nat. Rev. Drug Discovery 2009, 8, 579.
[12] S. O. Gollnick, B. Owczarczak, P. Maier, Nat. Rev. Cancer 2006, 6, 535.
[13] D. E. Dolmans, D. Fukumura, R. K. Jain, Nat. Rev. Cancer 2003, 3, 380.
[14] S. Wu, Z. Weng, X. Liu, K. W. K. Yeung, P. K. Chu, Adv. Funct. Mater. 2014, 24, 5464.
[15] H. Peng, X. Liu, G. Wang, M. Li, K. M. Bratlie, E. Cochran, Q. Wang, J. Mater. Chem. B 2015, 3, 6856.
[16] M. Li, H. Deng, H. Peng, Q. Wang, J. Nanosci. Nanotechnol. 2014, 14, 415.
[17] F. Jia, X. Liu, L. Li, S. Mallapragada, B. Narasimhan, Q. Wang, J. Controlled Release 2013, 172, 1020.
[18] F. Wang, W. B. Tan, Y. Zhang, X. Fan, M. Wang, Nanotechnology 2006, 17, R1.
[19] M. H. Li, H. Yu, T. F. Wang, N. D. Chang, J. Q. Zhang, D. Du, M. F. Liu, S. L. Sun, R. Wang, H. Q. Tao, S. L. Geng, Z. Y. Shen, Q. Wang, H. S. Peng, J. Mater. Chem. B 2014, 2, 1619.
[20] D. Du, N. Chang, S. Sun, M. Li, H. Yu, M. Liu, X. Liu, G. Wang, H. Li, X. Liu, S. Geng, Q. Wang, H. Peng, J. Controlled Release 2014, 182, 99.
[21] H. Bin Na, I. C. Song, T. Hyeon, Adv. Mater. 2009, 21, 2133.[22] M. S. Eljamel, Photodiagn. Photodyn. Ther. 2008, 5, 260.[23] J. Cao, R. Wang, N. Gao, M. Li, X. Tian, W. Yang, Y. Ruan, C. Zhou,
G. Wang, X. Liu, S. Tang, Y. Yu, Y. Liu, G. Sun, H. Peng, Q. Wang, Biomater. Sci. 2015, 3, 1545.
[24] H. Dong, G. Zeng, L. Tang, C. Fan, C. Zhang, X. He, Y. He, Water Res. 2015, 79, 128.
[25] M. C. Heffern, L. M. Matosziuk, T. J. Meade, Chem. Rev. 2014, 114, 4496.
[26] Y. L. H. Liu, L. Yu, W. Chen, J. Nanomater. 2012, 13, 1.[27] M. Luo, K. Cheng, W. Weng, C. Song, P. Du, G. Shen, G. Xu, G. Han,
Nanoscale Res. Lett. 2009, 4, 809.[28] W. Luo, C. Fu, R. Li, Y. Liu, H. Zhu, X. Chen, Small 2011, 7,
3046.[29] X. Chen, W. Luo, J. Nanosci. Nanotechnol. 2010, 10, 1482.[30] S. Sandoval, J. Yang, J. G. Alfaro, A. Liberman, M. Makale,
C. E. Chiang, I. K. Schuller, A. C. Kummel, W. C. Trogler, Chem. Mater. 2012, 24, 4222.
[31] A. D. Maynard, Nature 2011, 475, 31.[32] R. Imani, P. Veranic, A. Iglic, M. E. Kreft, M. Pazoki, S. Hudoklin,
Photochem. Photobiol. Sci. 2015, 14, 583.[33] R. Imani, M. Pazoki, A. Tiwari, G. Boschloo, A. P. F. Turner,
V. Kralj-Iglic, A. Iglic, Nanoscale 2015, 7, 10438.[34] R. Imani, A. Iglic, A. P. F. Turner, A. Tiwari, Electrochem. Commun.
2014, 40, 84.[35] M. Pal, U. Pal, J. M. G. Y. Jiménez, F. Pérez-Rodríguez, Nanoscale
Res. Lett. 2012, 7, 1.[36] P. Sudhagar, A. Devadoss, K. Nakata, C. Terashima, A. Fujishima,
J. Electrochem. Soc. 2014, 162, H108.[37] V. S. Smitha, S. Pillai, U. N. S. Hareesh, B. N. Nair, K. G. Warrier,
RSC Adv. 2014, 4, 61727.
[38] N. J. Hess, B. D. Begg, S. D. Conradson, D. E. Mccready, P. L. Gassman, W. J. Weber, J. Phys. Chem. B 2002, 106, 4663.
[39] A. Gómez-Pérez, J. Prado-Gonjal, D. Muñoz-Gil, A. Andrada-Chacón, J. Sánchez-Benítez, E. Morán, M. T. Azcondo, U. Amador, R. Schmidt, RSC Adv. 2015, 5, 85229.
[40] C.-H. Yang, Z.-Q. Ma, Appl. Opt. 2012, 51, 5438.[41] J. Zhang, J. Lian, F. Zhang, J. Wang, A. F. Fuentes, R. C. Ewing,
J. Phys. Chem. C 2010, 2, 11810.[42] H. Maas, A. Currao, G. Calzaferri, Angew. Chem., Int. Ed. 2011, 41,
2495.[43] J. Li, X. Yang, X. Yu, L. Xu, W. Kang, W. Yan, H. Gao, Z. Liu, Y. Guo,
Appl. Surf. Sci. 2009, 255, 3731.[44] C. S. Info, The Basic Textbook of the European Magnetic Reso-
nance Forum, 9th ed. European Magnetic Resonance Forum, e-book, 2016.
[45] F. Chen, W. Bu, S. Zhang, X. Liu, J. Liu, H. Xing, Q. Xiao, L. Zhou, W. Peng, L. Wang, J. Shi, Adv. Funct. Mater. 2011, 21, 4285.
[46] E. Pöselt, H. Kloust, U. Tromsdorf, M. Janschel, C. Hahn, C. Maßlo, H. Weller, ACS Nano 2012, 6, 1619.
[47] L. Moriggi, C. Cannizzo, E. Dumas, C. R. Mayer, A. Ulianov, L. Helm, J. Am. Chem. Soc. 2009, 131, 10828.
[48] C. Baumanis, J. Z. Bloh, R. Dillert, D. W. Bahnemann, J. Phys. Chem. C 2011, 115, 25442.
[49] N. Wu, J. Wang, D. N. Tafen, H. Wang, J. G. Zheng, J. P. Lewis, X. Liu, S. S. Leonard, A. Manivannan, J. Am. Chem. Soc. 2010, 132, 6679.
[50] J. Zhang, Y. Nosaka, J. Phys. Chem. C 2013, 117, 1383.[51] H. Kisch, D. Bahnemann, J. Phys. Chem. Lett. 2015, 6, 1907.[52] C. Wang, J. Rabani, D. W. Bahnemann, J. K. Dohrmann, J. Photo-
chem. Photobiol. A Chem. 2002, 148, 169.[53] H. Zhang, D. W. Bahnemann, J. Mater. Chem. 2009, 19, 5089.[54] J. Z. Bloh, R. Dillert, D. W. Bahnemann, J. Phys. Chem. C 2012,
116, 25558.[55] L. Bian, M. Song, T. Zhou, X. Zhao, Q. Dai, J. Rare Earths 2009, 27,
461.[56] J. Choi, P. Sudhagar, P. Lakshmipathiraj, J. W. Lee, A. Devadoss,
S. Lee, T. Song, S. Hong, S. Eito, C. Terashima, T. H. Han, J. K. Kang, A. Fujishima, Y. S. Kang, U. Paik, RSC Adv. 2014, 4, 11750.
[57] Z. Zhao, Q. Liu, J. Phys. D. Appl. Phys. 2008, 41, 085417.[58] S. Bingham, W. A. Daoud, J. Mater. Chem. 2011, 21, 2041.[59] A. V. Akimov, A. J. Neukirch, O. V. Prezhdo, Chem. Rev. 2013, 113,
4496.[60] L. M. Bareford, P. W. Swaan, Adv. Drug Delivery Rev. 2007, 59,
748.[61] Q. Wang, H. Cheng, H. Peng, H. Zhou, P. Y. Li, R. Langer, Adv. Drug
Delivery Rev. 2015, 91, 125.[62] H. Peng, C. Wang, X. Xu, C. Yu, Q. Wang, Nanoscale 2015, 7, 4354.[63] Y. Mosesson, G. B. Mills, Y. Yarden, Nat. Rev. Cancer 2008, 8, 835.[64] Z. Yu, Q. Sun, W. Pan, N. Li, B. Tang, ACS Nano 2015, 16, 11064.[65] Z. Hou, Y. Zhang, K. Deng, Y. Chen, X. Li, X. Deng, Z. Cheng,
H. Lian, C. Li, J. Lin, ACS Nano 2015, 9, 2584.[66] K. K. Abu-Amero, T. M. Bosley, Arch. Pathol. Lab. Med. 2005, 129,
1295.[67] A. Gizzatov, V. Keshishian, A. Guven, A. M. Dimiev, F. Qu,
R. Muthupillai, P. Decuzzi, R. G. Bryant, J. M. Tour, L. J. Wilson, Nanoscale 2014, 6, 3059.
Received: January 31, 2017Published online: