Embed Size (px)
Citation preview

Multiple movement modes by large herbivoresat multiple spatiotemporal scalesJohn M. Fryxella,1, Megan Hazella, Luca Borgera, Ben D. Dalziela, Daniel T. Haydonb, Juan M. Moralesc,Therese McIntoshd, and Rick C. Rosatted
aDepartment of Integrative Biology, University of Guelph, Guelph, ON, Canada N1G 2W1; bDepartment of Environmental and Evolutionary Biology,University of Glasgow, Glasgow G12 8QQ, United Kingdom; cLaboratorio ECOTONO, Universidad Nacional del Comahue, Quintral 1250, 8400 Bariloche,Argentina; and dOntario Ministry of Resources, Trent University, DNA Building, 2140 East Bank Drive, Peterborough, ON, Canada K9J 7B8
Edited by Ran Nathan, The Hebrew University of Jerusalem, Jerusalem, Israel, and accepted by the Editorial Board July 14, 2008 (received for reviewFebruary 22, 2008)
Recent theory suggests that animals should switch facultativelyamong canonical movement modes as a complex function ofinternal state, landscape characteristics, motion capacity, and nav-igational capacity. We tested the generality of this paradigm forfree-ranging elk (Cervus elaphus) over 5 orders of magnitude intime (minutes to years) and space (meters to 100 km). At thecoarsest spatiotemporal scale, elk shifted from a dispersive to ahome-ranging phase over the course of 1–3 years after introduc-tion into a novel environment. At intermediate spatiotemporalscales, elk continued to alternate between movement modes.During the dispersive phase, elk alternated between encampedand exploratory modes, possibly linked to changes in motivationalgoals from foraging to social bonding. During the home-rangingphase, elk movements were characterized by a complex interplaybetween attraction to preferred habitat types and memory ofprevious movements across the home-range. At the finest tempo-ral and spatial scale, elk used area-restricted search while brows-ing, interspersed with less sinuous paths when not browsing.Encountering a patch of high-quality food plants triggered theswitch from one mode to the next, creating biphasic movementdynamics that were reinforced by local resource heterogeneity.These patterns suggest that multiphasic structure is fundamentalto the movement patterns of elk at all temporal and spatial scalestested.
elk � foraging � group formation � motivation
The movement ecology framework proposes that animalsswitch facultatively among canonical movement modes as a
complex function of internal state, landscape characteristics,motion capacity, and navigational capacity (1). This is a criticalassumption underlying much contemporary theoretical work inmovement ecology, as evidenced by a growing number of modelsbased on multiphasic random walks (2–9). Provided that animalsexhibit a set of different behaviors (e.g., searching and foraging)that are statistically distinguishable, changes in behavioral stateshould be inferable in principle from systematic variation in thedistribution of movement parameters (3, 10–18).
In this article, we test the multiphasic hypothesis using move-ment patterns by elk (Cervus elaphus manitobensis) reintroducedinto southern Ontario, Canada. Unlike previous studies, we havetested this hypothesis at a variety of spatiotemporal scales,ranging in temporal resolution from years to within-daily move-ments and spatial resolution from hundreds of kilometers tometers. This allows us to evaluate the generality of the assertionthat multiple movement modes are central to understandinganimal movement (1). We explore the underlying causes ofmultiphasic movement patterns by linking switches betweenmovement modes with plausible ecological, social, and demo-graphic correlates.
Several data sources were used for this comparison. Alltranslocated animals in the population were equipped with VHFradio-transmitters. Biweekly radio-telemetry from vehicles, aug-
mented occasionally by fixed-wing aircraft, was used to evaluatemovement patterns over several years, which have coarse spatialresolution (roughly 1-km sample error). GPS satellite telemetrywas used to evaluate daily movements within a year, but withhigh spatial resolution (�10- to 100-m sample error). Fine-scalewinter movements were studied by using fresh elk tracks left inthe snow (�1-m sample error). For each of these data sources,we used individual animals as our sample unit for subsequentstatistical evaluation of movement parameters.
ResultsCoarse-Scale Movement. After release, the female elk dispersed adistance of 10–110 km (Fig. 1A). Most females (30 of 48individuals, with 2,843 locations) dispersed 10–30 km, 13 of 48females dispersed 30–60 km (based on 1,076 locations), and 4individuals dispersed 90–110 km (based on 188 locations). Therewas no significant difference in dispersal distance between thetwo releases (P � 0.05). Overall, the shape of the net-squareddisplacement over time deviated strongly from the linear patternexpected for a Gaussian dispersal process, indicating that the elkswitched from unrestricted to a locally bounded space use (i.e.,home-range behavior) 1–3 years after release (Fig. 1 B–D).Short-distance dispersers (10–30 km) continued to slowly driftuntil stabilizing 3 years after release (Fig. 1B), whereas medium-distance dispersers showed a stationary space-use pattern 1 yearafter release (Fig. 1C). Although data for the long-distancedispersers were sparse, there is some evidence that long-distancedispersers also started to switch to a more stable space-usepattern (Fig. 1D).
Intermediate-Scale Movement. Movements of individual animalsduring the first year after herd introduction alternated betweenperiods of rapid directional movement (termed the exploratorymode) and more sedentary behavior (termed encamped mode).Individuals often spent several days in an area �1 hectare in size,before suddenly relocating several kilometers away (Fig. 2). Inencamped mode, elk moved 0.23–0.66 km/day (means for thefour individuals), whereas in the exploratory mode, they typicallymoved an order of magnitude more quickly (5.23–7.00 km/day;Fig. 3). When encamped, move reversals were more common,whereas more linear movement trajectories were favored duringthe exploratory mode (Fig. 3). Although there was substantialvariation among individuals, such saltatory jumps were common,suggesting alternation among movement modes. Invariably,models with mixtures of movement modes were favored relative
Author contributions: J.M.F., D.T.H., J.M.M., and R.C.R. designed research; M.H., L.B., andT.M. performed research; M.H., L.B., B.D.D., D.T.H., and J.M.M. analyzed data; and J.M.F.,M.H., L.B., and B.D.D. wrote the paper.
The authors declare no conflict of interest.
This article is a PNAS Direct Submission. R.N. is a guest editor invited by the Editorial Board.
1To whom correspondence should be addressed. E-mail: [email protected].
© 2008 by The National Academy of Sciences of the USA
19114–19119 � PNAS � December 9, 2008 � vol. 105 � no. 49 www.pnas.org�cgi�doi�10.1073�pnas.0801737105
Dow
nloa
ded
by g
uest
on
Nov
embe
r 18
, 202
1

to simpler models based on a single distribution for turnfrequency and another for move length (17). No single mixedmodel was best for all individuals tested, although models with
a Markovian switching function for transitions among movementmodes were favored most consistently.
We extended this general approach to consider the influenceof social structure on movement patterns and demography (19).For gregarious animals like elk, maintaining close proximity toother members of the herd could conceivably supersede anyprobabilistic tendency to move on. We estimated the transitionprobabilities most consistent with patterns of group displace-ment, and directly estimated the causal factors associated withgroup fragmentation and fusion. The results of this socialanalysis suggest that individuals were strongly attracted to nearbygroups and, once formed, rarely left large groups (19). Inter-estingly, the rate of movement by individuals depended stronglyon the amount of time they spent in groups, with highlygregarious individuals being much more sedentary than moresolitary individuals (19). Far-roaming, solitary individuals had ahigher risk of mortality than did more sedentary, gregariousindividuals (19). Hence, sociality triggered changes in movementmodes that had important demographic consequences.
After the herds became consolidated, 2–3 years after intro-duction, individuals developed predictable home-ranges (20).Not all areas in the home-range were equally used; rather, thetendency was for concentrated use of a small area for a period,punctuated by rapid transfer to another part of the home-range,leaving large tracts poorly exploited (20). There are at least twoobvious hypotheses that could explain such behavior: animalsare attracted to particular habitats that provide food or shelter,or animals tend to revisit places they have already been, perhapsbecause they know they can safely find vital resources at theselocations. A simpler hypothesis, however, is that long moves aresimply rare, whereas most daily moves are shorter. We testedamong these alternative hypotheses by comparing the likelihoodof artificial neural net models based on resource maps, distance,and memory of previous visits. Results of this analysis suggestthat all three factors shape probabilistic movement patterns (20).The shape of the multidimensional movement kernel clearlyshows that home-range use derives from a tendency to usefamiliar places with preferred resources (such as open areas with
0 500 1000 1500 2000
-200
010
0
0 500 1000 1500 2000
-200
010
0
0 500 1000 1500 2000
-200
0-1
000
050
0
0 500 1000 1500
-500
00
5000
5000
B
C D
0
5000
0000
5000
0 500 1000 1500 2000
A
0 500 1000 1500 2000 0 500 1000 1500 20000 500
1000 1500 20000 500 1000 15000 500
-200
010
0-5
000
050
00
-200
00
500
-100
0
Days since release
Net
squ
ared
dis
plac
emen
t (km
2 )
1500
00
5000
Fig. 1. Net squared displacement from the release site of 48 female elkintroduced into the Bancroft region. (A) Observed squared displacement(km2) in relation to time (‘‘Days since release’’). (B and C) Smoothed relation-ship between net squared displacement (km2, scaled around the average) andtime since introduction as obtained from nonparametric generalized additivemixed models (GAMM) for short-distance dispersers (B, corresponding to10–30 km net displacement), intermediate-distance dispersers (C, 30–60 km),and long-distance dispersers (D, 90–110 km; note the change in scale on thex axis). The model term is presented as a continuous line, dashed linesrepresent 95% confidence intervals, and tick marks show the locations of theobservations. Overall, the shift from a highly dispersive phase during the firstyear to a home-ranging phase thereafter can be observed.
Dai
ly m
ovem
ent r
ate
Julian date
Fig. 2. Variation in movement rate (km/day) for a single female elk individ-ual over time during the first year following introduction to the Bancroftregion. Best-fit estimates of behavioral modes are displayed in the movementrate panel, for a range of alternative multiphasic models (A, two-phase; B,two-phase with ecological covariates; C, two-phase with probabilistic transi-tion switch; D, two-phase with probabilistic transition switch constrained topositive values; E, three-phase with probabilistic transition switch). Explor-atory movements predicted by each model are shaded, whereas the en-camped mode is open. [Reprinted with permission from ref. 17 (Copyright2004, Ecological Society of America).]
30
210
60
240
90
270
120
300
150
330
180 0
30
210
60
240
90
270
120
300
150
330
180 0
0 0.5 1 1.5 20
20
40
60
80
0 5 10 15 200
2
4
6
8
10
Turning Angles
Fre
quen
cy
Encamped Exploratory
Step length (km)
Fig. 3. Variation in frequency distributions of turn angles and step lengthsfor an individual female elk during the first year after introduction to theBancroft region, comparing encamped versus exploratory movement modes(16). Best-fit Weibull and wrapped Cauchy distributions (solid curves) areshown relative to the observed data (histograms). [Reprinted with permissionfrom ref. 17 (Copyright 2004, Ecological Society of America).]
Fryxell et al. PNAS � December 9, 2008 � vol. 105 � no. 49 � 19115
ECO
LOG
YSP
ECIA
LFE
ATU
RE
Dow
nloa
ded
by g
uest
on
Nov
embe
r 18
, 202
1
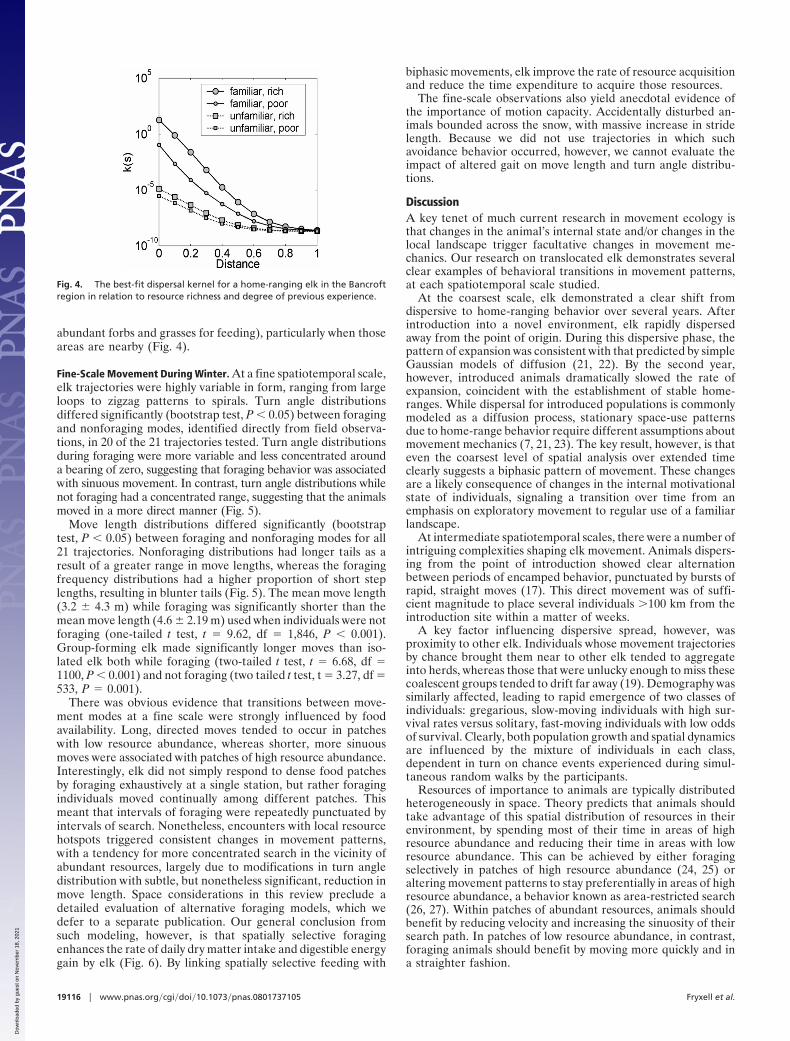
abundant forbs and grasses for feeding), particularly when thoseareas are nearby (Fig. 4).
Fine-Scale Movement During Winter. At a fine spatiotemporal scale,elk trajectories were highly variable in form, ranging from largeloops to zigzag patterns to spirals. Turn angle distributionsdiffered significantly (bootstrap test, P � 0.05) between foragingand nonforaging modes, identified directly from field observa-tions, in 20 of the 21 trajectories tested. Turn angle distributionsduring foraging were more variable and less concentrated arounda bearing of zero, suggesting that foraging behavior was associatedwith sinuous movement. In contrast, turn angle distributions whilenot foraging had a concentrated range, suggesting that the animalsmoved in a more direct manner (Fig. 5).
Move length distributions differed significantly (bootstraptest, P � 0.05) between foraging and nonforaging modes for all21 trajectories. Nonforaging distributions had longer tails as aresult of a greater range in move lengths, whereas the foragingfrequency distributions had a higher proportion of short steplengths, resulting in blunter tails (Fig. 5). The mean move length(3.2 � 4.3 m) while foraging was significantly shorter than themean move length (4.6 � 2.19 m) used when individuals were notforaging (one-tailed t test, t � 9.62, df � 1,846, P � 0.001).Group-forming elk made significantly longer moves than iso-lated elk both while foraging (two-tailed t test, t � 6.68, df �1100, P � 0.001) and not foraging (two tailed t test, t � 3.27, df �533, P � 0.001).
There was obvious evidence that transitions between move-ment modes at a fine scale were strongly influenced by foodavailability. Long, directed moves tended to occur in patcheswith low resource abundance, whereas shorter, more sinuousmoves were associated with patches of high resource abundance.Interestingly, elk did not simply respond to dense food patchesby foraging exhaustively at a single station, but rather foragingindividuals moved continually among different patches. Thismeant that intervals of foraging were repeatedly punctuated byintervals of search. Nonetheless, encounters with local resourcehotspots triggered consistent changes in movement patterns,with a tendency for more concentrated search in the vicinity ofabundant resources, largely due to modifications in turn angledistribution with subtle, but nonetheless significant, reduction inmove length. Space considerations in this review preclude adetailed evaluation of alternative foraging models, which wedefer to a separate publication. Our general conclusion fromsuch modeling, however, is that spatially selective foragingenhances the rate of daily dry matter intake and digestible energygain by elk (Fig. 6). By linking spatially selective feeding with
biphasic movements, elk improve the rate of resource acquisitionand reduce the time expenditure to acquire those resources.
The fine-scale observations also yield anecdotal evidence ofthe importance of motion capacity. Accidentally disturbed an-imals bounded across the snow, with massive increase in stridelength. Because we did not use trajectories in which suchavoidance behavior occurred, however, we cannot evaluate theimpact of altered gait on move length and turn angle distribu-tions.
DiscussionA key tenet of much current research in movement ecology isthat changes in the animal’s internal state and/or changes in thelocal landscape trigger facultative changes in movement me-chanics. Our research on translocated elk demonstrates severalclear examples of behavioral transitions in movement patterns,at each spatiotemporal scale studied.
At the coarsest scale, elk demonstrated a clear shift fromdispersive to home-ranging behavior over several years. Afterintroduction into a novel environment, elk rapidly dispersedaway from the point of origin. During this dispersive phase, thepattern of expansion was consistent with that predicted by simpleGaussian models of diffusion (21, 22). By the second year,however, introduced animals dramatically slowed the rate ofexpansion, coincident with the establishment of stable home-ranges. While dispersal for introduced populations is commonlymodeled as a diffusion process, stationary space-use patternsdue to home-range behavior require different assumptions aboutmovement mechanics (7, 21, 23). The key result, however, is thateven the coarsest level of spatial analysis over extended timeclearly suggests a biphasic pattern of movement. These changesare a likely consequence of changes in the internal motivationalstate of individuals, signaling a transition over time from anemphasis on exploratory movement to regular use of a familiarlandscape.
At intermediate spatiotemporal scales, there were a number ofintriguing complexities shaping elk movement. Animals dispers-ing from the point of introduction showed clear alternationbetween periods of encamped behavior, punctuated by bursts ofrapid, straight moves (17). This direct movement was of suffi-cient magnitude to place several individuals �100 km from theintroduction site within a matter of weeks.
A key factor influencing dispersive spread, however, wasproximity to other elk. Individuals whose movement trajectoriesby chance brought them near to other elk tended to aggregateinto herds, whereas those that were unlucky enough to miss thesecoalescent groups tended to drift far away (19). Demography wassimilarly affected, leading to rapid emergence of two classes ofindividuals: gregarious, slow-moving individuals with high sur-vival rates versus solitary, fast-moving individuals with low oddsof survival. Clearly, both population growth and spatial dynamicsare influenced by the mixture of individuals in each class,dependent in turn on chance events experienced during simul-taneous random walks by the participants.
Resources of importance to animals are typically distributedheterogeneously in space. Theory predicts that animals shouldtake advantage of this spatial distribution of resources in theirenvironment, by spending most of their time in areas of highresource abundance and reducing their time in areas with lowresource abundance. This can be achieved by either foragingselectively in patches of high resource abundance (24, 25) oraltering movement patterns to stay preferentially in areas of highresource abundance, a behavior known as area-restricted search(26, 27). Within patches of abundant resources, animals shouldbenefit by reducing velocity and increasing the sinuosity of theirsearch path. In patches of low resource abundance, in contrast,foraging animals should benefit by moving more quickly and ina straighter fashion.
Fig. 4. The best-fit dispersal kernel for a home-ranging elk in the Bancroftregion in relation to resource richness and degree of previous experience.
19116 � www.pnas.org�cgi�doi�10.1073�pnas.0801737105 Fryxell et al.
Dow
nloa
ded
by g
uest
on
Nov
embe
r 18
, 202
1

Our work shows evidence of facultative behavioral response tolocal resources at a fine spatiotemporal scale, shaping thedistribution of movement parameters. Elk turned more fre-quently and took shorter moves while foraging than when theywere moving between patches of high resource abundance.Alternation between foraging and nonforaging modes wasclearly a consequence of spatial resource heterogeneity experi-enced over the course of the daily movement trajectory. Agrowing number of field studies have demonstrated that largeherbivores alter their search behavior in relation to the distri-bution of resources in their environment (28–31). Like mostherbivores, elk did not completely deplete food resources withinany single feeding station, but rather moved continually. As aresult of local restricted movements, female elk in the Bancroftarea maintained a strong association with stands of tremblingaspen (32), a primary food source for elk during winter.
Animals tended to use sites that had been visited before, oftenmany days prior (20). In winter, at least two elk groups tended
to frequently revisit sites where local residents provided hay.Given that memory plays a demonstrable role in determiningmovement probabilities, elk apparently have navigational abili-ties allowing them to find previously used locations, suggestingthat elk may have a cognitive map that allows them to order theirmovements among favored habitats.
In sum, multiphasic movement patterns were evident at everyspatiotemporal scale examined, suggesting that a fully syntheticapproach, linking internal state, landscape characteristics, andnavigational capability, is necessary for a complete understand-ing of elk movement (1). This suggests that such a syntheticquantitative model, based on alternation among canonical move-ment modes, has great predictive potential (33). Achieving sucha synthesis is no simple matter, however, for several reasons.
There are enormous statistical challenges associated withidentifying mixtures of movement behaviors from a continuousstream of time series data. New methodical approaches, likeMarkov chain Monte Carlo methods, can help solve these issues
1
2
3
4
5
30
210
60
240
90
270
120
300
150
330
180 0
5
10
15
30
210
60
240
90
270
120
300
150
330
180 0
1 2 3 4 5 6 7 8 9 10 11 12 13 14 150
0.05
0.1
0.15
0.2
0.25
0.3
0.35
0.4
Fre
quen
cy
1 2 3 4 5 6 7 8 9 10 11 12 13 14 150
0.05
0.1
0.15
0.2
0.25
0.3
0.35
Fre
quen
cy
Foraging
Turn angle
Step length (m)
Searching
Fig. 5. Example of variation in frequency distributions of turn angles and step lengths for an individual Bancroft elk during winter in foraging versus searchingmode.
Fryxell et al. PNAS � December 9, 2008 � vol. 105 � no. 49 � 19117
ECO
LOG
YSP
ECIA
LFE
ATU
RE
Dow
nloa
ded
by g
uest
on
Nov
embe
r 18
, 202
1

(17), but these are often time-consuming and challenging toimplement. Theoretical expectations for functional relationshipsbetween internal state, prior experience, and landscape charac-teristics are poorly developed. In the absence of parametricmodels, f lexible regressive approaches such as artificial neuralnets are a useful alternative (20), albeit at the cost of mechanisticunderstanding.
The most serious challenge, however, is accurate measure-ment of local variables, like food abundance or the distributionof other population members, at a meaningful landscape scale.Habitat may be a suitable proxy for critical resources in somecases, but this has been rarely tested. The reliability of thisassumption will no doubt profoundly influence the predictiveability of resource-based movement models. Only at fine scalescan we feel truly confident about our ability to link transitions inmovement mode with underlying ecological variables (33). Atthis fine scale, however, other processes such as social interac-tions are less apparent. Although reliable identification of causalfactors will be challenging in the extreme, the analytical toolsnow available suggest that the effort would be amply repaid.
Materials and MethodsStudy Area. The study was carried out near the town of Bancroft, located ineast-central Ontario. The terrain is flat to rolling, with vegetated areas punc-tuated by areas of exposed bedrock. Small rivers and lakes are commonthroughout the region. The larger landscape is a heterogeneous mix ofabandoned farmland, cleared plots occupied by housing, and dominant,extensive tracts of secondary growth forest. Moist low-lying areas tend to bedominated by coniferous species, such as Picea glauca or Abies balsamea,whereas higher, drier areas are dominated by deciduous species, such as Acersaccharum, Betula papyrifera, or Populus tremuloides.
Movement Data. One hundred twenty elk originating from Elk Island NationalPark, Alberta, were transferred to the Bancroft region in 2000 and 2001 as partof a province-wide reintroduction program (34). Almost all of these individ-uals were VHF radio-collared and tracked and located approximately onceevery 2 weeks, for up to 6 years. Most locations are based on triangulation oftelemetry fixes on the ground, sometimes confirmed by visual sightings, withoccasional aerial coverage. During the course of the study, 11 elk cows werefitted with LOTEK GPS radio-telemetry collars, 4 individuals in 2001 and 7individuals in 2003, which automatically stored GPS locations on fixed sam-pling schedules (typically one fix every 4 h, with hourly fixes on one day every2 weeks).
Elk movement behavior at a fine spatiotemporal scale was studied bysnow-tracking in the winters of 2003 and 2004. Tracking only occurred within12 h after fresh snowfall to ensure that measurements reflected recentmovement. We initially located study animals on foot using radio-telemetryand thereafter used direct physical mensuration of elk tracks to estimatemovement parameters. Sections of elk tracks that deviated �10° were oper-ationally defined as line segments. Deviations of �10° were used to defineturning points. We then recorded the bearing between sequential turningpoints, measured the segment length, and counted the number of strides permovement segment. The longest, clearly decipherable section of a movementtrajectory was investigated, starting from a bed site and ending at another
bed site or when the tracks became obscured by tracks of other individuals. Werecorded information on 21 movement paths of female elk: 11 paths were ofsolitary animals and 10 of individual animals moving in groups. Within theherds, sex was determined by footprint size and stride length using observa-tions from the known solitary animals as the standard female track size.
Data Analysis. Coarse scale. We used biweekly location data to investigate theform of the relationship between the net squared displacement and time sincerelease, the main statistics used to characterize movement patterns over longtime scales. Diffusive processes lead to a linear or power function relationshipbetween the average net squared displacement and time, whereas a switch toan asymptotic curve is indicative of locally restricted space use patterns, suchas home-ranges (7, 21–23).
For the analysis of net squared displacement, we selected females followedfor at least a year with at least 15 biweekly VHF telemetry locations. Of theinitial sample of 120 radio-collared elk, 48 females, aged 0–12 years at releaseand followed for up to 6 years (4 years on average), met these criteria. Onaverage, 72 locations were available per individual (range 15–128) for a totalof 4,197 locations.
Data analysis was performed in the R software environment, version 2.6.1(35). We used generalized additive mixed models with thin plate regressionsplines estimated using a generalized cross-validation procedure [mgcv, ver-sion 1.3–29 (36)], to explore the shape of net squared displacement over time(days since release) without imposing a priori any parametric function. Thisprocedure allowed us to include the identity of individuals as a random effect.Serial autocorrelation between biweekly locations was accounted for by usingautoregressive models of order three for the within-group errors, based onAIC scores, and we allowed the variance to change over time and between thetwo release years (36, 37). We also included the release year as a two-levelfactor in the fixed-effects specification to test for differences in displacementdistances.Intermediate scale. For analysis of movement at intermediate spatiotemporalscales, we subsampled one location per day from the GPS data, using the firstGPS location recorded each day. Movement during the dispersive phase wasdescribed by using a biphasic correlated random walk. Parameters for eachmovement model, including the switching rates between modes, were esti-mated by using Markov chain Monte Carlo methods. Supplementary statisticalmaterial for model selection is provided in ref. 17. Using also the VHF data, forspecified dates, we computed an inter-elk location distance matrix on whichwe performed cluster analysis. We assumed that individuals �2 km apartbelonged to the same group. For each location datum, we asked how manyother collars had been tracked within 2 km of this location within 4 days ofeither side of the focal date. Location data around which no other collars wereto be found were termed solitary, otherwise grouped. Changes in group statuswere also recorded, allowing estimation of the rate at which individuals leftgroups or the rate that new groups were formed. We assumed that individualsin the same group followed the same biphasic correlated random walk thathad been parameterized for solitary individuals but with different switchingrates between behavioral states (for full details, see ref. 19).
After elk dispersion had slowed over time, we selected five new elk withGPS collars that had settled into home-ranges. Landscape structure was rep-resented in Cartesian grids with 10 � 10 elements superimposed over eachindividual’s annual home-range (termed the resource map). We used theOntario Landcover Database to assign landscape values, using the followingprocedure. Separate binary maps were constructed by using the presence orabsence of each of 28 landcover types within each cell. The 28 separate layerswere combined by using principal components analysis to provide a singlehabitat value at each spatial location, as described in detail in ref. 20.
At each daily time step, we constructed 10 � 10 element matrices depictingthe distance from the animal to each cell in the landscape (termed the distancemap) and the distance to the closest approach during a previous time interval(termed the memory map). Because animal positions were constantly in flux,the distance and memory maps needed to be updated with each daily timestep, whereas the resource map was static. The three maps were linked inmultifactorial fashion to predict the likelihood of movement during the nexttime step, and these stepwise probabilities were multiplied together to yieldthe likelihood surfaces for movement, based on the influence of resources,memory, and distance from the current position. Because we had no a priorimodel with which these variables could be linked, we used an artificial neuralnet to parameterize nonlinear likelihood models to minimize residual spatialpositioning error (for full details, see ref. 20).Fine scale. Fine-scale movements during the winter were studied by closelyexamining elk footprints in the snow in relation to the local abundance ofvegetation in the immediate vicinity. Typically, movement paths led directly tobrowsed stems. Any woody stem within 1 m of the movement path with fresh,
Fig. 6. The probability of foraging by elk in relation to patch quality(measured as digestible energy density kJ/m2), based on logistic regression formerged data for 11 solitary elk.
19118 � www.pnas.org�cgi�doi�10.1073�pnas.0801737105 Fryxell et al.
Dow
nloa
ded
by g
uest
on
Nov
embe
r 18
, 202
1

green bites removed from it was defined as being browsed. A given segmentwas defined as a foraging segment when at least one browsing event oc-curred. Typically, there was either a great deal of browsing or none at allduring segments, so the distinction between foraging versus nonforagingsegments was straightforward. There was little evidence of deer or moose inthe fine-scale study areas used by elk. Previous cervid foraging studies havedocumented that black-tailed deer base local foraging decisions on resourceswithin 5 m of the forager’s trajectory (38), which we arbitrarily assumed forelk. All woody stems within 5 m of an individual’s movement path (a 10-mcorridor in total) were recorded. All available woody stems above the snowwere counted, as well as species identity, stem diameter, and orthogonaldistance from the movement path. Stem biomass was estimated from stemdiameter by using published allometric regression equations (39–41) andthen multiplied by stem density to estimate local woody biomass.
Bootstrapping was used for statistical comparison of the distributions ofturn angles and move lengths of segments in which elk foraged versussegments without foraging. For both parameters (angle and move length), weused nonforaging segments as the expectation against which foraging seg-
ments were compared. Turn angle data were grouped into 10° bins, whereasmove length data were grouped into 1-m bins. Bootstrap sampling was donewith replacement, using a X2 statistic to score the deviation between boot-strapped and observed distributions. The bootstrapped X2 distribution wasthen examined to determine the proportion of values that were as extreme asthe observed X2 statistic, giving an estimate of the probability of overlapunder the null statistical hypothesis.
ACKNOWLEDGMENTS. We gratefully acknowledge field assistance by a largenumber of individuals over the years, as well as very useful editorial sugges-tions by Ran Nathan and an anonymous reviewer. We warmly thank theInstitute for Advanced Studies at the Hebrew University of Jerusalem for theopportunity to develop some of these ideas through the Movement EcologyWorking Group. This work was made possible with the financial support of theOntario Graduate Scholarship Program, the Ontario Ministry of Natural Re-sources, the Rocky Mountain Elk Foundation, the Natural Sciences and Engi-neering Research Council of Canada Collaborative Research OpportunitiesProgram, and U.S. National Science Foundation Integrated Research Chal-lenges in Environmental Biology Program Grant 6078130.
1. Nathan R, et al. (2008) A movement ecology paradigm for unifying organismalmovement research. Proc Natl Acad Sci USA 105:19052–19059.
2. Blackwell PG (1997) Random diffusion models for animal movement. Ecol Modell100:87–102.
3. Skalski GT, Gilliam JF (2003) A diffusion-based theory of organism dispersal in heter-ogeneous populations. Am Nat 161:441–458.
4. Bartumeus F, Da Luz MGE, Viswanathan GM, Catalan J (2005) Animal search strategies:A quantitative random-walk analysis. Ecology 86:3078–3087.
5. Morales JM, Fortin D, Frair J, Merrill E (2005) Adaptive models for large herbivoremovements in heterogeneous landscapes. Landsc Ecol 20:301–316.
6. Schmitt FG, Seuront L, Hwang JS, Souissi S, Tseng LC (2006) Scaling of swimmingsequences in copepod behavior: Data analysis and simulation. Physica A 364:287–296.
7. Gautestad AO, Mysterud I (2005) Intrinsic scaling complexity in animal dispersion andabundance. Am Nat 165:44–55.
8. Tan ZJ, Zou XW, Huang SY, Zhang W, Jin ZZ (2002) Random walk with memoryenhancement and decay. Phys Rev E 65:041101.
9. Zhang XX, Johnson SN, Crawford JW, Gregory PJ, Young IM (2007) A general randomwalk model for the leptokurtic distribution of organism movement: Theory andapplication. Ecol Modell 200:79–88.
10. Sibly RM, Nott HMR, Fletcher DJ (1990) Splitting behaviour into bouts. Anim Behav39:63–69.
11. Johnson CJ, Parker KL, Heard DC, Gillingham MP (2002) Movement parameters ofungulates and scale specific responses to the environment. J Anim Ecol 71:225–235.
12. Blackwell PG (2003) Bayesian inference for Markov processes with diffusion anddiscrete components. Biometrika 90:613–627.
13. Newlands NK, Lutcavage ME, Pitcher TJ (2004) Analysis of foraging movements ofAtlantic Bluefin tuna (Thunnus thynnus): individuals switch between two modes ofsearch behaviour. Pop Ecol 46:39–53.
14. Nolet BA, Mooij WM (2002) Search paths of swans foraging on spatially autocorrelatedtubers. J Anim Ecol 71:451–462.
15. Fritz H, Said S, Weimerskirch H (2003) Scale dependent hierarchical adjustments ofmovement patterns in a long-range foraging seabird. Proc R Soc London Ser B270:1143–1148.
16. Fauchald P, Tveraa T (2003) Using first-passage time in the analysis of area-restrictedsearch and habitat selection. Ecology 84:282–288.
17. Morales JM, Haydon DT, Frair J, Holsinger KE, Fryxell JM (2004) Extracting more out ofrelocation data: Building movement models as mixtures of random walks. Ecology85:2436–2445.
18. Jonson ID, Myers RA, James MC (2007) Identifying leatherback turtle foraging behav-iour from satellite telemetry using a switching state-space model. Mar Ecol Prog Ser337:255–264.
19. Haydon DT, et al. (2008) Socially-informed random walks: incorporating group dy-namics into models of population spread and growth. Proc R Soc London Ser B275:1101–1109.
20. Dalziel BD, Morales JM, Fryxell JM (2008) Fitting probability distributions to animalmovement trajectories: dynamic models linking distance, resources, and memory. AmNat 172:248–258.
21. Skellam J (1951) Random dispersal in theoretical populations. Biometrika 38:196–218.22. Turchin P (1998) Quantitative Analysis of Movement (Sinauer, Sunderland, MA).23. Moorcroft PR, Lewis MA (2006) Mechanistic Home Range Analysis (Princeton Univ
Press, Princeton).24. Arditi R, Dacorogna B (1988) Optimal foraging on arbitrary food distributions and the
definition of habitat patches. Am Nat 131:837–846.25. FocardiS,MarcelliniP,MontanaroP (1996)Doungulatesexhibita food-density threshold?
A field study of optimal foraging and movement patterns. J Anim Ecol 65:606–620.26. Benhamou S (1992) Efficiency of area-concentrated searching behaviour in a contin-
uous patchy environment. J Theor Biol 159:67–81.27. Zollner PA, Lima S (1999) Search strategies for landscape level interpatch movement.
Ecology 80:1019–1030.28. Smith JNM (1974) The food searching behaviour of European thrushes II: The adapt-
edness of search patterns. Behaviour 49:1–61.29. Viswanathan GM, et al. (1999) Optimizing the success of random searches Nature
401:911–914.30. Ward D, Saltz D (1994) Foraging at different spatial scales: Dorcas gazelles foraging for
lilies in the Negev desert. Ecology 75:48–58.31. Fortin D (2003) Searching behaviour and use of sampling information by free-ranging
Bison (Bos bison). Behav Ecol Sociobiol 54:194–203.32. Jenkins D, et al. (2007) Winter resource selection of reintroduced elk and sympatric
white-tailed deer at multiple spatial scales. J Mammal 88:614–624.33. Getz W, Saltz D (2008) A framework for generating and analyzing movement paths on
ecological landscapes. Proc Nat Acad Sci USA 105:19066–19071.34. Rosatte R, Hamr J, Young J, Filion I, Smith H (2007) The restoration of elk (Cervus
elaphus) in Ontario: 1998–2005. Restor Ecol 15:34–43.35. R Development Core Team (2007) R: A Language and Environment for Statistical
Computing (R Foundation for Statistical Computing, Vienna).36. Wood SN (2006) Generalized Additive Models: An Introduction with R (Chapman &
Hall/CRC, London).37. Pinheiro JC, Bates DM (2000) Mixed-Effects Models in S and S-Plus (Springer, New York).38. Gillingham MP, Bunnell FL (1989) Effects of learning on food selection and searching
behaviour of deer. Can J Zool 67:24–32.39. Tritton LM, Hornbeck JW (1982) Biomass Equations for the Major Tree Species in the
Northeast (Northeastern Forest Experiment Station, US Department of Agriculture),General Technical Report.
40. Smith BW, Brand GJ (1983) Allometric Biomass Equations for 98 Species of Herbs,Shrubs and Small Trees (North Central Forest Experiment Station, US Department ofAgriculture), Research Notes.
41. Ter-Mikaelian M, Korzukhin MD (1997) Biomass equations for sixty-five North Amer-ican tree species. For Ecol Manage 97:1–24.
Fryxell et al. PNAS � December 9, 2008 � vol. 105 � no. 49 � 19119
ECO
LOG
YSP
ECIA
LFE
ATU
RE
Dow
nloa
ded
by g
uest
on
Nov
embe
r 18
, 202
1