Embed Size (px)
Citation preview

micromachines
Article
Multiplexed PCR-Free Detectionof MicroRNAs in Single Cancer Cells Usinga DNA-Barcoded Microtrough Array Chip
Nayi Wang 1, Yao Lu 1 , Zhuo Chen 1 and Rong Fan 1,2,3,4,*1 Department of Biomedical Engineering, Yale University, New Haven, CT 06520, USA;
[email protected] (N.W.); [email protected] (Y.L.); [email protected] (Z.C.)2 Yale Cancer Center, Yale University School of Medicine, New Haven, CT 06520, USA3 Yale Stem Cell Center, Yale University School of Medicine, New Haven, CT 06520, USA4 Human and Translational Immunology Program, Yale University School of Medicine,
New Haven, CT 06520, USA* Correspondence: [email protected]
Received: 8 March 2019; Accepted: 25 March 2019; Published: 27 March 2019�����������������
Abstract: MicroRNAs are a class of small RNA molecules that regulate the expression of mRNAs ina wide range of biological processes and are implicated in human health and disease such as cancers.How to measure microRNA profiles in single cells with high throughput is essential to the developmentof cell-based assays for interrogating microRNA-mediated intratumor heterogeneity and the designof new lab tests for diagnosis and monitoring of cancers. Here, we report on an in situ hybridizationbarcoding workflow implemented in a sub-nanoliter microtrough array chip for high-throughputand multiplexed microRNA detection at the single cell level. The microtroughs are used to encapsulatesingle cells that are fixed, permeabilized, and pre-incubated with microRNA detection probes, each ofwhich consists of a capture strand complementary to specific microRNA and a unique reporter strandthat can be photocleaved in the microtroughs and subsequently detected by an array of DNA barcodespatterned on the bottom of the microtroughs. In this way, the measurement of reporter strandsreleased from single cells is a surrogate for detecting single-cell microRNA profiles. This approachpermits direct measurement of microRNAs without PCR amplification owing to the small volume(<1 nL) of microtroughs. It offers high throughput and high multiplexing capability for evaluatingmicroRNA heterogeneity in single cells, representing a new approach toward microRNA-baseddiagnosis and monitoring of complex human diseases.
Keywords: single-cell analysis; microRNA; DNA barcoding; microtrough arrays
1. Introduction
MicroRNAs (miRNAs ), an important class of small RNAs , are involved in nearly all biologicalprocesses including cell proliferation, differentiation, and metabolism [1–5]. They regulate messengerRNA (mRNA) expression level or function via mRNA translation repression or RNA degradation [1].Dysregulated apoptosis or abnormal proliferation of cells, often implicated in human cancers,can be induced by miRNAs [6–8]. Deletion of tumor-suppressive miRNAs (TS-miRs) or overexpression of oncogenic miRNAs (onco-miRs) have been identified in several types of cancer [9–11].However, due to the complex regulatory mechanism of miRNAs in modulating target mRNAs ,how to understand the exact role of each miRNA in every cell and how to translate such findings toa miRNA biomarker assay for clinical diagnostics is a challenging task. In particular, due to non-geneticcell-cell heterogeneity in development or tumors [3,5,12], it is required to conduct multiplexedmiRNA measurements at the level of single cells. To date, despite the recent progress in single-cell small
Micromachines 2019, 10, 215; doi:10.3390/mi10040215 www.mdpi.com/journal/micromachines

Micromachines 2019, 10, 215 2 of 11
RNA sequencing [13,14], how to measure a panel of miRNAs in a highly-multiplexed manner fromhundreds to thousands of single cells such that intratumor miRNA heterogeneity can be quantitativelyexamined with high statistical power, is still difficult. Moreover, how to perform such assays inthe clinical settings via a rapid on-site test is a challenge that needs to be overcome to bring single cellmiRNA profiles to cancer diagnosis and classification.
A majority of existing microRNA detection technologies such as RT-PCR or microarray-basedmiRNA assays are not suitable for single cell analysis [15,16]. The PreAmp workflow (ABI/Thermo Fisher,Waltham, MA, USA) adds an intermediate step between RT and real-time PCR to pre-amplify cDNA priorto qPCR detection [17]. However, it is mainly for single-plex real-time PCR, and each PCR tube containsone cell, which is a low throughput and labor intense process. AmpliGrid microwell array-basedsingle cell capture chip allows for medium throughput miRNA assay on 48 single cells per chip [18].However, this technology is costly and has very limited multiplexing capability. To execute the conventionalRNA processing workflow at the level of single cells requires miniaturized fluid handling systems toconduct multi-step RNA extraction, chemical modification, purification, and amplification, for example,in a Fluidigm C1™ (South San Francisco, CA, USA) Single-Cell Auto Prep System [19]. It is one of the mostpowerful systems for complex biochemical workflow at the nanoliter scale and together with the BioMarkHD System allows for processing of ~96 single cells for a panel of genes [20]. However, this device is costly,and the workflow is time consuming. A microfluidic chip was reported for analyzing >1000 single cells foron-chip qRT-PCR detection of 1 or 2 miRNA biomarkers simultaneously but is still yet to demonstratehighly multiplexed detection. As of today, these technologies either lack the ability of a highly multiplexedassay or only offers low to medium throughput. Moreover, most of these methods are time-consuming,costly, or clinically impractical.
Here, we report on a sub-nanoliter microtrough array chip for multiplexed and high-throughputmiRNA detection at the single-cell level. The microtroughs are used to encapsulate single cancer cellsthat were fixed, permeabilized, and pre-incubated with a set of uniquely designed miRNA detectionprobes, each of which consists of a DNA oligomer capture strand complementary to the miRNA ofinterest and the other half is a unique reporter strand that can be cleaved inside the microtrough uponUV exposure. The cleaved reporter strands are then captured by an array of DNA barcodes pattern onthe bottom of each microtrough such that the detection of reporter strands with known sequences isa surrogate for detecting miRNAs in single cells via in situ hybridization and barcoding. This approachhad demonstrated the limit of detection for miRNAs down to the single-cell level without PCRamplification due in part to the small volume (<1 nL) of microtroughs. It offers high throughputand high multiplexing capability for examining miRNA heterogeneity in single cancer cells.
2. Materials and Methods
2.1. Fabrication of Flow Patterning Device for Creating DNA Barcode Microarrays
DNA barcode array slides were fabricated in-house using a flow patterning technology wereported previously [21–26]. The microfluidic chip used to perform flow patterning was fabricated withpolydimethylsiloxane (PDMS) using soft lithography techniques [27–29]. The master molds for replicatingPDMS were fabricated on silicon wafers using deep reactive ion etching (DRIE) [30,31]. After overnighttreatment of the master mold with trimethylchlorosilane (TMCS) (Aldrich, St. Louis, MS, USA), PDMSprepolymer and curing agent, mixed in 10:1 ratio, were poured into the silicon master, degassed, and thencured in a convection oven at 80 ◦C for 3 h. Afterwards, the PDMS layer was peeled off from the mold, cutinto rectangular slabs with desired dimensions, and access holes punched for fluidic insets and outlets.Before using them, the PDMS slabs were cleaned in 50% (vol/vol) 2-isopropanol and then in DI waterfor 30 min. At last, the PDMS chips were bound to a poly-l-lysine microarray slide (Thermo-Scientific) forflow patterning.

Micromachines 2019, 10, 215 3 of 11
2.2. Fabrication of Sub-Nanoliter Microtrough Array Chips
The sub-nanoliter microtrough array chips were also fabricated with PDMA using soft lithography.The master mold used herein was made of SU8 2010 negative photoresist (~15 µm in thickness)lithographically patterned on a silicon wafer. Following the similar procedures described above,the resultant microtrough array PDMS chip contains 14 columns, each of which consists of 550 microtroughs.Thus, each device has 7700 microtroughs in total for single cell isolation. Each microtrough measures 15 µmin width, 10 µm in depth, 1850 µm in length, and 20 µm in spacing.
2.3. Flow Patterning of DNA Oligomers for Detecting The Reporter Probes
DNA probes were immobilized onto a high-quality poly-L-lysine (PLL)-coated glass slide to formDNA barcode arrays using a flow patterning technology. Added to the inlet of the microfluidic channelwas 2 µL of capture DNA probe prepared at 500 µM, and each of the microchannels was loaded witha different DNA barcode oligomer (see DNA sequences in Supplementary Tables S1 and S2). In orderto increase the uniformity and loading density of the DNA probe, 30% dimethyl sulfoxide (DMSO)was used to prepare these DNA solutions [32]. The external pressure used for flow pattering wasbetween 1–3 psi. Once the DNA oligo solutions were flowed through to the reach outlets, the entiredevice comprising the PLL-coated glass slide and the flow patterning PDMS chip still remainedassembled and directly moved into a desiccator overnight to allow for slow evaporation and uniformdeposition of DNA oligomers on the surface of the glass slide. After complete evaporation, the PDMSlayer was carefully removed by submerging the whole device in the blocking buffer (1% BSA/PBS).Finally, the glass slide was rinsed with deionized water and gently dried with forced nitrogen gas.
2.4. Design of MicroRNA Capture and Reporter Probes
In our multiplex assay panel, 13 endogenous miRNAs were chosen because they are either knownto be involved in multiple human cancers or specifically expressed in human myeloid leukemia cells,including the cell line used in this study (e.g., miR-16, miR-21, mir-146a and mir-221) [33–37]. In orderto obtain high detection sensitivity with fluorescence, we chose to use a biotinylated probe that canbe detected with ultra-bright phycoerythrin-conjugated streptavidin reporter (SA-PE). In this study,we designed a set of 13 DNA oligomers, each of which contains a sequence for detecting miRNA viahybridization and a distinct sequence as reporter that can be photocleaved by exposure to ultraviolet(UV) light and then detected by flow-patterned DNA barcodes.
2.5. Population Level Multiplexed MicroRNA Assay
To validate the performance of these probes at the population level for the same cell line and inthe settings equivalent to single-cell microchip assays, we used the conventional pin-spotting techniqueto print all 13 DNA oligomers onto a PLL-coated glass slide for detecting miRNA reporter strandsreleased from a whole population of cells in an Eppendorf tube. A human mononuclear leukemiacell line THP-1 (ATCC) was used as the cancer cell model. THP-1 cells from the culture media werespun down and re-suspended in 0.2 mL of single-cell suspension with phosphate-buffered saline(PBS) in a 1 mL tube. Then, they were fixed using paraformaldehyde (4% in PBS) and permeabilizedusing 90% methanol. Afterwards, a cocktail of all 13 UV-cleavable miRNA capture/reporter probeswas added and incubated for 2 h at 37 ◦C to allow for in situ hybridization. Then, the cells were washedthoroughly 3 times with the Tris-EDTA-Triton X-100 (TET) buffer (0.05% Tween-20, pH = 8.0) containing350 mM NaCl. In between, the cells were incubated in TET buffer for 5 min to allow unboundDNA probes to diffuse out and be rinsed off from the interstitial space of the fixed cells. The tube wasthen placed in a UV exposure unit for ~20 min to cleave and release the reporter probes and then leftin a 37 ◦C incubator overnight. Finally, the supernatant was collected and added on the pin-spottedDNA oligo array on top of which was placed an eight-well (~5 mm in diameter) PDMS slab toconfine the fluid such that multiple samples can be assayed on the same DNA microarray slide.

Micromachines 2019, 10, 215 4 of 11
After incubation for 1 hour and rinsing with 1% BSA/PBS, SA-PE was used to read out the fluorescencesignals using a Genepix 4200A laser microarray scanner (Molecular Devices, San Jose, CA, USA) [24,38].
2.6. Single-Cell Multiplexed MicroRNA Assay
THP-1 cells were spun down and washed twice with cold Dulbecco’s phosphate-buffered saline(DPBS). First, the cells were re-suspended, fixed with paraformaldehyde (4% in PBS), and incubatedfor 10 min at 37 ◦C. The cells were spun down again and rinsed completely with DPBS to removethe paraformaldehyde solution. Secondly, 90% methanol was added into the sample tube and kepton ice for 30 min for permeabilization. After half an hour, methanol solution was removed.Third, a cocktail of photocleavable miRNA capture/reporter probes (1 µL each at a concentrationof 100 µM, which translates to 100 nanomole per probe) was added into 1 mL of single-cell suspensionand incubated at 37 ◦C for 2 h. Afterwards, cells were spun down and washed with TET buffersix times and re-suspend in 1 mL of fresh TET buffer (0.05% Tween-20 in TE buffer, pH = 8.0,containing 350 mM NaCl). Fourth, single-cell suspension at a density of 0.5 × 10⁶ cell/mL in TETbuffer was prepared and loaded into the microtrough array PDMS chip. In order to measure single-cellmiRNA profiles, the cells were isolated into a microtrough array by gravity and then fully sealed withthe DNA barcode glass slide. The volume of each microtrough is 0.55 nL. The DNA barcode microarraycontains immobilized DNA oligomers specifically for hybridization with the reporter strands.
The detailed procedure is the following. Single-cell suspension already fixed, permeabilized,and incubated with microRNA capture/reporter probes but not yet subjected to UV exposure,was pipetted to the microtrough array chip and then the immobilized DNA barcode slide wasplaced on top of the PDMS microtrough array, which was further clamped together with a setupshown in Figure 2a. After cell loading, the whole device was then exposed under a UV lampfor ~20 min followed by incubation at 37 ◦C overnight. The next day, the glass slide wasremoved from the microtrough array PDMS chip and washed with TET buffer solution severaltimes. A solution of SA-PE diluted by 1:100 in TET buffer was used to generate fluorescentsignals. Finally, the dried glass slide was scanned using a laser microarray scanner (Axon® GenepixProfessional 4200A, Molecular Devices, San Jose, CA, USA) with a 488 nm laser excitation and 532 nmfiltered PMT. Fluorescence intensities of the DNA barcodes can be quantified using the algorithmsreported previously.
2.7. Single-Cell FISH and qPCR Validation Experiments
We performed fluorescence in situ hybridization (FISH) on selected miRNAs (miR-16)and compared them to our single cell data. This was conducted using a protocol described bythe Dr. Singh group [39] and Dr. Tsourka [40]. In addition, qRT-PCR was also performed to detectthe same panel of microRNAs according to Qiagen’s protocol to validate our microchip-based assay.
3. Results
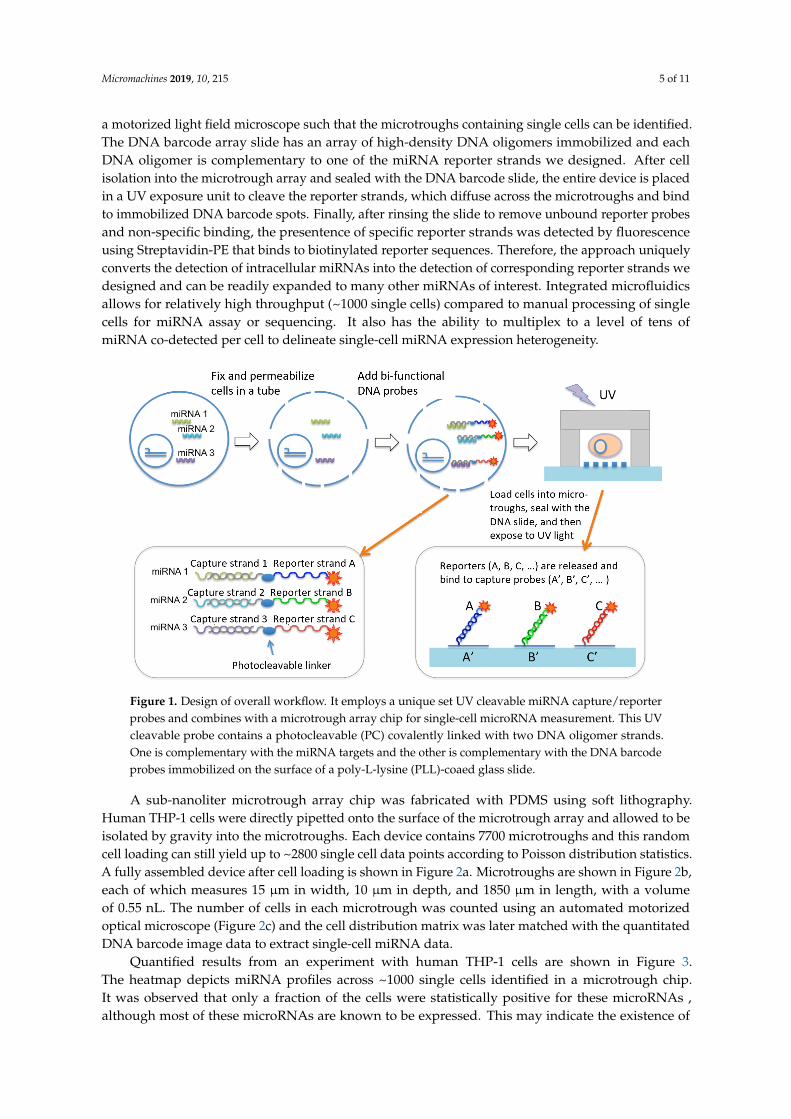
Our approach (Figure 1) was built upon a single-cell micro-trough miRNA assay chipand the design of a set of UV cleavable miRNA capture/reporter probes that bind to miRNAs of interestvia an in situ hybridization process in bulk, but after single-cell isolation in microtroughs are cleavedto release the reporter strands, which are subsequently detected using immobilized DNA barcodemicroarray in the same microtrough to achieve single-cell level miRNA measurement. Basically,a suspension of live cells in a conventional Eppendorf tube was fixed and permeabilized such thatcytosolic miRNAs are fixed inside the cell. MiRNAs of interest were probed by in situ hybridizationwith a bi-functional DNA probe containing a portion of sequence (called a detection strand)complementary to the miRNA of interest and the other portion being a unique sequence to reportthe presence of this miRNA (called a reporter strand). In between is a UV cleavable linker. A suspensionof cells that have been fixed, permeabilized, and incubated with the miRNA detection/report probes areloaded randomly to a microtrough array chip, sealed with a DNA barcode array slide, and imaged with
Micromachines 2019, 10, 215 5 of 11
a motorized light field microscope such that the microtroughs containing single cells can be identified.The DNA barcode array slide has an array of high-density DNA oligomers immobilized and eachDNA oligomer is complementary to one of the miRNA reporter strands we designed. After cellisolation into the microtrough array and sealed with the DNA barcode slide, the entire device is placedin a UV exposure unit to cleave the reporter strands, which diffuse across the microtroughs and bindto immobilized DNA barcode spots. Finally, after rinsing the slide to remove unbound reporter probesand non-specific binding, the presentence of specific reporter strands was detected by fluorescenceusing Streptavidin-PE that binds to biotinylated reporter sequences. Therefore, the approach uniquelyconverts the detection of intracellular miRNAs into the detection of corresponding reporter strands wedesigned and can be readily expanded to many other miRNAs of interest. Integrated microfluidicsallows for relatively high throughput (~1000 single cells) compared to manual processing of singlecells for miRNA assay or sequencing. It also has the ability to multiplex to a level of tens ofmiRNA co-detected per cell to delineate single-cell miRNA expression heterogeneity.
Micromachines 2019, 10, x 5 of 11
and each DNA oligomer is complementary to one of the miRNA reporter strands we designed. After cell isolation into the microtrough array and sealed with the DNA barcode slide, the entire device is placed in a UV exposure unit to cleave the reporter strands, which diffuse across the microtroughs and bind to immobilized DNA barcode spots. Finally, after rinsing the slide to remove unbound reporter probes and non-specific binding, the presentence of specific reporter strands was detected by fluorescence using Streptavidin-PE that binds to biotinylated reporter sequences. Therefore, the approach uniquely converts the detection of intracellular miRNAs into the detection of corresponding reporter strands we designed and can be readily expanded to many other miRNAs of interest. Integrated microfluidics allows for relatively high throughput (~1000 single cells) compared to manual processing of single cells for miRNA assay or sequencing. It also has the ability to multiplex to a level of tens of miRNA co-detected per cell to delineate single-cell miRNA expression heterogeneity.
Figure 1. Design of overall workflow. It employs a unique set UV cleavable miRNA capture/reporter probes and combines with a microtrough array chip for single-cell microRNA measurement. This UV cleavable probe contains a photocleavable (PC) covalently linked with two DNA oligomer strands. One is complementary with the miRNA targets and the other is complementary with the DNA barcode probes immobilized on the surface of a poly-L-lysine (PLL)-coaed glass slide.
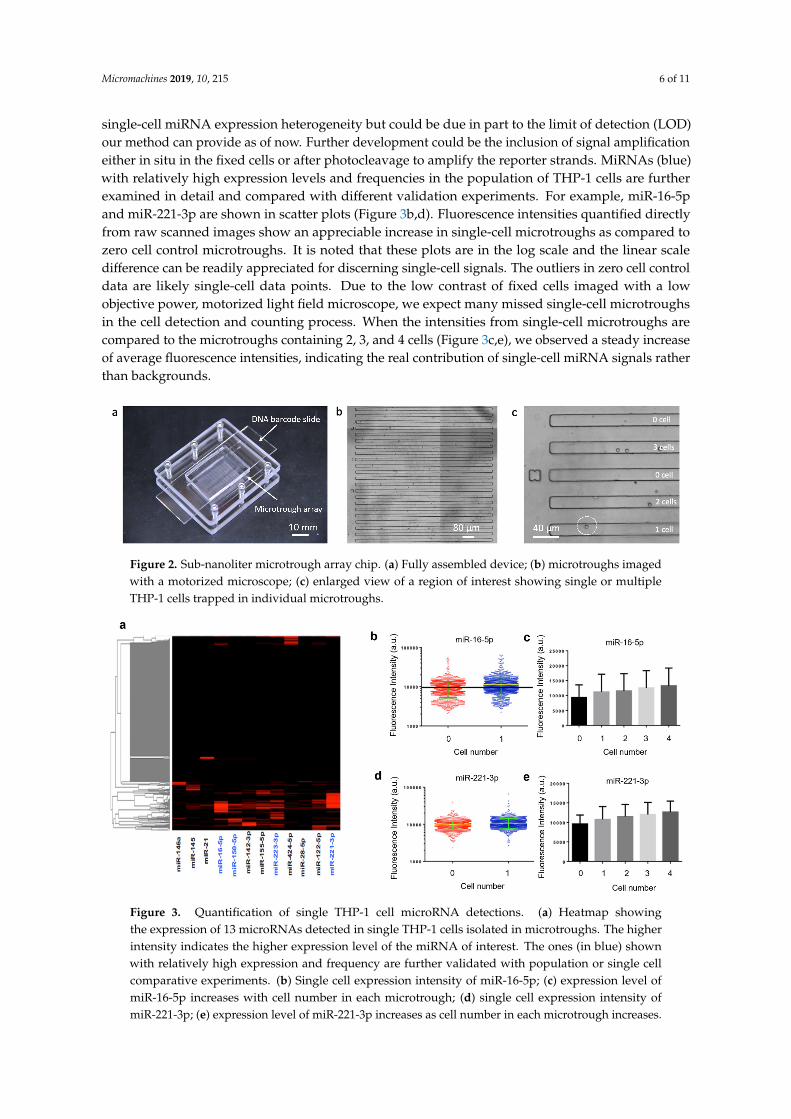
A sub-nanoliter microtrough array chip was fabricated with PDMS using soft lithography. Human THP-1 cells were directly pipetted onto the surface of the microtrough array and allowed to be isolated by gravity into the microtroughs. Each device contains 7700 microtroughs and this random cell loading can still yield up to ~2800 single cell data points according to Poisson distribution statistics. A fully assembled device after cell loading is shown in Figure 2a. Microtroughs are shown in Figure 2b, each of which measures 15 μm in width, 10 μm in depth, and 1850 μm in length, with a volume of 0.55 nL. The number of cells in each microtrough was counted using an automated motorized optical microscope (Figure 2c) and the cell distribution matrix was later matched with the quantitated DNA barcode image data to extract single-cell miRNA data.
Quantified results from an experiment with human THP-1 cells are shown in Figure 3. The heatmap depicts miRNA profiles across ~1000 single cells identified in a microtrough chip. It was observed that only a fraction of the cells were statistically positive for these microRNAs, although most of these microRNAs are known to be expressed. This may indicate the existence of single-cell miRNA expression heterogeneity but could be due in part to the limit of detection (LOD) our method can provide as of now. Further development could be the inclusion of signal amplification either in situ in the fixed cells or after photocleavage to amplify the reporter strands. MiRNAs (blue) with
Figure 1. Design of overall workflow. It employs a unique set UV cleavable miRNA capture/reporterprobes and combines with a microtrough array chip for single-cell microRNA measurement. This UVcleavable probe contains a photocleavable (PC) covalently linked with two DNA oligomer strands.One is complementary with the miRNA targets and the other is complementary with the DNA barcodeprobes immobilized on the surface of a poly-L-lysine (PLL)-coaed glass slide.
A sub-nanoliter microtrough array chip was fabricated with PDMS using soft lithography.Human THP-1 cells were directly pipetted onto the surface of the microtrough array and allowed to beisolated by gravity into the microtroughs. Each device contains 7700 microtroughs and this randomcell loading can still yield up to ~2800 single cell data points according to Poisson distribution statistics.A fully assembled device after cell loading is shown in Figure 2a. Microtroughs are shown in Figure 2b,each of which measures 15 µm in width, 10 µm in depth, and 1850 µm in length, with a volumeof 0.55 nL. The number of cells in each microtrough was counted using an automated motorizedoptical microscope (Figure 2c) and the cell distribution matrix was later matched with the quantitatedDNA barcode image data to extract single-cell miRNA data.
Quantified results from an experiment with human THP-1 cells are shown in Figure 3.The heatmap depicts miRNA profiles across ~1000 single cells identified in a microtrough chip.It was observed that only a fraction of the cells were statistically positive for these microRNAs ,although most of these microRNAs are known to be expressed. This may indicate the existence of
Micromachines 2019, 10, 215 6 of 11
single-cell miRNA expression heterogeneity but could be due in part to the limit of detection (LOD)our method can provide as of now. Further development could be the inclusion of signal amplificationeither in situ in the fixed cells or after photocleavage to amplify the reporter strands. MiRNAs (blue)with relatively high expression levels and frequencies in the population of THP-1 cells are furtherexamined in detail and compared with different validation experiments. For example, miR-16-5pand miR-221-3p are shown in scatter plots (Figure 3b,d). Fluorescence intensities quantified directlyfrom raw scanned images show an appreciable increase in single-cell microtroughs as compared tozero cell control microtroughs. It is noted that these plots are in the log scale and the linear scaledifference can be readily appreciated for discerning single-cell signals. The outliers in zero cell controldata are likely single-cell data points. Due to the low contrast of fixed cells imaged with a lowobjective power, motorized light field microscope, we expect many missed single-cell microtroughsin the cell detection and counting process. When the intensities from single-cell microtroughs arecompared to the microtroughs containing 2, 3, and 4 cells (Figure 3c,e), we observed a steady increaseof average fluorescence intensities, indicating the real contribution of single-cell miRNA signals ratherthan backgrounds.
Micromachines 2019, 10, x 6 of 11
relatively high expression levels and frequencies in the population of THP-1 cells are further examined in detail and compared with different validation experiments. For example, miR-16-5p and miR-221-3p are shown in scatter plots (Figures 3b,d). Fluorescence intensities quantified directly from raw scanned images show an appreciable increase in single-cell microtroughs as compared to zero cell control microtroughs. It is noted that these plots are in the log scale and the linear scale difference can be readily appreciated for discerning single-cell signals. The outliers in zero cell control data are likely single-cell data points. Due to the low contrast of fixed cells imaged with a low objective power, motorized light field microscope, we expect many missed single-cell microtroughs in the cell detection and counting process. When the intensities from single-cell microtroughs are compared to the microtroughs containing 2, 3, and 4 cells (Figures 3c,e), we observed a steady increase of average fluorescence intensities, indicating the real contribution of single-cell miRNA signals rather than backgrounds.
Figure 2. Sub-nanoliter microtrough array chip. (a) Fully assembled device; (b) microtroughs imaged with a motorized microscope; (c) enlarged view of a region of interest showing single or multiple THP-1 cells trapped in individual microtroughs.
Figure 3. Quantification of single THP-1 cell microRNA detections. (a) Heatmap showing the expression of 13 microRNAs detected in single THP-1 cells isolated in microtroughs. The higher intensity indicates the higher expression level of the miRNA of interest. The ones (in blue) shown with relatively high expression and frequency are further validated with population or single cell comparative experiments. (b) Single cell expression intensity of miR-16-5p; (c) expression level of miR-16-5p increases with cell number in each microtrough; (d) single cell expression intensity of miR-221-3p; (e) expression level of miR-221-3p increases as cell number in each microtrough increases.
In order to validate our data on the selected miRNAs successfully detected using our technology and workflow, we performed population-level experiments to measure the same panel of miRNAs
Figure 2. Sub-nanoliter microtrough array chip. (a) Fully assembled device; (b) microtroughs imagedwith a motorized microscope; (c) enlarged view of a region of interest showing single or multipleTHP-1 cells trapped in individual microtroughs.
Micromachines 2019, 10, x 6 of 11
relatively high expression levels and frequencies in the population of THP-1 cells are further examined in detail and compared with different validation experiments. For example, miR-16-5p and miR-221-3p are shown in scatter plots (Figures 3b,d). Fluorescence intensities quantified directly from raw scanned images show an appreciable increase in single-cell microtroughs as compared to zero cell control microtroughs. It is noted that these plots are in the log scale and the linear scale difference can be readily appreciated for discerning single-cell signals. The outliers in zero cell control data are likely single-cell data points. Due to the low contrast of fixed cells imaged with a low objective power, motorized light field microscope, we expect many missed single-cell microtroughs in the cell detection and counting process. When the intensities from single-cell microtroughs are compared to the microtroughs containing 2, 3, and 4 cells (Figures 3c,e), we observed a steady increase of average fluorescence intensities, indicating the real contribution of single-cell miRNA signals rather than backgrounds.
Figure 2. Sub-nanoliter microtrough array chip. (a) Fully assembled device; (b) microtroughs imaged with a motorized microscope; (c) enlarged view of a region of interest showing single or multiple THP-1 cells trapped in individual microtroughs.
Figure 3. Quantification of single THP-1 cell microRNA detections. (a) Heatmap showing the expression of 13 microRNAs detected in single THP-1 cells isolated in microtroughs. The higher intensity indicates the higher expression level of the miRNA of interest. The ones (in blue) shown with relatively high expression and frequency are further validated with population or single cell comparative experiments. (b) Single cell expression intensity of miR-16-5p; (c) expression level of miR-16-5p increases with cell number in each microtrough; (d) single cell expression intensity of miR-221-3p; (e) expression level of miR-221-3p increases as cell number in each microtrough increases.
In order to validate our data on the selected miRNAs successfully detected using our technology and workflow, we performed population-level experiments to measure the same panel of miRNAs
Figure 3. Quantification of single THP-1 cell microRNA detections. (a) Heatmap showingthe expression of 13 microRNAs detected in single THP-1 cells isolated in microtroughs. The higherintensity indicates the higher expression level of the miRNA of interest. The ones (in blue) shownwith relatively high expression and frequency are further validated with population or single cellcomparative experiments. (b) Single cell expression intensity of miR-16-5p; (c) expression level ofmiR-16-5p increases with cell number in each microtrough; (d) single cell expression intensity ofmiR-221-3p; (e) expression level of miR-221-3p increases as cell number in each microtrough increases.

Micromachines 2019, 10, 215 7 of 11
In order to validate our data on the selected miRNAs successfully detected using ourtechnology and workflow, we performed population-level experiments to measure the same panelof miRNAs in THP-1 cells. The first population experiment was performed using the same in situhybridization workflow and the same reagents including the whole set of 13 miRNA capture/reporterprobes and the DNA barcode array slide, except that the UV-cleaved reporter strands werereleased in the Eppendorf tube and collected in the bulk supernatant and the DNA barcodearray was fabricated using conventional pin-spotting. It was found that the most abundantmiRNAs detected at the population level were miR-16-5p and miR-221-3p (Figure 4a), which matchperfectly single-cell data (Figure 3) where these two are also the top-ranked miRNAs detectedat the single-cell level. In order to evaluate the possibility of system bias caused by the specificworkflow and reagents we designed in this study, we also performed a population-level validationexperiment with the conventional biochemistry workflow using well-established commercializedkits (e.g., Qiagen RNeasy Mini kit) to extract RNAs from the THP-1 cell lysate followed bypurification to generate population samples for quantitative RT-PCR detection of the same panelof miRNAs (Figure 4b). The highest-expression miRNAs identified by the conventional methods areagain miR-16 and miR-221, which demonstrated the validity of our method via in situ hybridizationand barcoding for single-cell miRNA measurement.
Micromachines 2019, 10, x 7 of 11
in THP-1 cells. The first population experiment was performed using the same in situ hybridization workflow and the same reagents including the whole set of 13 miRNA capture/reporter probes and the DNA barcode array slide, except that the UV-cleaved reporter strands were released in the Eppendorf tube and collected in the bulk supernatant and the DNA barcode array was fabricated using conventional pin-spotting. It was found that the most abundant miRNAs detected at the population level were miR-16-5p and miR-221-3p (Figure 4a), which match perfectly single-cell data (Figure 3) where these two are also the top-ranked miRNAs detected at the single-cell level. In order to evaluate the possibility of system bias caused by the specific workflow and reagents we designed in this study, we also performed a population-level validation experiment with the conventional biochemistry workflow using well-established commercialized kits (e.g., Qiagen RNeasy Mini kit) to extract RNAs from the THP-1 cell lysate followed by purification to generate population samples for quantitative RT-PCR detection of the same panel of miRNAs (Figure 4b). The highest-expression miRNAs identified by the conventional methods are again miR-16 and miR-221, which demonstrated the validity of our method via in situ hybridization and barcoding for single-cell miRNA measurement.
Figure 4. Population validation. (a) Population level measurement of microRNAs in THP-1 cells using the same in situ hybridization workflow in Figure 1 and the same reagents including microRNA detection/reporter probes and the DNA barcode array slide except that the UV-cleaved reporter probes were collected in the bulk supernatant and the DNA barcode array was fabricated using conventional pin-spotting. (b) qPCR result of THP-1 cell population experiment conducted using the standard cell lysis, RNA extraction, and qPCR workflow rather than in situ hybridization. The y-axis is the fluorescence intensity of certain kinds of miRNAs compared with the positive control U6. The x-axis represents 11 endogenous miRNAs and two controls.
To further validate the results at the single-cell level, we conducted single-cell fluorescent in situ hybridization (FISH) measurement on fixed THP-1 cells to detect miR-16 as compared to scramble (negative control). As shown in Figure 5a, the staining for nucleus with 4′,6-diamidino-2-phenylindole (DAPI) and miRNA signals using Allophycocyanin (APC) dye gave rise to bright signals, indicating the expression of miR-16 in these cells. If the FISH probe was modified with a scrambled sequence, the fluorescence intensity for APC is much reduced relative to DAPI (Figure 5b). The expression was further quantified for all single cells in ~10 image frames and the statistics unambiguously confirmed the expression of miR-16 (Figure 5c), which is the most abundant miRNA within our panel we successfully detected in THP-1 cells using our technology and workflow at both single-cell and population levels.
Figure 4. Population validation. (a) Population level measurement of microRNAs in THP-1cells using the same in situ hybridization workflow in Figure 1 and the same reagents includingmicroRNA detection/reporter probes and the DNA barcode array slide except that the UV-cleavedreporter probes were collected in the bulk supernatant and the DNA barcode array was fabricatedusing conventional pin-spotting. (b) qPCR result of THP-1 cell population experiment conductedusing the standard cell lysis, RNA extraction, and qPCR workflow rather than in situ hybridization.The y-axis is the fluorescence intensity of certain kinds of miRNAs compared with the positive controlU6. The x-axis represents 11 endogenous miRNAs and two controls.
To further validate the results at the single-cell level, we conducted single-cell fluorescent in situhybridization (FISH) measurement on fixed THP-1 cells to detect miR-16 as compared to scramble(negative control). As shown in Figure 5a, the staining for nucleus with 4′,6-diamidino-2-phenylindole(DAPI) and miRNA signals using Allophycocyanin (APC) dye gave rise to bright signals, indicatingthe expression of miR-16 in these cells. If the FISH probe was modified with a scrambled sequence,the fluorescence intensity for APC is much reduced relative to DAPI (Figure 5b). The expressionwas further quantified for all single cells in ~10 image frames and the statistics unambiguouslyconfirmed the expression of miR-16 (Figure 5c), which is the most abundant miRNA within ourpanel we successfully detected in THP-1 cells using our technology and workflow at both single-celland population levels.

Micromachines 2019, 10, 215 8 of 11Micromachines 2019, 10, x 8 of 11
Figure 5. Single-cell fluorescent in situ hybridization (FISH) for single-cell data validation. (a) Fluorescence image showing miR-16 detection by fluorescence in situ hybridization (FISH). (b) Fluorescence image from negative control using the scrambled sequence; Blue color is for DAPI and pink is for APC to report the FISH signal; (c) Quantitative analysis of single-cell miR-16 expression by FISH as compared to scramble. Each dot is a single cell.
4. Discussions
We demonstrated a novel workflow implemented in a microtrough array device to measure a panel of 13 miRNAs at the single-cell level. It was validated using population DNA microarray assay, population qRT-PCR assay, and single-cell FISH experiment. Although it was demonstrated for selected miRNAs and single-cell level detection limit, the background signal is still high, and the limit of detection is yet to be further increased to improve the performance in the future. To reduce the background of DNA barcode slide, additional blocking reagents such as yeast tRNA and salmon sperm DNA could be used together with 1% BSA/PBS. We noticed the increase of the washing time for cleaning the DNA barcode slide from 4 times to 8 times did not reduce the signal intensity but markedly decreased the background, resulting in increased signal-to-noise ratio. This biochemistry workflow can be improved by designing capture/reporter probes with increased binding efficiency between miRNA targets using hairpin structures. Increasing the incubation time or reaction temperature might be helpful to improve hybridization efficiency and specificity. The dimensions of the microtroughs can be modified to reduce the diffusion distance and increase the binding of probes to miRNAs in a fixed cell. It is known that miRNAs are wrapped by Argonaute (AGO) protein [41–44], which may decrease the efficiency of in situ hybridization, although miRNA FISH has been well demonstrated, widely used, and commercialized. This issue still exists at least for some miRNAs and may lead to a compounding factor in our data interpretation. For example, miRNAs with low detectable levels in our data could be attributed to low expression but could also be due to inaccessibility of the miRNA sequence complementary to our capture probe. Finally, this work does not require any amplification and has demonstrated single-cell level sensitivity for selected microRNAs in THP-1 cells. We anticipate the use of signal amplification methods such as the amplification of reporter strands either in cell or post photocleavage as well as the amplification of
Figure 5. Single-cell fluorescent in situ hybridization (FISH) for single-cell data validation. (a) Fluorescence imageshowing miR-16 detection by fluorescence in situ hybridization (FISH). (b) Fluorescence image from negativecontrol using the scrambled sequence; Blue color is for DAPI and pink is for APC to report the FISH signal;(c) Quantitative analysis of single-cell miR-16 expression by FISH as compared to scramble. Each dot is a single cell.
4. Discussions
We demonstrated a novel workflow implemented in a microtrough array device to measurea panel of 13 miRNAs at the single-cell level. It was validated using population DNA microarrayassay, population qRT-PCR assay, and single-cell FISH experiment. Although it was demonstrated forselected miRNAs and single-cell level detection limit, the background signal is still high, and the limitof detection is yet to be further increased to improve the performance in the future. To reducethe background of DNA barcode slide, additional blocking reagents such as yeast tRNA and salmonsperm DNA could be used together with 1% BSA/PBS. We noticed the increase of the washing time forcleaning the DNA barcode slide from 4 times to 8 times did not reduce the signal intensity but markedlydecreased the background, resulting in increased signal-to-noise ratio. This biochemistry workflowcan be improved by designing capture/reporter probes with increased binding efficiency betweenmiRNA targets using hairpin structures. Increasing the incubation time or reaction temperature mightbe helpful to improve hybridization efficiency and specificity. The dimensions of the microtroughs canbe modified to reduce the diffusion distance and increase the binding of probes to miRNAs in a fixedcell. It is known that miRNAs are wrapped by Argonaute (AGO) protein [41–44], which may decreasethe efficiency of in situ hybridization, although miRNA FISH has been well demonstrated, widely used,and commercialized. This issue still exists at least for some miRNAs and may lead to a compoundingfactor in our data interpretation. For example, miRNAs with low detectable levels in our data couldbe attributed to low expression but could also be due to inaccessibility of the miRNA sequencecomplementary to our capture probe. Finally, this work does not require any amplification and hasdemonstrated single-cell level sensitivity for selected microRNAs in THP-1 cells. We anticipate the useof signal amplification methods such as the amplification of reporter strands either in cell or postphotocleavage as well as the amplification of fluorescent signals on the DNA barcode slide could allfurther improve the performance of this technology.

Micromachines 2019, 10, 215 9 of 11
In summary, we have developed a new biochemical workflow implemented in a microtrougharray chip for single-cell multiplexed microRNA measurement. Recent advances [13,14,45] in the fieldof single-cell microRNA and mRNA sequencing have demonstrated the potential to co-sequenceboth small and large RNAs in same single cells and to identify novel regulatory mechanisms14
underlying the development of human cancers. Upon the discovery of the key miRNAs involvedin such mechanisms, how to reduce the measurement to a targeted miRNA panel but with highthroughput is important for translational development of single-cell miRNA assays for clinicalapplications. Our technology bridges the gap with the ability to multiplex to a dozen and potentiallytens of miRNA markers and the throughput required to measure ~1000 or more single cells in parallel,providing a new path toward miRNA-based detection and monitoring of complex human diseases.
Supplementary Materials: DNA sequences are available online at http://www.mdpi.com/2072-666X/10/4/215/s1, Table S1: Sequence design of 13 microRNA capture/reporter DNA oligomers; Table S2: Sequence ofDNA barcodes immobilized on the glass slide.
Author Contributions: Conceptualization, R.F.; methodology, R.F., N.W., and Y.L.; validation, N.W., Y.L. and Z.C.;data analysis, N.W., Y.L., and R.F.; writing—original draft preparation, N.W. and R.F.; writing—review and editing,N.W. and R.F.; supervision, R.F.; project administration, R.F.; funding acquisition, R.F.
Funding: This work was supported by R21CA177393 (to R.F.), U54CA193461 (to R.F.), U54CA209992(Sub-Project ID: 7297 to R.F.), National Science Foundation CAREER Award CBET-1351443 (to R.F.).We acknowledge the Yale SEAS Nanofabrication Center for supporting microchip fabrication.
Conflicts of Interest: R.F. served on Scientific Advisory Boards of IsoPlexis and Singleron Biotechnologies.All other authors declare no conflict of interest.
References
1. Bushati, N.; Cohen, S.M. MicroRNA functions. Annu. Rev. Cell Dev. Biol. 2007, 23, 175–205. [CrossRef]2. Lu, J.; Guo, S.; Ebert, B.L.; Zhang, H.; Peng, X.; Bosco, J.; Pretz, J.; Schlanger, R.; Wang, J.Y.; Mak, R.H.;
et al. MicroRNA-mediated control of cell fate in megakaryocyte-erythrocyte progenitors. Dev. Cell 2008,14, 843–853. [CrossRef] [PubMed]
3. Garg, S.; Sharp, P.A. GENE EXPRESSION Single-cell variability guided by microRNAs . Science 2016,352, 1390–1391. [CrossRef] [PubMed]
4. Denzler, R.; McGeary, S.E.; Title, A.C.; Agarwal, V.; Bartel, D.P.; Stoffel, M. Impact of MicroRNA Levels,Target-Site Complementarity, and Cooperativity on Competing Endogenous RNA-Regulated GeneExpression. Mol. Cell 2016, 64, 565–579. [CrossRef] [PubMed]
5. Schmiedel, J.M.; Klemm, S.L.; Zheng, Y.; Sahay, A.; Blüthgen, N.; Marks, D.S.; van Oudenaarden, A.MicroRNA control of protein expression noise. Science 2015, 348, 128–132. [CrossRef]
6. Calin, G.A.; Croce, C.M. MicroRNA signatures in human cancers. Nat. Rev. Cancer 2006, 6, 857–866.[CrossRef]
7. Lu, J.; Getz, G.; Miska, E.A.; Alvarez-Saavedra, E.; Lamb, J.; Peck, D.; Sweet-Cordero, A.; Ebert, B.L.;Mak, R.H.; Ferrando, A.A.; et al. MicroRNA expression profiles classify human cancers. Nature 2005,435, 834–838. [CrossRef]
8. Volinia, S.; Calin, G.A.; Liu, C.G.; Ambs, S.; Cimmino, A.; Petrocca, F.; Visone, R.; Iorio, M.; Roldo, C.;Ferracin, M.; et al. A microRNA expression signature of human solid tumors defines cancer gene targets.Proc. Natl. Acad. Sci. USA 2006, 103, 2257–2261. [CrossRef]
9. Stelzer, Y.; Sagi, I.; Benvenisty, N. Involvement of parental imprinting in the antisense regulation ofonco-miR-372-373. Nat. Commun. 2013, 4, 2724. [CrossRef]
10. Yu, J.; Wu, S.W.; Wu, W.P. A tumor-suppressive microRNA, miRNA-485-5p, inhibits glioma cell proliferationand invasion by down-regulating TPD52L2. Am. J. Transl. Res. 2017, 9, 3336–3344. [PubMed]
11. Svoronos, A.A.; Engelman, D.M.; Slack, F.J. OncomiR or Tumor Suppressor? The Duplicity of MicroRNAs inCancer. Cancer Res. 2016, 76, 3666–3670. [CrossRef] [PubMed]
12. Levitin, H.M.; Yuan, J.; Sims, P.A. Single-Cell Transcriptomic Analysis of Tumor Heterogeneity. Trends Cancer2018, 4, 264–268. [CrossRef] [PubMed]
13. Faridani, O.R.; Abdullayev, I.; Hagemann-Jensen, M.; Schell, J.P.; Lanner, F.; Sandberg, R. Single-cellsequencing of the small-RNA transcriptome. Nat. Biotechnol. 2016, 34, 1264–1266. [CrossRef] [PubMed]

Micromachines 2019, 10, 215 10 of 11
14. Wang, N.; Zheng, J.; Chen, Z.; Liu, Y.; Dura, B.; Kwak, M.; Xavier-Ferrucio, J.; Lu, Y.C.; Zhang, M.; Roden, C.;et al. Single-cell microRNA-mRNA co-sequencing reveals non-genetic heterogeneity and mechanisms ofmicroRNA regulation. Nat. Commun. 2019, 10, 95. [CrossRef] [PubMed]
15. Pritchard, C.C.; Cheng, H.H.; Tewari, M. MicroRNA profiling: Approaches and considerations. Nat. Rev. Genet.2012, 13, 358–369. [CrossRef]
16. Roden, C.; Mastriano, S.; Wang, N.Y.; Lu, J. microRNA Expression Profiling: Technologies, Insights,and Prospects. Adv. Exp. Med. Biol. 2015, 888, 409–421.
17. Li, J.; Smyth, P.; Cahill, S.; Denning, K.; Flavin, R.; Aherne, S.; Pirotta, M.; Guenther, S.M.; O’Leary, J.J.;Sheils, O. Improved RNA quality and TaqMan Pre-amplification method (PreAmp) to enhance expressionanalysis from formalin fixed paraffin embedded (FFPE) materials. BMC Biotechnol. 2008, 8, 10. [CrossRef]
18. Ok, C.Y.; Singh, R.R.; Salim, A.A. Single-Cell Quantitative PCR: Advances and Potential in CancerDiagnostics. Methods Mol. Biol. 2016, 1392, 153–159.
19. Gong, H.; Do, D.; Ramakrishnan, R. Single-Cell mRNA-Seq Using the Fluidigm C1 System and IntegratedFluidics Circuits. Methods Mol. Biol. 2018, 1783, 193–207.
20. Takousis, P. Analysis of Micro-RNA Expression by qPCR on a Microfluidics Platform for Alzheimer’s DiseaseBiomarker Discovery. Methods Mol. Biol. 2018, 1750, 283–292.
21. Rossi, J.; Paczkowski, P.; Shen, Y.W.; Morse, K.; Flynn, B.; Kaiser, A.; Ng, C.; Gallatin, K.; Cain, T.; Fan, R.;et al. Preinfusion polyfunctional anti-CD19 chimeric antigen receptor T cells are associated with clinicaloutcomes in NHL. Blood 2018, 132, 804–814.
22. Xue, Q.; Bettini, E.; Paczkowski, P.; Ng, C.; Kaiser, A.; McConnell, T.; Kodrasi, O.; Quigley, M.F.; Heath, J.;Fan, R.; et al. Single-cell multiplexed cytokine profiling of CD19 CAR-T cells reveals a diverse landscape ofpolyfunctional antigen-specific response. J. Immunother. Cancer 2017, 5, 85. [CrossRef] [PubMed]
23. Xue, Q.; Lu, Y.; Eisele, M.R.; Sulistijo, E.S.; Khan, N.; Fan, R.; Miller-Jensen, K. Analysis of single-cell cytokinesecretion reveals a role for paracrine signaling in coordinating macrophage responses to TLR4 stimulation.Sci. Signal 2015, 8, ra59. [CrossRef]
24. Lu, Y.; Xue, Q.; Eisele, M.R.; Sulistijo, E.S.; Brower, K.; Han, L.; Amir, E.A.D.; Pe’er, D.; Miller-Jensen, K.;Fan, R. Highly multiplexed profiling of single-cell effector functions reveals deep functional heterogeneity inresponse to pathogenic ligands. Proc. Natl. Acad. Sci. USA 2015, 112, E607–E615. [CrossRef] [PubMed]
25. Kleppe, M.; Kwak, M.; Koppikar, P.; Riester, M.; Keller, M.; Bastian, L.; Hricik, T.; Bhagwat, N.;McKenney, A.S.; Papalexi, E.; et al. JAK-STAT Pathway Activation in Malignant and Nonmalignant CellsContributes to MPN Pathogenesis and Therapeutic Response. Cancer Discov. 2015, 5, 316–331. [CrossRef][PubMed]
26. Lu, Y.; Chen, J.J.; Mu, L.; Xue, Q.; Wu, Y.; Wu, P.H.; Li, J.; Vortmeyer, A.O.; Miller-Jensen, K.; Wirtz, D.;et al. High-Throughput Secretomic Analysis of Single Cells to As sess Functional Cellular Heterogeneity.Anal. Chem. 2013, 85, 2548–2556. [CrossRef] [PubMed]
27. Whitesides, G.M.; Ostuni, E.; Takayama, S.; Jiang, X.; Ingber, D.E. Soft lithography in biologyand biochemistry. Annu. Rev. Biomed. Eng. 2001, 3, 335–373. [CrossRef] [PubMed]
28. Xia, Y.; Whitesides, G.M. Soft Lithography. Angew. Chem. Int. Ed. Engl. 1998, 37, 550–575. [CrossRef]29. Unger, M.A.; Chou, H.P.; Thorsen, T.; Scherer, A.; Quake, S.R. Monolithic microfabricated valves and pumps
by multilayer soft lithography. Science 2000, 288, 113–116. [CrossRef]30. Giang, U.B.; Lee, D.; King, M.R.; DeLouise, L.A. Microfabrication of cavities in polydimethylsiloxane using
DRIE silicon molds. Lab Chip 2007, 7, 1660–1662. [CrossRef] [PubMed]31. Karadimitriou, N.K.; Joekar-Niasar, V.; Hassanizadeh, S.M.; Kleingeld, P.J.; Pyrak-Nolte, L.J. A novel deep
reactive ion etched (DRIE) glass micro-model for two-phase flow experiments. Lab Chip 2012, 12, 3413–3418.[CrossRef]
32. Shin, Y.S.; Ahmad, H.; Shi, Q.; Kim, H.; Pascal, T.A.; Fan, R.; Goddard, W.A., III; Heath, J.R. Chemistries forPatterning Robust DNA MicroBarcodes Enable Multiplex Assays of Cytoplasm Proteins from Single CancerCells. Chemphyschem 2010, 11, 3063–3069. [CrossRef] [PubMed]
33. Liu, R.; Liu, C.; Chen, D.; Yang, W.H.; Liu, X.; Liu, C.G.; Dugas, C.M.; Tang, F.; Zheng, P.; Liu, Y.; et al.FOXP3 Controls an miR-146/NF-kappaB Negative Feedback Loop That Inhibits Apoptosis in Breast CancerCells. Cancer Res. 2015, 75, 1703–1713. [CrossRef]

Micromachines 2019, 10, 215 11 of 11
34. Guo, S.; Guo, W.; Li, S.; Dai, W.; Zhang, N.; Zhao, T.; Wang, H.; Ma, J.; Yi, X.; Ge, R.; et al. Serum miR-16:A Potential Biomarker for Predicting Melanoma Prognosis. J. Investig. Dermatol. 2016, 136, 985–993.[CrossRef]
35. Pfeffer, S.R.; Yang, C.H.; Pfeffer, L.M. The Role of miR-21 in Cancer. Drug Dev. Res. 2015, 76, 270–277.[CrossRef] [PubMed]
36. Stinson, S.; Lackner, M.R.; Adai, A.T.; Yu, N.; Kim, H.J.; O’Brien, C.; Spoerke, J.; Jhunjhunwala, S.; Boyd, Z.;Januario, T.; et al. TRPS1 targeting by miR-221/222 promotes the epithelial-to-mesenchymal transition inbreast cancer. Sci. Signal 2011, 4, ra41.
37. Le Sage, C.; Nagel, R.; Egan, D.A.; Schrier, M.; Mesman, E.; Mangiola, A.; Anile, C.; Maira, G.; Mercatelli, N.;Ciafrè, S.A.; et al. Regulation of the p27(Kip1) tumor suppressor by miR-221 and miR-222 promotes cancercell proliferation. Embo J. 2007, 26, 3699–3708. [CrossRef]
38. Elitas, M.; Brower, K.; Lu, Y.; Chen, J.J.; Fan, R. A microchip platform for interrogating tumor-macrophageparacrine signaling at the single-cell level. Lab Chip 2014, 14, 3582–3588. [CrossRef] [PubMed]
39. Wu, M.; Piccini, M.; Koh, C.Y.; Lam, K.S.; Singh, A.K. Single cell microRNA analysis using microfluidic flowcytometry. PLoS ONE 2013, 8, e55044. [CrossRef]
40. Lu, J.; Tsourkas, A. Imaging individual microRNAs in single mammalian cells in situ. Nucleic Acids Res. 2009,37, e100. [CrossRef] [PubMed]
41. Smibert, P.; Yang, J.S.; Azzam, G.; Liu, J.L.; Lai, E.C. Homeostatic control of Argonaute stability bymicroRNA availability. Nat. Struct. Mol. Biol. 2013, 20, 789–795. [CrossRef] [PubMed]
42. Golden, R.J.; Chen, B.; Li, T.; Braun, J.; Manjunath, H.; Chen, X.; Wu, J.; Schmid, V.; Chang, T.C.; Kopp, F.; et al.An Argonaute phosphorylation cycle promotes microRNA-mediated silencing. Nature 2017, 542, 197–202.[CrossRef]
43. Zhang, X.; Niu, D.; Carbonell, A.; Wang, A.; Lee, A.; Tun, V.; Wang, Z.; Carrington, J.C.; Chia-en, A.C.; Jin, H.ARGONAUTE PIWI domain and microRNA duplex structure regulate small RNA sorting in Arabidopsis.Nat. Commun. 2014, 5, 5468. [CrossRef] [PubMed]
44. Yang, J.S.; Smibert, P.; Westholm, J.O.; Jee, D.; Maurin, T.; Lai, E.C. Intertwined pathways forArgonaute-mediated microRNA biogenesis in Drosophila. Nucleic Acids Res. 2014, 42, 1987–2002. [CrossRef][PubMed]
45. Hagemann-Jensen, M.; Abdullayev, I.; Sandberg, R.; Faridani, O.R. Small-seq for single-cellsmall-RNA sequencing. Nat. Protoc. 2018, 13, 2407–2424. [CrossRef] [PubMed]
© 2019 by the authors. Licensee MDPI, Basel, Switzerland. This article is an open accessarticle distributed under the terms and conditions of the Creative Commons Attribution(CC BY) license (http://creativecommons.org/licenses/by/4.0/).