Embed Size (px)
Citation preview

Multiplexed Profiling of Single-cell Extracellular Vesicles Secretion
Yahui Ji1,2
, Dongyuan Qi3, Linmei Li
1, Haoran Su
1,2, Xiaojie Li
2, Yong Luo
4,
Bo Sun5, Fuyin Zhang
5, Bingcheng Lin
1,Tingjiao Liu*
2, Yao Lu*
1
1Department of Biotechnology, Dalian Institute of Chemical Physics, Chinese Academy of
Sciences, Dalian, 116023, China
2College of Stomatology, Dalian Medical University, Dalian, 116044, China
3First Affiliated Hospital of Dalian Medical University, Dalian, 116011, China
4State Key Laboratory of Fine Chemicals, Department of Chemical Engineering & School of
Pharmaceutical Science and Technology, Dalian University of Technology, Dalian, 116024,
China
5Second Affiliated Hospital of Dalian Medical University, Dalian, 116027, China
*Correspondence should be addressed to Y. Lu ([email protected]) or T.J.L.
was not certified by peer review) is the author/funder. All rights reserved. No reuse allowed without permission. The copyright holder for this preprint (whichthis version posted November 1, 2018. . https://doi.org/10.1101/459438doi: bioRxiv preprint
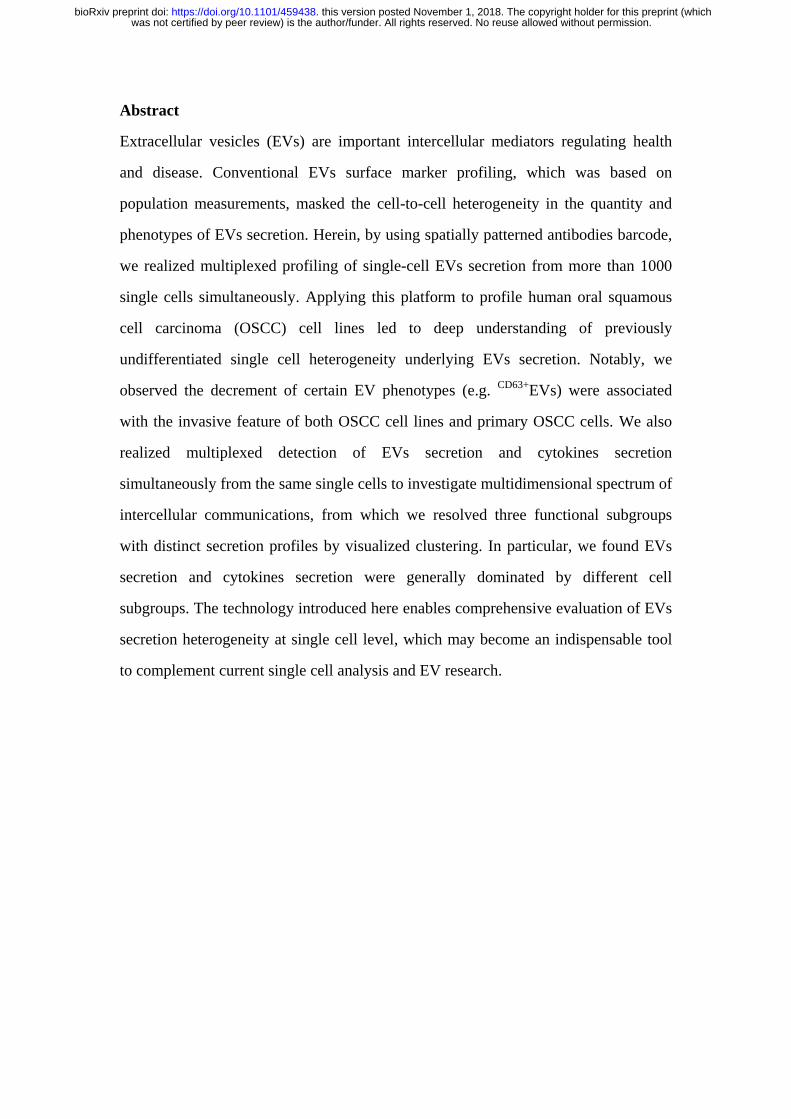
Abstract
Extracellular vesicles (EVs) are important intercellular mediators regulating health
and disease. Conventional EVs surface marker profiling, which was based on
population measurements, masked the cell-to-cell heterogeneity in the quantity and
phenotypes of EVs secretion. Herein, by using spatially patterned antibodies barcode,
we realized multiplexed profiling of single-cell EVs secretion from more than 1000
single cells simultaneously. Applying this platform to profile human oral squamous
cell carcinoma (OSCC) cell lines led to deep understanding of previously
undifferentiated single cell heterogeneity underlying EVs secretion. Notably, we
observed the decrement of certain EV phenotypes (e.g. CD63+
EVs) were associated
with the invasive feature of both OSCC cell lines and primary OSCC cells. We also
realized multiplexed detection of EVs secretion and cytokines secretion
simultaneously from the same single cells to investigate multidimensional spectrum of
intercellular communications, from which we resolved three functional subgroups
with distinct secretion profiles by visualized clustering. In particular, we found EVs
secretion and cytokines secretion were generally dominated by different cell
subgroups. The technology introduced here enables comprehensive evaluation of EVs
secretion heterogeneity at single cell level, which may become an indispensable tool
to complement current single cell analysis and EV research.
was not certified by peer review) is the author/funder. All rights reserved. No reuse allowed without permission. The copyright holder for this preprint (whichthis version posted November 1, 2018. . https://doi.org/10.1101/459438doi: bioRxiv preprint
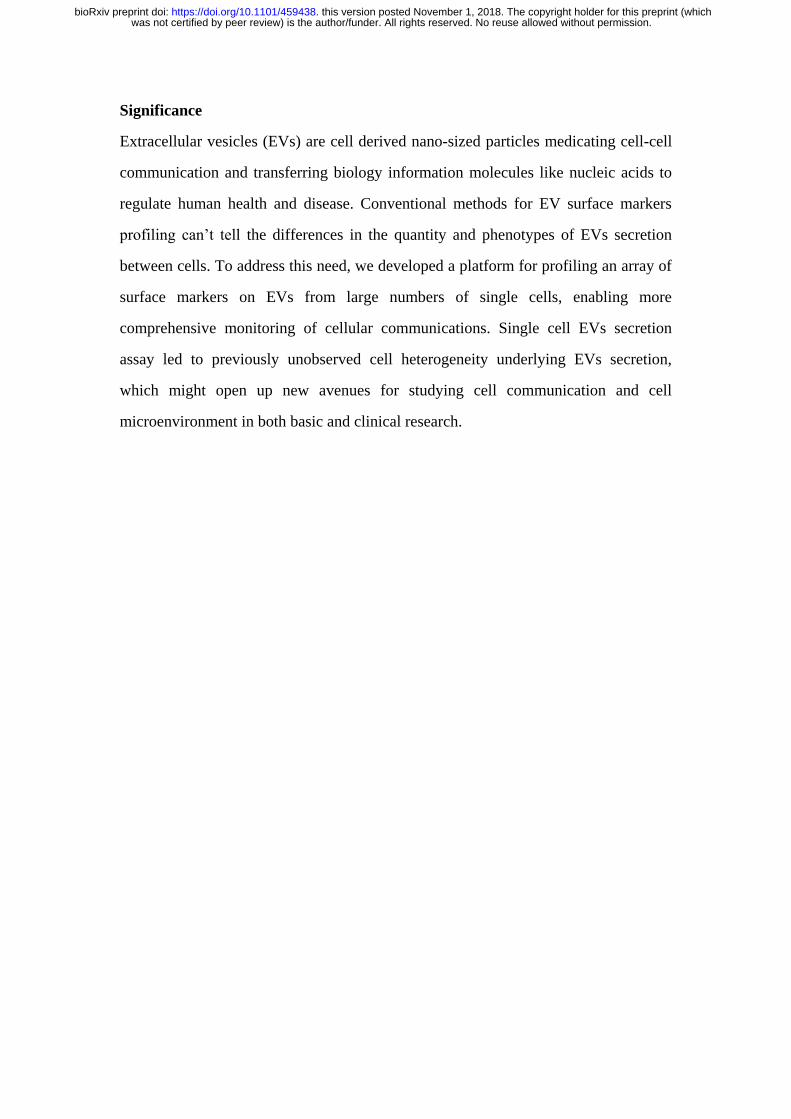
Significance
Extracellular vesicles (EVs) are cell derived nano-sized particles medicating cell-cell
communication and transferring biology information molecules like nucleic acids to
regulate human health and disease. Conventional methods for EV surface markers
profiling can’t tell the differences in the quantity and phenotypes of EVs secretion
between cells. To address this need, we developed a platform for profiling an array of
surface markers on EVs from large numbers of single cells, enabling more
comprehensive monitoring of cellular communications. Single cell EVs secretion
assay led to previously unobserved cell heterogeneity underlying EVs secretion,
which might open up new avenues for studying cell communication and cell
microenvironment in both basic and clinical research.
was not certified by peer review) is the author/funder. All rights reserved. No reuse allowed without permission. The copyright holder for this preprint (whichthis version posted November 1, 2018. . https://doi.org/10.1101/459438doi: bioRxiv preprint
Introduction
Extracellular vesicles (EVs), including exosomes, microvesicles, etc., are critical
components in cellular microenvironment regulating intercellular communications
and transferring biology information molecules like cytosolic proteins, lipids, and
nucleic acids(1-6). Due to its relatively stable duration in circulation system, it has
been used as noninvasive diagnostic markers for disease progression(7-9) or
therapeutic treatments (2, 3). Detection and stratification of extracellular vesicles is
crucial to increase our understanding of EVs and bring new applications in
biomedicine,such as theirsizes(10), morphologies(11) and molecular compositions(12,
13). Among different molecular components involved in EVs functionalities,
proteomic surface markers provide direct targets for intercellular communication
mediated by EVs(14, 15). Thus, varieties of methods have been reported for profiling
protein markers on EVs’ surface, such as ELISA(16), western blotting(15), flow
cytometry(10), imaging(17), etc., from population of EVs(15) down to single vesicle
level(10, 17). However, these measures are still at population cells level, which
averaged EVs secretion from different cellular sources and obscured cell to cell
heterogeneity in quantity/phenotypes of EVs secretion and their related functions
(18-22). Nanowell-based (23, 24) and tetraspanin-based pH-sensitive optical
reporters(25) for single cell EVs secretion assay have been developed to address the
need, however with limited proteomic parameters (≤2) for EVs from each single cell,
which is not sufficient to dissect EVs secretion heterogeneity comprehensively. A
technology that can profile an array of surface markers on EVs from large numbers of
single cells is still lacking and will help addressing a host of important biological
questions ranging from inter and intra-tumor diversity, to cell-cell communication
network and be of great value to clinical applications like personalized diagnostics
and medicine.
Herein, we demonstrated a microchip platform for multiplexed profiling of
single cell extracellular vesicles secretion to address the critical need for new
technologies to dissect the communication spectrum of tumor cells mediated by EVs.
The multiplexed profiling was realized with antibodies barcode, which is a reliable,
was not certified by peer review) is the author/funder. All rights reserved. No reuse allowed without permission. The copyright holder for this preprint (whichthis version posted November 1, 2018. . https://doi.org/10.1101/459438doi: bioRxiv preprint
reproducible technology previously adopted for blood testing(26), single cell
proteomic analysis(27-31), and immunotherapy monitoring(32-34). We applied the
platform to profile human oral squamous cell carcinomas cell lines and patient
samples, which revealed previously unobserved secretion heterogeneity and identified
the decrement of certain EV phenotypes (e.g. CD63+
EVs) were associated with the
invasive potential of both OSCC cell lines and primary OSCC cells. Besides, we also
realized simultaneous profiling of EVs secretion and cytokines secretion from the
same single cells for deep understanding of cellular organizations and uncovering the
correlation between different types of intercellular communication mediators.
Results
Platform for multiplexed profiling of single-cell EVs secretion
The platform to realize multiplexed single-cell EVs secretion detection (Figure
1A) is modified from previously reported devices (31), which combines two
functional components: a high density microchambers array and spatially resolved
antibodies barcode glass slide. High density microchambers array (Figure S1A)
accommodates 6440 identical units for isolating and concentrating EVs secreted from
exactly a single cell (each microchamber: width 40μm, length 1440μm, depth 30μm).
The volume of each microchamber is around 1.7nL, which corresponds to 5x10⁵
cells/mL cell density, comparable to the cell density typically used in bulk
experiments. Due to the drastic decrease in liquid volume, the concentration of
detection targets will be concentrated as much as 103-10
5 times compared with
population measurements (1.7nL vs 10-200μL), which ensured high sensitivity
detection. We designed and fabricated accompanying microchip with highly parallel
microchannel array to pattern spatially resolved antibodies barcode onto poly-L-lysine
glass slide, which can accommodate up to 9 different antibodies (with each antibody
stripe 40μm in width) for multiplexed profiling (Figure S1B, the consumption of each
antibody for patterning is only 3μL volume at 250μg/mL). The antibodies patterning
can be finished within 4hrs with excellent uniformity (fluorescein isothiocyanate
labelled bovine serum albumin coating: C.V. <5% in 2cm x 5.5cm area, Figure S2).
was not certified by peer review) is the author/funder. All rights reserved. No reuse allowed without permission. The copyright holder for this preprint (whichthis version posted November 1, 2018. . https://doi.org/10.1101/459438doi: bioRxiv preprint
We verified antibody based EVs capture/detection principle at bulk level (Figure
S3). Antibodies targeting human CD81 and CD63 for EVs were used to form
detectable immuno-sandwich, both of which are tetraspanins highly expressed in EVs
for reliable EVs marker proteins (14, 15). This double positive detection strategy
based on different epitopes recognition can eliminate the crosstalk from soluble
molecules to ensure the detection specificity (16). We obtained positive fluorescence
signals with conditioned medium from human oral squamous carcinoma cells
(UM-SCC6) (Figure 1B). Atomic Force Microscope (AFM) characterization
confirmed the fluorescent signals were from EVs (Figure 1C). The diameter of the
captured particles ranged from 50nm to 200nm, suggesting EVs captured covered
both exosomes (size: 50–150nm) and microvesicles(size: 100–1000nm) (Figure 1D).
Consistent with fluorescence results, we didn’t capture any particles from exosome
depleted cell culture medium sample. We further confirmed multiple EVs can be
profiled on micrometer sized antibody stripes (Figure S4), demonstrating the
feasibility to use antibodies barcode for multiplexed EVs detection.
Multiplexed single-cell profiling reveals complex heterogeneity underlying EVs
secretion
We then used the platform to profile the EVs secretion with human oral
squamous cell carcinoma (SCC25) to assess its single cell detection sensitivity (35).
40,000 cells (200μL at 2x10⁵cells/mL density) was pipetted directly onto hydrophilic
microchamber array (oxygen plasma treated). When enclosed by putting antibodies
barcode glass slide on the top, more than 1000 single cells (1386±276, n=6) were
constantly obtained, ensuring high-throughput analysis and statistical significance.
The proteomic parameters for EVs surface marker profiling used in this study
includes CD63, CD9, CD81, EpCAM and HSP70. With the combination of surface
markers used here, the EVs captured from the same single cells can be further
categorized into five subgroups: CD63+
EV, CD9+CD63+
EV, CD81+CD63+
EV, EpCAM+CD63+
EV
and HSP70+CD63+
EV. A representative fluorescence detection result from SCC25 cells
was shown in Figure 2A, from which we observed fluorescent positive square spots
was not certified by peer review) is the author/funder. All rights reserved. No reuse allowed without permission. The copyright holder for this preprint (whichthis version posted November 1, 2018. . https://doi.org/10.1101/459438doi: bioRxiv preprint
intersecting CD63/CD81/CD9 antibodies barcode with signal-to-noise ratio (SNR)≥3,
demonstrating EVs with different surface proteins from the same single cells were
reliably detected.
After single cell data were normalized based on mean fluorescence intensity plus
2 times standard deviation (SD) of all zero-cell microchambers as thresholds to define
positive secretion events (31), SCC25 single cell EVs secretion results were presented
as scatter plots in Figure 2B, which provide direct insights to understand EVs
secretion heterogeneity, i) not all cells can secrete EVs, for example, only around 6.2%
cells secreted CD81+CD63+
EVs; ii) intensity distribution within these EVs secreting cells
revealed that a very small number of cells can secrete ~10 times more than averaged
secretion, indicating the presence of outliers or “super EV secretors” within cell
population (Figure 2C); iii) cells secreted EVs with preference within different
surface markers, for example, around 23.5% SCC25 cells secreted CD9+CD63+
EVs,
while we could barely see HSP70+CD63+
EVs secretion at single cell level; iv) a small
fraction of SCC-25 cells could secrete multiple cytokines or EVs simultaneously
(Figure 2D),for example, only ~2.7% single cells can secret EVs with more than
three different combinations of surface markers at the same time, further confirming
the presence of “super EV secretors” within cell population. Collectively, these
observations presents the complex heterogeneity underlying EVs secretion, which is
difficult to profile with population measurements. Interestingly, we found the
percentage of cells with positive EVs secretion would increase with more cells in each
microchamber (Figure 2E), suggesting EVs secretion is also mediated with paracrine
signaling, which is in agreement with other report(36). We also saw that these EV
phenotypes were weakly correlated via linear regression analysis of the correlation
coefficient between EVs (Figure 2F).
Decreased single cell EVs expression in invasive tumor cells
We then applied the platform to profile EVs derived from tumor cells with
different migratory properties at single cell level to uncover the correlation between
EVs secretion and cell’s invasive behavior. A subgroup of UM-SCC6 cells with high
was not certified by peer review) is the author/funder. All rights reserved. No reuse allowed without permission. The copyright holder for this preprint (whichthis version posted November 1, 2018. . https://doi.org/10.1101/459438doi: bioRxiv preprint
invasion behavior in matrigel matrix (named as UM-SCC6M) were obtained by three
rounds of isolation of invasion front of UM-SCC6 cells in an H shaped microfluidic
chip (Figure 3A). Detailed isolation procedures has been reported previously(37). To
dissect the multidimensional spectrum of intercellular communications, here we
profiled 5-plexed EVs secretion (CD63, CD9, CD81 and EpCAM, HSP70) along with
3-plexed proteins secretion (IL-6, IL-8, MCP-1) simultaneously from each single cells
to provide direct correlation between different types of intercellular messengers
(Table S1). Titration tests with recombinant proteins and antibodies crosstalk tests
were completed to validate technical validity (Figure S5&S6). Interestingly, we
found UM-SCC6M cells, which is active in invasion, were less active in secretion for
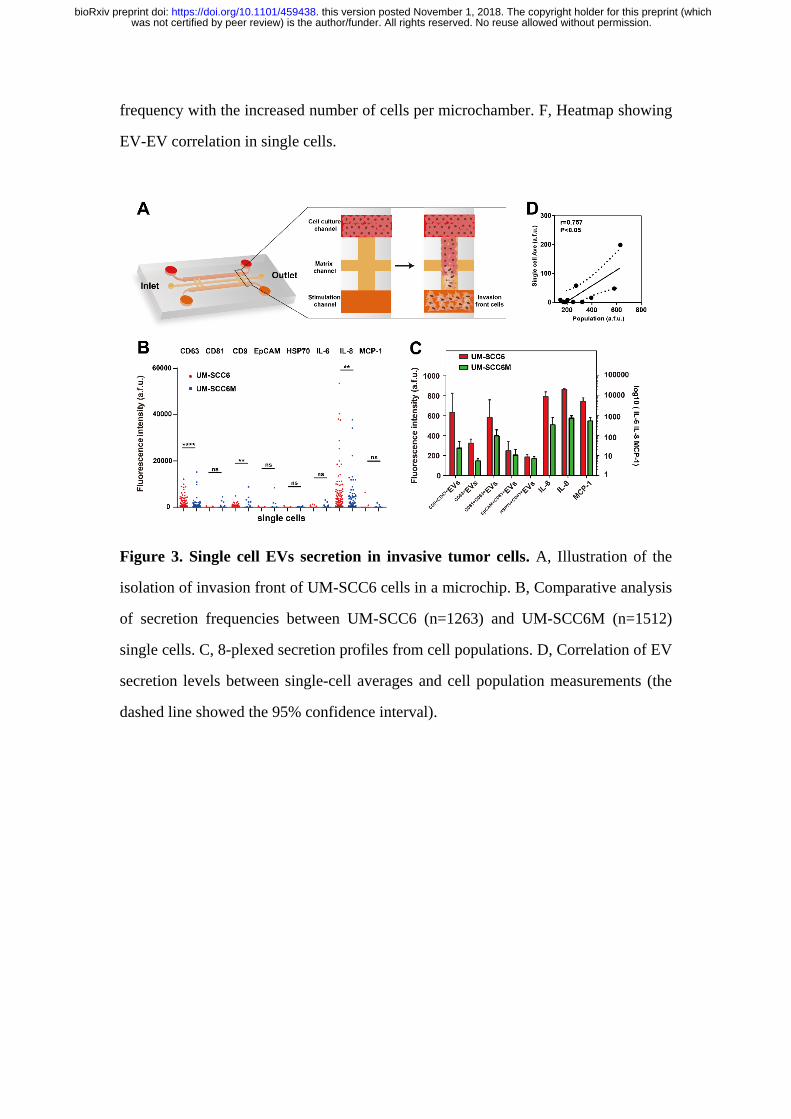
both EVs and proteins, compared with UM-SCC6 cells (Figure 3B). Specifically,
12.3% of UM-SCC6 single cells secreted CD63+
EVs, while 4.3% of UM-SCC6M single
cells secreted CD63+
EVs; 10.9% UM-SCC6 single cells secreted CD9+CD63+
EV vs 0.9%
for UM-SCC6M single cells; 10.6% of UM-SCC6 single cells were positive in IL-8
secretion, while only 5.7% of UM-SCC6M single cells secreted IL-8. Previous studies
have demonstrated tetraspanins CD63, CD9 are metastasis suppressors, highly
expressed in the early stages of different cancers (e.g. melanoma(38, 39),
carcinoma(40, 41)) and decreased in advanced stages. Our results showed the CD63,
CD9 expression were also decreased on tumor cell derived EVs surfaces when cells
are in invasive state, which has never been observed previously at single cell level.
We also saw the similar trend in cell population assay (Figure 3C) and a reasonable
level of correlation between single-cell results and cell population measurements
(Figure 3D, Pearson r = 0.76, P < 0.05), despite significant differences in assay
conditions between them.
Multiplexed profiling of single-cell secretion of OSCC patient samples
To further demonstrate potential applications of our single cell analysis platform
towards clinical samples, we profiled three primary ex vivo tissues from oral
squamous cell carcinoma (OSCC) patients to discern metastatic tumor derived EVs
associated with EVs secretion (Table S2). The fresh OSCC tumor tissues from
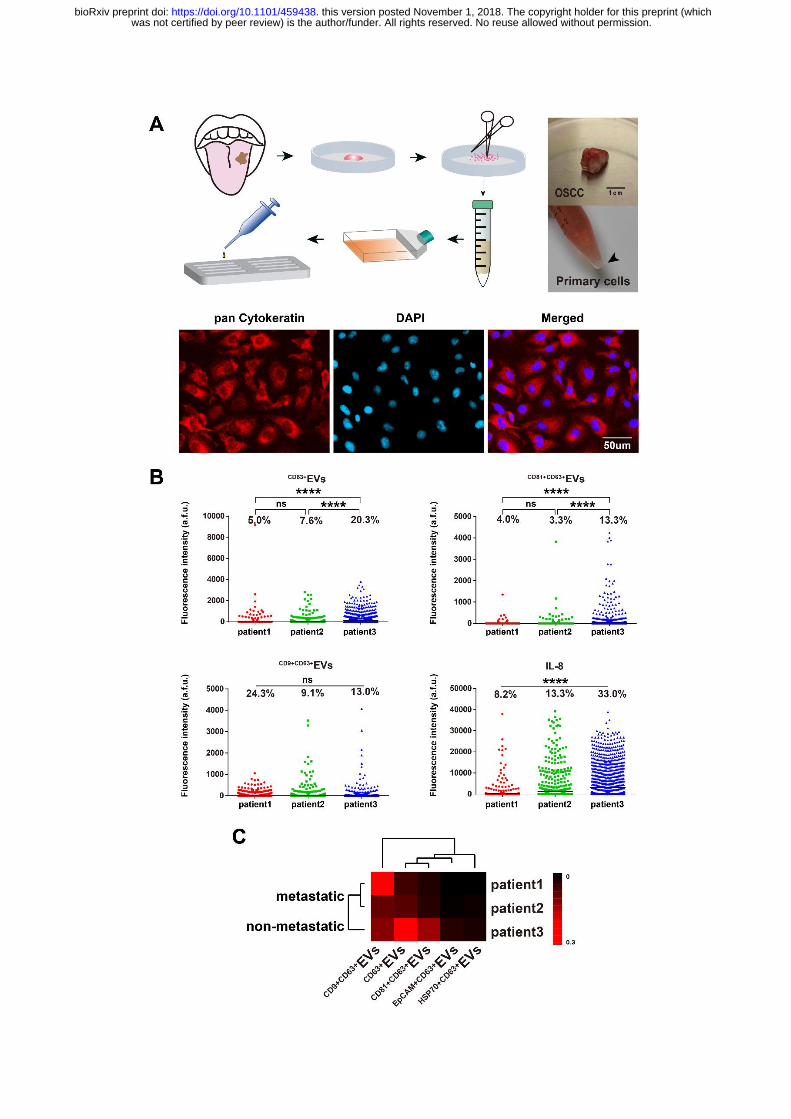
was not certified by peer review) is the author/funder. All rights reserved. No reuse allowed without permission. The copyright holder for this preprint (whichthis version posted November 1, 2018. . https://doi.org/10.1101/459438doi: bioRxiv preprint
surgery were disassociated, purified into primary tumor cell suspensions and verified
with epithelial malignancy marker pan Cytokeratin immunostaining (42) (Figure 4A).
Though three tumor samples were all identified as high differentiation grade (Table
S2& Figure S7), patient 1&2 were diagnosed as metastatic, while patient 3 was
non-metastatic. All three patients exhibited similar secretion signatures as OSCC cell
lines, for example, they were relatively strong in CD9+CD63+
EVs and IL-8 secretions,
while attenuated in EpCAM+CD63+
EV and HSP70+CD63+
EV secretions. Notably, we
observed CD63+
EVs and CD81+CD63+
EVs secretion in metastatic patients 1&2 was
significantly decreased, compared with non-metastatic patient 3 (Figure 4B), which
confirmed our observation from UM-SCC6 cell line. While CD9+CD63+
EVs didn’t show
significant differences between patients, suggesting the heterogeneity between cell
lines and primary cells. Unsupervised clustering further resolved tight correlation
between patient 1 and 2 in EVs secretion pattern (Spearman correlation r1,2=0.975,
r1,3=0.667, r2,3=0.6) (Figure 4C).
Single-cell secretions functional phenotyping
We then mapped all the single cell data from OSCC patient samples using
viSNE(43), which is based on the t-Distributed Stochastic Neighbor Embedding
algorithm, to reveal their functional organizations (Figure 5A). We saw primary cells
from each patient gave rise to three structured clusters: Group 1 is mainly
distinguished with EVs secretion, like CD9+CD63+
EVs and CD63+
EVs; Group 3
dominated proteins secretion, mainly for IL-8; while Group 2 accommodates both
EVs secretion and proteins secretion, but with much attenuated frequency.
Interestingly, we observed similar functional organizations in OSCC cell lines
(Figure S8&S9), demonstrating the functional architecture of population cells is
relatively stable across both cell lines and primary cells (28).
From the viSNE maps (Figure 5B & Figure S8-12), we further observed the
cells positive with protein secretions were less likely to secrete EVs simultaneously,
suggesting the EVs and proteins secretion were generally dominated by different cell
subsets within population. To confirm this finding, we calculated the conditional
was not certified by peer review) is the author/funder. All rights reserved. No reuse allowed without permission. The copyright holder for this preprint (whichthis version posted November 1, 2018. . https://doi.org/10.1101/459438doi: bioRxiv preprint
probability of EV positive cells to secrete proteins and found EV+ cells were
significantly less likely to secrete proteins in both cell lines (SCC25,
UM-SCC6&UM-SCC6M) (p=0.027 by paired t test) and patients (p=0.014) (Figure
5C&D). Likewise, protein+ cells were significantly less likely to secrete EVs
simultaneously in both cell lines (p=0.017) and patients (p=0.005) (Figure 5E&F).
Discussion
Tumor derived EVs play important roles in tumor metastatic processes(2, 6, 7),
which make it vital to obtain more detailed information from these vesicles. However,
these EVs were never characterized comprehensively at single cell level, due to the
lack of available tools. This study introduced, for the first time (to the best of our
knowledge), an antibody barcode based platform for high throughput, multiplexed
profiling of single cell extracellular vesicles secretion. With this platform, we
uncovered previously undifferentiated single cell heterogeneity underlying EVs
secretion within a phenotypically similar cell population. We then applied the
platform to analyze a subgroup of UM-SCC6 cells with high invasion characteristic
and observed some EVs expression (e.g. CD63+
EVs) decreased in metastatic tumor
cells. And the results were further confirmed with OSCC patient samples. These
results demonstrated our platform can generate critical information to potentially
distinguish and quantitate invasive cell states, which can be used to monitor tumor
invasiveness and tailor the therapeutic strategy for individual patient. In addition,
these EVs that act as intercellular mediators for cell−cell communication in tumor
microenvironment may also be used as new therapeutic targets for personalized
medicine.
Tumor microenvironment is collectively shaped by complex signaling networks
composed of different mediators, including cytokines, EVs, etc. Direct measurement
of different mediators from the same single cells was highly desirable to generate
information that inspires deeper understanding of tumor microenvironment and
decode the complex signaling network embedded in it. With this platform, we
successfully realized multiplexed profiling of two different intercellular
was not certified by peer review) is the author/funder. All rights reserved. No reuse allowed without permission. The copyright holder for this preprint (whichthis version posted November 1, 2018. . https://doi.org/10.1101/459438doi: bioRxiv preprint
communication mediators (5-plxed EVs and 3-plexed proteins) simultaneously from
the same single cells, which cannot be obtained using other methods. We observed
proteins secretion and EVs secretion were dominated by respective cell subgroups
within the population, highlighting the unique advantage associated with
multidimensional, multiplexed profiling to resolve the correlation between each
parameter. This multidimensional analysis strategy may open up new avenues for
uncovering new biology at single cell level.
Notably, the platform is applicable to different cellular types and sources with
minimal sample consumption, which makes it especially suitable for rare clinical
sample analysis, like circulation tumor cells(44), or fine-needle aspirate (FNA)(18).
The proteomic parameters of EVs detection can be further increased if more
microchannels are paralleled or spectral encoding is adopted for multi-color detection.
When combined with other single cell analysis technologies or different types of
perturbations, it could provide more comprehensive information to map the
correlation between different functional mediators in cellular microenvironment at
different biomimetic models (12, 19, 28, 31). We believe this platform holds great
potential to become a broadly applicable tool for in-depth EV analysis in both basic
and translational research, like tumor biopsies in precision medicine.
Methods
PDMS microchip fabrication
The molds for antibody patterning and single cell capture were fabricated by
photolithography with SU8 3035 (Microchem, USA) and treated with TMCS
(Trimethylchlorosilane, Sigma-Aldrich) overnight to facilitate peeling PDMS
(Polydimethylsiloxane) off the mold. PDMS prepolymer and curing reagent were
mixed at 10:1 ratio (RTV615, Momentive), poured onto the mold and cured in the
oven at 80oC for 1 hr. The PDMS microchip was bonded with premium grade
microarray glass slide (poly-L-lysine coated, Thermo Fisher) after the inlet and outlet
holes were punched out. Then it was baked at 80oC for additional 2hrs to complete
thermal bonding. The PDMS microwell array for single cell culture was cleaned with
was not certified by peer review) is the author/funder. All rights reserved. No reuse allowed without permission. The copyright holder for this preprint (whichthis version posted November 1, 2018. . https://doi.org/10.1101/459438doi: bioRxiv preprint
ultra-sonication in ethanol and blown dry before use.
Flow patterning antibodies barcode glass slide
After the PDMS microchip with high density parallel microchannels were assembled
with poly-L-lysine coated glass slide, each antibody (Table S1) was pushed through
individual microchannels until complete dry with 1psi pressured N2. The antibodies
barcode glass slide was blocked with 1% BSA (Roche, USA) for 1hr to reduce
nonspecific adsorption. Then it was washed with DPBS, 50/50 DPBS/DI water and DI
water sequentially. The antibody slide was spun dry in slide centrifuge and stored at
4oC before use.
Cell culture
Human oral squamous carcinoma cell line (SCC25) (American Type Culture
Collection) was cultured in MEM medium (Gibco, Thermo Fisher Scientific) with 10%
fetal bovine serum (FBS, Gibco, Invitrogen), 1% antibiotics (100 U/ml of penicillin G
sodium, 100 U/ml of streptomycin) and 1% MEM Non-Essential Amino Acid (Life
Technologies). FBS was ultra-centrifuged at 100,000 x g at 4ºC for 4 hours to deplete
exosome in it. The Human oral squamous carcinoma cell line (UM-SCC6) (a kind gift
from Prof. Songling Wang (Capital Medical University, China)) was cultured in
DMEM/HIGH GLUCOSE (HyClone) medium with similar conditions for SCC25.
The cells were detached with 0.25% trypsin-0.02% EDTA for 4min, centrifuged at
1000 rpm for 5min, washed and re-suspended in fresh medium before use.
Isolation of invasion front cells from UM-SCC6
The matrix channel of the isolation microchip was firstly loaded with Matrigel™
(Corning). UM-SCC6 cells were seeded into the cell culture channel in serum-free
medium. Then cell culture medium containing 20% FBS was introduced into the
stimulation channel. Cells that invaded through the matrix channel and migrated into
the stimulation channel were termed as the invasion front cells. These invasion front
cells were collected by trypsinization and expanded to repeat the above mentioned
was not certified by peer review) is the author/funder. All rights reserved. No reuse allowed without permission. The copyright holder for this preprint (whichthis version posted November 1, 2018. . https://doi.org/10.1101/459438doi: bioRxiv preprint
steps to generate second round of invasion front cells. The third round of invasion
front cells of UM-SCC6 were repeated again and collected as UM-SCC6M cells.
OSCC patient tissue samples
Human OSCC patient samples were obtained from the Affiliated Hospital of Dalian
Medical University. The collection and use of human samples was approved by the
Ethics Committee of Dalian Medical University. Patient primary tissue was firstly
minced with an ophthalmic surgical scissors to approximately 1mm3 pieces and then
pipetted repeatedly with DPBS containing 2% antibiotics. The tissue was then
detached with 0.25% trypsin-0.02% EDTA for 20-40min at 37℃, shaking once every
5min. The tissue was then detached with collagenase I on the shaker until the tissue
became flocculent. The tube containing the flocculent tissue was placed in a 37°C, 5%
CO2 incubator for 5 min. The following flocculent precipitate was then spread evenly
across the culture dish coated with collagenase I. The culture dish was placed in a 37°
C, 5% CO2 incubator for 1hr and the culture medium DMEM-HG was added
dropwise. Change the medium periodically until the cells became confluent in the
culture dish. Then the cells were detached with 0.25% trypsin-0.02% EDTA and
re-suspended in fresh medium for experiment.
Single cell EVs secretion analysis procedures
The PDMS microchambers array for single cell assay was treated with O2 plasma
(Harrick Plasma PDC-32G) for 1min before single cell experiment and blocked with
cell culture medium (with 10% FBS) to maintain surface hydrophilic, which will
facilitate cell loading and minimize nonspecific protein adsorption. Sample cells were
pre-stained with cell viability dye Calein-AM green at 37oC for 30min and
re-suspended into fresh medium at defined density. The cells were then pipetted onto
microchambers array at 2x10⁵cells/mL cell density, 200μL per chip. After cells settled
down into microchambers within 5 minutes, antibodies barcode glass slide was
imposed onto the top of microchambers array and clamped together to trap single
cells. The microchip trapped with single cells was imaged with a Nikon Eclipse TiE
was not certified by peer review) is the author/funder. All rights reserved. No reuse allowed without permission. The copyright holder for this preprint (whichthis version posted November 1, 2018. . https://doi.org/10.1101/459438doi: bioRxiv preprint
microscope with an automatic stage to record the cell number/position information.
The clamp was removed after overnight incubation to finish detection procedures. The
glass slide was incubated with a cocktail of detection antibodies (biotin-IL-8,
biotin-IL-6, biotin-MCP-1, biotin-CD63) for 1 hour and stained with
streptavidin-APC or streptavidin-PE (eBioscience, 1:100 dilution) for another 30min.
Then it was washed thoroughly with DPBS, 50/50 DPBS/DI water and DI water
sequentially, the glass slide was spun dry and scanned with a GenePix 4300A
fluorescence scanner (Molecular Devices).
Data analysis
The images for single cell counting (bright field and fluorescence) can be processed in
Nikon software (NIS-Elements Ar Microscope Imaging Software) by defining
threshold in combined images to realize automated cell counting. The fluorescence
detection image was analyzed with GenePix Pro software (Molecular Devices) by
creating and aligning the microchambers array template followed by extraction of
mean fluorescence intensity (MFI). The cell counts and corresponding fluorescent
data would be matched and processed in Excel (Microsoft) and Graphpad Prism. The
thresholds to determine positive secretion events were defined as mean + 2 ×SD of
zero-cell data. Heatmaps and unsupervised clustering were generated with software
Cluster/ Treeview (Eisen Laboratory). viSNE (Dana Pe'er lab)was used to transform
complex multi-parameter data into two dimensional categorized maps.
Supporting Information
This article contains supporting information online.
Acknowledgements
The project was supported by National Natural Science Foundation of China (Grant
No. 21874133, 21605143), Youth Innovation Promotion Association CAS (Grant No.
2018217), and funds from Dalian Institute of Chemical Physics (Grant No.
SZ201601).
was not certified by peer review) is the author/funder. All rights reserved. No reuse allowed without permission. The copyright holder for this preprint (whichthis version posted November 1, 2018. . https://doi.org/10.1101/459438doi: bioRxiv preprint
Author contributions
Y.L., T.J.L. and Y.H.J. and designed the research; Y.H.J., L.M.L., H.R.S. performed
experiments, D.Y.Q., B.S., F.Y.Z. contributed clinical samples; X.J.L. conducted
UM-SCC6M cell isolation; Y.H.J., L.M.L., H.R.S., Y.L., B.C.L. conducted data
analyses; Y.L. wrote the manuscript, with extensive inputs from all authors.
Conflict of interest
The authors declare no conflict of interest.
was not certified by peer review) is the author/funder. All rights reserved. No reuse allowed without permission. The copyright holder for this preprint (whichthis version posted November 1, 2018. . https://doi.org/10.1101/459438doi: bioRxiv preprint
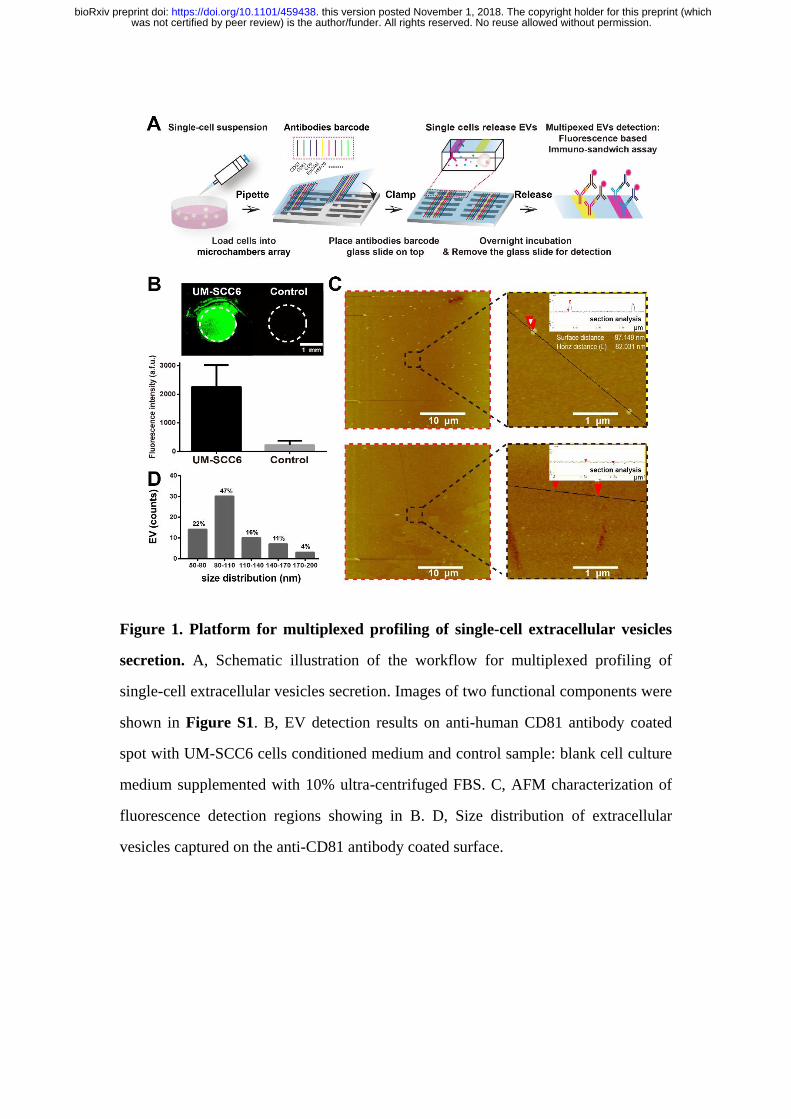
Figure 1. Platform for multiplexed profiling of single-cell extracellular vesicles
secretion. A, Schematic illustration of the workflow for multiplexed profiling of
single-cell extracellular vesicles secretion. Images of two functional components were
shown in Figure S1. B, EV detection results on anti-human CD81 antibody coated
spot with UM-SCC6 cells conditioned medium and control sample: blank cell culture
medium supplemented with 10% ultra-centrifuged FBS. C, AFM characterization of
fluorescence detection regions showing in B. D, Size distribution of extracellular
vesicles captured on the anti-CD81 antibody coated surface.
was not certified by peer review) is the author/funder. All rights reserved. No reuse allowed without permission. The copyright holder for this preprint (whichthis version posted November 1, 2018. . https://doi.org/10.1101/459438doi: bioRxiv preprint
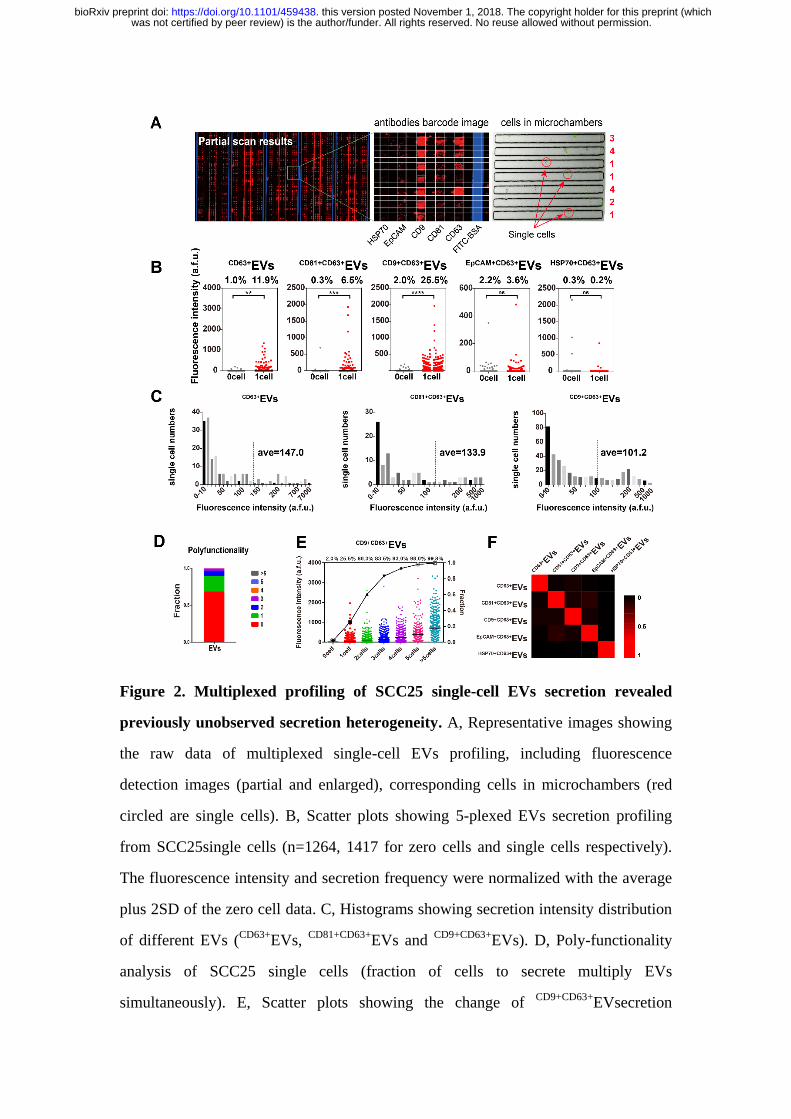
Figure 2. Multiplexed profiling of SCC25 single-cell EVs secretion revealed
previously unobserved secretion heterogeneity. A, Representative images showing
the raw data of multiplexed single-cell EVs profiling, including fluorescence
detection images (partial and enlarged), corresponding cells in microchambers (red
circled are single cells). B, Scatter plots showing 5-plexed EVs secretion profiling
from SCC25single cells (n=1264, 1417 for zero cells and single cells respectively).
The fluorescence intensity and secretion frequency were normalized with the average
plus 2SD of the zero cell data. C, Histograms showing secretion intensity distribution
of different EVs (CD63+
EVs, CD81+CD63+
EVs and CD9+CD63+
EVs). D, Poly-functionality
analysis of SCC25 single cells (fraction of cells to secrete multiply EVs
simultaneously). E, Scatter plots showing the change of CD9+CD63+
EVsecretion
was not certified by peer review) is the author/funder. All rights reserved. No reuse allowed without permission. The copyright holder for this preprint (whichthis version posted November 1, 2018. . https://doi.org/10.1101/459438doi: bioRxiv preprint
frequency with the increased number of cells per microchamber. F, Heatmap showing
EV-EV correlation in single cells.
Figure 3. Single cell EVs secretion in invasive tumor cells. A, Illustration of the
isolation of invasion front of UM-SCC6 cells in a microchip. B, Comparative analysis
of secretion frequencies between UM-SCC6 (n=1263) and UM-SCC6M (n=1512)
single cells. C, 8-plexed secretion profiles from cell populations. D, Correlation of EV
secretion levels between single-cell averages and cell population measurements (the
dashed line showed the 95% confidence interval).
was not certified by peer review) is the author/funder. All rights reserved. No reuse allowed without permission. The copyright holder for this preprint (whichthis version posted November 1, 2018. . https://doi.org/10.1101/459438doi: bioRxiv preprint
was not certified by peer review) is the author/funder. All rights reserved. No reuse allowed without permission. The copyright holder for this preprint (whichthis version posted November 1, 2018. . https://doi.org/10.1101/459438doi: bioRxiv preprint
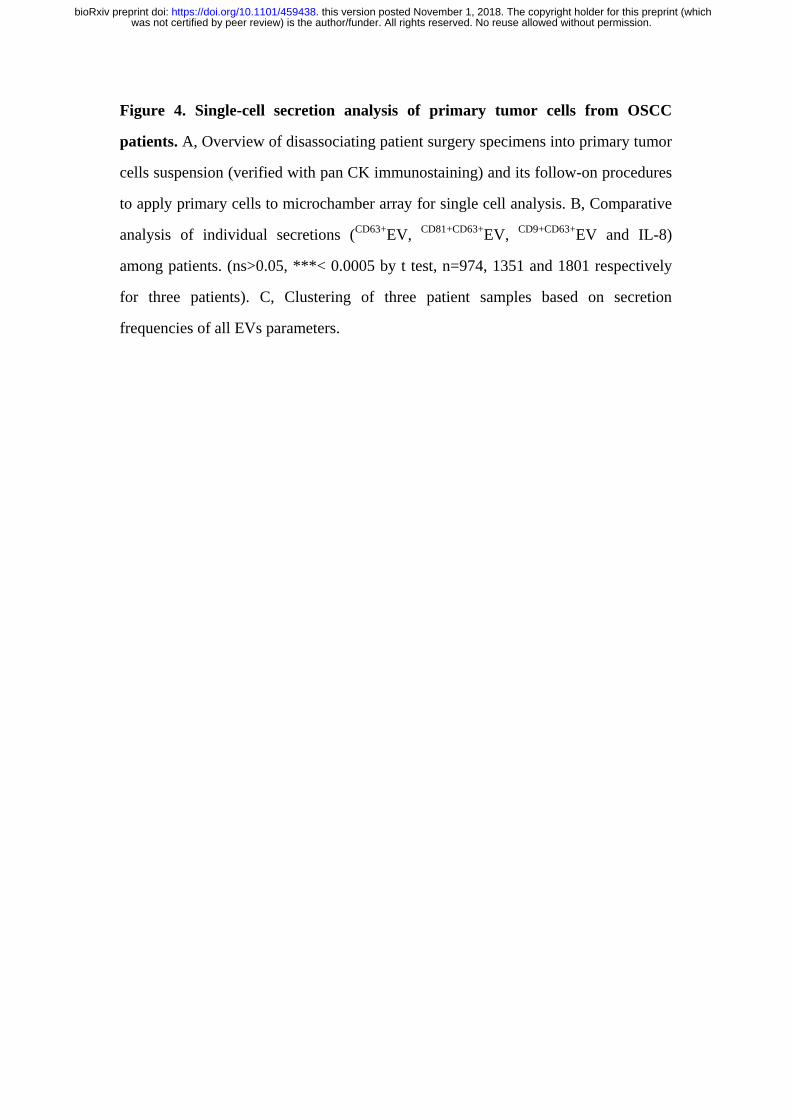
Figure 4. Single-cell secretion analysis of primary tumor cells from OSCC
patients. A, Overview of disassociating patient surgery specimens into primary tumor
cells suspension (verified with pan CK immunostaining) and its follow-on procedures
to apply primary cells to microchamber array for single cell analysis. B, Comparative
analysis of individual secretions (CD63+
EV, CD81+CD63+
EV, CD9+CD63+
EV and IL-8)
among patients. (ns>0.05, ***< 0.0005 by t test, n=974, 1351 and 1801 respectively
for three patients). C, Clustering of three patient samples based on secretion
frequencies of all EVs parameters.
was not certified by peer review) is the author/funder. All rights reserved. No reuse allowed without permission. The copyright holder for this preprint (whichthis version posted November 1, 2018. . https://doi.org/10.1101/459438doi: bioRxiv preprint
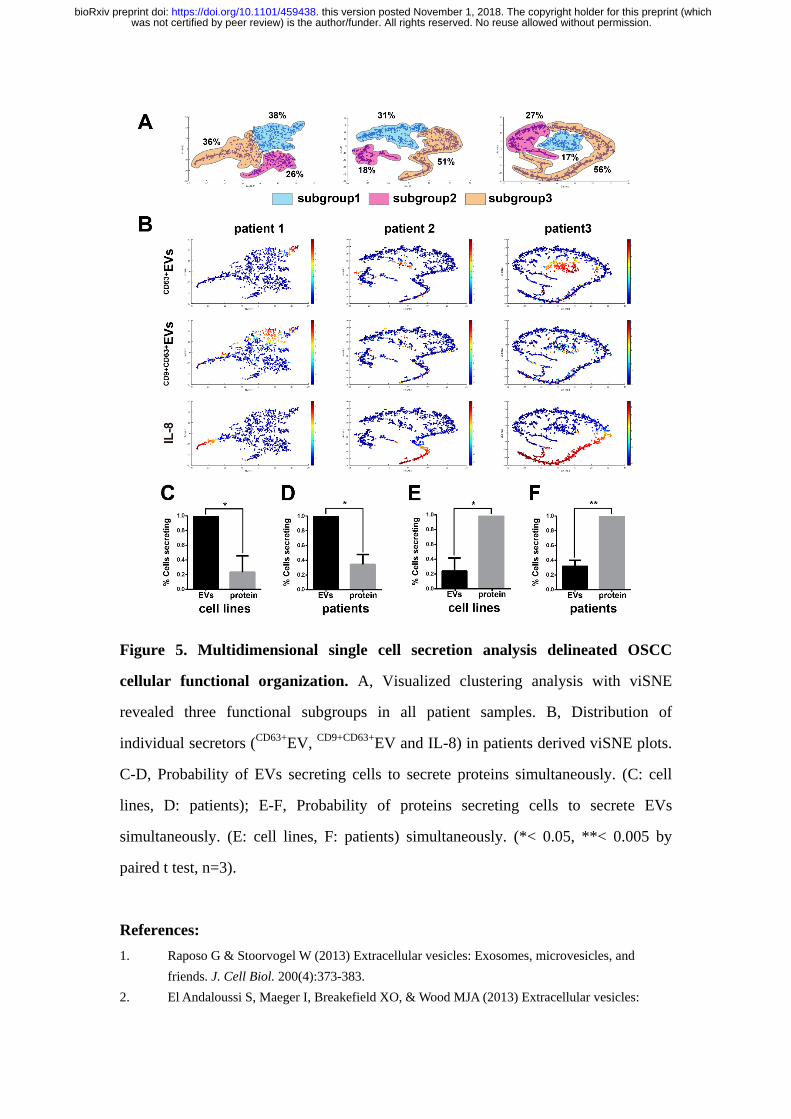
Figure 5. Multidimensional single cell secretion analysis delineated OSCC
cellular functional organization. A, Visualized clustering analysis with viSNE
revealed three functional subgroups in all patient samples. B, Distribution of
individual secretors (CD63+
EV, CD9+CD63+
EV and IL-8) in patients derived viSNE plots.
C-D, Probability of EVs secreting cells to secrete proteins simultaneously. (C: cell
lines, D: patients); E-F, Probability of proteins secreting cells to secrete EVs
simultaneously. (E: cell lines, F: patients) simultaneously. (*< 0.05, **< 0.005 by
paired t test, n=3).
References:
1. Raposo G & Stoorvogel W (2013) Extracellular vesicles: Exosomes, microvesicles, and
friends. J. Cell Biol. 200(4):373-383.
2. El Andaloussi S, Maeger I, Breakefield XO, & Wood MJA (2013) Extracellular vesicles:
was not certified by peer review) is the author/funder. All rights reserved. No reuse allowed without permission. The copyright holder for this preprint (whichthis version posted November 1, 2018. . https://doi.org/10.1101/459438doi: bioRxiv preprint
biology and emerging therapeutic opportunities. Nature Reviews Drug Discovery
12(5):348-358.
3. van der Pol E, Boing AN, Harrison P, Sturk A, & Nieuwland R (2012) Classification,
Functions, and Clinical Relevance of Extracellular Vesicles. Pharmacological Reviews
64(3):676-705.
4. Fevrier B & Raposo G (2004) Exosomes: endosomal-derived vesicles shipping extracellular
messages. Curr. Opin. Cell Biol. 16(4):415-421.
5. Gyorgy B, et al. (2011) Membrane vesicles, current state-of-the-art: emerging role of
extracellular vesicles. Cell. Mol. Life Sci. 68(16):2667-2688.
6. Lo Cicero A, Stahl PD, & Raposo G (2015) Extracellular vesicles shuffling intercellular
messages: for good or for bad. Curr. Opin. Cell Biol. 35:69-77.
7. Muralidharan-Chari V, Clancy JW, Sedgwick A, & D'Souza-Schorey C (2010) Microvesicles:
mediators of extracellular communication during cancer progression. J. Cell Sci.
123(10):1603-1611.
8. Shao H, et al. (2012) Protein typing of circulating microvesicles allows real-time monitoring
of glioblastoma therapy. Nature Medicine 18(12):1835-+.
9. Yang KS, et al. (2017) Multiparametric plasma EV profiling facilitates diagnosis of pancreatic
malignancy. Science Translational Medicine 9(391).
10. Tian Y, et al. (2018) Protein Profiling and Sizing of Extracellular Vesicles from Colorectal
Cancer Patients via Flow Cytometry. Acs Nano 12(1):671-680.
11. Zabeo D, et al. (2017) Exosomes purified from a single cell type have diverse morphology.
Journal of extracellular vesicles 6(1):1329476-1329476.
12. Shao H, et al. (2018) New Technologies for Analysis of Extracellular Vesicles. Chemical
Reviews 118(4):1917-1950.
13. Shurtleff MJ, et al. (2017) Broad role for YBX1 in defining the small noncoding RNA
composition of exosomes. Proceedings of the National Academy of Sciences of the United
States of America 114(43):E8987-E8995.
14. Lotvall J, et al. (2014) Minimal experimental requirements for definition of extracellular
vesicles and their functions: a position statement from the International Society for
Extracellular Vesicles. Journal of extracellular vesicles 3:26913-26913.
15. Kowal J, et al. (2016) Proteomic comparison defines novel markers to characterize
heterogeneous populations of extracellular vesicle subtypes. Proceedings of the National
Academy of Sciences of the United States of America 113(8):E968-E977.
16. Yoshioka Y, et al. (2014) Ultra-sensitive liquid biopsy of circulating extracellular vesicles
using ExoScreen. Nat. Commun. 5:8.
17. Lee K, et al. (2018) Multiplexed Profiling of Single Extracellular Vesicles. Acs Nano
12(1):494-503.
18. Ullal AV, et al. (2014) Cancer Cell Profiling by Barcoding Allows Multiplexed Protein
Analysis in Fine-Needle Aspirates. Science Translational Medicine
6(219):219ra219-219ra219.
19. Heath JR, Ribas A, & Mischel PS (2016) Single-cell analysis tools for drug discovery and
development. Nature Reviews Drug Discovery 15(3):204-216.
20. Wang DJ & Bodovitz S (2010) Single cell analysis: the new frontier in 'omics'. Trends
Biotechnol. 28(6):281-290.
was not certified by peer review) is the author/funder. All rights reserved. No reuse allowed without permission. The copyright holder for this preprint (whichthis version posted November 1, 2018. . https://doi.org/10.1101/459438doi: bioRxiv preprint
21. Colombo M, et al. (2013) Analysis of ESCRT functions in exosome biogenesis, composition
and secretion highlights the heterogeneity of extracellular vesicles. J. Cell Sci.
126(24):5553-5565.
22. Willms E, et al. (2016) Cells release subpopulations of exosomes with distinct molecular and
biological properties. Sci Rep 6:12.
23. Chiu YJ, Cai W, Shih YRV, Lian I, & Lo YH (2016) A Single-Cell Assay for Time Lapse
Studies of Exosome Secretion and Cell Behaviors. Small 12(27):3658-3666.
24. Son KJ, et al. (2016) Microfluidic compartments with sensing microbeads for dynamic
monitoring of cytokine and exosome release from single cells. Analyst 141(2):679-688.
25. Verweij FJ, et al. (2018) Quantifying exosome secretion from single cells reveals a
modulatory role for GPCR signaling. J. Cell Biol. 217(3):1129-1142.
26. Fan R, et al. (2008) Integrated barcode chips for rapid, multiplexed analysis of proteins in
microliter quantities of blood. Nature Biotechnology 26(12):1373-1378.
27. Ma C, et al. (2011) A clinical microchip for evaluation of single immune cells reveals high
functional heterogeneity in phenotypically similar T cells. Nature Medicine 17(6):738-U133.
28. Shi QH, et al. (2012) Single-cell proteomic chip for profiling intracellular signaling pathways
in single tumor cells. Proceedings of the National Academy of Sciences of the United States of
America 109(2):419-424.
29. Lu Y, et al. (2013) High-Throughput Secretomic Analysis of Single Cells to Assess Functional
Cellular Heterogeneity. Analytical Chemistry 85(4):2548-2556.
30. Xue Q, et al. (2015) Analysis of single-cell cytokine secretion reveals a role for paracrine
signaling in coordinating macrophage responses to TLR4 stimulation. Science Signaling
8(381):12.
31. Lu Y, et al. (2015) Highly multiplexed profiling of single-cell effector functions reveals deep
functional heterogeneity in response to pathogenic ligands. Proceedings of the National
Academy of Sciences of the United States of America 112(7):E607-E615.
32. Xue Q, et al. (2017) Single-cell multiplexed cytokine profiling of CD19 CAR-T cells reveals a
diverse landscape of polyfunctional antigen-specific response. Journal for Immunotherapy of
Cancer 5.
33. Ma C, et al. (2013) Multifunctional T-cell Analyses to Study Response and Progression in
Adoptive Cell Transfer Immunotherapy. Cancer Discovery 3(4):418-429.
34. Rossi J, et al. (2018) Preinfusion polyfunctional anti-CD19 chimeric antigen receptor T cells
associate with clinical outcomes in NHL. Blood.
35. Hasina R, et al. (2008) Angiogenic heterogeneity in head and neck squamous cell carcinoma:
biological and therapeutic implications. Laboratory Investigation 88(4):342-353.
36. Barile L, et al. (2014) Extracellular vesicles from human cardiac progenitor cells inhibit
cardiomyocyte apoptosis and improve cardiac function after myocardial infarction.
Cardiovascular Research 103(4):530-541.
37. Li X, et al. (2018) Downregulation of miR-218-5p promotes invasion of oral squamous cell
carcinoma cells via activation of CD44-ROCK signaling. Biomedicine & pharmacotherapy =
Biomedecine & pharmacotherapie 106:646-654.
38. Jang HI & Lee H (2003) A decrease in the expression of CD63 tetraspanin protein elevates
invasive potential of human melanoma cells. Experimental and Molecular Medicine
35(4):317-323.
was not certified by peer review) is the author/funder. All rights reserved. No reuse allowed without permission. The copyright holder for this preprint (whichthis version posted November 1, 2018. . https://doi.org/10.1101/459438doi: bioRxiv preprint
39. Lupia A, et al. (2014) CD63 Tetraspanin Is a Negative Driver of Epithelial-to-Mesenchymal
Transition in Human Melanoma Cells. Journal of Investigative Dermatology
134(12):2947-2956.
40. Lai X, et al. (2017) Decreased expression of CD63 tetraspanin protein predicts elevated
malignant potential in human esophageal cancer. Oncology Letters 13(6):4245-4251.
41. Huan J, et al. (2015) Overexpression of CD9 correlates with tumor stage and lymph node
metastasis in esophageal squamous cell carcinoma. International Journal of Clinical and
Experimental Pathology 8(3):3054-3061.
42. Otero M, et al. (2012) Human Chondrocyte Cultures as Models of Cartilage-Specific Gene
Regulation. Human Cell Culture Protocols, eds Mitry RR & Hughes RD (Humana Press,
Totowa, NJ), pp 301-336.
43. Amir E-aD, et al. (2013) viSNE enables visualization of high dimensional single-cell data and
reveals phenotypic heterogeneity of leukemia. Nature Biotechnology 31(6):545-+.
44. Sinkala E, et al. (2017) Profiling protein expression in circulating tumour cells using
microfluidic western blotting. Nat. Commun. 8:14622.
was not certified by peer review) is the author/funder. All rights reserved. No reuse allowed without permission. The copyright holder for this preprint (whichthis version posted November 1, 2018. . https://doi.org/10.1101/459438doi: bioRxiv preprint
Supporting Information
Multiplexed Profiling of Single-cell Extracellular Vesicles Secretion
Yahui Ji1,2
, Dongyuan Qi3, Linmei Li
1, Haoran Su
1,2, Xiaojie Li
2, Yong Luo
4,
Bo Sun5, Fuyin Zhang
5, Bingcheng Lin
1,Tingjiao Liu*
2, Yao Lu*
1
1Department of Biotechnology, Dalian Institute of Chemical Physics, Chinese Academy of
Sciences, Dalian, 116023, China
2College of Stomatology, Dalian Medical University, Dalian, 116044, China
3First Affiliated Hospital of Dalian Medical University, Dalian, 116011, China
4State Key Laboratory of Fine Chemicals, Department of Chemical Engineering & School of
Pharmaceutical Science and Technology, Dalian University of Technology, Dalian, 116024,
China
5Second Affiliated Hospital of Dalian Medical University, Dalian, 116027, China
*Correspondence should be addressed to Y. Lu ([email protected]) or T.J.L.
was not certified by peer review) is the author/funder. All rights reserved. No reuse allowed without permission. The copyright holder for this preprint (whichthis version posted November 1, 2018. . https://doi.org/10.1101/459438doi: bioRxiv preprint
Supplementary Figures
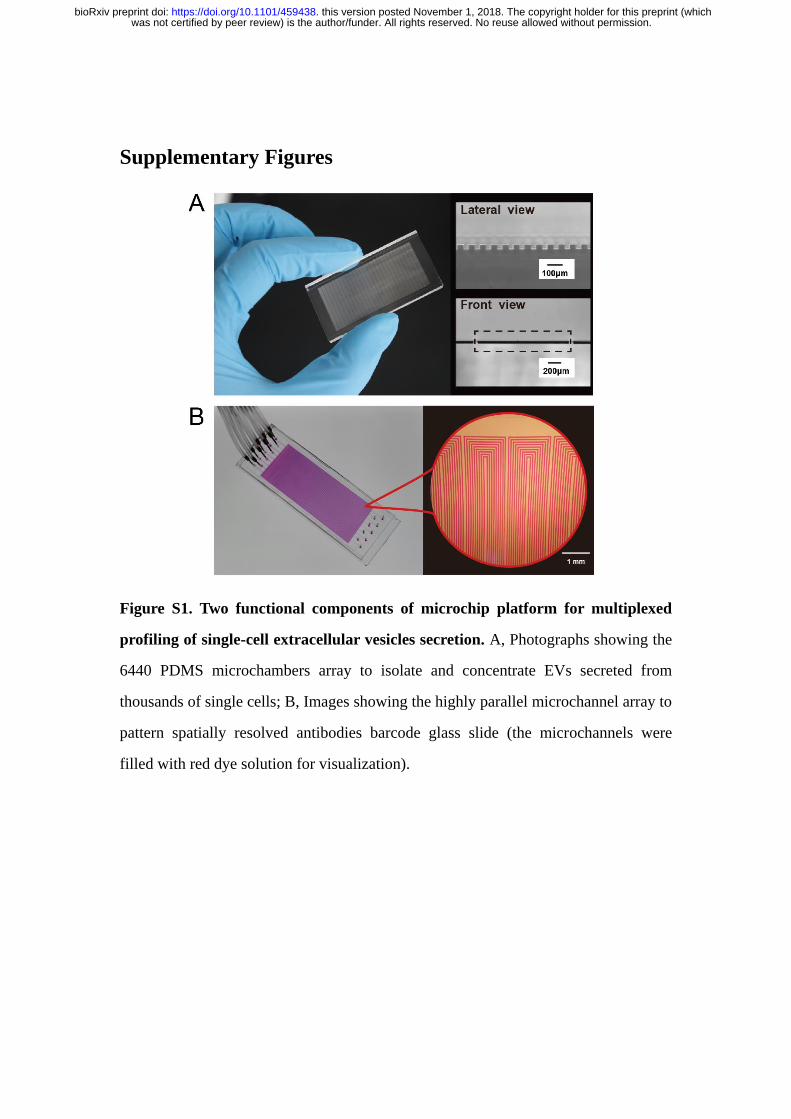
Figure S1. Two functional components of microchip platform for multiplexed
profiling of single-cell extracellular vesicles secretion. A, Photographs showing the
6440 PDMS microchambers array to isolate and concentrate EVs secreted from
thousands of single cells; B, Images showing the highly parallel microchannel array to
pattern spatially resolved antibodies barcode glass slide (the microchannels were
filled with red dye solution for visualization).
was not certified by peer review) is the author/funder. All rights reserved. No reuse allowed without permission. The copyright holder for this preprint (whichthis version posted November 1, 2018. . https://doi.org/10.1101/459438doi: bioRxiv preprint
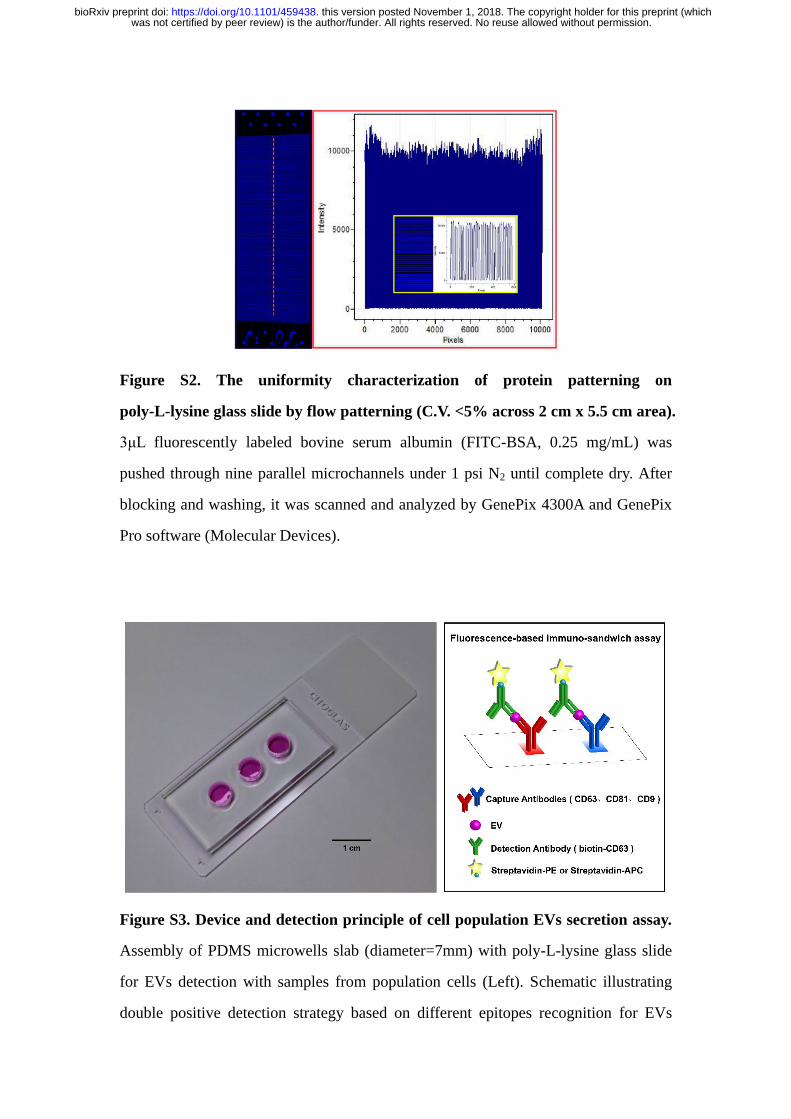
Figure S2. The uniformity characterization of protein patterning on
poly-L-lysine glass slide by flow patterning (C.V. <5% across 2 cm x 5.5 cm area).
3μL fluorescently labeled bovine serum albumin (FITC-BSA, 0.25 mg/mL) was
pushed through nine parallel microchannels under 1 psi N2 until complete dry. After
blocking and washing, it was scanned and analyzed by GenePix 4300A and GenePix
Pro software (Molecular Devices).
Figure S3. Device and detection principle of cell population EVs secretion assay.
Assembly of PDMS microwells slab (diameter=7mm) with poly-L-lysine glass slide
for EVs detection with samples from population cells (Left). Schematic illustrating
double positive detection strategy based on different epitopes recognition for EVs
was not certified by peer review) is the author/funder. All rights reserved. No reuse allowed without permission. The copyright holder for this preprint (whichthis version posted November 1, 2018. . https://doi.org/10.1101/459438doi: bioRxiv preprint
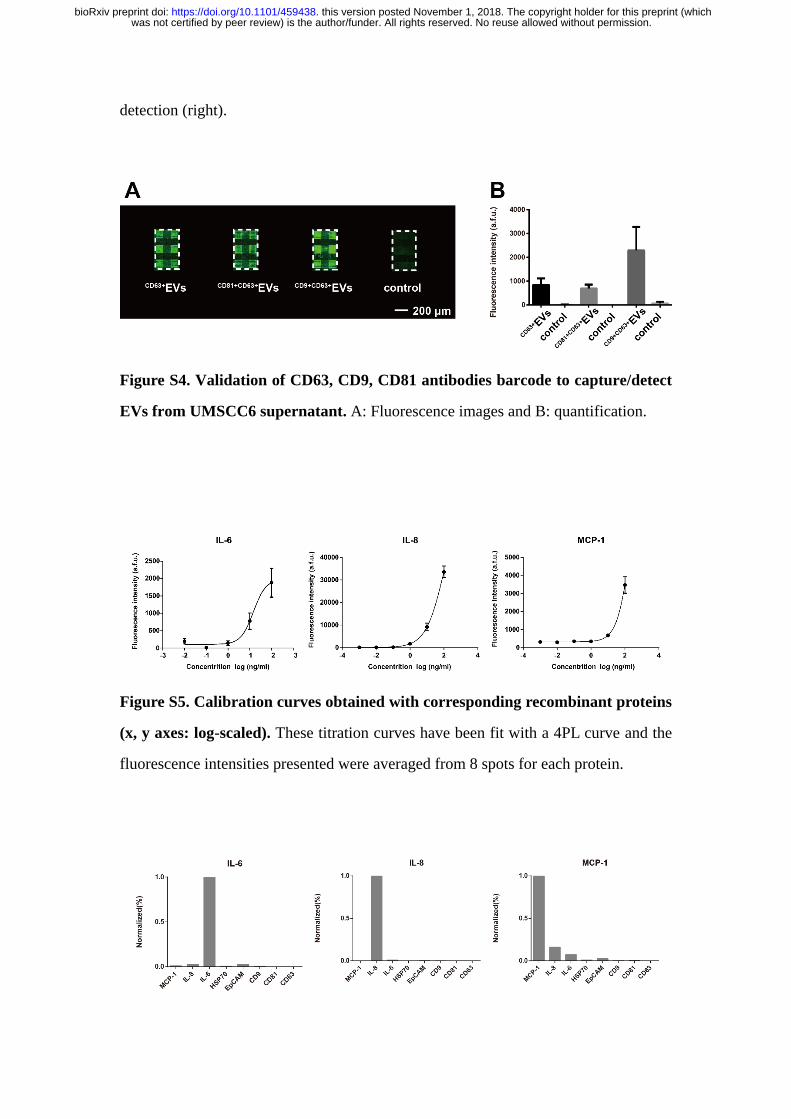
detection (right).
Figure S4. Validation of CD63, CD9, CD81 antibodies barcode to capture/detect
EVs from UMSCC6 supernatant. A: Fluorescence images and B: quantification.
Figure S5. Calibration curves obtained with corresponding recombinant proteins
(x, y axes: log-scaled). These titration curves have been fit with a 4PL curve and the
fluorescence intensities presented were averaged from 8 spots for each protein.
was not certified by peer review) is the author/funder. All rights reserved. No reuse allowed without permission. The copyright holder for this preprint (whichthis version posted November 1, 2018. . https://doi.org/10.1101/459438doi: bioRxiv preprint
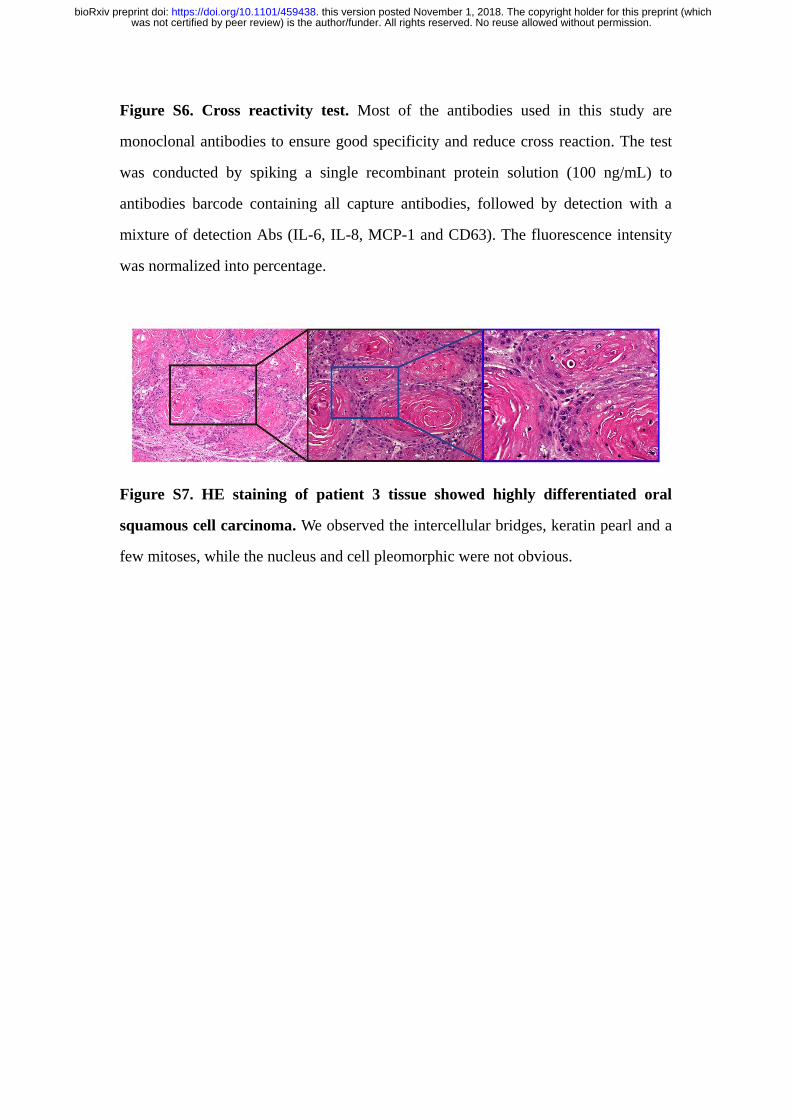
Figure S6. Cross reactivity test. Most of the antibodies used in this study are
monoclonal antibodies to ensure good specificity and reduce cross reaction. The test
was conducted by spiking a single recombinant protein solution (100 ng/mL) to
antibodies barcode containing all capture antibodies, followed by detection with a
mixture of detection Abs (IL-6, IL-8, MCP-1 and CD63). The fluorescence intensity
was normalized into percentage.
Figure S7. HE staining of patient 3 tissue showed highly differentiated oral
squamous cell carcinoma. We observed the intercellular bridges, keratin pearl and a
few mitoses, while the nucleus and cell pleomorphic were not obvious.
was not certified by peer review) is the author/funder. All rights reserved. No reuse allowed without permission. The copyright holder for this preprint (whichthis version posted November 1, 2018. . https://doi.org/10.1101/459438doi: bioRxiv preprint
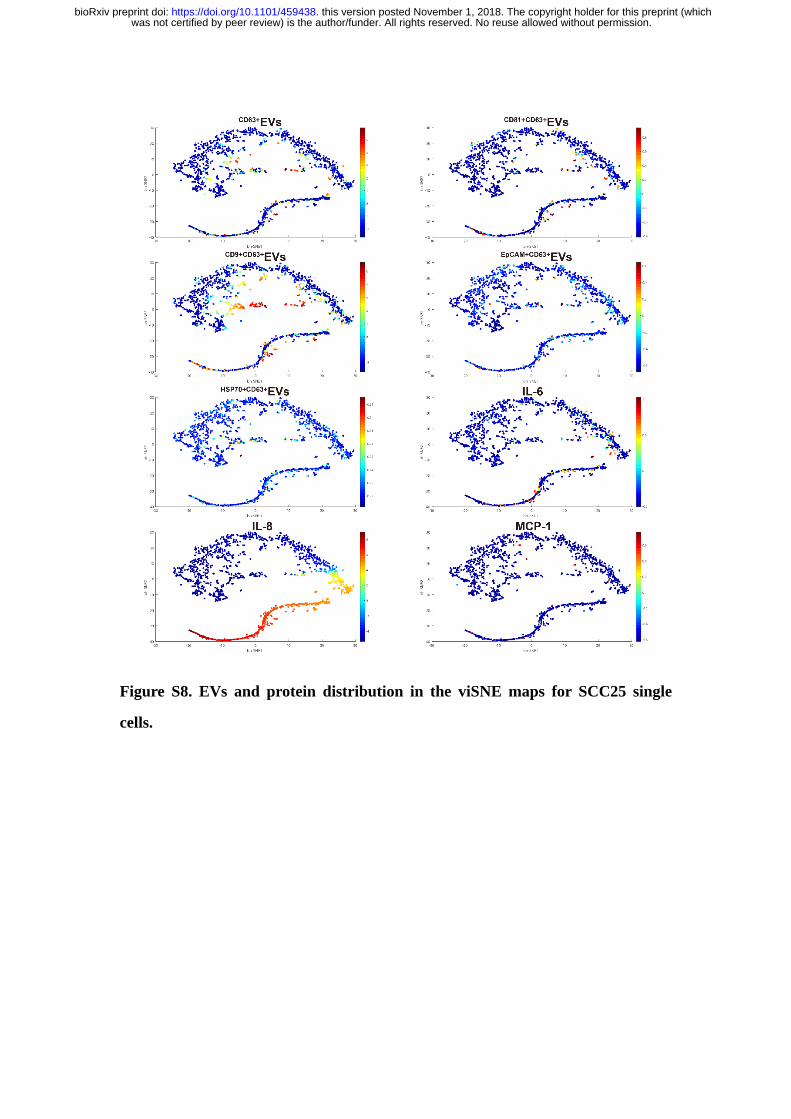
Figure S8. EVs and protein distribution in the viSNE maps for SCC25 single
cells.
was not certified by peer review) is the author/funder. All rights reserved. No reuse allowed without permission. The copyright holder for this preprint (whichthis version posted November 1, 2018. . https://doi.org/10.1101/459438doi: bioRxiv preprint
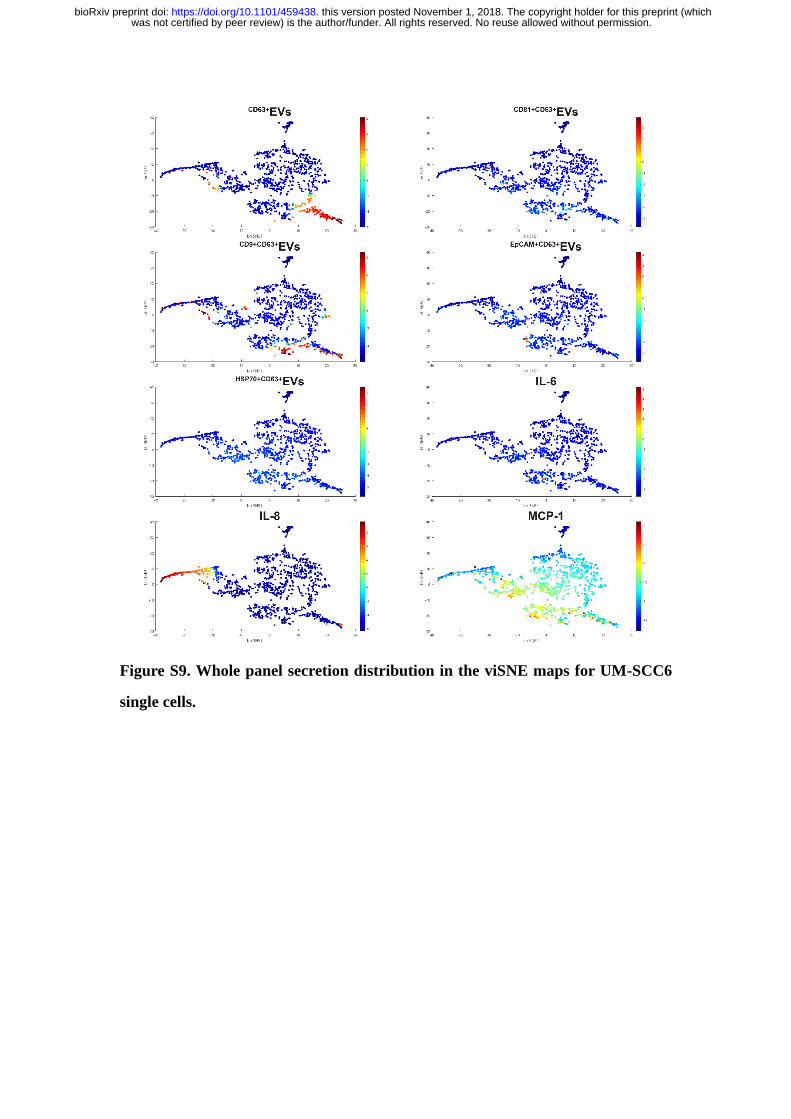
Figure S9. Whole panel secretion distribution in the viSNE maps for UM-SCC6
single cells.
was not certified by peer review) is the author/funder. All rights reserved. No reuse allowed without permission. The copyright holder for this preprint (whichthis version posted November 1, 2018. . https://doi.org/10.1101/459438doi: bioRxiv preprint
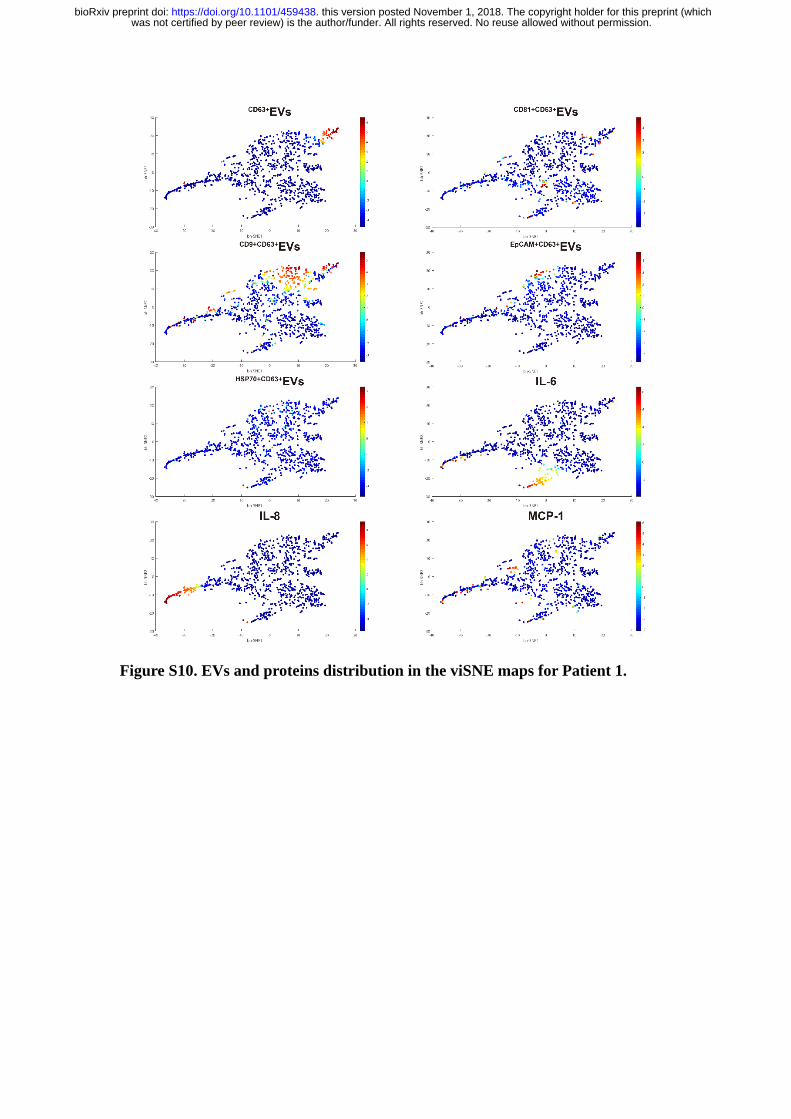
Figure S10. EVs and proteins distribution in the viSNE maps for Patient 1.
was not certified by peer review) is the author/funder. All rights reserved. No reuse allowed without permission. The copyright holder for this preprint (whichthis version posted November 1, 2018. . https://doi.org/10.1101/459438doi: bioRxiv preprint
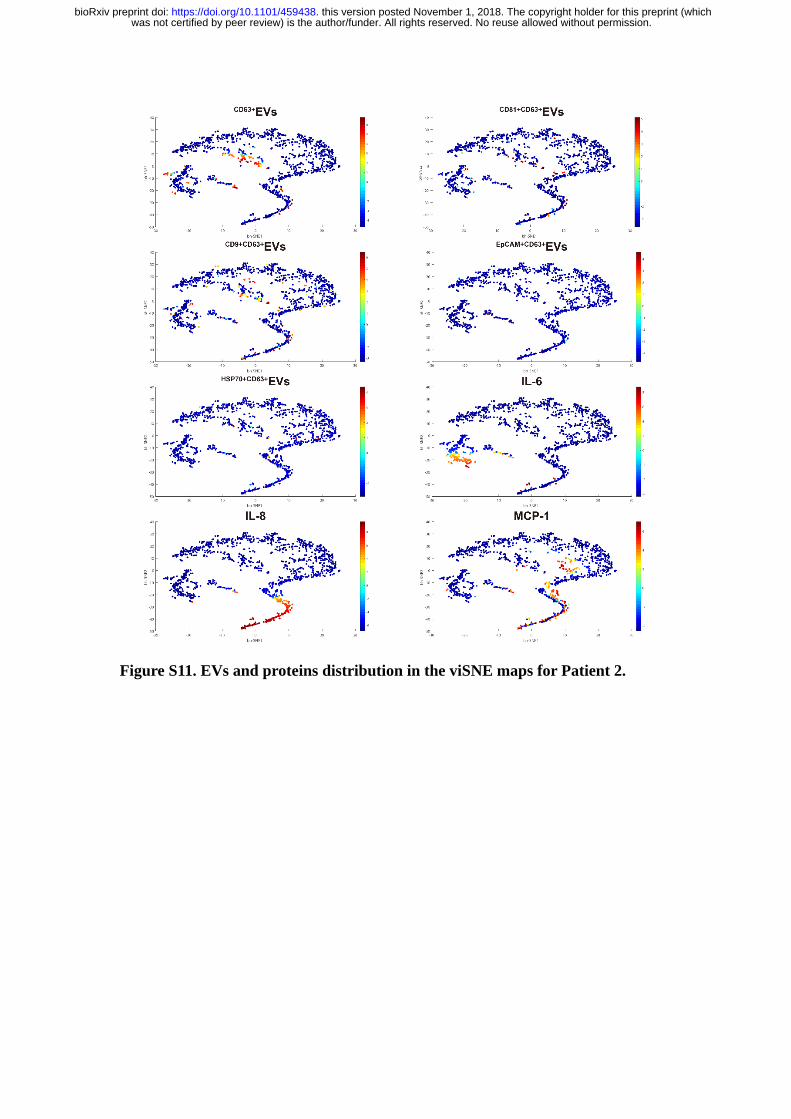
Figure S11. EVs and proteins distribution in the viSNE maps for Patient 2.
was not certified by peer review) is the author/funder. All rights reserved. No reuse allowed without permission. The copyright holder for this preprint (whichthis version posted November 1, 2018. . https://doi.org/10.1101/459438doi: bioRxiv preprint
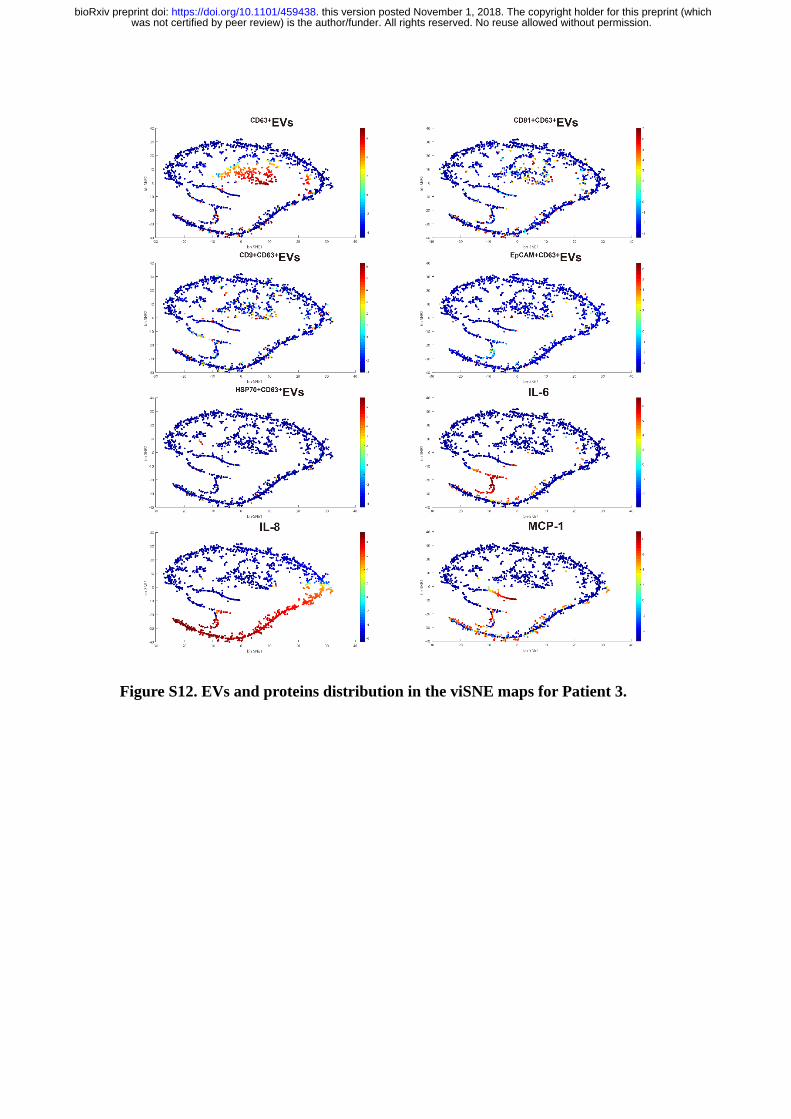
Figure S12. EVs and proteins distribution in the viSNE maps for Patient 3.
was not certified by peer review) is the author/funder. All rights reserved. No reuse allowed without permission. The copyright holder for this preprint (whichthis version posted November 1, 2018. . https://doi.org/10.1101/459438doi: bioRxiv preprint
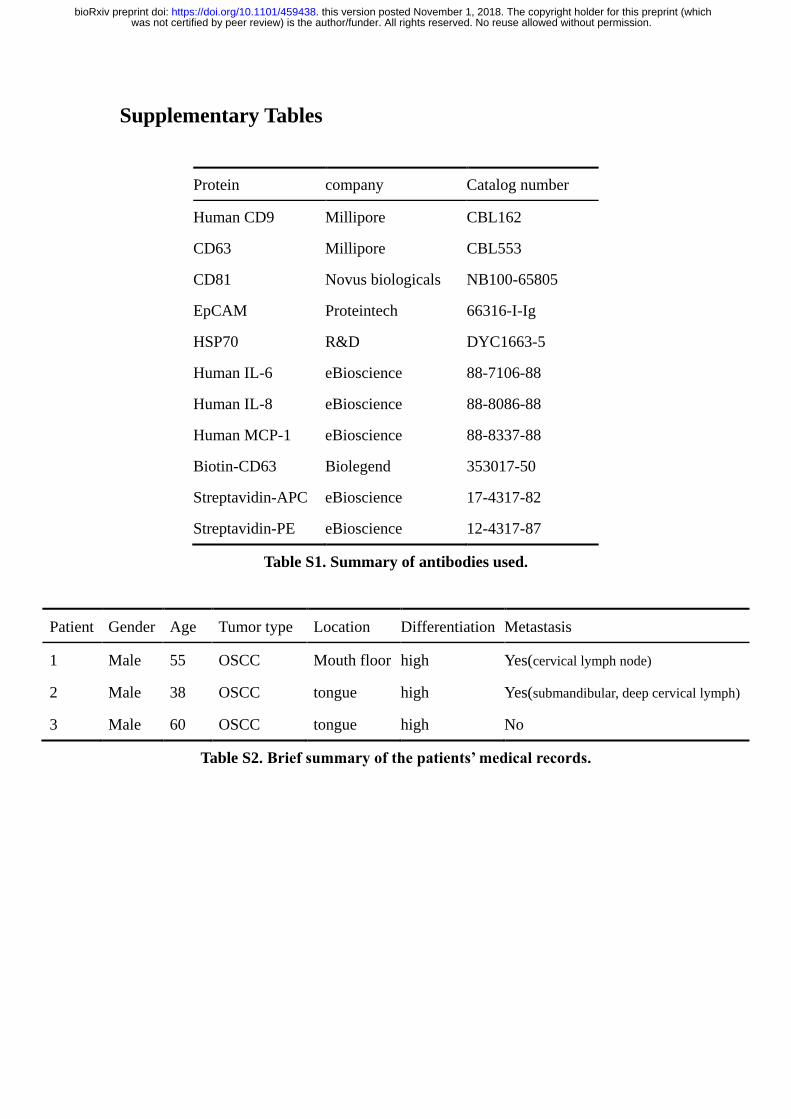
Supplementary Tables
Protein company Catalog number
Human CD9 Millipore CBL162
CD63 Millipore CBL553
CD81 Novus biologicals NB100-65805
EpCAM Proteintech 66316-I-Ig
HSP70 R&D DYC1663-5
Human IL-6 eBioscience 88-7106-88
Human IL-8 eBioscience 88-8086-88
Human MCP-1 eBioscience 88-8337-88
Biotin-CD63 Biolegend 353017-50
Streptavidin-APC eBioscience 17-4317-82
Streptavidin-PE eBioscience 12-4317-87
Table S1. Summary of antibodies used.
Patient Gender Age Tumor type Location Differentiation Metastasis
1 Male 55 OSCC Mouth floor high Yes(cervical lymph node)
2 Male 38 OSCC tongue high Yes(submandibular, deep cervical lymph)
3 Male 60 OSCC tongue high No
Table S2. Brief summary of the patients’ medical records.
was not certified by peer review) is the author/funder. All rights reserved. No reuse allowed without permission. The copyright holder for this preprint (whichthis version posted November 1, 2018. . https://doi.org/10.1101/459438doi: bioRxiv preprint