Embed Size (px)
Citation preview
1
1
Elevated levels of circulating microvesicles in coronary artery disease patients with
type 2 diabetes and albuminuria. Effects of exercise training.
Short title: Microvesicles in type 2 diabetes.
Vibeke Bratseth (VB)1,2, Gemma Chiva-Blanch (GCB)3, Rune Byrkjeland (RB)1,
Svein Solheim (SS)1, Harald Arnesen (HA)1,2, Ingebjørg Seljeflot(IS)1,2
1 Center for Clinical Heart Research, Department of Cardiology, Oslo University
Hospital Ullevål, Oslo, Norway
2 Faculty of Medicine, University of Oslo, Oslo, Norway
3 Cardiovascular Program – ICCC – IR Hospital Santa Creu I Sant Pau, Biomedical
Research Institute Sant Pau (IIB-Sant Pau), Barcelona, Spain
Corresponding Author: Vibeke Bratseth, MSc
Postal address: Center for Clinical Heart Research, Oslo University Hospital, Pb
4950 Nydalen, 0424 Oslo, Norway.
Phone: +47 91726687
Fax: +47 22119181
E-mail address: [email protected]
2
2
Abstract
Objective: Circulating microvesicles (cMVs), released from activated/apoptotic cells are
involved in vascular-complications and may be looked upon as biomarkers. Albuminuria is
characteristic of disease-progression in type-2 diabetes-mellitus (T2DM). We aimed to
investigate quantitative and qualitative differences of cMVs in T2DM with and without
albuminuria, and if 12-months exercise-training influenced expression of cMVs.
Methods: Coronary artery disease (CAD) patients with T2DM (n= 75), of which 25 had
albuminuria were included. Annexin-V+ (AV+) cMVs were analyzed by flow-cytometry in
citrated plasma. The exercise-volume was 150 min per-week.
Results: In albuminuria-patients, cMVs from endothelial-(CD146+/CD62E+/AV+) and
endothelial-progenitor-(CD309+/CD34+/AV+) cells were significantly higher compared to
those without (p≤ 0.01, both). ROC-curve analysis of the endothelial cMVs shows an area-
under-the-curve of 0.704 (95 CI 0.57-0.84)(p= 0.004). Albuminuria-patients had more
cMVs derived from activated leukocytes and monocytes and monocytes carrying tissue-
factor (CD11b+/AV+, CD11b+/ CD14+/AV+, CD142+/CD14+/AV+, respectively, p≤ 0.05, all),
and higher number of cMVs from activated platelets (CD62P+/AV+). Within exercising
patients, cMVs from progenitor-cells increased (p= 0.023), however, not significantly
different from controls.
Conclusions: CAD-patients with T2DM and albuminuria had elevated number of cMVs
from activated blood- and vascular-cells, rendering them as potential predictors of disease-
severity. The cMVs were limitedly affected by long-term exercise-training in our population.
Keywords: Albuminuria, Exercise training, Flow cytometry, Microvesicles and Type-2
diabetes mellitus.
3
3
Introduction
Circulating microvesicles (cMVs) are submicron fragments released from the plasma
membrane surface of different cell types during cell activation and/or apoptosis. 1 cMVs
share the antigenic profile and part of the cytoplasmic content including nucleic acids, of
their parent cell, and due to translocation of phosphatidylserine (PS) to the outer leaflet of
the membrane during cMVs formation, they have procoagulant properties. 2 In addition,
some cMVs also carry tissue factor (TF), the initiator of extrinsic coagulation.
cMVs are novel mediators of intercellular signaling and they are shown to be directly
involved in the pathogenesis of vascular disease. 3 As the number and variety of cMVs
increase in conditions like cardiovascular disease (CVD) and diabetes mellitus (DM), 4 they
might be useful as biomarkers of disease severity, procoagulant states, vascular activation
and also as therapeutic targets. 5 cMVs are mainly detected by flow cytometry, based on
their size, binding to annexin V (AV+), a high affinity ligand for PS, and also binding on
specific markers of cell lineage or cell activation.
Type-2 DM (T2DM) is characterized by hyperglycemia, insulin resistance, dyslipidemia,
inflammation and hypercoagulability, all devastating conditions for the endothelium,
contributing to enhanced development of microvascular diseases as well as
atherosclerosis and coronary artery disease (CAD). 6 The disease progression in DM is
characterized by albuminuria, categorized as micro- or macro albuminuria which is used
as a conventional marker of chronic kidney disease (CKD). 7
Endothelial cell injury is the main component of disruption of cardiovascular homeostasis
within the vasculature. Endothelial derived MVs (EMVs) are independent risk factors for
coronary heart disease 8 and increased amount is associated with endothelial dysfunction.
4
4
9 On the other hand, endothelial progenitor cells (EPCs) which are immature cells
mobilized from the bone marrow in response to tissue ischemia and vascular injury might
facilitate endothelial repair. 10 Decreased numbers of circulating EPCs have been
associated with endothelial dysfunction and related to CVD risk, mortality and recurrent
events in patients with CVD. 11
Exercise is known to improve endothelial function and insulin sensitivity. 12, 13 However, the
effect of physical activity on levels of cMVs has been inconsistently reported, potentially
related to exercise- type and intensity. 14 Exercise might act beneficially by lowering the
number of cMVs derived from leukocytes and EMVs, 15 and by increased amount of
circulating EPCs. 16
We have previously reported on increased levels of pro-thrombotic markers in CAD
patients with T2DM and albuminuria. 17 The aims of the present study were to perform
quantitative and qualitative analyses of AV+ cMVs from the vascular compartment between
CAD patients with T2DM, with and without albuminuria. In addition, the effects of one year
exercise training on cMVs, with specific reference to the presence of albuminuria, were
studied. Our hypotheses were that patients having albuminuria express different pattern of
cMVs especially related to vascular dysfunction and thrombotic properties, compared to
non-albuminuria patients. Further, that exercise training would contribute beneficially to the
cMVs expression.
Methods
Study population
A subset of 75 patients from the Exercise training in patients with Coronary Artery Disease
and type 2 Diabetes (EXCADI) cohort of 137 patients, 18 was included. Of the 75 patients,
5
5
25 presented with albuminuria and 50 age-matched patients were selected. All patients
were included at Department of Cardiology, Oslo University Hospital, Ullevål, Oslo,
Norway between August 2010 and March 2012. The main EXCADI study was a
randomized controlled clinical trial, exploring the effect of 12 months exercise training on
the development of atherosclerosis and glucometabolic control in patients with
angiographically verified CAD and T2DM. All study patients gave informed written consent
to participate and the study was conducted according to the Declaration of Helsinki. The
Regional Ethics Committee approved the trial and it is registered at
http://www.Clinicaltrials.gov, NCT 01232608.
The definition of albuminuria includes both micro- and macro albuminuria.
Microalbuminuria was defined as albumin/creatinine ratio in spot urine > 3mg/mmol and ≤
30mg/mmol, and macro albuminuria as levels above 30 mg/mmol. The updated
homeostatic model assessment 2 of insulin resistance (HOMA2-IR) was used to estimate
insulin resistance. 19
Blood sampling
Fasting venous blood was drawn before any morning medication between 08:00 and 10:00
AM at baseline and after 12 months exercise intervention. Tubes containing 3.8% sodium
citrate were used for cMV analysis. Blood cells were removed within 30 min by
centrifugation 2500×g for 20 min at 4°C, and plasma was immediately frozen and stored at
-80ºC until further preparation for analysis. Fasting glucose and serum lipids were
analyzed by conventional routine methods. HbA1c was measured by turbid metric
inhibition immunoassay (Roche, Basel, Switzerland), insulin by DELFIA method (Perkin
Elmer, Waltham, Massachusetts, USA) and C-peptide by electrochemiluminescence
immunoassay (ECLIA) (Roche Diagnostics).
6
6
Flow Cytometry analysis of cMVs
The frozen plasma aliquots were thawed in an ice-bath, mixed and centrifuged at 2500xg
for 10 min at room temperature (RT) to ensure sedimentation of remnant platelets and
potential clots. Plasma from the upper part of the tube was transferred to a new tube and
the cMVs were washed and fractionated from plasma by a two-step high-speed
centrifugation, as previously described. 20 The final cMVs pellets were resuspended in
citrate-phosphate buffered saline (citrate-PBS) and prepared for triple-label flow cytometry
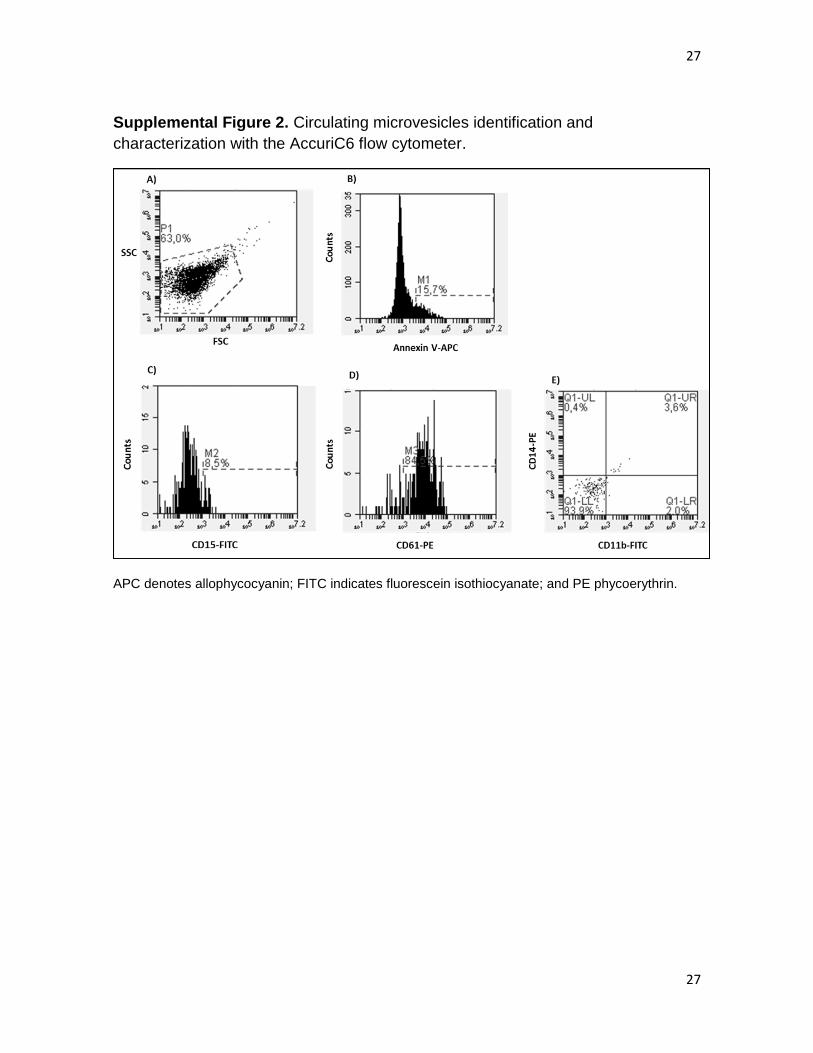
analysis. In brief, each combination of AV+ labeled with allophycocyanin (APC) (5 µL) with
two specific monoclonal antibodies (mAb, 5 µL each, see Supplementary Table 1)
conjugated to fluorescein isothiocyanate (FITC) or phycoerythrin (PE), or the isotype-
matched control antibodies, were diluted in Annexin Binding Buffer (ABB) (30 µL) and
mixed with the cMVs suspension (5 µL). After 20 min incubation in the dark at RT, the
labeling was stopped by adding ABB and the samples immediately analyzed by flow
cytometry. The Auto Collect mode and 96-well plates on an AccuriC6 flow cytometer (BD,
Accuri® Cytometers, Inc., San Diego, CA) were applied.
Every sample had 2 min of acquisition at a flow rate of 14 µL/min. Forward scatter (FSC),
side scatter (SSC) and fluorescence data were gathered with the settings in the
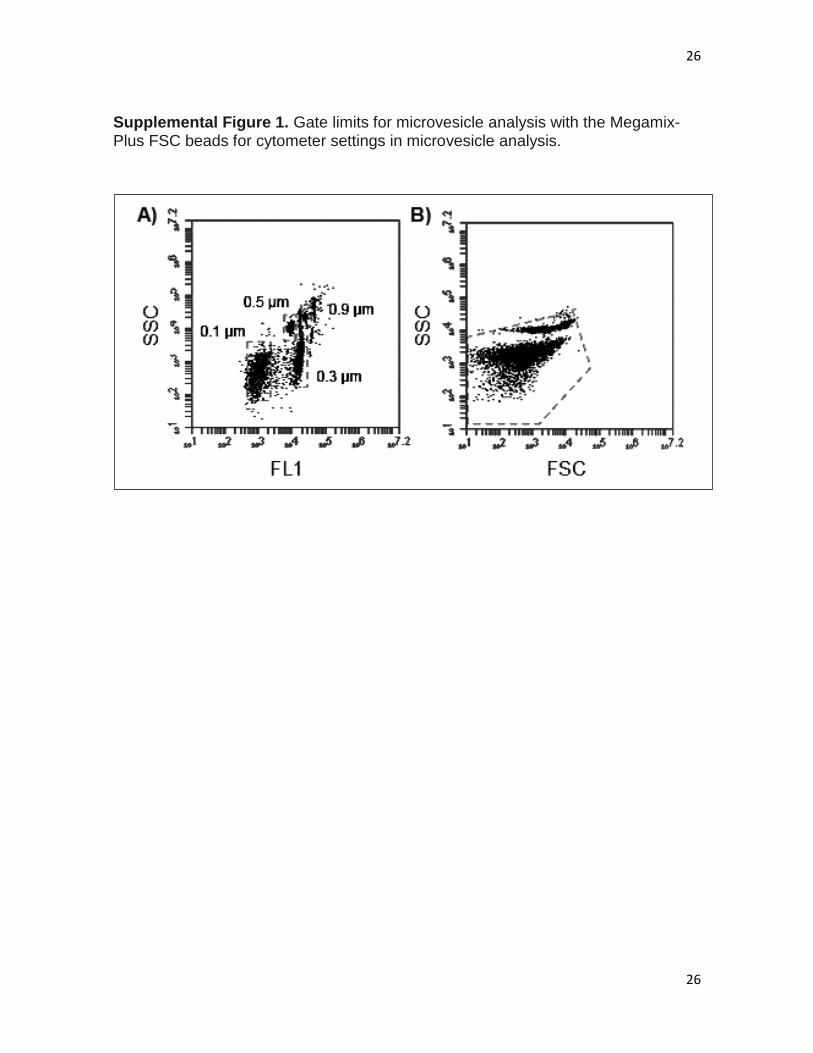
logarithmic scale. Cytometer settings were defined with the Megamix-Plus FSC, a mix of
beads with bead-equivalent sizes: 0.1 µm, 0.3 µm, 0.5 µm and 0.9 µm (BioCytex, Marseille,
France). The upper threshold for FSC and SSC was set to ≤ 1 (see Supplemental Figure
1) and according to beads signal, the lower limit of detection was placed as a threshold
above the electronic background noise of the flow cytometer for FSC, and approximately
at the second logarithm for SSC. In addition to the size criteria (>0.1 to ≤1 µm), cMVs were
identified and quantified based on their binding to AV+ and reactivity to cell-specific mAb
7
7
(see Supplemental Figure 2). To classify positive marked events, thresholds of
fluorescence were set according to samples incubated with the isotype-matched control
antibodies (same final concentrations based on titration experiments). Fluorescence
signals acquired with MVs in a calcium-free buffer (PBS) were used to correct the AV+
binding for auto fluorescence. The use of fresh made buffers filtered through 0.2 µm pore
size (vacuum), contributed to reduce the background noise.
The BD software (version 1.0.264.21, Accuri® Cytometers, Inc.) was applied to analyze
data. The number of cMVs per µL of plasma was calculated according to Nieuwland’s
formula, 21 based on the number of fluorescence-positive events (N), sample’s volume and
flow cytometer’s flow rate, as follows: cMVs/µL = N x (Vf/Va) x [Vt/(FRx 2)] x (1/Vi) [where
Vf(µL) = final volume of washed cMV suspension, Va(µL) = volume of washed cMV
suspension used for each labeling analysis, Vt(µL) = total volume of cMV suspension
before fluorescence-activated cell sorting analysis, FR(µL/min) = flow rate of the cytometer
(14 µl/min), 2 are the minutes of acquisition, 1 is the µL unit of volume, and Vi(µL) =
original volume of plasma used for microvesicle isolation].
Exercise intervention
The exercise intervention was planned and conducted in collaboration with Norwegian
School of Sport Sciences, Oslo, Norway, and consisted of a 12 months combined aerobic
and resistance training program. Detailed description has previously been reported.18 The
total exercise volume was 150 min per week, which included two group-based exercise
sessions of 60 min duration with qualified instructors and a third weekly home based
exercise session. All training sessions included intervals with high intensity, guided by
Borgs Scale of rated perceived exertion.
Statistics
8
8
Data were analyzed with IBM© SPSS© statistics for windows, v 24.0 and 25.0 (IBM Corp.,
New York, NY, USA). Differences were considered statistically significant at p≤ 0.05. Due
to skewed distributed data in most variables, continuous data are presented by median
values with 25th and 75th percentiles if not otherwise stated. Categorical data are noted as
number and proportions. Between group differences were calculated by Mann–Whitney U
test, independent samples Student T-test, Chi-square test and Kruskal Wallis test, as
appropriate. To investigate changes within the intervention groups Wilcoxon’s test was
applied and the Mann-Whitney U test was applied for differences in changes between the
groups. Receiver operating characteristic (ROC) curve was used to evaluate the ability of
the EMVs as prognostic markers of albuminuria. The area under the curve (AUC) was
calculated. Adjustments for group differences in baseline characteristics were performed
by a logistic regression model. The correlation between EMVs and conventional vascular
biomarkers was analyzed with Spearman’s rho.
Results
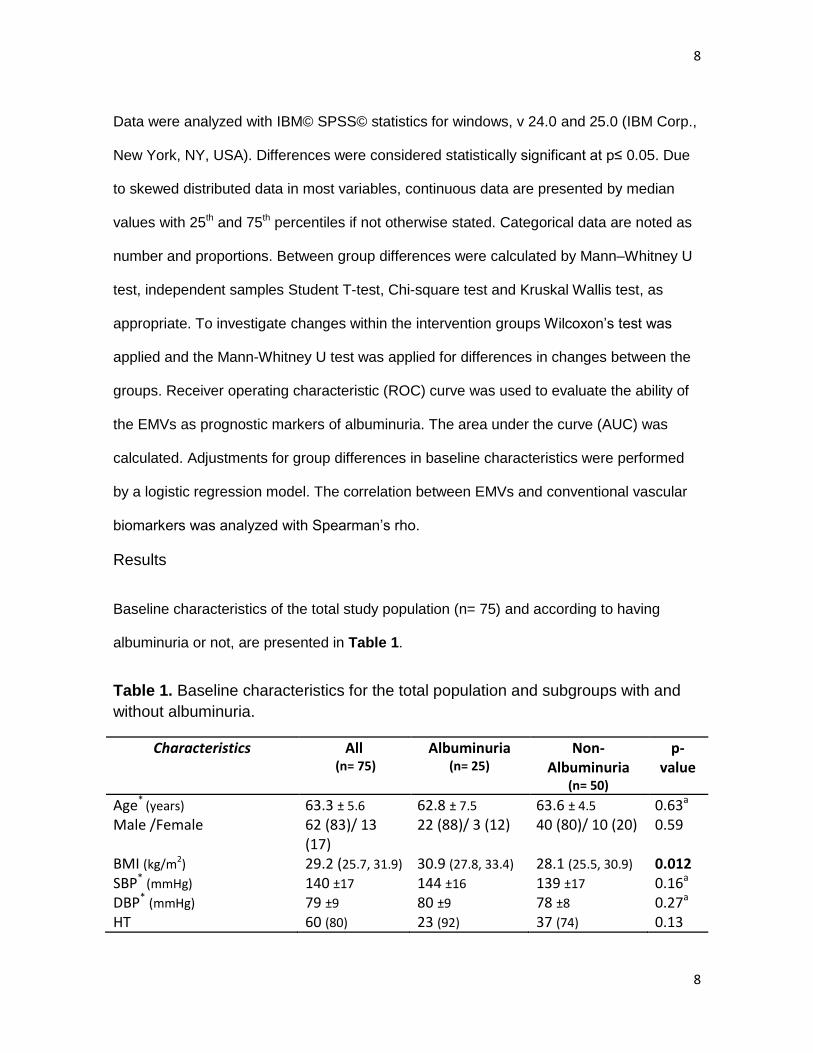
Baseline characteristics of the total study population (n= 75) and according to having
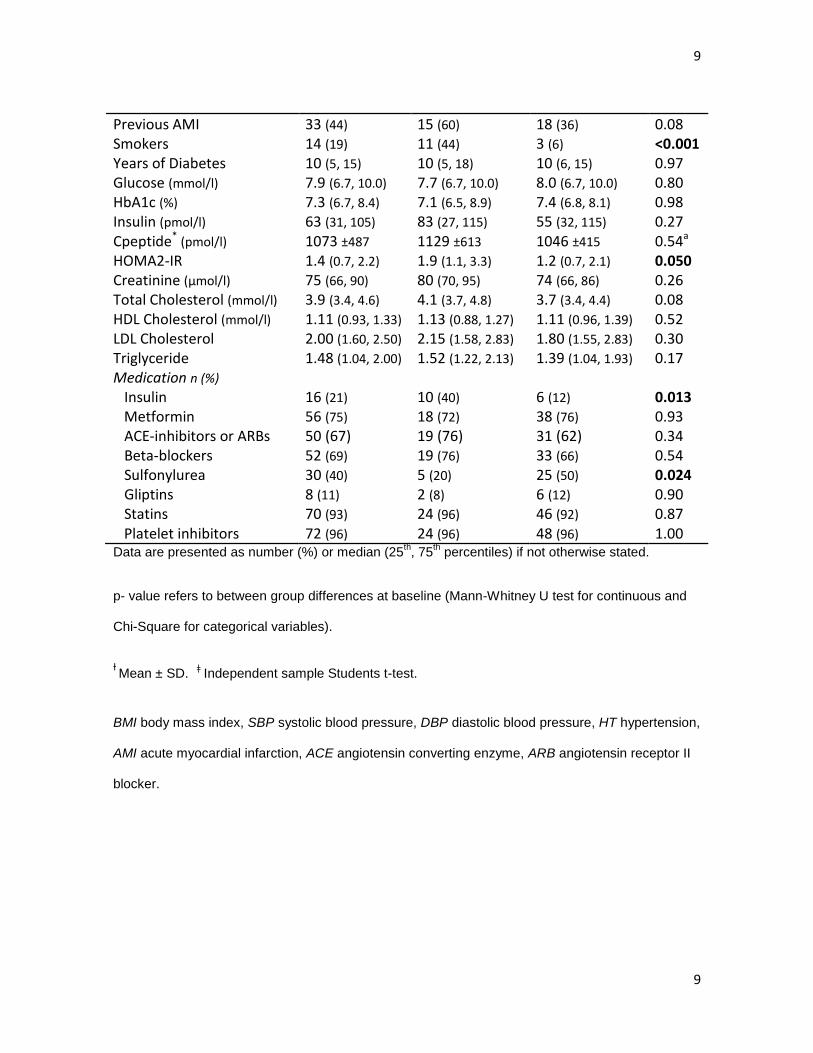
albuminuria or not, are presented in Table 1.
Table 1. Baseline characteristics for the total population and subgroups with and
without albuminuria.
Characteristics All (n= 75)
Albuminuria (n= 25)
Non-Albuminuria
(n= 50)
p- value
Age* (years) 63.3 ± 5.6 62.8 ± 7.5 63.6 ± 4.5 0.63a
Male /Female 62 (83)/ 13 (17)
22 (88)/ 3 (12) 40 (80)/ 10 (20) 0.59
BMI (kg/m2) 29.2 (25.7, 31.9) 30.9 (27.8, 33.4) 28.1 (25.5, 30.9) 0.012
SBP* (mmHg) 140 ±17 144 ±16 139 ±17 0.16a
DBP* (mmHg) 79 ±9 80 ±9 78 ±8 0.27a
HT 60 (80) 23 (92) 37 (74) 0.13
9
9
Previous AMI 33 (44) 15 (60) 18 (36) 0.08 Smokers 14 (19) 11 (44) 3 (6) <0.001 Years of Diabetes 10 (5, 15) 10 (5, 18) 10 (6, 15) 0.97 Glucose (mmol/l) 7.9 (6.7, 10.0) 7.7 (6.7, 10.0) 8.0 (6.7, 10.0) 0.80 HbA1c (%) 7.3 (6.7, 8.4) 7.1 (6.5, 8.9) 7.4 (6.8, 8.1) 0.98 Insulin (pmol/l) 63 (31, 105) 83 (27, 115) 55 (32, 115) 0.27 Cpeptide* (pmol/l) 1073 ±487 1129 ±613 1046 ±415 0.54a
HOMA2-IR 1.4 (0.7, 2.2) 1.9 (1.1, 3.3) 1.2 (0.7, 2.1) 0.050 Creatinine (µmol/l) 75 (66, 90) 80 (70, 95) 74 (66, 86) 0.26 Total Cholesterol (mmol/l) 3.9 (3.4, 4.6) 4.1 (3.7, 4.8) 3.7 (3.4, 4.4) 0.08 HDL Cholesterol (mmol/l) 1.11 (0.93, 1.33) 1.13 (0.88, 1.27) 1.11 (0.96, 1.39) 0.52
LDL Cholesterol 2.00 (1.60, 2.50) 2.15 (1.58, 2.83) 1.80 (1.55, 2.83) 0.30 Triglyceride 1.48 (1.04, 2.00) 1.52 (1.22, 2.13) 1.39 (1.04, 1.93) 0.17 Medication n (%) Insulin 16 (21) 10 (40) 6 (12) 0.013 Metformin 56 (75) 18 (72) 38 (76) 0.93 ACE-inhibitors or ARBs 50 (67) 19 (76) 31 (62) 0.34 Beta-blockers 52 (69) 19 (76) 33 (66) 0.54 Sulfonylurea 30 (40) 5 (20) 25 (50) 0.024 Gliptins 8 (11) 2 (8) 6 (12) 0.90 Statins 70 (93) 24 (96) 46 (92) 0.87 Platelet inhibitors 72 (96) 24 (96) 48 (96) 1.00 Data are presented as number (%) or median (25
th, 75
th percentiles) if not otherwise stated.
p- value refers to between group differences at baseline (Mann-Whitney U test for continuous and
Chi-Square for categorical variables).
ƚ Mean ± SD.
ǂ Independent sample Students t-test.
BMI body mass index, SBP systolic blood pressure, DBP diastolic blood pressure, HT hypertension,
AMI acute myocardial infarction, ACE angiotensin converting enzyme, ARB angiotensin receptor II
blocker.
10
10
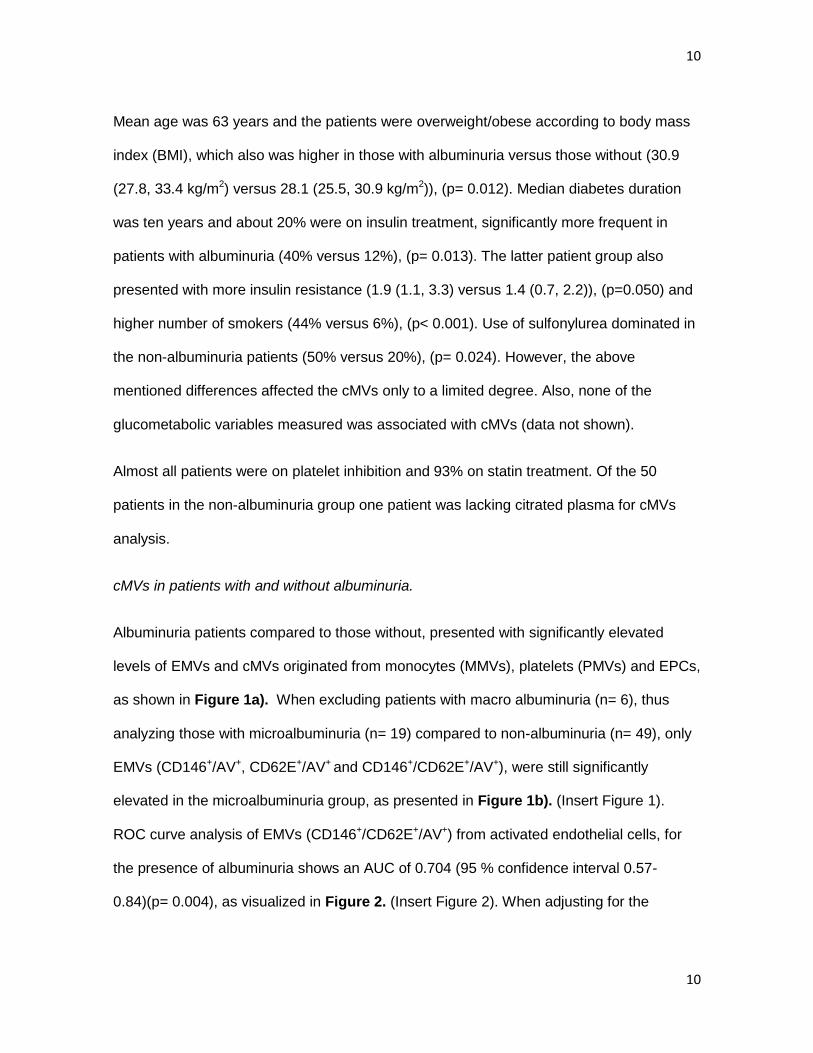
Mean age was 63 years and the patients were overweight/obese according to body mass
index (BMI), which also was higher in those with albuminuria versus those without (30.9
(27.8, 33.4 kg/m2) versus 28.1 (25.5, 30.9 kg/m2)), (p= 0.012). Median diabetes duration
was ten years and about 20% were on insulin treatment, significantly more frequent in
patients with albuminuria (40% versus 12%), (p= 0.013). The latter patient group also
presented with more insulin resistance (1.9 (1.1, 3.3) versus 1.4 (0.7, 2.2)), (p=0.050) and
higher number of smokers (44% versus 6%), (p< 0.001). Use of sulfonylurea dominated in
the non-albuminuria patients (50% versus 20%), (p= 0.024). However, the above
mentioned differences affected the cMVs only to a limited degree. Also, none of the
glucometabolic variables measured was associated with cMVs (data not shown).
Almost all patients were on platelet inhibition and 93% on statin treatment. Of the 50
patients in the non-albuminuria group one patient was lacking citrated plasma for cMVs
analysis.
cMVs in patients with and without albuminuria.
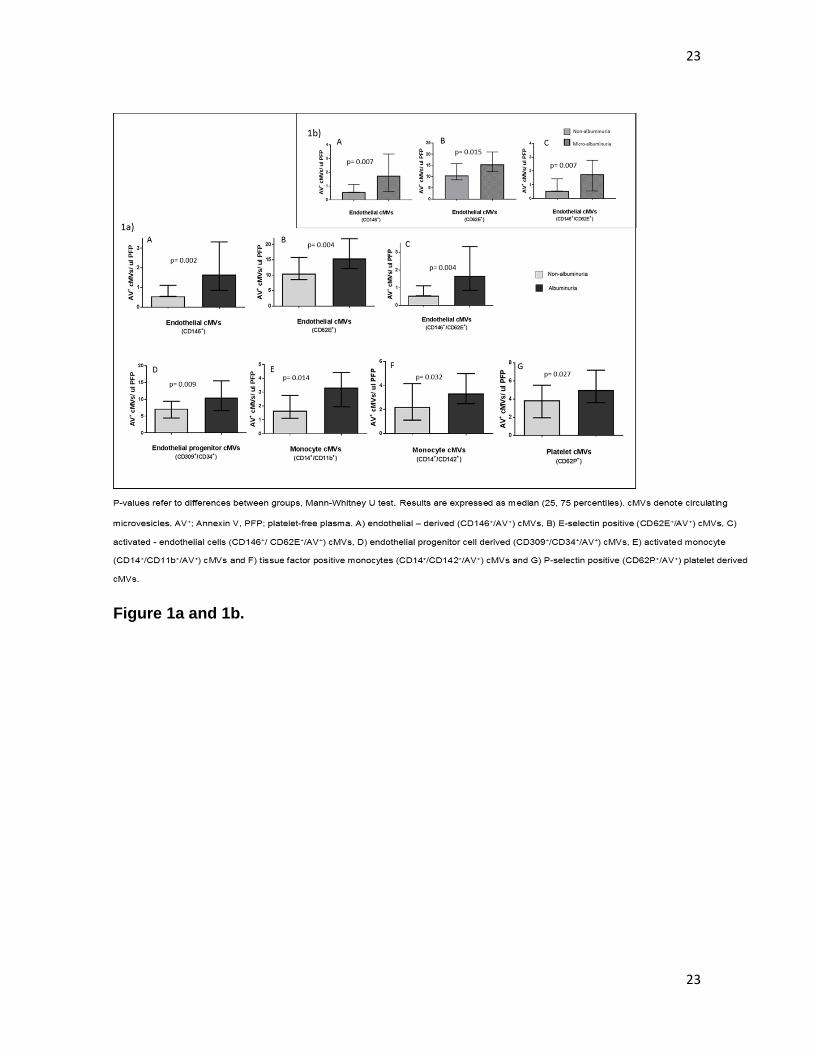
Albuminuria patients compared to those without, presented with significantly elevated
levels of EMVs and cMVs originated from monocytes (MMVs), platelets (PMVs) and EPCs,
as shown in Figure 1a). When excluding patients with macro albuminuria (n= 6), thus
analyzing those with microalbuminuria (n= 19) compared to non-albuminuria (n= 49), only
EMVs (CD146+/AV+, CD62E+/AV+ and CD146+/CD62E+/AV+), were still significantly
elevated in the microalbuminuria group, as presented in Figure 1b). (Insert Figure 1).
ROC curve analysis of EMVs (CD146+/CD62E+/AV+) from activated endothelial cells, for
the presence of albuminuria shows an AUC of 0.704 (95 % confidence interval 0.57-
0.84)(p= 0.004), as visualized in Figure 2. (Insert Figure 2). When adjusting for the
11
11
differences between the albuminuria groups as shown in Table 1, the results were limited
affected.
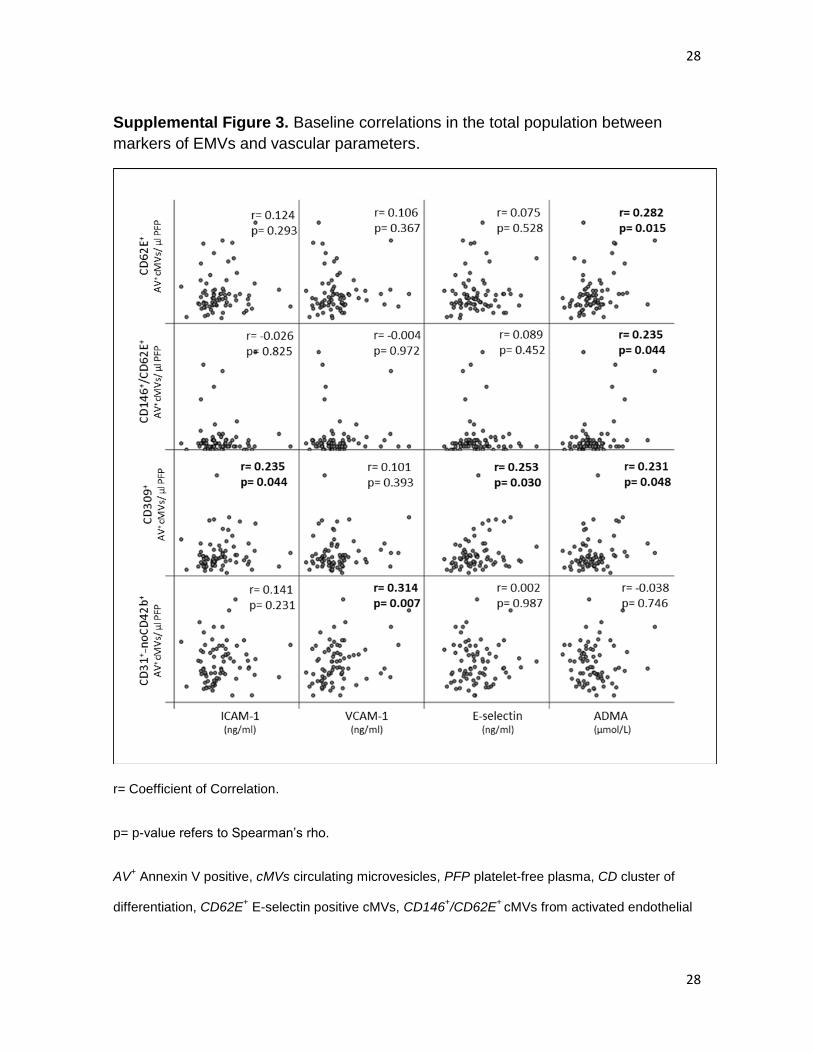
To confirm that the measured EMVs originate from endothelial cells, the different EMVs
were correlated to previously measured indices of vascular injury or dysfunction
(endothelial cell adhesion molecules and asymmetric dimethylarginine (ADMA). 22 As can
be seen (Supplemental Figure 3), significant correlations were found.
Effect of exercise training on cMVs
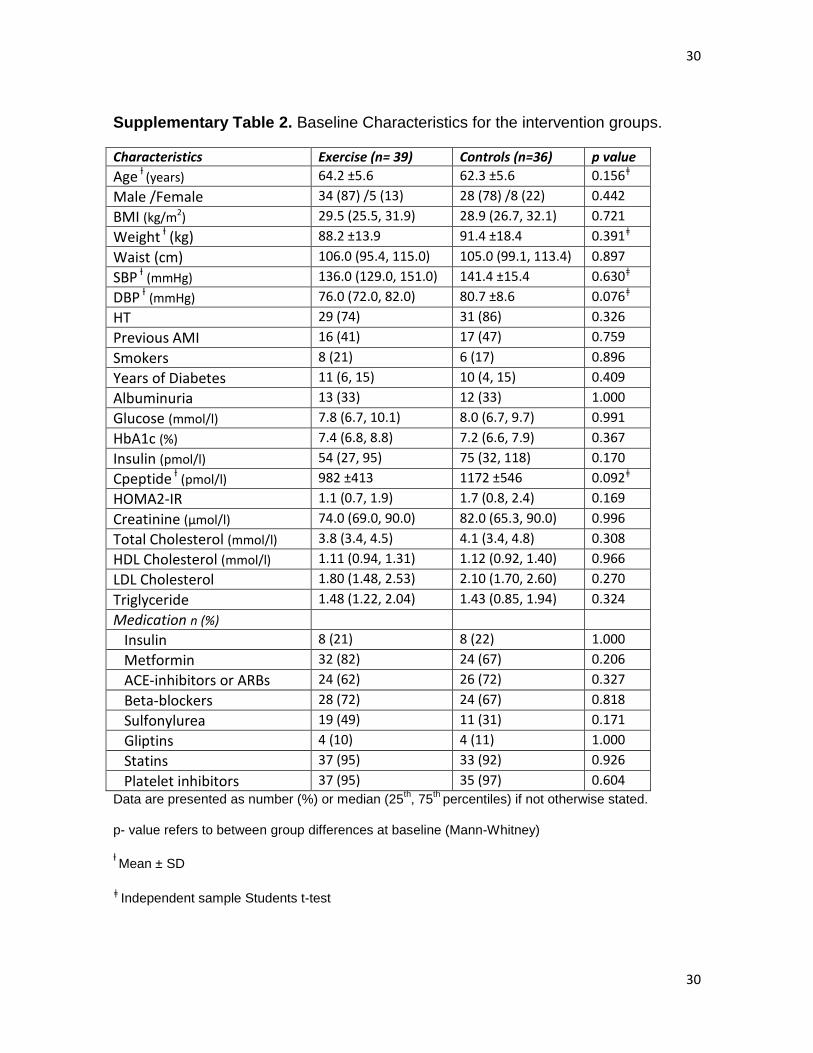
The number of patients with albuminuria in the exercise- and control group was equally
distributed (p= 1.000). At baseline no significant differences were observed between the
two randomized groups, regarding clinical characteristics (see Supplementary Table 2) or
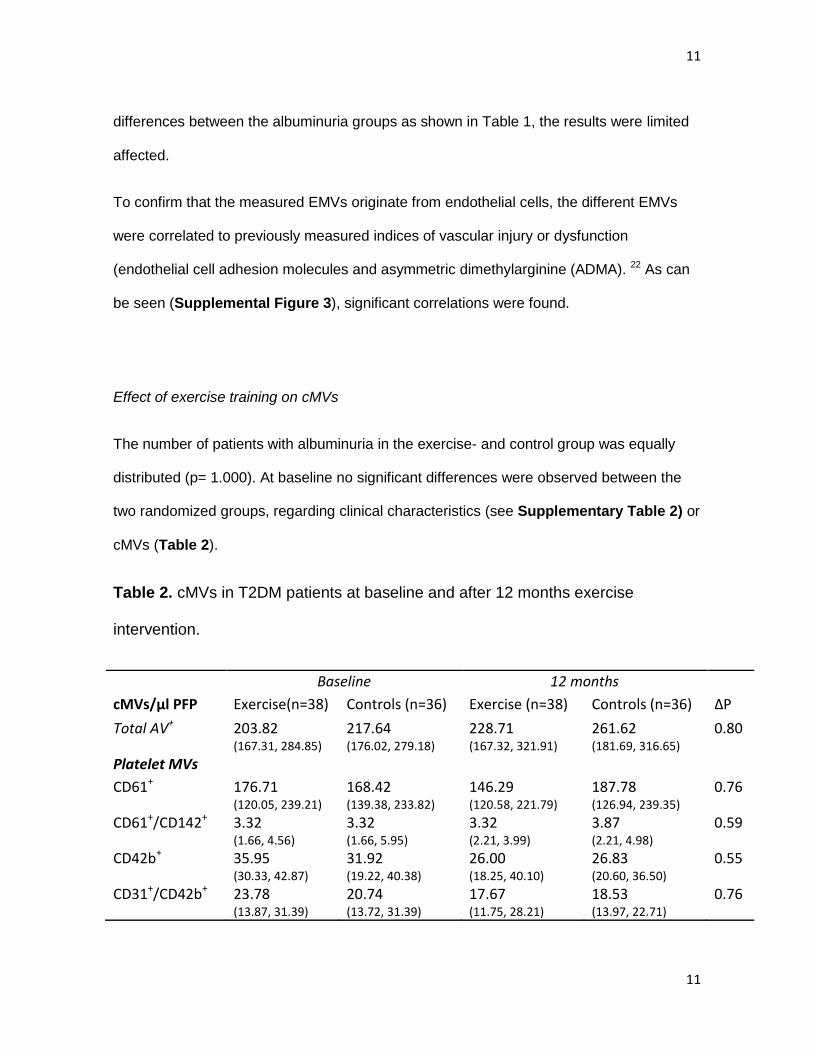
cMVs (Table 2).
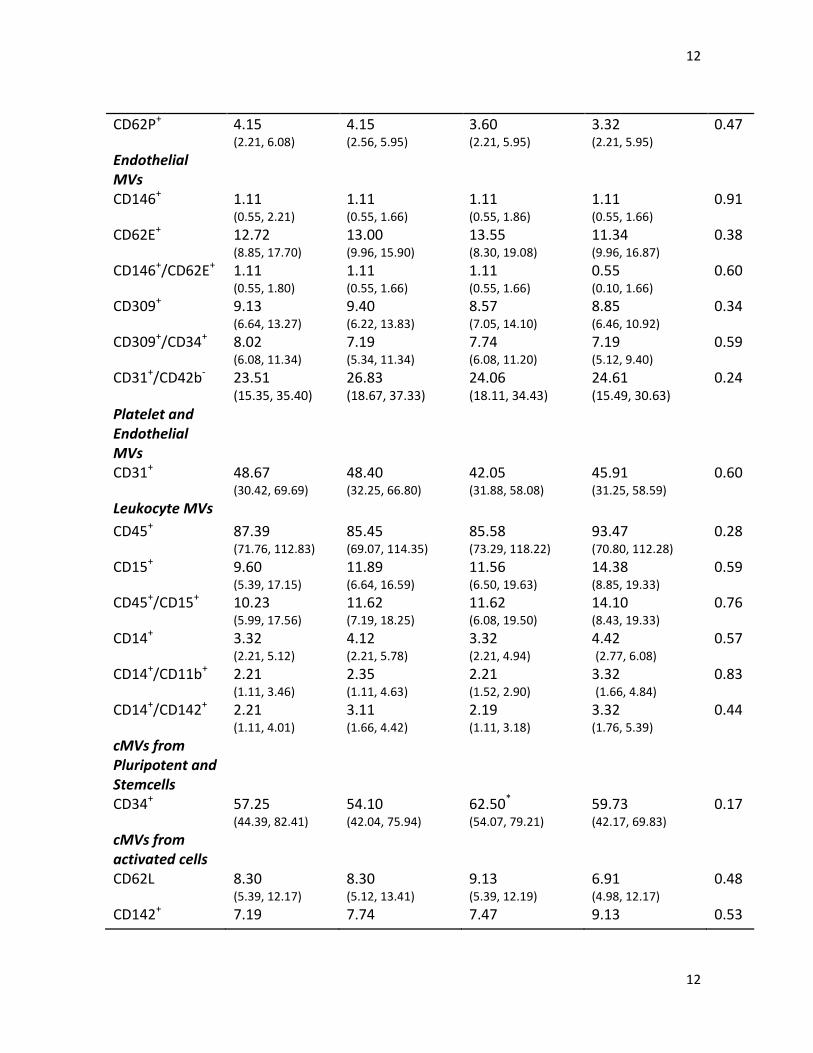
Table 2. cMVs in T2DM patients at baseline and after 12 months exercise
intervention.
Baseline 12 months
cMVs/µl PFP Exercise(n=38) Controls (n=36) Exercise (n=38) Controls (n=36) ΔP
Total AV+ 203.82 (167.31, 284.85)
217.64 (176.02, 279.18)
228.71 (167.32, 321.91)
261.62 (181.69, 316.65)
0.80
Platelet MVs
CD61+ 176.71 (120.05, 239.21)
168.42 (139.38, 233.82)
146.29 (120.58, 221.79)
187.78 (126.94, 239.35)
0.76
CD61+/CD142+ 3.32 (1.66, 4.56)
3.32 (1.66, 5.95)
3.32 (2.21, 3.99)
3.87 (2.21, 4.98)
0.59
CD42b+ 35.95 (30.33, 42.87)
31.92 (19.22, 40.38)
26.00 (18.25, 40.10)
26.83 (20.60, 36.50)
0.55
CD31+/CD42b+ 23.78 (13.87, 31.39)
20.74 (13.72, 31.39)
17.67 (11.75, 28.21)
18.53 (13.97, 22.71)
0.76
12
12
CD62P+ 4.15 (2.21, 6.08)
4.15 (2.56, 5.95)
3.60 (2.21, 5.95)
3.32 (2.21, 5.95)
0.47
Endothelial MVs
CD146+ 1.11 (0.55, 2.21)
1.11 (0.55, 1.66)
1.11 (0.55, 1.86)
1.11 (0.55, 1.66)
0.91
CD62E+ 12.72 (8.85, 17.70)
13.00 (9.96, 15.90)
13.55 (8.30, 19.08)
11.34 (9.96, 16.87)
0.38
CD146+/CD62E+ 1.11 (0.55, 1.80)
1.11 (0.55, 1.66)
1.11 (0.55, 1.66)
0.55 (0.10, 1.66)
0.60
CD309+ 9.13 (6.64, 13.27)
9.40 (6.22, 13.83)
8.57 (7.05, 14.10)
8.85 (6.46, 10.92)
0.34
CD309+/CD34+ 8.02 (6.08, 11.34)
7.19 (5.34, 11.34)
7.74 (6.08, 11.20)
7.19 (5.12, 9.40)
0.59
CD31+/CD42b- 23.51 (15.35, 35.40)
26.83 (18.67, 37.33)
24.06 (18.11, 34.43)
24.61 (15.49, 30.63)
0.24
Platelet and Endothelial MVs
CD31+ 48.67 (30.42, 69.69)
48.40 (32.25, 66.80)
42.05 (31.88, 58.08)
45.91 (31.25, 58.59)
0.60
Leukocyte MVs
CD45+ 87.39 (71.76, 112.83)
85.45 (69.07, 114.35)
85.58 (73.29, 118.22)
93.47 (70.80, 112.28)
0.28
CD15+ 9.60 (5.39, 17.15)
11.89 (6.64, 16.59)
11.56 (6.50, 19.63)
14.38 (8.85, 19.33)
0.59
CD45+/CD15+ 10.23 (5.99, 17.56)
11.62 (7.19, 18.25)
11.62 (6.08, 19.50)
14.10 (8.43, 19.33)
0.76
CD14+ 3.32 (2.21, 5.12)
4.12 (2.21, 5.78)
3.32 (2.21, 4.94)
4.42 (2.77, 6.08)
0.57
CD14+/CD11b+ 2.21 (1.11, 3.46)
2.35 (1.11, 4.63)
2.21 (1.52, 2.90)
3.32 (1.66, 4.84)
0.83
CD14+/CD142+ 2.21 (1.11, 4.01)
3.11 (1.66, 4.42)
2.19 (1.11, 3.18)
3.32 (1.76, 5.39)
0.44
cMVs from Pluripotent and Stemcells
CD34+ 57.25 (44.39, 82.41)
54.10 (42.04, 75.94)
62.50*
(54.07, 79.21) 59.73 (42.17, 69.83)
0.17
cMVs from activated cells
CD62L 8.30 (5.39, 12.17)
8.30 (5.12, 13.41)
9.13 (5.39, 12.19)
6.91 (4.98, 12.17)
0.48
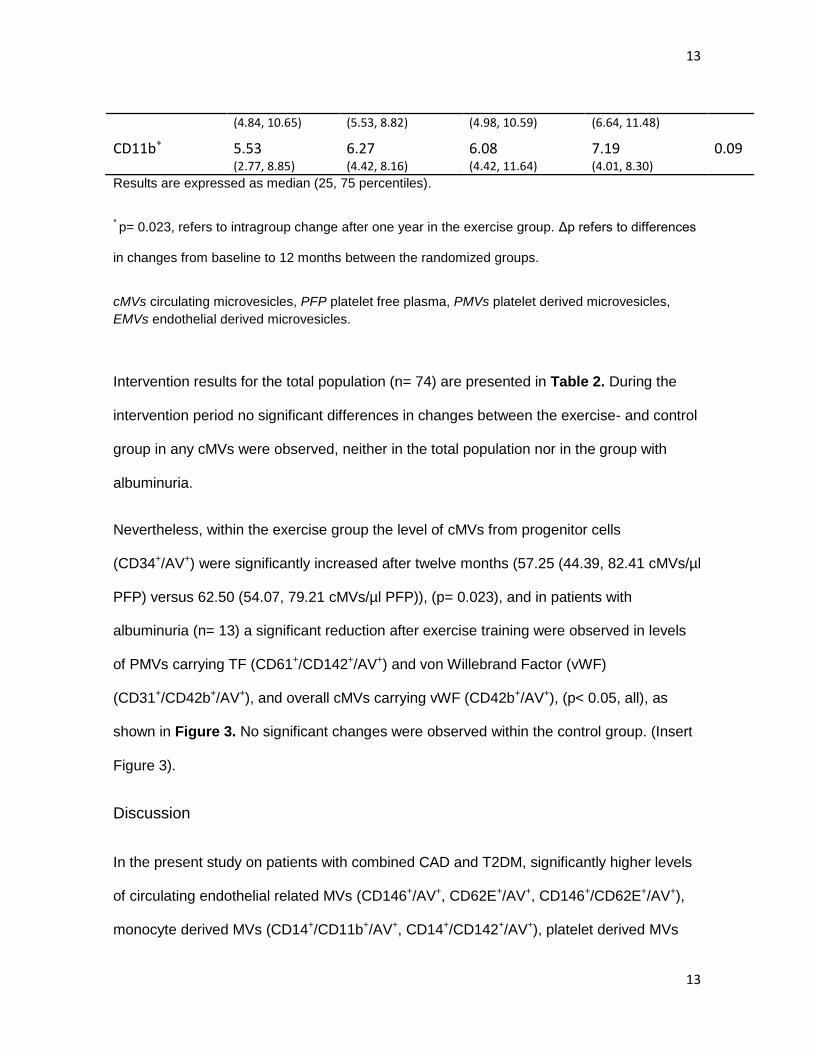
CD142+ 7.19 7.74 7.47 9.13 0.53
13
13
(4.84, 10.65) (5.53, 8.82) (4.98, 10.59) (6.64, 11.48)
CD11b+ 5.53 (2.77, 8.85)
6.27 (4.42, 8.16)
6.08 (4.42, 11.64)
7.19 (4.01, 8.30)
0.09
Results are expressed as median (25, 75 percentiles).
* p= 0.023, refers to intragroup change after one year in the exercise group. Δp refers to differences
in changes from baseline to 12 months between the randomized groups.
cMVs circulating microvesicles, PFP platelet free plasma, PMVs platelet derived microvesicles,
EMVs endothelial derived microvesicles.
Intervention results for the total population (n= 74) are presented in Table 2. During the
intervention period no significant differences in changes between the exercise- and control
group in any cMVs were observed, neither in the total population nor in the group with
albuminuria.
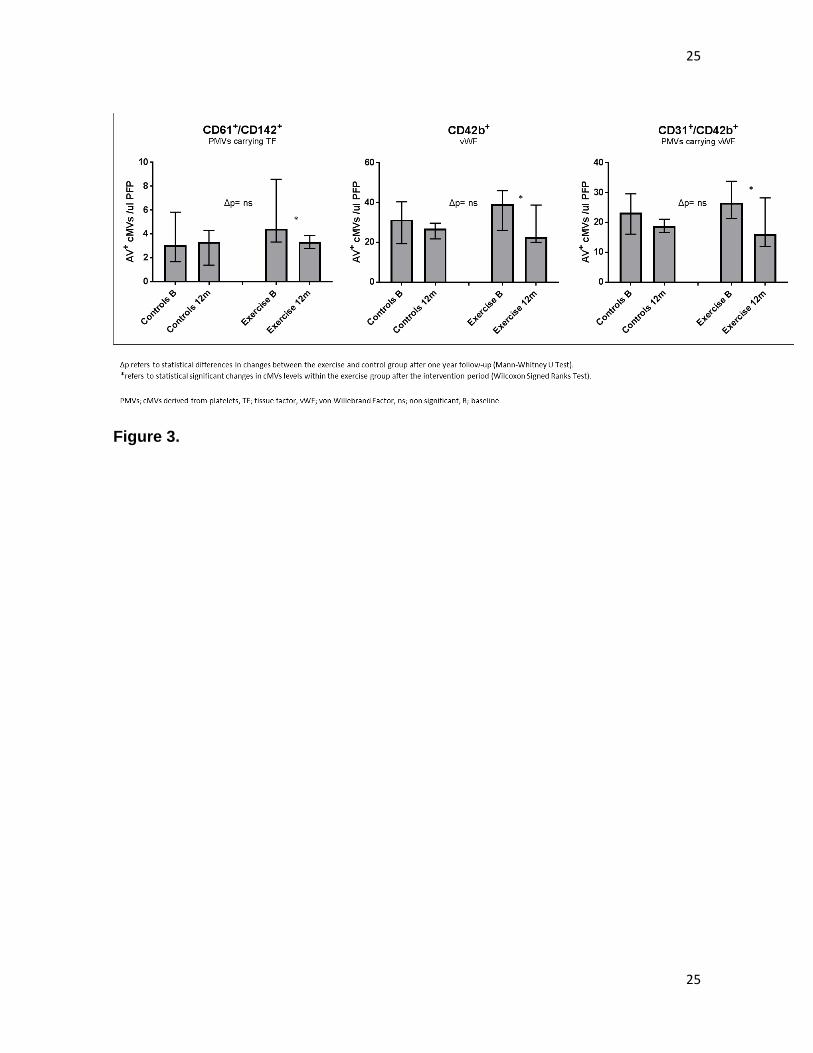
Nevertheless, within the exercise group the level of cMVs from progenitor cells
(CD34+/AV+) were significantly increased after twelve months (57.25 (44.39, 82.41 cMVs/µl
PFP) versus 62.50 (54.07, 79.21 cMVs/µl PFP)), (p= 0.023), and in patients with
albuminuria (n= 13) a significant reduction after exercise training were observed in levels
of PMVs carrying TF (CD61+/CD142+/AV+) and von Willebrand Factor (vWF)
(CD31+/CD42b+/AV+), and overall cMVs carrying vWF (CD42b+/AV+), (p< 0.05, all), as
shown in Figure 3. No significant changes were observed within the control group. (Insert
Figure 3).
Discussion
In the present study on patients with combined CAD and T2DM, significantly higher levels
of circulating endothelial related MVs (CD146+/AV+, CD62E+/AV+, CD146+/CD62E+/AV+),
monocyte derived MVs (CD14+/CD11b+/AV+, CD14+/CD142+/AV+), platelet derived MVs
14
14
(CD62P+/AV+) and cMVs from endothelial progenitor cells (CD309+/CD34+/AV+), were
found in patients presenting with albuminuria compared to non-albuminuria patients. The
AUC of 0.704 for the EMVs to predict albuminuria may reflect enhanced chronic
endothelial cell activation in the advanced states of diabetes, when albuminuria occurs.
EMVs were significantly elevated also in the subgroup with microalbuminuria only. The
albuminuria patients included more smokers, higher BMI, more severe insulin
resistance/use of insulin and less intake of sulfonylurea compared to the non-albuminuria
group. However, no significant associations between these characteristics and the cMVs
were present. Also, no significant associations between the measured cMVs and
glucometabolic variables were observed.
During the 12 months intervention period, levels of cMVs derived from progenitor cells
increased within the exercise group, and within the albuminuria patients a significant
decrease in PMVs carrying TF and vWF and overall cMVs loaded with vWF were
observed. However, these changes did not differ significantly from the changes in the
control group.
The most striking findings were cMVs shed from activated endothelial cells to be
significantly elevated in patients with albuminuria, and also significantly elevated in those
with microalbuminuria only. High levels of EMVs might reflect progression of
atherosclerosis and vascular injury in T2DM, particularly in patients with diabetes
associated nephropathy.9 We have previously reported on levels of vascular parameters in
the EXCADI study, 22 and as shown (Supplemental Figure 3), there were significant
correlations between EMVs and other indices of vascular injury, verifying that the
measured EMVs originate from the endothelium.
15
15
In line with our results, Rodrigues et al demonstrated elevated levels of EMVs (CD51+/AV+)
in a cohort of T2DM patients with nephropathy, 23 and EMVs (CD31+/AV+) were found
increased in patients with micro- or macro albuminuria, compared to those without
albuminuria. 24 Further, increased ratio of EMVs to EPCs was shown to be associated with
reduced glomerular filtration rate (GFR), indicating that an imbalance in endothelial
damage and repair capacity may in part explain reduced renal function. 25 Ongoing
inflammation, thrombin generation and hyperglycemia are all factors contributing to
accelerated release of EMVs, reflecting the state of the parent cell, 26 which might explain
the elevated levels observed in the present study.
In patients presenting with albuminuria cMVs derived from EPCs (CD309+/CD34+/AV+)
were significantly elevated, potentially reflecting increased vascular damage and the need
for repair. Increased mobilization of CD34+/CD133+ have been demonstrated in diabetic
patients on insulin therapy, 27 in consistency with our data of more frequent use of insulin
in the albuminuria patients. Insulin resistance and hyperglycemia were shown to attenuate
migration from the bone-marrow, differentiation and functionality of EPCs. 10 Of note, in the
latter study the number of EPCs per se was measured, while we investigated EPC-
derived cMVs. However, recent findings suggest that EPCs mediate vascular repair via
paracrine mechanisms, e.g. releasing cMVs containing micro-RNA’s that can promote
vascular repair. 28 Therefore, our albuminuria patients may have the same or lower levels
of circulating EPCs than non- albuminuria patients, despite their higher levels of EPC-
derived cMVs.
PMVs reflect chronic platelet activation and are the most abundant in the circulation. 29
Elevated levels of PMVs containing the receptor for P-selectin (CD62P+) have been shown
in diabetes patients. 30 We could demonstrate significantly higher levels of CD62P+ PMVs
16
16
in our patients with combined CAD and T2DM with albuminuria compared to those without.
In line with our findings, Almquist et al found increased levels of PMVs, EMVs and MMVs
in patients with CKD compared to DM patients with normal glomerular filtration rate. 31
Further, in diabetic patients with an acute myocardial infarction (MI), significantly higher
amounts of CD62P+ PMVs were demonstrated and an early increase of these MVs after
an MI was associated with higher risk of CVD events during 2 year follow up period. 32
PMVs carrying P-selectin mediate leukocyte recruitment and aggregation via P-selectin
glycoprotein-1, contributing to atherothrombosis.
Activated monocytes and MMVs are key players in atherothrombosis. We could show
significantly elevated numbers of MMVs (CD14+/CD11b+) and MMVs expressing TF
(CD14+/CD142+) in our albuminuria patients. Sulfonylurea, which has been associated with
reduced expression of TF and reduced number of MMVs in vitro, 33 was far more common
in the non- albuminuria group. Our results are in accordance with previous studies
showing significantly higher levels of MMVs in T2DM patients who developed diabetic
complications, especially nephropathy and both MMVs and PMVs to be correlated to
microvascular damage. 34, 35 MMVs are also suggested to be involved in kidney disease
through effects on the podocytes, causing glomerular inflammation and increased
glomerular permeability. 36
The 12 months combined aerobic and resistance exercise training did not result in any
significant differences in changes from controls in any of the measured cMVs. There are
very limited data on the effect of long-term exercise on cMVs. In a study on healthy
individuals, acute exercise of moderate intensity reduced the number of CD62E+ MVs,
compared to high intensity interval training, 37 and accelerated production of PMVs was
observed after strenuous exercise. 38 More consistent with our data is a study on physically
17
17
fit men with stable CHD, which showed no changes in EMVs and PMVs after high- and
moderate intensity training. 39
Within the exercise group we could, nevertheless, observe a significant increase in
progenitor cell derived cMVs, which might suggest a beneficial effect of exercise on the
vascular endothelium, supporting previous reports regarding recruitment and survival of
EPC after exercise. 40
Further, within patients with albuminuria that exercised, a favorable effect on the
hypercoagulable state by a decreased number of cMVs with procoagulant activity was
noted. However, precautions have to be taken due to low numbers.
Almost all patients in our up to date medical treated population were on statins and aspirin
therapy, both been associated with reduced numbers of EMVs and PMVs, 41 which to
some degree may explain the lack or limited effects of the intervention. We have
previously also reported that the intervention program did not have any impact on the
procoagulant state in the present population. 17
In conclusion, CAD patients with T2DM and albuminuria had elevated number of cMVs
derived from activated blood and vascular cells. More specifically, cMVs from endothelial
cells seem to be present in the early stages of albumin excretion rendering them as
potential markers of disease severity, and cMVs from EPCs suggested to undertake repair
of damaged endothelium were increased in patients with albuminuria. The measured
cMVs were only limitedly affected by long-term exercise training in our population, having
albuminuria or not.
18
18
Acknowledgements
The authors want to thank Ida U Njerve and Sissel Åkra for valuable contributions to the
study.
Authors’ contributions
All authors have contributed significantly and in accordance with the latest guidelines of
the International Committee of Medical Journal Editors. VB was involved in the design of
the study, analysis and interpretation of the results and in the drafting of the manuscript.
GCB contributed to the interpretation of the results, drafting and revising of the manuscript.
RB was responsible for the main randomized trial involving recruitment and follow-up of
the study participants, acquisition and interpretation of clinical and laboratory data, as well
as revising of the manuscript. SS was involved in the conception of the trial and revising of
the manuscript. IS and HA contributed to the conception and design of the study,
interpretation of the results, drafting and revising of the manuscript. All authors are in
agreement of the content and approved the final manuscript before submission.
Funding
The authors received no financial support from any funding agency in the public,
commercial, or not-for-profit sectors for the work with this article.
Declaration of conflicting interests
The authors declare that they have no conflicts of interests.

19
19
Supplementary Materials
Raw data related to the paper is available on request.
20
20
References
1. Nomura S and Shimizu M. Clinical significance of procoagulant microparticles. Journal of intensive care 2015; 3: 2. 2015/02/24. DOI: 10.1186/s40560-014-0066-z. 2. Owens AP, 3rd and Mackman N. Microparticles in hemostasis and thrombosis. Circ Res 2011; 108: 1284-1297. 2011/05/14. DOI: 10.1161/circresaha.110.233056. 3. Liu ML, Williams KJ and Werth VP. Microvesicles in Autoimmune Diseases. Adv Clin Chem 2016; 77: 125-175. 2016/10/09. DOI: 10.1016/bs.acc.2016.06.005. 4. Li S, Wei J, Zhang C, et al. Cell-Derived Microparticles in Patients with Type 2 Diabetes Mellitus: a Systematic Review and Meta-Analysis. Cell Physiol Biochem 2016; 39: 2439-2450. 2016/11/11. DOI: 10.1159/000452512. 5. Tsimerman G, Roguin A, Bachar A, et al. Involvement of microparticles in diabetic vascular complications. Thromb Haemost 2011; 106: 310-321. 2011/06/30. DOI: 10.1160/th10-11-0712. 6. Paneni F, Beckman JA, Creager MA, et al. Diabetes and vascular disease: pathophysiology, clinical consequences, and medical therapy: part I. Eur Heart J 2013; 34: 2436-2443. 2013/05/04. DOI: 10.1093/eurheartj/eht149. 7. Uwaezuoke SN. The role of novel biomarkers in predicting diabetic nephropathy: a review. Int J Nephrol Renovasc Dis 2017; 10: 221-231. 2017/09/02. DOI: 10.2147/ijnrd.S143186. 8. Nomura S. Dynamic role of microparticles in type 2 diabetes mellitus. Curr Diabetes Rev 2009; 5: 245-251. 2009/06/18. 9. Deng F, Wang S and Zhang L. Endothelial Microparticles Act as Novel Diagnostic and Therapeutic Biomarkers of Diabetes and Its Complications: A Literature Review. BioMed research international 2016; 2016: 9802026. 2016/11/03. DOI: 10.1155/2016/9802026. 10. Cubbon RM, Kahn MB and Wheatcroft SB. Effects of insulin resistance on endothelial progenitor cells and vascular repair. Clin Sci (Lond) 2009; 117: 173-190. 2009/07/28. DOI: 10.1042/cs20080263. 11. Werner N, Kosiol S, Schiegl T, et al. Circulating endothelial progenitor cells and cardiovascular outcomes. N Engl J Med 2005; 353: 999-1007. 2005/09/09. DOI: 10.1056/NEJMoa043814. 12. Colberg SR, Albright AL, Blissmer BJ, et al. Exercise and type 2 diabetes: American College of Sports Medicine and the American Diabetes Association: joint position statement. Exercise and type 2 diabetes. Med Sci Sports Exerc 2010; 42: 2282-2303. 2010/11/19. DOI: 10.1249/MSS.0b013e3181eeb61c. 13. Okada S, Hiuge A, Makino H, et al. Effect of exercise intervention on endothelial function and incidence of cardiovascular disease in patients with type 2 diabetes. Journal of atherosclerosis and thrombosis 2010; 17: 828-833. 2010/05/15. 14. Highton PJ, Martin N, Smith AC, et al. Microparticles and Exercise in Clinical Populations. Exerc Immunol Rev 2018; 24: 46-58. 2018/02/21. 15. Chen YC, Ho CW, Tsai HH, et al. Interval and continuous exercise regimens suppress neutrophil-derived microparticle formation and neutrophil-promoted thrombin generation under hypoxic stress. Clin Sci (Lond) 2015; 128: 425-436. 2014/11/06. DOI: 10.1042/cs20140498. 16. Koutroumpi M, Dimopoulos S, Psarra K, et al. Circulating endothelial and progenitor cells: Evidence from acute and long-term exercise effects. World J Cardiol 2012; 4: 312-326. 2012/12/29. DOI: 10.4330/wjc.v4.i12.312.
21
21
17. Bratseth V, Byrkjeland R, Njerve IU, et al. Procoagulant activity in patients with combined type 2 diabetes and coronary artery disease: No effects of long-term exercise training. Diab Vasc Dis Res 2017; 14: 144-151. 2017/01/24. DOI: 10.1177/1479164116679080. 18. Byrkjeland R, Njerve IU, Anderssen S, et al. Effects of exercise training on HbA1c and VO2peak in patients with type 2 diabetes and coronary artery disease: A randomised clinical trial. Diab Vasc Dis Res 2015; 12: 325-333. 2015/06/21. DOI: 10.1177/1479164115590552. 19. Katsuki A, Sumida Y, Gabazza EC, et al. Homeostasis model assessment is a reliable indicator of insulin resistance during follow-up of patients with type 2 diabetes. Diabetes Care 2001; 24: 362-365. 2001/02/24. 20. Chiva-Blanch G, Bratseth V, Ritschel V, et al. Monocyte-derived circulating microparticles (CD14(+), CD14(+)/CD11b(+) and CD14(+)/CD142(+)) are related to long-term prognosis for cardiovascular mortality in STEMI patients. Int J Cardiol 2017; 227: 876-881. 2016/12/05. DOI: 10.1016/j.ijcard.2016.11.302. 21. Nieuwland R, Berckmans RJ, McGregor S, et al. Cellular origin and procoagulant properties of microparticles in meningococcal sepsis. Blood 2000; 95: 930-935. 2000/01/29. 22. Byrkjeland R, Njerve IU, Arnesen H, et al. Reduced endothelial activation after exercise is associated with improved HbA1c in patients with type 2 diabetes and coronary artery disease. Diab Vasc Dis Res 2017; 14: 94-103. 2017/01/24. DOI: 10.1177/1479164116679077. 23. Rodrigues KF, Pietrani NT, Fernandes AP, et al. Circulating microparticles levels are increased in patients with diabetic kidney disease: A case-control research. Clin Chim Acta 2018 2018/01/07. DOI: 10.1016/j.cca.2017.12.048. 24. Huang PH, Huang SS, Chen YH, et al. Increased circulating CD31+/annexin V+ apoptotic microparticles and decreased circulating endothelial progenitor cell levels in hypertensive patients with microalbuminuria. J Hypertens 2010; 28: 1655-1665. 2010/06/04. DOI: 10.1097/HJH.0b013e32833a4d0a. 25. Hsu CY, Huang PH, Chiang CH, et al. Increased circulating endothelial apoptotic microparticle to endothelial progenitor cell ratio is associated with subsequent decline in glomerular filtration rate in hypertensive patients. PLoS One 2013; 8: e68644. 2013/07/23. DOI: 10.1371/journal.pone.0068644. 26. Yong PJ, Koh CH and Shim WS. Endothelial microparticles: missing link in endothelial dysfunction? European journal of preventive cardiology 2013; 20: 496-512. 2012/04/13. DOI: 10.1177/2047487312445001. 27. Humpert PM, Neuwirth R, Battista MJ, et al. SDF-1 genotype influences insulin-dependent mobilization of adult progenitor cells in type 2 diabetes. Diabetes Care 2005; 28: 934-936. 2005/03/29. 28. Zhang M, Malik AB and Rehman J. Endothelial progenitor cells and vascular repair. Curr Opin Hematol 2014; 21: 224-228. 2014/03/19. DOI: 10.1097/moh.0000000000000041. 29. Badimon L, Suades R, Fuentes E, et al. Role of Platelet-Derived Microvesicles As Crosstalk Mediators in Atherothrombosis and Future Pharmacology Targets: A Link between Inflammation, Atherosclerosis, and Thrombosis. Front Pharmacol 2016; 7: 293. 2016/09/16. DOI: 10.3389/fphar.2016.00293. 30. Nomura S, Inami N, Shouzu A, et al. Correlation and association between plasma platelet-, monocyte- and endothelial cell-derived microparticles in hypertensive patients with type 2 diabetes mellitus. Platelets 2009; 20: 406-414. 2009/08/07. DOI: 10.1080/09537100903114545.
22
22
31. Almquist T, Mobarrez F, Jacobson SH, et al. Effects of lipid-lowering treatment on circulating microparticles in patients with diabetes mellitus and chronic kidney disease. Nephrol Dial Transplant 2016; 31: 944-952. 2015/09/24. DOI: 10.1093/ndt/gfv337. 32. Christersson C, Thulin A and Siegbahn A. Microparticles during long-term follow-up after acute myocardial infarction. Association to atherosclerotic burden and risk of cardiovascular events. Thromb Haemost 2017; 117: 1571-1581. 2017/04/21. DOI: 10.1160/th16-11-0837. 33. Henriksson CE, Hellum M, Haug KB, et al. Anticoagulant effects of an antidiabetic drug on monocytes in vitro. Thromb Res 2011; 128: e100-106. 2011/08/25. DOI: 10.1016/j.thromres.2011.07.007. 34. Omoto S, Nomura S, Shouzu A, et al. Detection of monocyte-derived microparticles in patients with Type II diabetes mellitus. Diabetologia 2002; 45: 550-555. 2002/05/29. DOI: 10.1007/s00125-001-0772-7. 35. Ogata N, Nomura S, Shouzu A, et al. Elevation of monocyte-derived microparticles in patients with diabetic retinopathy. Diabetes Res Clin Pract 2006; 73: 241-248. 2006/04/06. DOI: 10.1016/j.diabres.2006.01.014. 36. Eyre J, Burton JO, Saleem MA, et al. Monocyte- and endothelial-derived microparticles induce an inflammatory phenotype in human podocytes. Nephron Experimental nephrology 2011; 119: e58-66. 2011/08/19. DOI: 10.1159/000329575. 37. Shill DD, Lansford KA, Hempel HK, et al. Effect of exercise intensity on circulating microparticles in men and women. Exp Physiol 2018; 103: 693-700. 2018/02/23. DOI: 10.1113/ep086644. 38. Chaar V, Romana M, Tripette J, et al. Effect of strenuous physical exercise on circulating cell-derived microparticles. Clin Hemorheol Microcirc 2011; 47: 15-25. 2011/02/16. DOI: 10.3233/ch-2010-1361. 39. Guiraud T, Gayda M, Juneau M, et al. A single bout of high-intensity interval exercise does not increase endothelial or platelet microparticles in stable, physically fit men with coronary heart disease. Can J Cardiol 2013; 29: 1285-1291. 2013/07/09. DOI: 10.1016/j.cjca.2013.03.024. 40. Laufs U, Werner N, Link A, et al. Physical training increases endothelial progenitor cells, inhibits neointima formation, and enhances angiogenesis. Circulation 2004; 109: 220-226. 2003/12/24. DOI: 10.1161/01.Cir.0000109141.48980.37. 41. Bulut D, Becker V and Mugge A. Acetylsalicylate reduces endothelial and platelet-derived microparticles in patients with coronary artery disease. Can J Physiol Pharmacol 2011; 89: 239-244. 2011/05/05. DOI: 10.1139/y11-013.
23
23
Figure 1a and 1b.

24
24
Figure 2.
25
25
Figure 3.
26
26
Supplemental Figure 1. Gate limits for microvesicle analysis with the Megamix-Plus FSC beads for cytometer settings in microvesicle analysis.
27
27
Supplemental Figure 2. Circulating microvesicles identification and
characterization with the AccuriC6 flow cytometer.
APC denotes allophycocyanin; FITC indicates fluorescein isothiocyanate; and PE phycoerythrin.
28
28
Supplemental Figure 3. Baseline correlations in the total population between
markers of EMVs and vascular parameters.
r= Coefficient of Correlation.
p= p-value refers to Spearman’s rho.
AV+ Annexin V positive, cMVs circulating microvesicles, PFP platelet-free plasma, CD cluster of
differentiation, CD62E+ E-selectin positive cMVs, CD146
+/CD62E
+ cMVs from activated endothelial
29
29
cells, CD309+ and CD31
+_noCD42b
+ markers of endothelial cells, ICAM-1 intercellular adhesion
molecule-1, VCAM-1 vascular cell adhesion molecule-1, ADMA asymmetric dimethylarginine.
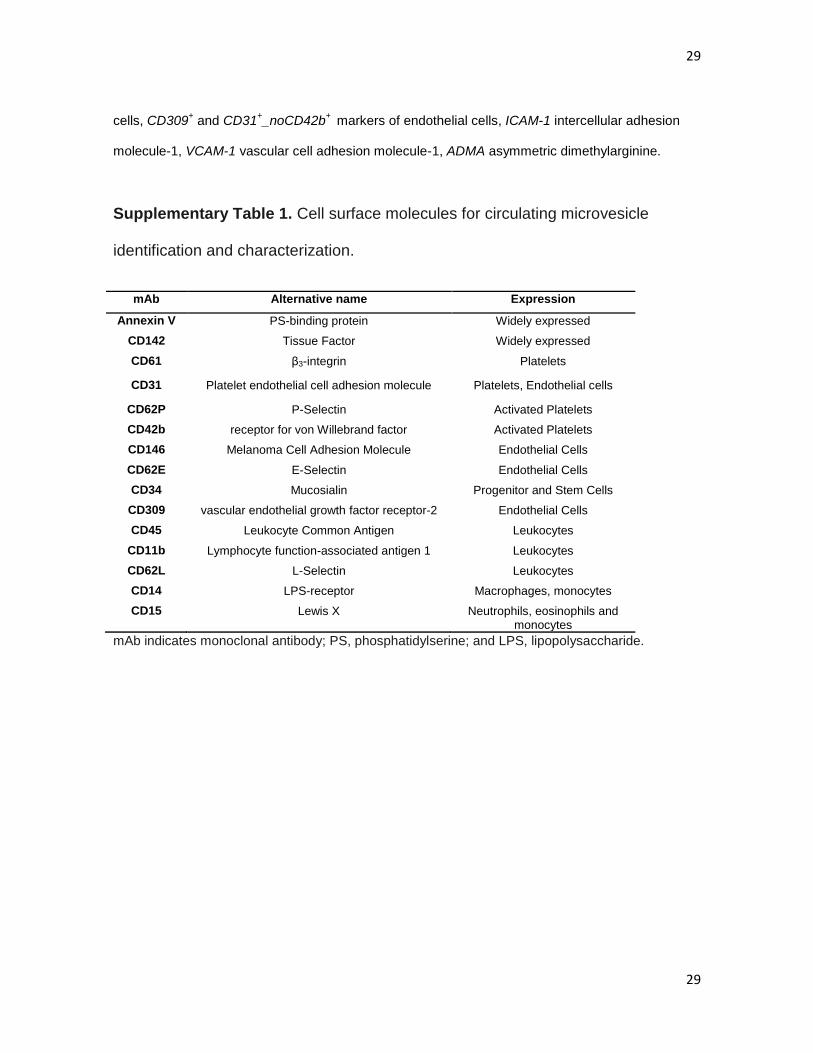
Supplementary Table 1. Cell surface molecules for circulating microvesicle
identification and characterization.
mAb Alternative name Expression
Annexin V PS-binding protein Widely expressed
CD142 Tissue Factor Widely expressed
CD61 β3-integrin Platelets
CD31 Platelet endothelial cell adhesion molecule Platelets, Endothelial cells
CD62P P-Selectin Activated Platelets
CD42b receptor for von Willebrand factor Activated Platelets
CD146 Melanoma Cell Adhesion Molecule Endothelial Cells
CD62E E-Selectin Endothelial Cells
CD34 Mucosialin Progenitor and Stem Cells
CD309 vascular endothelial growth factor receptor-2 Endothelial Cells
CD45 Leukocyte Common Antigen Leukocytes
CD11b Lymphocyte function-associated antigen 1 Leukocytes
CD62L L-Selectin Leukocytes
CD14 LPS-receptor Macrophages, monocytes
CD15 Lewis X Neutrophils, eosinophils and monocytes
mAb indicates monoclonal antibody; PS, phosphatidylserine; and LPS, lipopolysaccharide.
30
30
Supplementary Table 2. Baseline Characteristics for the intervention groups.
Characteristics Exercise (n= 39) Controls (n=36) p value
Age ƚ (years) 64.2 ±5.6 62.3 ±5.6 0.156ǂ
Male /Female 34 (87) /5 (13) 28 (78) /8 (22) 0.442
BMI (kg/m2) 29.5 (25.5, 31.9) 28.9 (26.7, 32.1) 0.721
Weight ƚ (kg) 88.2 ±13.9 91.4 ±18.4 0.391ǂ
Waist (cm) 106.0 (95.4, 115.0) 105.0 (99.1, 113.4) 0.897
SBP ƚ (mmHg) 136.0 (129.0, 151.0) 141.4 ±15.4 0.630ǂ
DBP ƚ (mmHg) 76.0 (72.0, 82.0) 80.7 ±8.6 0.076ǂ
HT 29 (74) 31 (86) 0.326
Previous AMI 16 (41) 17 (47) 0.759
Smokers 8 (21) 6 (17) 0.896
Years of Diabetes 11 (6, 15) 10 (4, 15) 0.409
Albuminuria 13 (33) 12 (33) 1.000
Glucose (mmol/l) 7.8 (6.7, 10.1) 8.0 (6.7, 9.7) 0.991
HbA1c (%) 7.4 (6.8, 8.8) 7.2 (6.6, 7.9) 0.367
Insulin (pmol/l) 54 (27, 95) 75 (32, 118) 0.170
Cpeptide ƚ (pmol/l) 982 ±413 1172 ±546 0.092ǂ
HOMA2-IR 1.1 (0.7, 1.9) 1.7 (0.8, 2.4) 0.169
Creatinine (µmol/l) 74.0 (69.0, 90.0) 82.0 (65.3, 90.0) 0.996
Total Cholesterol (mmol/l) 3.8 (3.4, 4.5) 4.1 (3.4, 4.8) 0.308
HDL Cholesterol (mmol/l) 1.11 (0.94, 1.31) 1.12 (0.92, 1.40) 0.966
LDL Cholesterol 1.80 (1.48, 2.53) 2.10 (1.70, 2.60) 0.270
Triglyceride 1.48 (1.22, 2.04) 1.43 (0.85, 1.94) 0.324
Medication n (%)
Insulin 8 (21) 8 (22) 1.000
Metformin 32 (82) 24 (67) 0.206
ACE-inhibitors or ARBs 24 (62) 26 (72) 0.327
Beta-blockers 28 (72) 24 (67) 0.818
Sulfonylurea 19 (49) 11 (31) 0.171
Gliptins 4 (10) 4 (11) 1.000
Statins 37 (95) 33 (92) 0.926
Platelet inhibitors 37 (95) 35 (97) 0.604
Data are presented as number (%) or median (25th, 75
th percentiles) if not otherwise stated.
p- value refers to between group differences at baseline (Mann-Whitney)
ƚ Mean ± SD
ǂ Independent sample Students t-test
31
31
BMI body mass index, SBP systolic blood pressure, DBP diastolic blood pressure, HT hypertension,
AMI acute myocardial infarction, ACE angiotensin converting enzyme, ARB angiotensin receptor II
blocker.