Embed Size (px)
Citation preview

MPRAMunich Personal RePEc Archive
Output supply and yield response of ricein Nigeria: implications for future ricepolicy
David Boansi
Corvinus University of Budapest, Hungary
2. July 2013
Online at http://mpra.ub.uni-muenchen.de/48080/MPRA Paper No. 48080, posted 7. July 2013 09:17 UTC

1
OUTPUT SUPPLY AND YIELD RESPONSE OF RICE IN NIGERIA: IMPLICATIONS FOR
FUTURE RICE POLICY
Boansi David
Department of Agricultural Economics and Rural Development,
Corvinus University of Budapest, Hungary
ABSTRACT
With the local rice industry of Nigeria been hindered by inconsistent government policies, improper
methods of production, high cost and scarcity of vital inputs of production among other constraints,
domestic production of rice has failed to catch up with the increasing pace of consumption. In spite of
the strong agricultural and natural resource base it hauls, Nigeria spends a total of about US$11 billion
annually on importation of rice, wheat, sugar and fish. Attempts by previous regimes and the current
government to reverse the net rice importer status of the country has proven futile regardless of the
high tariffs imposed on imports, quantitative restriction through the use of quota and outright ban
between the years 1986 and 1995. To inform future rice policy decisions on the way forward, the
current study analyzed the output supply and yield response of rice in Nigeria. The results show that
output of rice increases with increasing harvested area of rice, increasing farm gate price of rice,
increasing nominal rate of assistance and increasing labor availability. It however decreases with
increasing price of maize. Yield increases with increasing farm gate price of rice, nominal rate of
assistance and labor availability. It however decreases with increasing harvested area of rice and price
of maize. To improve on its rice supply, it is advised that policy measures be devised to couple area
expansion with intensification to help mitigate the adverse effect of area expansion on yield, reduce
labor shortages through appropriate investment in development of the rural communities (to help
minimize rural-urban migration), ensure continuous government support to the sector, maintain fair
prices for local rice farmers, and ensure appropriate transmission in times of price increment.
Keywords: Output supply response, yield response, nominal rate of assistance, government policies 1
1.0 INTRODUCTION
Hindered by inconsistent government policies, improper production methods, high cost and scarcity of
vital inputs of production, and post-harvest handling and marketing challenges, the local rice industry
of Nigeria has failed to catch up with the increasing pace of consumption (driven by increasing per
capita income, urbanization and population growth). By estimates of USDA as sourced from the
World Rice Statistics of IRRI, current milled rice production of 2.85 million tonnes accounts for
approximately 55percent of total supply of rice in Nigeria, with the remaining 45 percent been bridged
through imports. Although blessed with a strong base of agricultural and natural resources coupled
1 Corresponding Author: Boansi David ([email protected])
Department of Agricultural Economics and Rural Development, Corvinus University of Budapest, Hungary
2
with favorable climatic conditions for agricultural production, a total amount of about US$11billion is
spent annually by Nigeria on importation of rice, wheat, sugar and fish (from a statement by the
Minister of Agriculture-Dr. Akinwumi Adesina). These are commodities which could have been easily
produced in the country, but are been sourced from without due to failure of past and present policies
to appropriately identify and address impediments to the development of the various sub-sectors and
the agricultural sector as a whole.
Although treated with benign neglect prior to independence by virtue of its self-sufficiency, rice has
become a strategic commodity in Nigeria attracting much attention due to its increasing role in the diet
of the populace and its drainage of foreign exchange through imports. Rice which use to be classified
as a luxury food item prior to the country’s independence, now holds the status of a staple taking the
place of cassava and yam among others (Daramola, 2005). The consumption of rice in spite of
increasing prices induced through high tariff imposition has been on the rise since the year 1977 when
the country observed close to a tripling of per capita consumption of rice (kg/yr) over that for the
immediate preceding year. Production has however failed to catch up with the increasing demand for
rice, leading to widening of the gap between domestic production and demand since the mid-1990s,
making Nigeria a net importer in the process.
Attempts by previous regimes to reverse the situation attracted the use of various trade policy
measures ranging from tariff imposition, quantitative restriction on imports through the use of quota,
to outright ban on imported rice. In spite of all past and present efforts to revive the local rice industry,
Nigeria is still observed as one of the leading importers of rice in the world (although the leading
producer in West Africa) and the supply-demand gap continues to widen. Among the suggested
impediments by various researchers to achievement of the goals of such policy measures are low
productivity of farmers’ fields (WARDA, 2003), scarcity of labor (due to rural-urban migration) and
high cost of inputs, inconsistent government policies on rice import (ban, unban, tariff) (which have
led to major drifting of farmers from the rice sub-sector) and rent-seeking attitude of government
officials and their agents in the distribution/sale of fertilizer and other inputs (Daramola, 2005). With
USDA data showing improvements in acreage cultivated of rice, but a declining trend for yield, as
well as lagging of output behind demand, this study is purposed on identifying the long-run and short-
run magnitudes and effects of key determinants of output supply and yield response of rice in Nigeria,
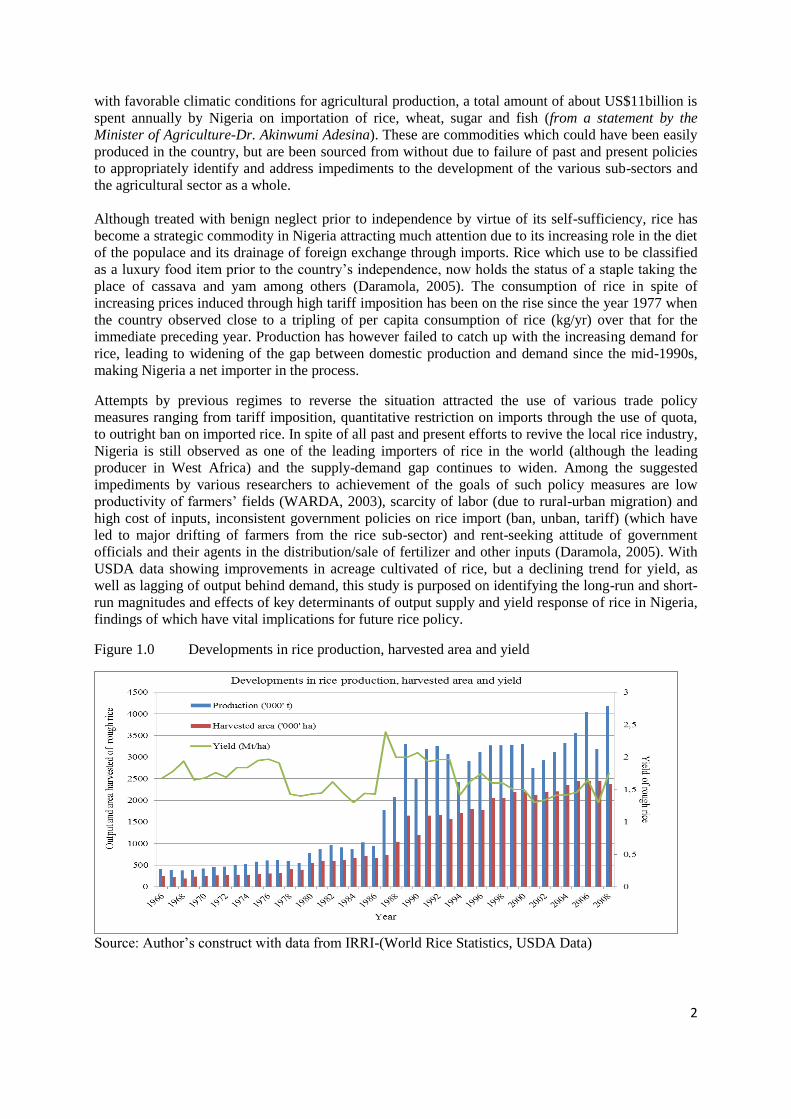
findings of which have vital implications for future rice policy.
Figure 1.0 Developments in rice production, harvested area and yield
Source: Author’s construct with data from IRRI-(World Rice Statistics, USDA Data)

3
Figure 2.0 Performance in rice supply for Nigeria Country
Source: Author’s construct with data from IRRI- (World Rice Statistics, USDA Data)
1.1 RICE POLICY AND GOVERNMENT ASSISTANCE
Rice policy of Nigeria has primarily place emphasis on increasing domestic production and achieving
self-sufficiency in rice (although yet to materialize). Measures to help achieve these goals have been in
the form of subsidies to producers and consumers and tariffs, quantitative restrictions (quota) and
outright ban on imports. According to Akande (2002), rice policies and acts in Nigeria can be
discussed under three period, namely the “Pre-ban” period (1971-1985), the “Ban” period (1986-1995)
and the “Post-ban” period (1995-date).
Pre-ban Period (1971-1985)
This period is sub-categorized into “Pre-crisis” period (1971-1980) and “Crisis” period (1981-1985).
The “Pre-crisis” period is characterized by liberal policies on rice import with ad-hoc policies been
applied in times of interim shortages. This period marked the launching of various programmes and
projects aimed at developing rice production, namely the “national accelerated food production” of
1972 , “operation feed the nation in 1976”, with the research station been established in 1970 and
later transformed into the National Cereal Research Institute in 1974 with a primary aim of providing
farmers with high yielding varieties .With increasing imports and subsequent drainage of foreign
exchange due to liberalization of trade in this period, tariffs on imports were increased, but fluctuated
between 66% in 1974 and 19% in 1979 due to the inconsistent nature of the then trade policy.
During the crisis period, more stringent policies (including Agricultural Input Subsidy Policy, Input
Supply and Distribution Policy, Water Resources and Irrigation Policies and Agricultural
Cooperatives Policy) were applied. During this period import licenses were restricted to few
individuals, and a presidential task force was established to issue allocation to customers and traders.
Government policies artificially lowered domestic rice and fertilizer prices relative to the world
price, through massive importation of rice resulting in low price of locally produced rice (Emodi and
Madukwe (2008)). In addition, government became involved in rice importation, distribution and its
marketing with non-transfer of actual costs to consumers. Elite consumers were protected at the
expense of farmers, leading to depressed farm gate prices. This led to a subsequent loss in
competitiveness of local rice production and through disincentive effect led to drifting-out of some
farmers from rice production.
4
Ban Period (1986-1995)
During this period, importation of rice was regarded illegal. Under the Auspices of the World Bank,
State and Federal Governments, the Agricultural Development Project as one of the packages of the
Structural Adjustment Program (SAP) was initiated with the aim of providing infrastructure and farm
inputs in the rural areas. The Nigerian Agricultural and Corporative Bank was consequently set up to
provide credit facilities. The ban on rice import was removed in 1995 and replaced with 100% tariff
on rice import. This rate was however reduced by half (50%) in the following year and increased
again in 2001 to 85% (Lançon and David-Benz (2007)). The tariff imposed on imports fluctuated
between 100% and 110% between the years 2003 and 2006, but was relaxed to 0% in 2007 due to the
global commodity crisis.
Post-ban Period (1995-date)
Quantitative restrictions on rice imports were lifted and Nigeria adopted a more liberal trade policy
on rice. The year 2004 marked the introduction of the presidential initiative on rice to address the
widening demand-supply gap and aid in attainment of self-sufficiency in rice production. This was
followed up with the National Rice Development Strategy in 2009 aimed at doubling rice production
in Nigeria and increasing land area under rice cultivation. The Government of Nigerian , according to
Rondon and Nzeka (2013) introduced a new tariff for rice (effective July 1, 2012) which brought a
30% levy on imported brown rice and a 50% levy on imported milled/polished rice with a 100% levy
(effective December 31,2013) been later on applied. Import bans on rice, sugar and fertilizer,
according to Rondon and Nzeka (2013) are expected by the year 2015
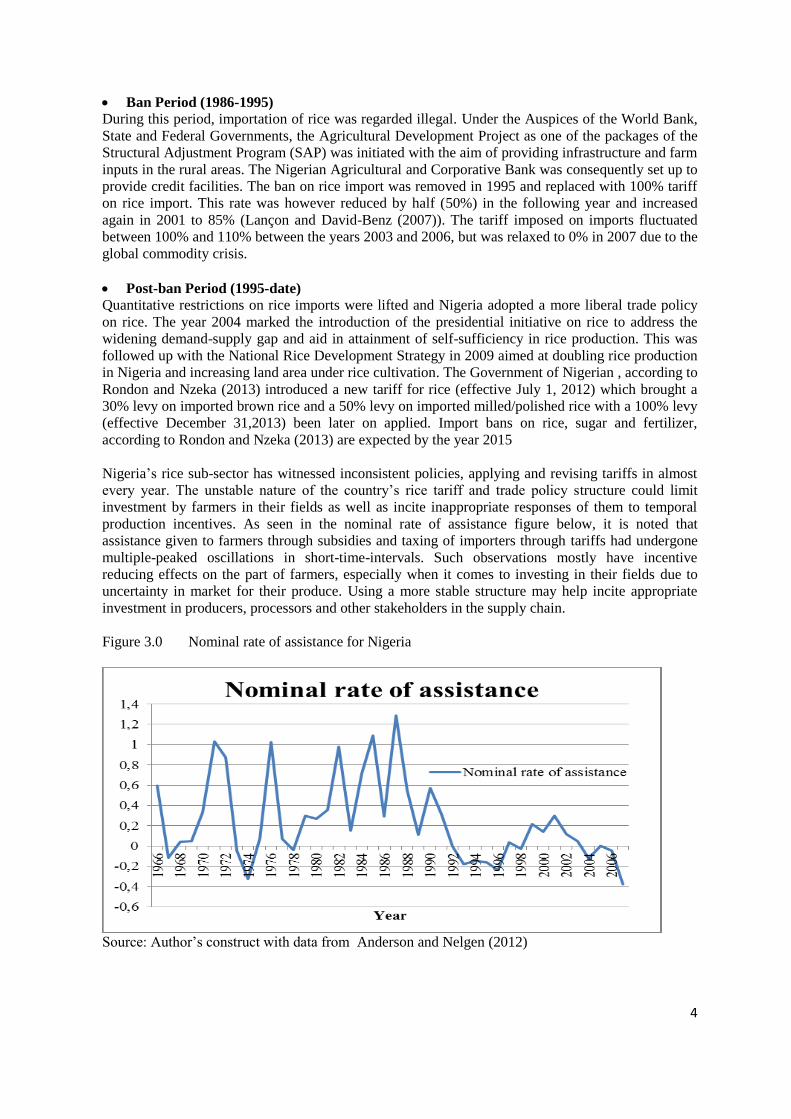
Nigeria’s rice sub-sector has witnessed inconsistent policies, applying and revising tariffs in almost
every year. The unstable nature of the country’s rice tariff and trade policy structure could limit
investment by farmers in their fields as well as incite inappropriate responses of them to temporal
production incentives. As seen in the nominal rate of assistance figure below, it is noted that
assistance given to farmers through subsidies and taxing of importers through tariffs had undergone
multiple-peaked oscillations in short-time-intervals. Such observations mostly have incentive
reducing effects on the part of farmers, especially when it comes to investing in their fields due to
uncertainty in market for their produce. Using a more stable structure may help incite appropriate
investment in producers, processors and other stakeholders in the supply chain.
Figure 3.0 Nominal rate of assistance for Nigeria
Source: Author’s construct with data from Anderson and Nelgen (2012)

5
Table 1.0 Nigeria’s Trade Policy on Rice 1974-2003
Period Policy measures
Prior to April 1974 66.6% tariff
April 1974-April 1975 20%
April 1975-April 1978 10%
April 1978-June 1978 20%
June 1978 – October 1978 19%
October 1978-April 1979 Imports in containers under 50kg were banned
April 1979 Imports under restricted license only; Government agencies
September 1979 6 months ban on all rice imports
January 1980 Import license issued for 200,000 tonnes of rice
October 1980 Rice under general import license with no quantitative restrictions
December 1980 Presidential Task Force (PTF) on rice was created with issuing of
allocations to customers and traders been done through the Nigerian
National Supply Company (NNSC)
May 1982 PTF commenced issuing of allocations to customers and traders in
addition to those issued by the NNSC
January 1984 PTF disbanded. Rice importation placed under general license
restrictions
October 1985 Importation of rice (and maize) banned
July 1986 Introduction of SAP and the abolition of Commodity Boards to provide
production incentives to farmers through increased producer prices
1995 100% Tariff
1996 50%
1998 50%
1999 50%
2000 50%
2001 85%
2003 100%
Source: Daramola (2005)
1.2 DEVELOPMENTS IN RICE CONSUMPTION
Rice held a minimal role in the diet of the average Nigerian both in terms of per capita annual
consumption and in terms of contribution to total calorie intake in the 1960’s and early 1970’s. Per
capita consumption of rice during the 1960’s was 2.9kg/yr on average and 4.1kg/yr for the period
1970-1976. Consumption of rice almost tripled between the years 1976 and 1977 as consumption per
capita increased from 3.4kg/yr in the former to 9.3kg/yr in the latter. Consumption of rice has since
then depicted a more or less increasing trend with the year 2009 observing a figure of 20.9kg/yr (an
increase of over 1200% on the figure for the year 1961(1.6kg/yr)). Likewise, the share of rice in total
calorie intake in the country increased from as low as 0.84% to 10.08% in 1989, and gradually
decreased to 7.86% in 2009. This shows that rice is gradually gaining grounds in dietary patterns of
Nigeria and there arises the need therefore to initiate and implement appropriate measures to help meet
both current and future rice needs to ensure food security for all.

6
Figure 4.0 Consumption of rice and share in total calorie supply
Source: Author’s construct with data from IRRI – (World Rice Statistics)
1.3 SOCIO-DEMOGRAPHIC CHARACTERISITCS OF NIGERIA
Located in Coastal West Africa, Nigeria has observed an increase in its population from approximately
47 million people in 1961 to about 167 million people in 2012. This figure by projection of the FAO is
expected to reach approximately 204 million by the year 2020. Currently, a total of about 51% of the
total population live in urban areas, with this ratio anticipated to increase to 56.85% by the year 2020.
Annual population growth in the country is 2.48% on average for the period 1962-2011. Per capita
income as measured by GDP per capita (in current US$) has increased form US$102.42 in 1962 to
US$1501.72 (World Bank: Development indicators). With these four indicators been confirmed in
past studies as being major drivers of rice consumption, increases observed in them and projections on
them signal likely increases in future rice consumption and the necessity to be on alert.
1.4 DEVELOPMENTS IN IMPORTATION OF RICE
With Nigeria being virtually self-sufficient in rice in the 1960’s and early 1970’s (1970-1974),
imported rice did play an insignificant role in total rice supply and consumption in the country. The
quantity imported was on average 1100 Mt for the 1960s and 5800 tonnes for the period 1970-1974.
Import of rice however picked a pace from the year 1976 with an import quantity of 446,000 Mt.
Figure 5.0 Developments in rice imports
Source: Author’s construct with data from IRRI – (World Rice Statistics, USDA data)

7
The quantities of rice imported into the country between then and the ban period were shaped by the
level of tariff and quantitative restrictions imposed. It however has since the post-ban period depicted
an increasing trend, increasing from 350,000 Mt in 1995 to 2,250,000Mt in the year 2012
1.5 DEVELOPMENT IN RICE YIELDS
With land area for crop production in major agricultural food crop producing countries been gradually
exhausted, concerted efforts are been put in place to increase productivity of current fields to enhance
sustainability. A challenge faced by most countries in Africa, especially West African countries, is low
productivity of farmers’ fields. Although blessed with vast land area, the production of most food
crops lags well behind demand as a result of low productivity of current fields. In as much as some
major countries noted in world trade have observed improvements in yield of paddy rice, Nigeria on
the contrary has not witnessed any significant improvement in rice yield. With yields in countries like
Egypt increasing from an average of 5.143 for the period 1960-1969 to 9.809 for the period 2000-
2009, yields in Nigeria decreased from 1.820 to 1.519 for the respective periods. As is observed from
the table below, almost all the countries (except Egypt, Indonesia and Vietnam) have observed yields
below the average for the world. This signals that the problem of low productivity is more or less a
general one and needs addressing to ensure continuous supply of adequate amounts of rice in the near
future
Table 2.0 Global rough rice yields (Mt/ha)
1960-1669 1970-1979 1980-1989 1990-1999 2000-2009
World 2.057 2.474 3.144 3.692 4.016
Nigeria 1.820 1.747 1.651 1.742 1.519
Côte d’Ivoire 0.985 1.172 1.162 1.202 1.838
Ghana 1.171 1.009 1.037 1.913 2.165
Egypt 5.143 5.324 5.803 8.010 9.809
Indonesia 2.076 2.652 3.965 4.346 4.617
Pakistan 1.562 2.318 2.466 2.658 3.165
Thailand 1.749 1.851 2.009 2.282 2.683
Vietnam 1.925 2.115 2.732 3.675 4.709
Source: Calculated by Author with data from IRRI- (World Rice Statistics, USDA data)
1.6. CONSTRAINTS TO THE DEVELOPMENT OF RICE PRODUCTION
Development of the local rice production industry in Nigeria is been reported by Daramola (2005) to
be inhibited by several factors including high cost of inputs like credit, imported equipment and
agrochemicals due to taxes, high transportation costs, absence of extension advice, low mechanization
of rice farms, scarcity of labor due to alternative (and more remunerative) off-farm employment
opportunities and due to rural-urban migration, land tenure system (which mostly limit size of
holdings and investment in land improvement), high cost of land preparation and the broad use of
genetically inferior (unimproved) varieties that exhibit low productivity. Due to the high cost of
fertilizer and other vital inputs of production in the country, most farmers do not use them in their
cropping and those who use them use inadequate amounts resulting in sub-optimal yields and retarded
outputs.
In addition, inconsistent government policies (ban, unban, tariff) by virtue of the trade policy
structure of the country (on rice) makes decision-making and planning quite uncertain and limits
investment towards the development of rice fields due to the associated risk in doing so. There have

8
been extreme oscillations in government support since the year 1974. The country and most
importantly farmers have observed government support ranging from over 100% tariff imposition on
rice imports to complete abandonment of levies (eg. in 2007), with some years recording complete
bans on imports. Any of such decisions have incenting and depressing effects on farmers and
influences their production decisions. For example, the engagement of the government in importation
of rice in the crisis phase of the “Pre-ban” period of 1971-1985 coupled with the artificially low
induced farm gate prices led to drifting-out of most farmers from the rice production sub-sector.
Measures to ensure development and sustainable production of rice in the country could do well to
ensure a more stable policy on rice in order to incite appropriate investment and ensure appropriate
response of farmers to production incentives.
2.0 MODEL SPECIFICATION AND DATA
The current study analyzes the response of two dimensions of supply, namely output and yield in order
to inform future policy decisions in Nigeria. Output and yield responses of rice for Nigeria are
estimated based on the following equation:
Output response:
PRODt = f (HAt, PPRt, PPMt, (WPRt/PPRt), (WPCORNt/PPMt), WPUt, NRAt, ALt, IRAt, ut)
Yield response:
YLDt = f (HAt, PPRt, PPMt, (WPRt/PPRt), (WPCORNt/PPMt), WPUt, NRAt, ALt, IRAt, ut)
Where
PRODt - Output of rough rice (“000” tonnes)
YLDt - Yield of rough rice (Mt/ha)
HAt -Harvested area of rough rice (“000” ha)
PPRt - Producer price of rice (LCU –Naira)
PPMt -Producer price of maize (LCU –Naira)
(WPRt/PPRt) -World price of rice to local producer price of rice ratio
(WPCORNt/PPMt) -World price of corn to local producer price of maize ratio
WPUt -Price of urea (World price as proxy, US$/t fob)
NRAt -Nominal Rate of Assistance (%)
ALt -Availability of labor (agricultural labor force as proxy, (“000”) persons
IRAt -Irrigated area (irrigated agricultural area as proxy (“000”)
ut -Stochastic error term assumed to be iidN(0Σ)
Data (1966-2008) on all the variables were collected from the IRRI website (World Rice Statistics)
and the agricultural production database of the FAO (FAOSTAT). Prior to estimation of the long- and
short-run output and yield responses to changes in the explanatory variables, the entire data set (with
variables in log except nominal rate of assistance) was verified using the Phillips-Perron unit root test
(Intercept and trend at level, intercept at first difference). Verification of the data set is done to
ascertain the order of integration of the individual series as this is a vital step in the data generation
process and in the choice of estimator. Below are the results on the unit root test and on the estimates.

9
3.0 RESULTS
Table 3.0 Unit root test of variables (Phillips-Perron test)
Variables PP-statistic at level B-Width PP-statistic at first diff B-Width
PROD -1.881835 1 -7.709820*** 3
YLD -3.454784 2 -8.821129*** 4
HA -1.906702 3 -7.933040*** 1
PPR -1.918424 3 -5.737274*** 3
PPM -2.476937 0 -7.302607*** 3
(WPRt/PPRt) -1.784237 1 -4.345723*** 5
(WPCORNt/PPMt) -2.002283 0 -6.415429*** 0
WPU -2.074537 3 -4.827174*** 12
NRA -4.518657*** 2 15.24227*** 16
AL -2.057741 2 -6.278252*** 2
IRA -1.522528 1 -4.822190*** 1
Critical value -3.520787 -2.935001
NB: 95 percent confidence level for critical value, ***1%, **5%
Result of the test shows that all the variables excluding the nominal rate of assistance (NRA) are non-
stationary at level but become stationary on first difference at the 1% level. Nominal rate of assistance
was found stationary at level at the 1% significance level.
3.1 OUTPUT RESPONSE OF RICE
To ensure reliability of estimates for the output response of rice, diagnostic tests for serial correlation
in the residual series, normality, structural stability (through CUSUM and CUSUM of Squares tests)
and misspecification of the function through a Reset test were applied to both the long and short-run
estimates. Results of the test show that the function is appropriately specified, the estimates are stable
and the residual series is normally distributed, homoscedastic and free from serial correlation.
Table 4.0 Long-run and short-run estimates of output response of rice
Short-run Long-run
Variables Coefficients t-statistic Coefficients t-statistic
∆ lnPRODt-1 -0.168484 -1.303466
ln HAt 0.736453 5.290863***
∆ ln HAt 0.842487 5.300499***
ln PPRt 0.611092 4.742443***
∆ ln PPRt 0.623112 4.874308***
ln PPMt -0.461451 -3.716858***
∆ ln PPMt -0.273731 -1.860175*
ln (WPRt/PPRt) 0.159896 1.292689
∆ln (WPRt/PPRt) 0.105559 0.917795
ln (WPCORNt/PPMt) -0.208028 -1.626404
∆ln (WPCORNt/PPMt) -0.026441 -0.205072
ln WPUt 0.137540 1.450718
∆ ln WPUt 0.053123 0.639326
NRA 0.089686 1.892968* 0.144147 2.599466**
ln ALt 0.851923 1.846444*
∆ ln ALt 1.380126 1.999156*
ln IRAt -1.101571 -2.509476**
∆ ln IRAt -0.893554 -1.119584

10
Intercept -0.031947 -1.298866 -2.167512 -0.415111
RESIDUAL (-1) -0.915457 -3.563153***
Adj R2 0.634252 0.986189
D-W stat 1.996335 1.863880
F-statistic 7.305894 334.2208
Prob(F-statistic) 0.000008 0.000000
Log Likelihood 42.18573 43.03574
Akaike info criterion -1.472475 -1.536546
Schwarz criterion -0.970941 -1.126964
Hannan-Quinn criter. -1.289844 -1.385505
Mean dependent var 0.057778 7.225489
S.E. of regression 0.102826 0.101528
Figure 6.0 CUSUM and CUSUM of Squares Tests
Long-run
-15
-10
-5
0
5
10
15
1992 1994 1996 1998 2000 2002 2004 2006 2008
CUSUM 5% Significance
-0.4
0.0
0.4
0.8
1.2
1.6
1992 1994 1996 1998 2000 2002 2004 2006 2008
CUSUM of Squares 5% Significance Short-run
-15
-10
-5
0
5
10
15
1992 1994 1996 1998 2000 2002 2004 2006 2008
CUSUM 5% Significance
-0.4
0.0
0.4
0.8
1.2
1.6
1992 1994 1996 1998 2000 2002 2004 2006 2008
CUSUM of Squares 5% Significance
Table 5.0 Diagnostic Tests
Short-run estimates Long-run estimates
Jarque-Bera 1.322651(0.516167) 0.069349 (0.9659)
B-G LM (1) 0.257621(0.6157) 0.109816 (0.7425)
(-2) 0.155513(0.8567) 0.085631 (0.9181)
Q-stat (-1) 0.1447(0.704) 0.1101 (0.740)
(-2) 0.1780(0.918) 0.1484 (0.928)
ARCH Test (1) 0.207499(0.6513) 0.672691(0.4170)
Reset test 3. 41200(0.075) 1.986670 (0.1683)
In interpreting the results, harvested area of rice has respective long-run and short-run coefficients of
0.736 and 0.842, implying that, a 1% increase in area cultivated of rice leads to increases of 0.736%
and 0.842% in output in the long-run and short-run respectively. Each of these effects is
significant at the 1% level. With rice production in Nigeria dominated by small-holder producers and
with land sizes ranging between 1-2 hectares, farmers are unable to exploit any benefit associated with
economies of scale. The small sizes of farms in addition limit the capacity of farmers to mechanize or

11
modernize their production and make efficient use of available labor (which is usually obtain at a high
cost due to alternative off-farm employments which are as well more remunerative) . Increasing area
cultivated of rice, will therefore pave room for farmers to exploit economies of scale and make
optimum use of labor available to them. These benefit would however be realized only on
complementing area expansion with intensification measures to mitigate any adverse effect on yield,
as most fields are reported to be low in fertility due to the high cost of fertilizer and the sub-optimal
use of it by the farmers due to financial constraints among other challenges.
A unit increase in the farm gate price of rice leads to a 0.611% increase in rice output in the long-run,
with an increase of 0.623% expected for the short run. Increasing the farm gate price of rough rice (if
increments are appropriately transmitted) increases the financial base of rice producers and enable
them to effectively meet the cost of vital inputs of production like labor, fertilizer, pesticides, and to
ensure effective coverage of the cost of controlling diseases and weeds, the latter being a major
problem with rice production in most West African countries. A unit increase in the price of maize (a
competitive field crop) leads to decreases of 0.461% in output for the long-run and 0.274% for the
short-run. Increasing the price of a competitive field crop, whiles that of the main crop of interest (rice
in this case) is maintained or decreased could lead to reallocation of resources in favor of maize
production. Such reallocations would result in the obvious significant adverse effect on output.
As a major importing nation of rice, State intervention through support to farmers (captured by the
nominal rate of assistance) is observed to have beneficial effect to producers in both the long-run and
short-run. State intervention in the rice industry for Nigeria has mostly been through the use of
restrictive measures on imports and subsidization of inputs (the latter however is been reported by
Daramola (2005) to have been mostly compromised by government officials and their agents through
rent-seeking on their part). Although observed to have beneficial effect to producers, the nominal rate
of assistance has exhibited multiple extreme oscillations in short-time intervals since the year 1974.
This observation however is not commendable as it has likely limiting effect on investment by farmers
in their fields by virtue of risk and uncertainty of assured future market for their produce on harvest. A
unit increase in nominal rate of assistance is observed to lead to a 0.144% increase in output in the
long run and 0.090% in the short-run, the latter being significant at the 10% level and the former at the
5% level.
With rice production in Nigeria being labor intensive, a unit increase in available farm hands leads to
0.852% increase in output in the long-run and 1.38% in the short-run; both being significant at the
10% level. Increases in labor ensure better and timely undertaking of vital cultural practices like
fertilizer application, weed control and harvesting. Increases in labor also serves indirectly as an
incentive for increasing area under cultivation with hope of getting more hands to help in management
of the field. The negative significant association observed between rice output and irrigated area is
regarded a mixed signal resulting either from wrong choice of proxy (thus, low share of irrigate rice
area in total irrigated area) or from inappropriate response from farmers by virtue of some financial,
structural and biophysical constraints they may be facing. Of the total variations in rice outputs
observed in Nigeria for the long-run, about 98.62% are explained by variables in the output response
model, with a total of about 63.43% been explained by the variables in the short-run. A total of about
91.55% of deviations from the long-run equilibrium are restored in the current period and this
restoration is significant at the 1% level. The combined effect of the variables in the long-run is highly
significant, so is it in the short-run (as reflected by the probability of the F-statistic).
12
3.2 YIELD RESPONSE OF RICE
To ensure reliability of the estimates for the yield response of rice, diagnostic tests for serial
correlation in the residual series, normality, structural stability (through CUSUM and CUSUM of
Squares tests) and misspecification of the function through a Reset test were applied to both the long
and short-run estimates. Results of the test show that the function is appropriately specified, the
estimates are stable and the residual series is normally distributed, homoscedastic and free from serial
correlation.
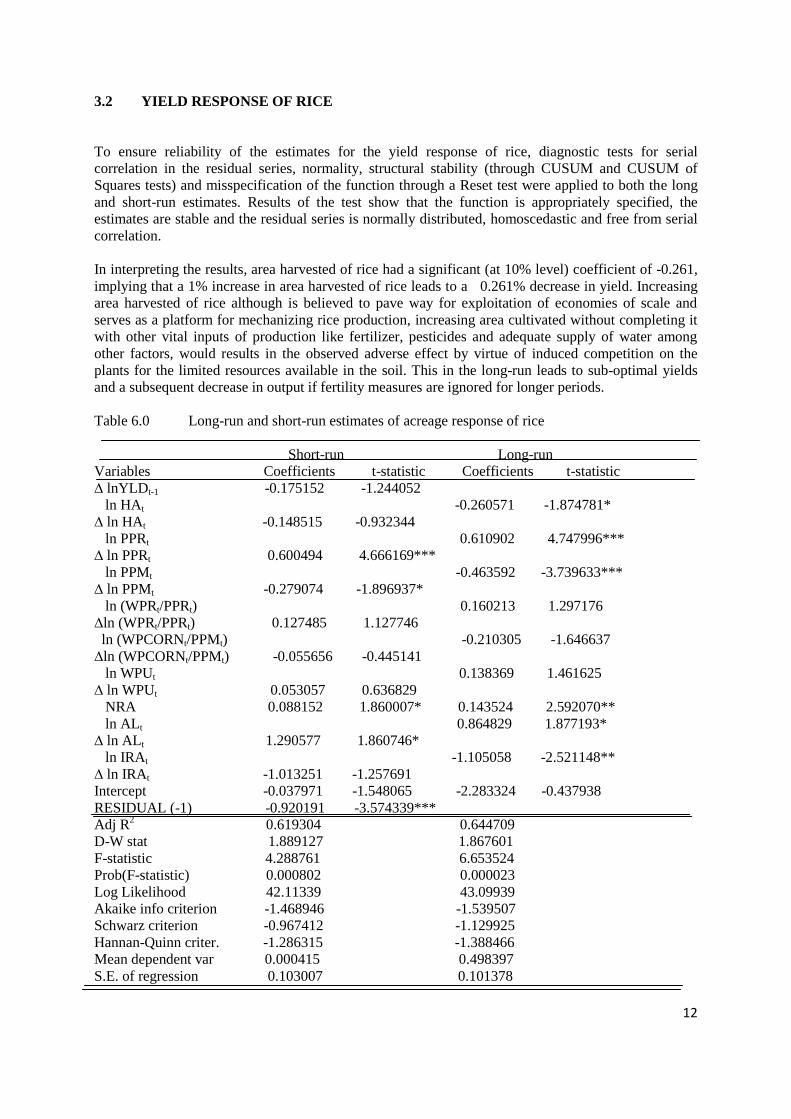
In interpreting the results, area harvested of rice had a significant (at 10% level) coefficient of -0.261,
implying that a 1% increase in area harvested of rice leads to a 0.261% decrease in yield. Increasing
area harvested of rice although is believed to pave way for exploitation of economies of scale and
serves as a platform for mechanizing rice production, increasing area cultivated without completing it
with other vital inputs of production like fertilizer, pesticides and adequate supply of water among
other factors, would results in the observed adverse effect by virtue of induced competition on the
plants for the limited resources available in the soil. This in the long-run leads to sub-optimal yields
and a subsequent decrease in output if fertility measures are ignored for longer periods.
Table 6.0 Long-run and short-run estimates of acreage response of rice
Short-run Long-run
Variables Coefficients t-statistic Coefficients t-statistic
∆ lnYLDt-1 -0.175152 -1.244052
ln HAt -0.260571 -1.874781*
∆ ln HAt -0.148515 -0.932344
ln PPRt 0.610902 4.747996***
∆ ln PPRt 0.600494 4.666169***
ln PPMt -0.463592 -3.739633***
∆ ln PPMt -0.279074 -1.896937*
ln (WPRt/PPRt) 0.160213 1.297176
∆ln (WPRt/PPRt) 0.127485 1.127746
ln (WPCORNt/PPMt) -0.210305 -1.646637
∆ln (WPCORNt/PPMt) -0.055656 -0.445141
ln WPUt 0.138369 1.461625
∆ ln WPUt 0.053057 0.636829
NRA 0.088152 1.860007* 0.143524 2.592070**
ln ALt 0.864829 1.877193*
∆ ln ALt 1.290577 1.860746*
ln IRAt -1.105058 -2.521148**
∆ ln IRAt -1.013251 -1.257691
Intercept -0.037971 -1.548065 -2.283324 -0.437938
RESIDUAL (-1) -0.920191 -3.574339***
Adj R2 0.619304 0.644709
D-W stat 1.889127 1.867601
F-statistic 4.288761 6.653524
Prob(F-statistic) 0.000802 0.000023
Log Likelihood 42.11339 43.09939
Akaike info criterion -1.468946 -1.539507
Schwarz criterion -0.967412 -1.129925
Hannan-Quinn criter. -1.286315 -1.388466
Mean dependent var 0.000415 0.498397
S.E. of regression 0.103007 0.101378

13
Figure 7.0 CUSUM and CUSUM of Squares Tests
Long-run
-15
-10
-5
0
5
10
15
1992 1994 1996 1998 2000 2002 2004 2006 2008
CUSUM 5% Significance
-0.4
0.0
0.4
0.8
1.2
1.6
1992 1994 1996 1998 2000 2002 2004 2006 2008
CUSUM of Squares 5% Significance Short-run
-15
-10
-5
0
5
10
15
1992 1994 1996 1998 2000 2002 2004 2006 2008
CUSUM 5% Significance
-0.4
0.0
0.4
0.8
1.2
1.6
1992 1994 1996 1998 2000 2002 2004 2006 2008
CUSUM of Squares 5% Significance
Table 7.0 Diagnostic Tests
Short-run estimates Long-run estimates
Jarque-Bera 0.561026(0.755385) 0.090964(0.955537)
B-G LM (1) 0.015104(0.9031) 0.103704(0.7495)
(-2) 0.008034(0.9920) 0.079672(0.9236)
Q-stat (-1) 0.0066(0.936) 0.1045 (0.746)
(-2) 0.0077(0.996) 0.1391(0.933)
ARCH Test (1) 0.687033(0.4124) 0.721966 (0.4006)
Reset test 0.481408(0.4935) 0.988814(0.3275)
Producer price of rice has associated respective long-run and short-run coefficients of 0.611 and 0.600,
implying that a unit increase in the producer price of rice leads to a 0.611% increase in yield in the
long-run and 0.600% in the short-run. With cost of vital inputs in the country reported to be high,
increasing the farm gate price of rice, increases the financial base of rice farmers as well as their
purchasing power. This ensures relatively effective covering and meeting of the cost of vital inputs of
production. Yield of rice however decreases by 0.464% in the long-run and 0.248% in the short-run
for a unit increase in the price of maize. This observation is attributed to influences from resource re-
allocation in favor of maize production in times of increasing prices for maize and stagnation or
decline in that for rice. As rational beings and risk averse by nature, farmers always go in for the most
promising choice when faced with a dilemma, choosing maize production over rice in this case.
Increasing government support to farmers (nominal rate of assistance) is observed to have beneficial
effects on yield of rice in Nigeria. Through subsidization of inputs financed with government revenue
from imposed tariffs on imports, the cost of production may be lowered (based on the effective rate of
protection). If cost is truly lowered, it enables farmers to access adequate amounts of such vital inputs
of production for cropping. Ability of farmers to access and properly use sufficient amounts of vital
subsidized inputs of production, would lead to the obvious significant positive effects on yield. A unit
increase in the nominal rate of assistance leads to a 0.144% increase in yield in the long-run and
14
0.088% in the short run. A unit increase in available farm hands leads to a 0.865% increase in yield in
the long-run and 1.291% in the short-run. Increase in the number of hands on the field ensures timely
undertaking of some vital cultural practices necessary for ensuring optimum yields. These include
weed control, fertilizer application, disease and pest control and timely harvesting of paddy to
minimize losses. Once again, a mixed signal was observed for the effect of irrigated area on yield.
Of the total long-run variations observed in yield of rice in Nigeria, about 64.47% are explained by the
variables in the yield response model, with about 61.93% been explained in the short-run. A total of
about 92.02% of deviations from the long-run equilibrium are restored in current period and this
restoration is significant at the 1% level. The combined effect of the variables in the long-run is highly
significant, so is it in the short-run (reflected by the probability of the F-statistic)
4.0 CONCLUSION AND RECOMMENDATIONS
Hindered by inconsistent government policies, improper production methods, high cost and scarcity of
vital inputs of production among other constraints, the local rice industry of Nigeria has failed to catch
up with the increasing pace of consumption. With the rate of consumption increasing at a much faster
rate since the year 1977 as against the relatively lagging nature of production, Nigerian government
resorted to importation of increasing quantities of rice to bridge the supply gap, making Nigeria a net
importer in the process. Attempts by previous regimes and current government to reverse the situation
have proven futile as the supply-gap continues to widen. Among measures used in such attempts are
high tariff impositions on imports, use of quantitative restrictions through quota, outright ban on
imported rice and subsidies on inputs of production. Growth of the local rice industry is suggested to
be impeded by various factors among which are low productivity of farmers’ fields, scarcity of labor,
high cost of inputs, inconsistent government policies and rent-seeking attitude of government officials
and their agents in the distribution and sales of fertilizer and other inputs.
To help inform future rice policy decisions on the way forward, this study analyzed the output supply
and yield response of rice in Nigeria for the period 1966-2008.
Output of rice is observed to increase with increasing harvested area, increasing farm gate price of
rice, increasing nominal rate of assistance and increasing labor availability. In however decreased with
increasing price of maize and with increases in irrigated area, the latter been considered a mixed
signal. Yield of rice is observed to increase with increasing farm gate price of rice, nominal rate of
assistance and availability of labor and decreases with increasing harvested area, price of maize and
irrigated area, the latter been considered once again as a mixed signal. To improve upon its rice
production, it is advised that policies measures be devised to coupled area expansion with
intensification to help mitigate the adverse effect of area expansion on yield, reduce labor shortage
through appropriate investment in development of the rural communities (to help minimize rural-urban
migration), ensure continuous government support to the sector, maintain fair prices for the local rice
farmers and ensure appropriate transmission in times of price increments.

15
REFERENCES
Akande, T. (2002). An overview of the Nigerian Rice Economy, NISER Monograph series No.11. Nigerian
Institute of Social and Economic Research (NISER) Ibadan
Anderson, K. and Nelgen, S. (2012). Updated National and Global Agricultural Trade and Welfare Reduction
Indexes, 1955 to 2010. Spreadsheet at www.worldbank.org/agdistortions. World Bank, Washington DC, March
Daramola, B. (2005). Government Policies and Competitiveness of Nigerian Rice Economy. Paper presented at
the ‘Workshop on Rice Policy & Food Security in Sub-Saharan Africa’ Organized by WARDA, Cotonou,
Republic of Benin, November 07-09, 2005
Emodi, I.A. and Madukwe, M.C. (2008). A Review of Policies, Acts and Initiatives in Rice innovation systems
in Nigeria. Journal of Agricultural Extension Vol.12(2) December, 2008
FAOSTAT. Agricultural Production Database. Food and Agriculture Organization of the United Nations.
http://faostat.fao.org/site/703/default.aspx#ancor
International Rice Research Institute, IRRI. World Rice Statistics: http://ricestat.irri.org:8080/wrs/
Lançon, F., and David-Benz, H. (2007): Rice Imports in West Africa: Trade Regimes and Food policy
formulation. Pro-poor development in Low Income Countries. Food, Agriculture, Trade and Environment
Rondon, M. and Nzeka, U (2013). Nigeria Begins New Rice Levy Increase; Announces Ban. Global
Agricultural Information Network (GAIN), USDA Foreign Agricultural Service. January 28, 2013
WARDA (2003): The Nigerian Rice Economy in a Competitive World: Constraints, opportunities, and Strategic
Choices. Strategy for rice sector revitalization in Nigeria 2
2 Corresponding Author: Boansi David ([email protected])
Department of Agricultural Economics and Rural Development, Corvinus University of Budapest, Hungary


![SeedNet India Portal · 11— 35. 36. 37. 38. 39. 41. 42. 43. 45. 47. 3(ii)] (2) Rice Rice Rice Rice Rice Rice Rice Green Gram Red Gram Taramira Täramira Rice Rice Maize](https://img.pdfslide.net/doc/110x75/5f97db6345fe5e455963d66a/seednet-india-portal-11a-35-36-37-38-39-41-42-43-45-47-3ii-2-rice.jpg)