Embed Size (px)
Citation preview

MPRAMunich Personal RePEc Archive
What firm characteristics determinewomen’s employment in manufacturing?Evidence from Bangladesh
Salma Ahmed and Simon Feeny and Alberto Posso
Deakin University, RMIT University, RMIT University
7 December 2015
Online at https://mpra.ub.uni-muenchen.de/84492/MPRA Paper No. 84492, posted 22 February 2018 14:19 UTC

1
What firm characteristics determine women’s employment in
manufacturing? Evidence from Bangladesh
Salma Ahmed*, Simon Feeny
†, Alberto Posso
‡
December 2015
Abstract
Purpose – This study investigates the principal determinants of women’s employment in the
manufacturing sector of Bangladesh using a firm-level panel data from the World Bank’s ‘Enterprise
Survey’ for the years 2007, 2011 and 2013. The paper sheds light on the demand-side factors, mainly
firm-level characteristics, which also influence this decision.
Design/methodology/approach - We estimate a fractional logit model to model a dependent variable
that is limited by zero from below and one from above.
Findings - The results indicate that firm size, whether medium or large, and firms’ export-oriented
activities, have an important impact on women’s employment in the manufacturing sector in
Bangladesh. Moreover, we find that women are significantly more likely to work in unskilled-labour
intensive industries within the manufacturing sector.
Research limitations/implications – The research is limited to Bangladesh; however, much of the
evidence presented here has implications that are relevant to policymakers in other developing
countries.
Practical implications – The study identifies factors that affect female employment, that is, where
the main constraints to increase female labour force participation. The study focuses on the demand-
side factors, which has been somewhat neglected in recent years. As such, it has practical policy
implications.
Social implications – Focusing on female employment in Bangladesh also sheds light on the nexus
between labour market opportunities and social change within a country that is characterised by
extreme patriarchy, which has wide-reaching implications.
Keywords Bangladesh, female employment, manufacturing firms
* Corresponding Author. Alfred Deakin Institute for Citizenship and Globalisation, Deakin University, Geelong
Waurn Ponds Campus, VIC 3220, Australia. Email:[email protected] †School of Economics, Finance and Marketing, RMIT University, Melbourne, VIC 3000, Australia. Email:
[email protected]. ‡ School of Economics, Finance and Marketing, RMIT University, Melbourne, VIC 3000, Australia. Email:

2
1. Introduction
On April 24, 2013, Rana Plaza, an eight-storey commercial building in Savar, a sub-district of the
Greater Dhaka Area, Bangladesh, collapsed. The building, owned by the family of a prominent
politician, housed a large number of garment factories that employed approximately 5,000 people, of
whom 1,129 died and 2,515 were seriously injured. In the days that followed this, the deadliest
garment-factory accident in history, garment workers across the industrial areas of Dhaka, Chittagong
and Gazipur rioted (according to a report on the BBC website from May 3, 2013;
http://www.bbc.com/news/world-asia-22394094). However, the uproar did not end in Bangladesh,
with political leaders, NGOs, and religious organisations around the world not only criticising
working conditions in the country, but also criticising multinational garment brands such as Benetton,
Mango, and Walmart for engaging ‘sweatshops’ to manufacture their clothes. In the immediate
aftermath of this tragedy, yet another terrible statistic emerged: more than half of the victims were
women, children and many more who were at nursing facilities in the building (Nelson, 2013).
Labour-intensive manufacturing industries with poor working conditions often spring up in
developing countries when they embark on export-oriented development strategies. Studies using
household-level surveys have shed light on many supply-side reasons–individual, demographic and
household-related–why workers, mainly women, opt to work in industries with poor working
conditions (Kabeer and Mahmud, 2004; Salway et al., 2003), with the literature in the context of
Bangladesh having focused primarily on the garment sector (Amin et al., 1997; Kabeer, 1991; Kabeer
and Mahmud, 2004; Kibria, 1995). However, very little is known about the demand-side factors,
mainly firm-level characteristics, which also influence employment and participation rates,
particularly for women. Fakih and Ghazalian (2015) provide a review of the literature that does exist
on this issue. They show that Bratti et al. (2005), find importance of demand-side and job-related
factors in explaining labour market participation of mothers in Italy and that Buchanan et al. (2010)
also demonstrate that demand-side factors affect female employment and workforce participation
rates. They also document Abe’s (2013) finding that in addition to demand-side factors, supply-side
factors determine female labour force participation rates for the case of Japan. Pissarides et al. (2005)
show that low female employment and workforce participation rates may be able to be explained by
employers’ preferences and characteristics, while Lee et al. (2008) provide a similar explanation for
the low labour force participation rates found among married women in South Korea. Fakih and
Ghazalian (2015) themselves demonstrate that demand-related factors, such as private ownership and
exporting activities, are important predictors of women’s employment in manufacturing firms located
in the Middle East and North Africa (MENA). This paper complements this small existing body of
knowledge by providing a firm-level analysis of female employment in the manufacturing sector of
Bangladesh.

3
Complementing the extant literature with insights into the firm-level determinants of female
employment rates in Bangladesh is important for three reasons. Firstly, as was suggested above,
Bangladesh’s manufacturing employment, catering mainly to women, has had an impressive rate of
growth in recent years. Manufacturing employment grew by 9% per annum over the period 1995–
2009, with female employment in manufacturing exhibiting a growth rate of 6% per annum over the
same period (BBS, 1996, 2011). Secondly, in spite of these impressive growth rates, scholars have
focused only on the determinants of women’s employment within the garment sector (Amin et al.,
1997; Kabeer, 1991; Kabeer and Mahmud, 2004; Kibria, 1995). This is an important omission,
because, although economic liberalisation has been associated with a significant expansion of
women’s paid employment in this sector, there has also been considerable growth in a number of
other manufacturing industries, including food, chemicals and pharmaceuticals. Thirdly, focusing on
female employment in Bangladesh also sheds light on the nexus between labour market opportunities
and social change within a country that is characterised by extreme patriarchy, which has wide-
reaching implications. The analysis in this paper sheds light on these issues using data from the World
Bank’s ‘Enterprise Survey’ for Bangladesh, which is a firm-level panel survey that has recently been
made available publically for the years 2007, 2011 and 2013.
We analyse the demand-side determinants of female employment in the manufacturing sector
using the fractional logit model, which is estimated using the Quasi-Maximum Likelihood Estimator
(QMLE). The paper builds on the work of Fakih and Ghazalian (2015), who analyse the demand-side
determinants of female employment in the MENA manufacturing sector. However, we depart from
the study by Fakih and Ghazalian in two significant ways. First, because we have panel data (more
than one observation for each manufacturing firm), we control for firm fixed effects when estimating
QMLE. This also allows us to control for the various unobservable and time-invariant features of the
firm that tend to be correlated (positively or negatively) with female employment (e.g., Wagner,
2003). Second, we also estimate the fractional logit model using the generalised estimating equation
(GEE) to account for heteroskedasticity and serial correlation in the standard errors within the panel
dataset (Cui, 2007; Papke and Wooldridge, 1996, 2008).1 Indeed, while our empirical results are
robust, they show some notable differences between the GEE and QMLE results.
The remainder of the paper is organised as follows. Section 2 provides a brief overview of
Bangladesh’s social and economic context. Section 3 describes the relevant data and outlines firm-
level characteristics. Section 4 discusses the estimation strategy. Section 5 presents our main findings,
and Section 6 concludes the paper.

4
2. The context of Bangladesh
Bangladesh is part of a region that practices extreme patriarchy. The societies in this part of Asia tend
to be characterised by the practice of female seclusion, patri-lineal principles of descent and
inheritance, patrilocal principles of marriage, and strict patriarchal authority structures within the
family. Restrictions on women’s mobility in the public domain mean that they work either as unpaid
family labour or in forms of paid work that can be carried out within the home. The invisibility of
such work has meant that the female labour participation rates in these regions have tended to be
extremely low. For example, official labour statistics show that women’s share of the total
employment in 1995 was five million (14%), increasing to 16.2 million (30%) by 2009 (BBS, 1996,
2011).
However, like any other form of social relations, patriarchal relationships can be modified,
intensified or transformed over time. While progress on many fronts has been slow, others have seen
remarkable achievements. For instance, the gender disparities in gross enrolment ratios have been
eliminated at the primary school level and reduced at the secondary level. Bangladesh has also
pioneered microcredit programs which lend to millions of women from poor and landless households
on the basis of group-based collateral. These programs have expanded women’s opportunities for self-
employment in rural areas. However, there are still social barriers to women’s participation in paid
work outside the home, and returns to women’s labour in these off-farm activities continue to be low
(Ahmed and Maitra, 2010, 2015; Ahmed and McGillivray, 2015; Asadullah, 2006; Hossain and
Tisdell, 2005; Kabeer, 2001; Kapsos, 2008; Rahman and Khandker, 1994).
As a result, many women migrate to urban areas in search of work, either with their husbands
if they are married, or on their own if they have been widowed, divorced or abandoned. Community-
based constraints are usually less severe in urban areas, resulting in higher rates of female
participation in paid work. These trends are present in the formal manufacturing sector, particularly in
the garment sector and the export processing zones of Bangladesh. Of course, these employment
opportunities were due to a greater export-orientation, which generated considerable employment
opportunities, particularly for women. The share of female employees in total manufacturing
employment in 1995 was 1.3 million (24%), increasing to two million (28%) by 2009 (BBS, 1996,
2011). This not only represents a change in human resources allocation and economic productivity at
the population level, but also has implications for individual and household well-being. However,
women employed in these industries experience poor working conditions because they hold low-
skilled jobs across different manufacturing industries and earn less than men for similar work, in spite
of the anti-discrimination laws enacted in 1972 (Majumder and Zohir 1993, 1994).

5
3. Data and variables
The data used in this study were obtained from the World Bank’s Enterprise Surveys. The surveys
provide the most comprehensive firm-level panel data in emerging markets and developing countries,
and include firm-level characteristics, gendered employment, annual sales, workforce composition,
infrastructure, innovation and technology, business–government relationships, and performance
measures. In Bangladesh, the first wave of the survey was carried out in 2007, while the second and
third waves were conducted in 2011 and 2013, respectively.2 The survey respondents were the
business owners and managers of 120 manufacturing firms that were interviewed in all three rounds,
resulting in 360 observations. Of these firms, 117 are located primarily in the two main cities of
Bangladesh: Dhaka and Chittagong. The manufacturing subsectors that are covered by the data set
include food, textiles and garments, leather, chemicals and pharmaceuticals, electrical, and other
manufacturing. Data were pooled for the three years 2007, 2011 and 2013. After dropping
observations with missing values for the dependant variables and other covariates, we end up with
303 observations. The estimating sample is an unbalanced panel, with an average of 2.9 observations
per firm.3
The dependent variable, female employment in manufacturing, is defined in three different
ways: (1) the fraction of females among all full-time permanent workers; (2) the fraction of females
among all full-time production workers; and (3) the fraction of females among all full-time non-
production workers.4 Our measures are consistent with those of Fakih and Ghazalian (2015), who
analyse female employment in the MENA manufacturing sector.
There are a number of firm-related factors that can determine female employment rates.
Following Lee et al. (2008), the firm size is included using two dummy variables (medium and large
firms), with the reference category being ‘small firms’. Larger firms (i.e., with at least 100
employees) tend to face greater regulatory scrutiny, and therefore might employ a greater proportion
of women in order to comply with gender-equity regulations. At the same time, as noted by Fakih and
Ghazalian (2015), some studies have suggested that larger firms have more unpleasant working
environments because of specialised divisions of labour and an impersonal working environment
which could reduce the female supply of labour for such firms (Masters, 1969; Schmidt and
Zimmermann, 1991). Thus, the direction in which firm size affects female employment is
theoretically ambiguous. The firm’s profit ratio (defined as total profit/total sales), is also included, to
control for firm performance. It is expected that firm performance should increase the demand for
labour, though it is not clear how it will contribute to female employment. Following Fakih and
Ghazalian (2015), firm age is also included in the model.

6
Other firm-level characteristics that may affect female employment in Bangladesh include
whether the owner of the firm is female,5 the number of years of experience of the manager, whether
the firm has a website, and whether it exports its output (Fakih and Ghazalian, 2015). It is natural to
expect that firms with a female presence in ownership may hire more women than men. In addition, a
greater presence of women in ownership in a country may reflect better opportunities for women, and
hence, a greater gender parity in law. The use of a website serves as a proxy for the role of computers
in firm operations (computer usage for business purposes is not measured in the data directly), as
Bresnahan et al. (2002) find that the use of technologies such as computers is complementary to
workplace reorganisation in measuring productivity and the demand for skilled labour. Hence, IT use
may have negative implications for women’s employment than for men’s employment. At the same
time, there are a few studies that suggest that technological change might have a positive effect on
female labour force participation by facilitating communications and the flow of information between
firms and the labour market (e.g., Olivetti, 2006).
Exporting firms tend to hire greater proportions of female workers than non-exporting firms.
One reason for this could be that, in many developing countries, exports are still labour intensive
(relative to non-exports) and less skill-intensive. This is favourable for female employment, as, on
average, women are less educated and skilled, and are more likely to work for lower wages (Barro and
Lee, 2013). Firm ownership, and specifically whether the firm is owned by the government or foreign
owned, is also included. In this case, the reference group is ‘private domestic ownership’. It is
generally hypothesised that government-owned firms tend to employ more female workers than other
firms, since they offer jobs that are considered to be ‘family friendly’ (Hewlett and Rashid, 2010).
Foreign-owned firms also usually employ more female workers than private domestic firms, in order
to take advantage from women’s under-utilised skills (Hewlett and Rashid, 2010). Finally, the firm’s
composition of production workers is also included. Following Fakih and Ghazalian (2015), this
variable is constructed in two ways: the fraction of skilled production workers among total production
workers and the fraction of non-production workers relative to total employment. Importantly, the
fraction of ‘skilled’ production workers must be treated solely as a subjective indicator of skill-
intensity, as it is based on the question ‘At the end of the fiscal year, how many permanent, full-time
individuals working in this establishment were skilled or unskilled?’. Therefore, the skill-intensity
value obtained from this variable may not necessarily reflect the definition of skill-intensive
industries, such as high-end chemical manufacturing, generally used by economists (see Ariff and
Hill, 2011). Furthermore, ‘production workers’ generally refers to workers who are engaged in
fabrication, assembly and related activities, and excludes supervisors, administration staff and sales
staff. That is, production workers can be either skilled or unskilled, within a more general definition.
Nevertheless, the manager’s perception of the firm’s skill-intensity may be a relevant demand-side
factor that could influence the decision to hire more or fewer women.

7
Following convention, we also include industry and time dummies. Industry dummy variables
(with the reference category being textiles/garments) are used to control for unobservable time-
invariant differences across industries (such as in the rate of technological progress), while time
dummy variables are used to control for economy-wide shocks to the labour demand (such as
financial shocks or reforms). We also include a dummy variable for Chittagong city (the commercial
capital of Bangladesh), to control for regional differences in women’s labour force participation.6 The
reference category is ‘Dhaka’. The variations in local labour market conditions play an important role
in women’s labour supply decisions, by providing different structures and opportunities to work in
particular occupations or industries, together with inter-city differences in wage levels.7
Table 1 provides descriptive statistics for the variables described above. These statistics
indicate that 36% of the females in the sample are full-time permanent workers, and 38% of females
are full-time production workers, whereas only 19% of females are employed as full-time non-
production workers over the three surveys. In general, manufacturing firms are larger and more likely
to be export-oriented (55%). The latter finding is consistent with those of Moghadem (2005) for the
MENA region. It is striking that about 96% of the firms are domestically owned, 66% use their own
website, and 41% are owned by women. It is not surprising that 63% of the manufacturing firms in
our sample belong to the textiles/garments industry. Table 2 presents standard multicollinearity tests
to inform our empirical strategy. The Variance Inflation Factor (VIF) scores reported in the table are
small, with averages of 1.43–1.53, indicating that multicollinearity is not a statistical issue in our
data.8 A full list of the variables, along with their definitions, can be found in Appendix Table A1.
[Table 1 about here]
[Table 2 about here]
4. Empirical strategy
In this section, we specify the statistical model that is used to estimate the determinants of female
employment in manufacturing. The fractional nature of the dependent variable necessitates the use of
the fractional logit model proposed by Papke and Wooldridge (1996).9 As was discussed above, our
approach is closely related to that of Fakih and Ghazalian (2015). However, we extend this previous
work in two significant ways. First, exploiting the panel dimension of our data, we estimate our
specification with fixed effect model in order to control for the various unobservable and time-
invariant features of the firm that tend to be correlated with female employment. This is done as
follows:
8
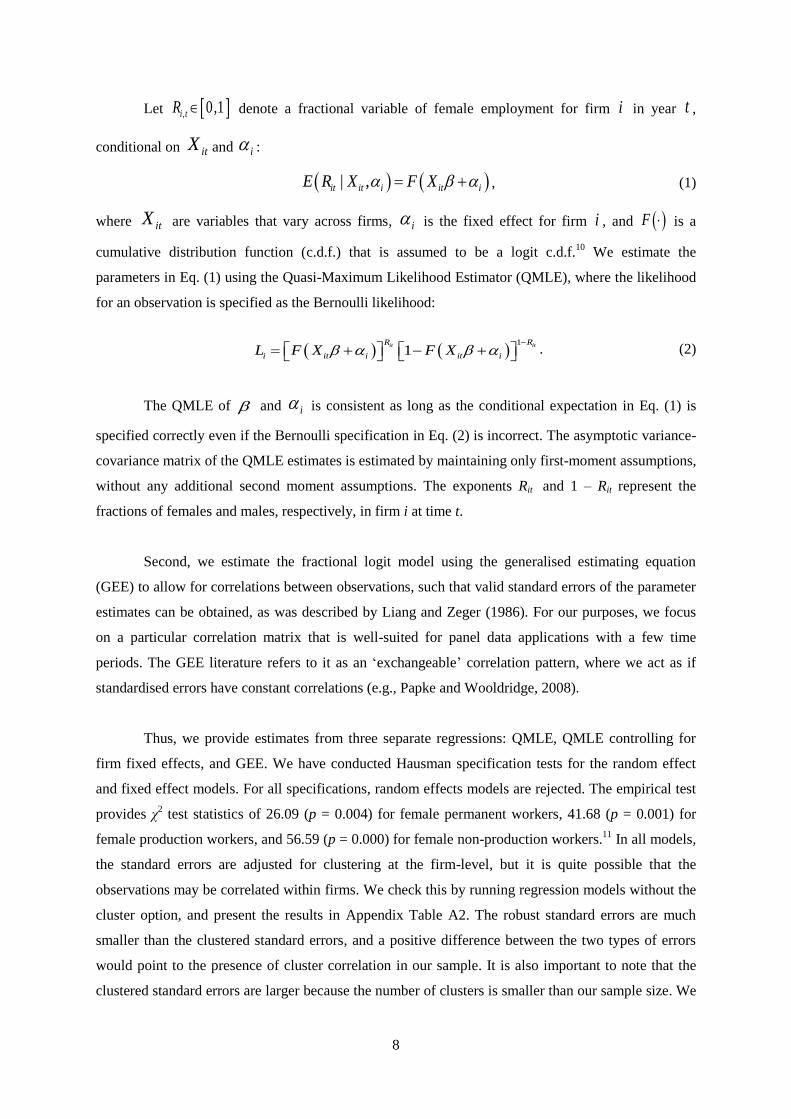
Let , 0,1i tR denote a fractional variable of female employment for firm i in year t ,
conditional on itX and i :
| ,it it i it iE R X F X , (1)
where itX are variables that vary across firms, i is the fixed effect for firm i , and F is a
cumulative distribution function (c.d.f.) that is assumed to be a logit c.d.f.10
We estimate the
parameters in Eq. (1) using the Quasi-Maximum Likelihood Estimator (QMLE), where the likelihood
for an observation is specified as the Bernoulli likelihood:
1
1it itR R
i it i it iL F X F X
. (2)
The QMLE of and i is consistent as long as the conditional expectation in Eq. (1) is
specified correctly even if the Bernoulli specification in Eq. (2) is incorrect. The asymptotic variance-
covariance matrix of the QMLE estimates is estimated by maintaining only first-moment assumptions,
without any additional second moment assumptions. The exponents Rit and 1 – Rit represent the
fractions of females and males, respectively, in firm i at time t.
Second, we estimate the fractional logit model using the generalised estimating equation
(GEE) to allow for correlations between observations, such that valid standard errors of the parameter
estimates can be obtained, as was described by Liang and Zeger (1986). For our purposes, we focus
on a particular correlation matrix that is well-suited for panel data applications with a few time
periods. The GEE literature refers to it as an ‘exchangeable’ correlation pattern, where we act as if
standardised errors have constant correlations (e.g., Papke and Wooldridge, 2008).
Thus, we provide estimates from three separate regressions: QMLE, QMLE controlling for
firm fixed effects, and GEE. We have conducted Hausman specification tests for the random effect
and fixed effect models. For all specifications, random effects models are rejected. The empirical test
provides χ2 test statistics of 26.09 (p = 0.004) for female permanent workers, 41.68 (p = 0.001) for
female production workers, and 56.59 (p = 0.000) for female non-production workers.11
In all models,
the standard errors are adjusted for clustering at the firm-level, but it is quite possible that the
observations may be correlated within firms. We check this by running regression models without the
cluster option, and present the results in Appendix Table A2. The robust standard errors are much
smaller than the clustered standard errors, and a positive difference between the two types of errors
would point to the presence of cluster correlation in our sample. It is also important to note that the
clustered standard errors are larger because the number of clusters is smaller than our sample size. We

9
present the marginal effects of the estimated coefficients at the mean values of the explanatory
variables ( )itX .
However, QMLE estimators may be inconsistent, since the asymptotic properties of fractional
logit models require a balanced panel (Papke and Wooldridge, 2008; Wooldridge, 2010). We could
potentially also treat the data as a pooled cross-section (with appropriate controls for time), but a
Hausman test showed that this approach would give inefficient results. Nevertheless, for completion
Section 5 also discusses the results when fixed effects are not included, but we note that this is not our
preferred specification, because of the Hausman test results.
5. Estimation
This section discusses the estimation results of the specifications explained in the previous section.
Table 3 shows the results for the model that explains the variation in the fraction of female full-time
permanent workers. The results suggest that medium-sized and large firms tend to employ larger
fractions of female permanent workers. This finding is consistent with our previous interpretation of
the firm size variable, but runs counter to the results of Fakih and Ghazalian (2015), who find that, in
MENA’s manufacturing sector, full-time female workers prefer to work in smaller rather than larger
firms. This could be due to factors such as more complex technologies and more unpleasant working
conditions in larger firms.
Interestingly, firms with websites are found to employ a smaller fraction of women (6.3%). A
similar result was found by Fakih and Ghazalian (2015) for manufacturing firms in the MENA region.
One potential explanation is that firms in Bangladesh that adopt IT, such as using websites, tend to
use more skilled labour, and therefore employ a greater proportion of men, who are more likely to be
skilled than their female counterparts.12
There is also evidence suggesting that firms that export a large proportion of their output
employ higher proportions of women. This is likely to be attributable to exports being very unskilled-
labour intensive in Bangladesh. If women are more likely to be less educated and less skilled, they are
more likely to accept lower wages and to find employment with export-intensive firms. This result is
consistent with the findings of previous empirical studies (e.g., Bussmann, 2009; Gaddis and Pieters,
2012; Kabeer and Mahmud, 2004; Moghadam, 2005). Specifically, we find that manufacturing firms
in Bangladesh that are engaged in exporting activities have 14% more female permanent workers than
non-exporting firms.

10
Domestically-owned firms are found to employ higher proportions of women than either
government-owned or foreign-owned firms. This result runs counter to the popularly-held belief that
government-owned and foreign-owned firms tend to employ more women than domestic firms in
developing countries (e.g., Curd et al., 2007; Fakih and Ghazalian, 2015; Siegel et al., 2014). It
suggests that the Bangladeshi government may have a preference for employing men rather than
women, and that foreign-owned firms are more likely to employ more skilled, better educated
workers, which are more likely to be men. For government-owned firms, the impact of economic
liberalisation may be biased towards skilled workers, which, in Bangladesh, are predominantly men.13
In the case of foreign-owned firms, the findings might reflect the fact that foreign firms generally
adopt skill-biased or labour-saving technologies in developing countries, which raises the relative
demand for skilled labour, which is predominantly men in this case (see Feenstra and Hanson, 1995,
for details). This result is consistent with the trends observed in middle-income economies within
Latin America and East Asia (Robbins, 1996).
There is no evidence to suggest that firms owned by women employ greater proportions of
women. This finding does not match our a priori expectations. If women constitute a very small
proportion of firm ownership, this does not seem to contribute to a higher probability of female
employment.14
The coefficients on the industrial sector dummy variables suggest that women are less
likely to be employed in some manufacturing industries than others, with work in the textiles/garment
industry likely to be more common. For instance, women might prefer to stay away from industries
that require night time or physically strenuous work and industries that make it difficult (due to
location or working hours) for women to combine their responsibilities as primary caregivers in the
family with paid employment.
The results from the alternative QMLE and GEE specifications that include firm fixed effects
are presented in Columns (2) and (3) of Table 3. They are generally comparable to those presented in
Column (1), though with a few differences. Specifically, the marginal effects of the medium and large
firm variables on female employment rates remain positive, though they are smaller in magnitude and
not statistically significant for the QMLE estimation (Column (2)). Similarly, the relationship between
exporting firms and female employment rates does not hold after controlling for firm fixed effects in
the QMLE estimation. These findings might suggest that there is a substantial degree of heterogeneity
across manufacturing firms, resulting in lower marginal effects on female employment rates.
[Table 3 about here]
The results relating to the fraction of female full-time production workers are presented in
Table 4, and are broadly consistent with those in Table 3. While fewer coefficient estimates are found

11
to be statistically significant in the model, which explains the fraction of female full-time non-
production workers (Table 5), the results confirm that larger and domestically-owned firms employ
larger proportions of women. This result is in contrast to the findings of Fakih and Ghazalian (2015)
for the MENA region, where foreign-owned manufacturing firms are more likely to employ non-
production female workers than domestic manufacturing firms. Furthermore, firms located in
Chittagong, the commercial capital of Bangladesh, are found to employ a greater proportion of female
non-production workers, which may reflect the structure of the manufacturing sector in this location,
although this result is not statistically significantly different from zero in the QMLE specification that
includes firm fixed effects (Column (2), Table 5).
[Tables 4 and 5 about here]
Overall, the results suggest that, as expected, unskilled-labour intensive industries hire
relatively larger proportions of women. The labour market implications of these findings are that
women in Bangladesh are likely to earn less than men and to work under worse conditions (see
Kabeer and Mahmud, 2004, for details). One possible way to begin to bridge this gap is to promote a
greater equity in educational attainments between men and women. Indeed, while the proportion of
children that finish school has increased significantly, and even though the gap between men and
women has narrowed since the 1950s, progress is still slower in Bangladesh than in other developing
countries (see Figure 1).
[Figure 1 about here]
We have conducted a number of robustness tests on the results obtained. The tests considered
included: (a) dropping the industry and city dummy variables from the analysis; (b) focussing our
analysis on the textiles and garments industry; (c) conducting the analysis separately for the city of
Dhaka; and (d) re-running fractional logit models using firm observations collected in 2013.15
Tables
6, 7, 8 and 9 present the results of the robustness check.
[Table 6 about here]
The marginal effects from estimating an alternative empirical specification that excludes
industry and city dummy variables are displayed in Table 6. They are generally similar to the
corresponding benchmark results presented in Tables 3, 4 and 5, but are mostly larger in magnitude
(i.e., in absolute terms). As with Fakih and Ghazalian (2015), this appears to suggest that the inclusion
of industry and city fixed effects would likely to encapsulate some variations between industries and
cities, leading to lower estimates.16
For example, the marginal effects still suggest that female workers
(i.e., permanent, production and non-production workers) have more of a tendency to be employed in
larger firms; however, the magnitudes of these effects have increased moderately relative to previous

12
estimates. The other notable finding is that the marginal effect of the manager’s experience remains
negative, but becomes statistically significant, unlike the benchmark results.
[Table 7 about here]
Table 7 presents the marginal effects obtained when we restrict ourselves to the
textile/garments industry sample, since it covers the majority of the observations. In line with the
benchmark results, the medium and large textile firms have a greater propensity to employ female
workers (i.e., permanent, production and non-production workers). However, the magnitudes of these
effects are considerably larger than those for the full sample. For example, the marginal effects of
medium and larger firms are positively significant when the outcome variable is female permanent
workers, sitting at about 61%–66% (Column (1)). The corresponding estimates are 63%–65% for
female production workers and 31%–86% for female non-production workers (Columns (4) and (7)).
The marginal effects from the alternative QMLE and GEE empirical specifications that include firm
fixed effects are also reported in Table 7, and remain generally consistent with the benchmark results.
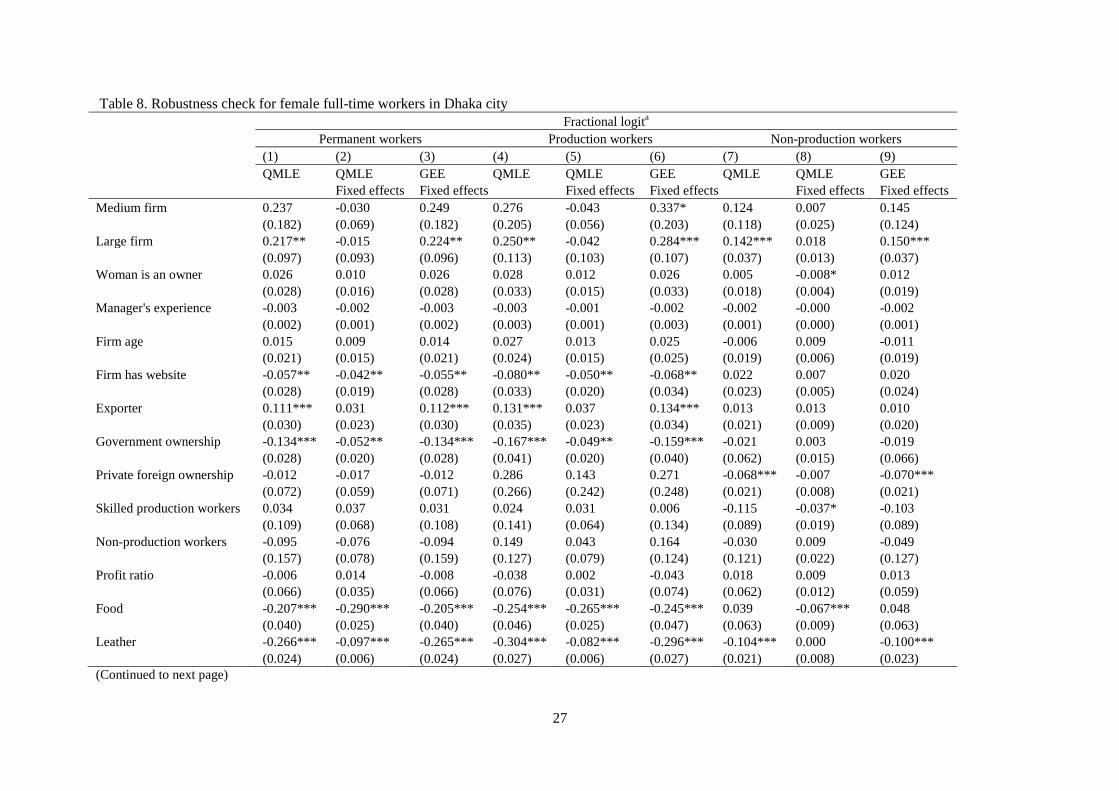
[Table 8 about here]
Table 8 presents the marginal effects obtained when restricting the sample to Dhaka city, the
capital of Bangladesh.17
The marginal effects are found to be qualitatively similar to the benchmark
results, with the one notable change that the co-efficient for female workers becomes statistically
insignificant for medium-sized firms (with one exception). It also decreases in magnitude, but remains
positive in most cases. We also find that, unlike the benchmark estimates, foreign-owned firms do not
have any statistically significant effect on the fractions of female full-time permanent and production
workers.
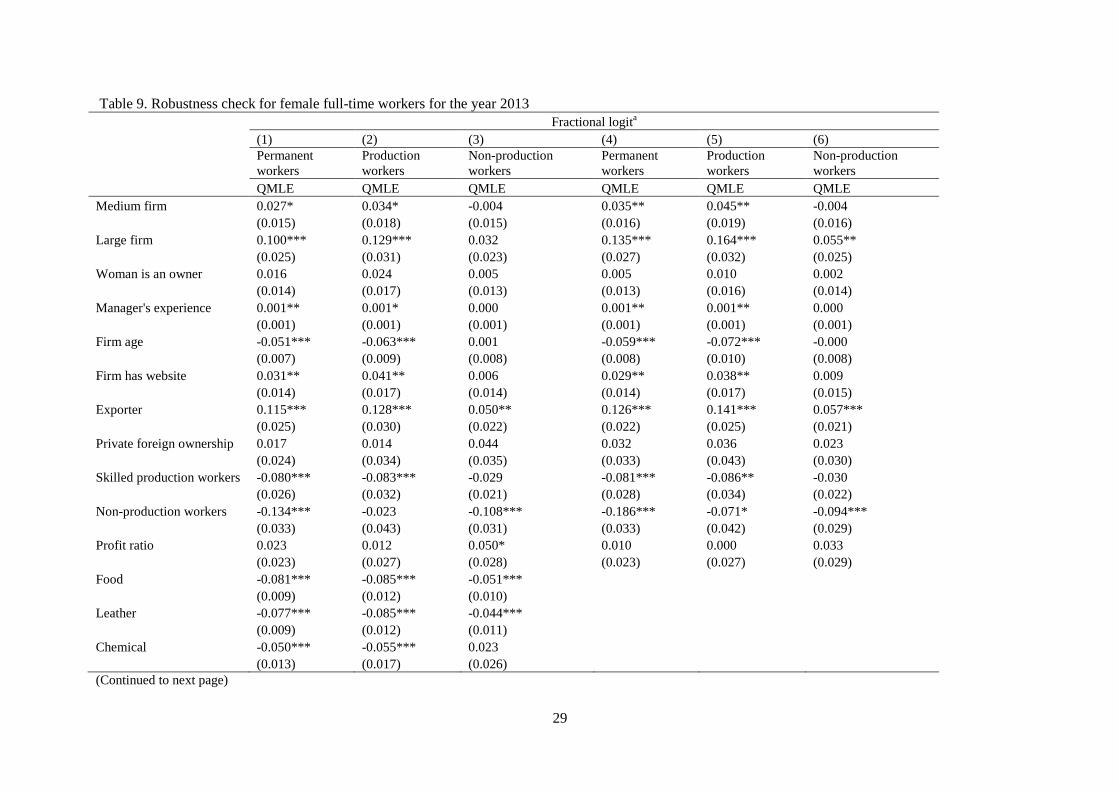
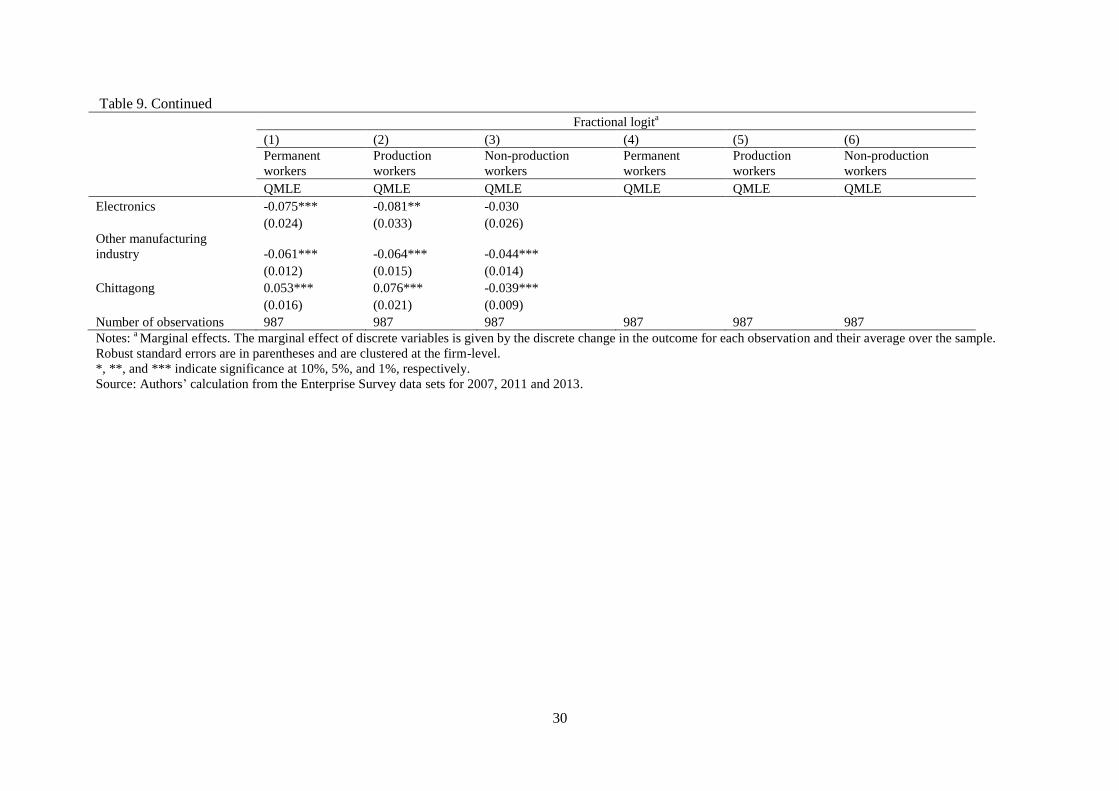
[Table 9 about here]
Finally, we also check the robustness of the results by restricting the data set to data collected
between April and September, 2013.18
Note that this particular survey covers 1442 business
establishments, of which more than 80% are manufacturing firms. After dropping missing values, we
end up with 987 manufacturing firms. The marginal effects of the QMLE estimates are presented in
Table 9. They are generally reminiscent of some earlier findings reported in Column (1) of Tables 3–
5, but show relatively small effects on female employment. We also measure QMLE estimates that
exclude industry and city dummy variables, and report the results in Columns (4)–(6). They are found
to be comparable to the corresponding benchmark results reported in Table 6.

13
6. Conclusion and policy considerations
In recent years, Bangladesh, a country characterised by the practice of extreme patriarchy, has
exhibited an impressive rate of growth in the participation of women in employment, particularly
manufacturing. However, the recent tragedy in Rana Plaza, together with some emerging academic
evidence, suggests that women are generally employed in low-skilled and low-paid industries within
the manufacturing sector. This study sheds light on the demand-side determinants of a greater female
employment in such industries, which existing studies have largely neglected.
The findings presented suggest that firm size, whether medium or large, and firms’ export-
oriented activities, have an important impact on women’s employment in the manufacturing sector in
Bangladesh. However, the results indicate that foreign-owned firms have a lower propensity to
employ female workers. Similarly, we find that manufacturing firms that have a website are also less
likely to employ women. We interpret these findings as suggesting that firms that hire more women
are relatively less skilled-labour intensive than firms that hire more men. These findings imply that
women are more likely to obtain lower wages and to work in poorer conditions, such as sweatshops.
This underlying disparity between men and women stems from the fact that women have less
access to education and skilling-opportunities than men. That is, our analysis of the demand-side
determinants of female employment corroborates previous findings that suggest that supply-side
constraints remain a major problem in Bangladesh. Therefore, the policy implications are that the
promotion of equitable access to schooling for men and women should be continued, in the hope that
this can eventually bridge the gap between labour market outcomes in the country. Social programs
that promote the importance of educational attainments will also be crucial, particularly those geared
at the household-level. Similarly, adult education programs that focus on skilling working-age women
in major industrial areas, such as Dhaka and Chittagong, could also be useful. Finally, affirmative
action programs within government firms, which were found to be less likely to hire women, could
also help to begin promoting the necessary cultural changes. Indeed, our finding that larger firms hire
more women is interpreted as suggesting that firms can respond to greater government scrutiny
regarding equitable employment, meaning that there is no reason to expect that government-owned
firms could not engage in similar practices and still remain profitable.
14
Notes
[1] In general, GEE is an extension of the GLM method. However, unlike the GLM method, which is based on
the maximum likelihood theory of independent observations, the GEE method is based on the quasi-likelihood
theory, and no assumptions are made about the distribution of response observations. As far as the authors are
aware, there is no test available for ascertaining whether one method should be preferred over the other. [2] While the temporal gaps between time periods are not uniform, wave (time) effects are included in the model
to account for any business cycle effects.
[3] As noted by Fakih and Ghazalian (2015), sample attrition is typical in firm-level panel data, and can often
lead to bias results if firms those are dropped-out are systematically different from those that remain in the
sample. In order to test whether this is a problem here, we estimated a model on a balanced panel of 117
manufacturing firms, consisting of 346 observations. The results, which are available upon request, are
qualitatively similar to those presented in this paper. [4] The following quote from the ‘Enterprise Survey’ questionnaire defines permanent and non-production
workers: ‘Permanent, full-time employees are defined as all paid employees that are contracted for a term of one
or more fiscal years with a guaranteed renewal of their employment contract and that work eight or more hours
per day. Non-production workers refers to support staff, such as administrative, technical, IT, cleaning/security
etc., who are not directly employed in the production line of the enterprise’ (ES, 2007, p. 24). [5] As an anonymous referee of this paper noted, female ownership may potentially be an endogenous variable.
We simply verify this by using an instrument for whether the firm manager is female or not, based on the
argument that female owners would be more likely to employ female manager. The relevant test gives strong
credence to our use of the instrumental variable (p = 0.04). However, the exogeneity of the female ownership
variable is not rejected at any reasonable level of significance in all cases. The Hausman test yields test statistics
of 1.44 (p = 0.23) for female permanent workers; 2.49 (p = 0.16) for female production workers; and 2.04 (p =
0.15) for female non-production workers. When a dummy variable is included for female managers as an
additional explanatory variable, it was statistically insignificant, further justifying its use as an instrument.
[6] Chittagong is home to Bangladesh’s export-oriented manufacturing sector, meaning that women have a
greater chance of participating in wage employment, reflecting manufacturing firms’ demand for women’s
labour.
[7] As noted by Fakih and Ghazalian (2015), the inclusion of industry and city dummy variables in a regression
model does not produce identification problems (e.g., the incidental parameters problem) because the sample
size is determined by the number of firms.
[8] The Variance Inflation Factor (VIF) measures the degree of multicollinearity among explanatory variables in
a regression model. A higher VIF score (e.g., over 10) indicates multicollinearity problems.
[9] See Papke and Wooldridge (1996) for more details regarding this approach.
[10] The link test does not reject the logit specification. Furthermore, the use of the normal c.d.f. leads to similar
results.
[11] We compute the Hausman test using the Stata module xtreg.
[12] As with Fakih and Ghazalian (2015), the regressions also conducted with the addition of a binary variable
that equals one for firms that use e-mail as a form of business communication and zero otherwise. The
corresponding results are consistent with the benchmark regression.
[13] The explanation for this depends partly on public sector retrenchment. As a part of broader economic
reform strategies, retrenchment in public firms has been taking place in Bangladesh since the 1990s, which is
more likely to affect women than men because of the reduction in low-skilled and low-paid public sector jobs,
many of which have traditionally been held by women.
[14] Unfortunately, we do not have any data on the proportion of firms owned by females to enable us to
confirm this hypothesis.
[15] We would like to thank an anonymous referee for mentioning these robustness tests.
[16] Indeed, the likelihood ratio (LR) test results suggest that adding industry and city dummy variables to the
model improves the fit of the model significantly compared to a model without these dummies, with the
exception of female non-production workers. In the case of female permanent workers, χ2(6) = 16.19 (p =
0.012), while in the case of female production and non-production workers, the corresponding values are χ2(6) =
19.86 (p = 0.003) and χ2(6) = 8.37 (p = 0.212), respectively.
[17] We have not conducted a separate empirical analysis for Chittagong city, due to the limited number of
observations.
[18] The 2013 data are the most recent available at the time of writing.

15
References
Abe, Y. (2013), "Regional variations in labor force behavior of women in Japan", Japan and the
World Economy, Vol. 28, pp. 112-124.
Ahmed, S. and Maitra, P. (2010), "Gender wage discrimination in rural and urban labour markets of
Bangladesh", Oxford Development Studies, Vol. 38 No. 1, pp. 83-112.
Ahmed, S. and Maitra, P. (2015), "A distributional analysis of the gender wage gap in Bangladesh",
Journal of Development Studies, Vol. 51 No. 11, pp. 1444-1458.
Ahmed, S. and McGillivray, M. (2015), "Human capital, discrimination, and the gender wage gap in
Bangladesh", World Development, Vol. 67 No. 0, pp. 506-524.
Amin, S., Diamond, I., Naved, R. and Newby, M. (1997), "Transition to adulthood of female factory
workers: Some evidence from Bangladesh", Research Division Working Paper 102, Population
Council Research Division, New York.
Ariff, M. and Hill, H. (2011), Export oriented industrialisation: The ASEAN experience, Vol. 49,
Routledge, New York.
Asadullah, M.N. (2006), "Returns to education in Bangladesh", Education Economics, Vol. 14 No. 4,
pp. 453-468.
Barro, R.J. and Lee, J.W. (2013), "A new data set of educational attainment in the world, 1950–2010",
Journal of Development Economics, Vol. 104 No. 0, pp. 184-198.
BBS. (1996), "Report on the Labour Force Survey in Bangladesh", Report for Bangladesh Bureau of
Statistics, Bangladesh Bureau of Statistics, Dhaka.
BBS. (2011), "Report on the Labour Force Survey in Bangladesh", Report for Bangladesh Bureau of
Statistics, Bangladesh Bureau of Statistics, Dhaka.
Bratti, M., Del Bono, E. and Vuri, D. (2005), "New mothers' labour force participation in Italy: The
role of job characteristics", Labour: Review of Labour Economics and Industrial Relations, Vol. 19
No. S1, pp. 79-121.
Bresnahan, T., Brynjolfsson, E. and Hitt, L. (2002), "Information technology, workplace organization,
and the demand for skilled labor: Firm-level evidence", Quarterly Journal of Economics, Vol. 117
No. 1, pp. 339-376.
Buchanan, J., Scott, L., Yu, S., Schutz, H. and Jakubauskas, M. (2010), "Skills demand and
utilisation: An international review of approaches to measurement and policy development", Local
Economic and Employment Development Working Paper No. 2010/04, Organisation for Economic
Cooperation and Development Publishing, Paris, France.

16
Bussmann, M. (2009), "The effect of trade openness on women’s welfare and work life", World
Development, Vol. 37 No. 6, pp. 1027-1038.
Cui, J. (2007), "QIC program and model selection in GEE analyses", Stata Journal, Vol. 7 No. 2, pp.
209-220.
Curd, A., Julian, A., Sabow, A. and Seligman, L. (2007), "The impact of foreign direct investment on
Chinese women", in Dayal-Gulati, A., Finn, M. and Diermeier, D. (Ed.), Global Corporate
Citizenship, Northwestern University Press, Evanston, IL.
ES. (2007), "Enterprise Surveys", International Finance Corporation, World Bank.
Fakih, A. and Ghazalian, P. (2015), "Female employment in MENA’s manufacturing sector: The
implications of firm-related and national factors", Economic Change and Restructuring, Vol. 48 No.
1, pp. 37-69.
Feenstra, R. and Hanson, G. (1995), "Foreign investment, outsourcing and relative wages", National
Bureau of Economic Research Working Paper No. 5121, NBER, Cambridge, MA.
Gaddis, I. and Pieters, J. (2012), "Trade liberalization and female labor force participation: Evidence
from Brazil", IZA Discussion Paper No. 6809, Institute for the Study of Labor, Bonn.
Hewlett, S.A. and Rashid, R. (2010), "The battle for female talent in emerging markets", Harvard
Business Review, Vol. 88 No. 5, pp. 101-106.
Hossain, M. and Tisdell, C. (2005), "Closing the gender gap in Bangladesh: Inequality in education,
employment and earnings?", International Journal of Social Economics, Vol. 32 No. 5, pp. 439-453.
Kabeer, N. (1991), "Cultural dopes or rational fools? Women and labour supply in the Bangladesh
garment industry", European Journal of Development Research, Vol. 3 No. 1, pp. 133-160.
Kabeer, N. (2001), "Conflicts over credit: Re-evaluating the empowerment potential of loans to
women in rural Bangladesh", World Development, Vol. 29 No. 1, pp. 63-84.
Kabeer, N. and Mahmud, S. (2004), "Globalization, gender and poverty: Bangladeshi women workers
in export and local markets", Journal of International Development, Vol. 16 No. 1, pp. 93-109.
Kapsos, S. (2008), "The gender wage gap in Bangladesh", ILO Asia-Pacific Working Paper Series,
ILO, Asia and the Pacific Region.
Kibria, N. (1995), "Culture, social class, and income control in the lives of women garment workers
in Bangladesh", Gender and Society, Vol. 9 No. 3, pp. 289-309.
Lee, B.S., Jang, S. and Sarkar, J. (2008), "Women's labor force participation and marriage: The case
of Korea", Journal of Asian Economics, Vol. 19 No. 2, pp. 138-154.
17
Liang, K-Y and Zeger, SL. (1986), "Longitudinal Data Analysis Using Generalized Linear Models",
Biometrika, Vol. 73 No. 1, pp. 13-22.
Majumder, P. and Zohir. S. (1993), "Employment and occupational mobility among women in
manufacturing industries of Dhaka city: Bangladesh, findings from a survey of employees",
ILO/ARTEP, New Delhi.
Majumder, P. and Zohir. S. (1994), Socio-economic condition of female garment workers in
Bangladesh. Arani Publications, Dhaka, Bangladesh.
Masters, S.H. (1969), "An Interindustry analysis of wages and plant size", Review of Economics &
Statistics, Vol. 51 No. 3, pp. 341-345.
Moghadam, V. (2005), Globalizing Women: Transitional Feminist Networks, The John Hopkins
University, Baltimore, MD.
Nelson, D. (2013), "Bangladesh building collapse kills at least 82 in Dhaka", The Daily Telegraph, 24
April.
Olivetti, C. (2006), "Changes in women's hours of market work: The role of returns to experience",
Review of Economic Dynamics, Vol. 9 No. 4, pp. 557-587.
Papke, L.E. and Wooldridge, J.M. (1996), "Econometric methods for fractional response variables
with an application to 401(K) plan participation rates", Journal of Applied Econometrics, Vol. 11 No.
6, pp. 619-632.
Papke, L.E. and Wooldridge, J.M. (2008), "Panel data methods for fractional response variables with
an application to test pass rates", Journal of Econometrics, Vol. 145 No. 1–2, pp. 121-133.
Pissarides, C., Garibaldi, P., Olivetti, C., Petrongolo, B. and Wasmer, E. (2005), "Women in the
labour force: How well is Europe doing?", in Boeri, T., Del Boca, D. and Pissarides, C. (Ed.), Women
at work: An economic perspective, Oxford University Press, London, UK.
Rahman, R.I. and Khandker, S.R. (1994), "Role of targeted credit programs in promoting employment
and productivity of the poor in Bangladesh", Bangladesh Journal of Development Studies, Vol. 22
No. 2/3, pp. 49-52.
Robbins, D.J. (1996), "HOS hits facts: Facts win evidence on trade and wages in the developing
world", Harvard Institute for International Development Working Paper No. 557, Cambridge, MA:
Harvard University.
Salway, S., Rahman, S. and Jesmin, S. (2003), "A profile of women’s work participation among the
urban poor of Dhaka", World Development, Vol. 31 No. 5, pp. 881-901.
Schmidt, C.M. and Zimmermann, K.F. (1991), "Work characteristics, firm size, and wages", Review
of Economics and Statistics, Vol. 73 No. 4, pp. 705-710.

18
Siegel, J.I., Pyun, L. and Cheon, B. (2014), "Multinational firms, labor market discrimination, and the
capture of competitive advantage by exploiting the social divide", Working Paper No. 11-011,
Harvard Business School, Boston, MA.
Wagner, J. (2003), "Unobserved firm heterogeneity and the size-exports nexus: Evidence from
German panel data", Review of World Economics, Vol. 139 No. 1, pp. 161-172.
Wooldridge, J. M. (2010), Econometric analysis of cross section and panel data. MIT Press.

19
Table 1. Summary statistics
Variable Mean Std. Dev Min Max
Dependent variables
Female full-time permanent workers 0.357 0.273 0 0.923
Female full-time production workers 0.383 0.296 0 0.938
Female full-time non-production workers 0.191 0.237 0 1
Firm-related variables
Small firm* 0.092 0.290 0 1
Medium firm 0.139 0.346 0 1
Large firm 0.769 0.422 0 1
Woman is an owner 0.413 0.493 0 1
Manager's experience 17.472 8.805 0 55
Firm age 2.847 0.626 0.693 5.176
Firm has website 0.660 0.474 0 1
Profit ratio 0.803 0.224 -1.203 1.000
Exporter 0.545 0.499 0 1
Government ownership 0.010 0.099 0 1
Private foreign ownership 0.036 0.187 0 1
Private domestic ownership* 0.964 0.187 0 1
Skilled production workers 0.504 0.415 0 1
Non-production workers 0.172 0.160 0 0.935
Food 0.102 0.304 0 1
Textiles/Garments* 0.634 0.483 0 1
Leather 0.059 0.237 0 1
Chemical 0.092 0.290 0 1
Electronics 0.063 0.243 0 1
Other manufacturing industry 0.050 0.217 0 1
Number of observations 303 Notes:
*implies reference categories in the estimated equations.
Source: Authors’ calculation from the Enterprise Survey data sets for 2007, 2011 and 2013.

20
Table 2. Variance inflation factor (VIF)
VIF Tolerance (1/VIF) VIF Tolerance (1/VIF)
Medium firm 2.37 0.42 2.52 0.39
Large firm 3.14 0.32 3.84 0.26
Woman is an owner 1.16 0.86 1.24 0.8
Manager's experience 1.21 0.82 1.26 0.79
Firm age 1.20 0.83 1.26 0.8
Firm has website 1.17 0.85 1.26 0.79
Exporter 1.37 0.73 1.55 0.64
Government ownership 1.05 0.96 1.06 0.94
Private foreign ownership 1.06 0.94 1.17 0.85
Skilled production workers 1.11 0.90 1.17 0.86
Non-production workers 1.26 0.79 1.62 0.62
Profit ratio 1.05 0.95 1.06 0.94
Chittagong
1.26 0.79
Food
1.5 0.67
Leather
1.29 0.77
Chemical
1.65 0.61
Electronics
1.38 0.72
Other manufacturing industry
1.44 0.69
Mean 1.43 1.53 Source: Authors’ calculation from the Enterprise Survey data sets for 2007, 2011 and 2013.

21
Table 3. Fraction of female full-time permanent workers, 2007–2013
Estimation of equation (1)
Fractional logita
(1) (2) (3)
QMLE QMLE GEE
Fixed effects Fixed effects
Medium firm 0.260* 0.030 0.253*
(0.136) (0.094) (0.135)
Large firm 0.222** 0.041 0.218**
(0.081) (0.073) (0.081)
Woman is an owner 0.018 0.003 0.018
(0.027) (0.019) (0.027)
Manager's experience -0.002 -0.001 -0.002
(0.002) (0.001) (0.002)
Firm age 0.019 0.015 0.019
(0.019) (0.017) (0.019)
Firm has website -0.0631* -0.0417* -0.0638*
(0.027) (0.019) (0.027)
Exporter 0.135*** 0.018 0.133***
(0.027) (0.027) (0.028)
Government ownership -0.129*** -0.0787*** -0.129***
(0.027) (0.020) (0.027)
Private foreign ownership -0.155* -0.104*** -0.154*
(0.066) (0.014) (0.065)
Skilled production workers -0.013 0.001 -0.011
(0.109) (0.084) (0.110)
Non-production workers -0.153 -0.124 -0.156
(0.154) (0.089) (0.152)
Profit ratio 0.011 0.012 0.011
(0.064) (0.040) (0.064)
Chittagong 0.005 -0.101*** 0.005
(0.028) (0.021) (0.028)
Food -0.199*** -0.461*** -0.200***
(0.032) (0.042) (0.031)
Leather -0.274*** 0.0066 -0.275***
(0.022) (0.060) (0.022)
Chemical -0.219*** -0.405*** -0.219***
(0.025) (0.026) (0.025)
Electronics -0.163* -0.302*** -0.163*
(0.069) (0.020) (0.069)
Other manufacturing industry -0.305*** -0.260*** -0.305***
(0.026) (0.012) (0.026)
Time dummies Yes Yes Yes
ᵡ2 statistic 327.43 315.75 318.92
p-value (0.000) (0.000) (0.000)
Number of observations 303 303 303
Notes: a
Marginal effects. The marginal effect of discrete variables is given by the discrete change in the
outcome for each observation and their average over the sample. Robust standard errors are in parentheses and
are clustered at the firm-level. The 2 statistic is for testing the null hypothesis that all the coefficients are zero.
The omitted categories are small firm, private domestic ownership, and Dhaka and textiles/garments industry.
*, **, and *** indicate significance at 10%, 5%, and 1%, respectively.
Source: Authors’ calculation from the Enterprise Survey data sets for 2007, 2011 and 2013.

22
Table 4. Fraction of female full-time production workers, 2007–2013
Estimation of equation (1)
Fractional logita
(1) (2) (3)
QMLE QMLE GEE
Fixed effects Fixed effects
Medium firm 0.308* 0.033 0.331*
(0.154) (0.107) (0.154)
Large firm 0.263** 0.032 0.275**
(0.092) (0.079) (0.092)
Woman is an owner 0.017 0.002 0.018
(0.031) (0.019) (0.031)
Manager's experience -0.002 -0.001 -0.002
-0.002 -0.001 -0.002
Firm age 0.029 0.017 0.027
(0.022) (0.018) (0.022)
Firm has website -0.0715* -0.0447* -0.0681*
-0.031 -0.021 -0.031
Exporter 0.150*** 0.0187 0.155***
(0.031) (0.028) (0.031)
Government ownership -0.158*** -0.0801*** -0.152***
(0.043) (0.021) (0.042)
Private foreign ownership -0.117 -0.0819** -0.121
(0.105) (0.027) (0.105)
Skilled production workers -0.073 -0.049 -0.081
(0.158) (0.093) (0.152)
Non-production workers 0.123 0.058 0.137
(0.131) (0.102) (0.129)
Profit ratio -0.024 -0.009 -0.022
(0.072) (0.039) (0.073)
Chittagong -0.0197 -0.107*** -0.021
(0.032) (0.022) (0.032)
Food -0.238*** -0.442*** -0.233***
(0.036) (0.043) (0.037)
Leather -0.308*** -0.035 -0.304***
(0.025) (0.057) (0.025)
Chemical -0.253*** -0.387*** -0.250***
(0.031) (0.027) (0.030)
Electronics -0.205** -0.244*** -0.203**
(0.076) (0.019) (0.076)
Other manufacturing industry -0.333*** -0.215*** -0.334***
(0.037) (0.012) (0.036)
Time dummies Yes Yes Yes
ᵡ2 statistic 243.61 292.60 252.67
p-value (0.000) (0.000) (0.000)
Number of observations 303 303 303
Notes: a
Marginal effects. The marginal effect of discrete variables is given by the discrete change in the
outcome for each observation and their average over the sample. Robust standard errors are in parentheses and
are clustered at the firm-level. The 2 statistic is for testing the null hypothesis that all the coefficients are zero.
The omitted categories are small firm, private domestic ownership, and Dhaka and textiles/garments industry.
*, **, and *** indicate significance at 10%, 5%, and 1%, respectively.
Source: Authors’ calculation from the Enterprise Survey data sets for 2007, 2011 and 2013.

23
Table 5. Fraction of female full-time non-production workers, 2007–2013
Estimation of equation (1)
Fractional logita
(1) (2) (3)
QMLE QMLE GEE
Fixed effects Fixed effects
Medium firm 0.124 -0.003 0.123
(0.101) (0.013) (0.101)
Large firm 0.111** 0.004 0.110**
(0.043) (0.022) (0.044)
Woman is an owner 0.038 0.001 0.036
(0.023) (0.007) (0.024)
Manager's experience -0.002 0.000 -0.003
(0.001) (0.000) (0.002)
Firm age -0.008 0.012 -0.009
(0.019) (0.007) (0.020)
Firm has website -0.003 0.004 -0.004
(0.024) (0.006) (0.026)
Exporter 0.026 0.0149 0.028
(0.020) (0.009) (0.021)
Government ownership -0.021 -0.003 -0.023
(0.072) (0.013) (0.074)
Private foreign ownership -0.0849* -0.0183* -0.0847*
(0.042) (0.008) (0.041)
Skilled production workers -0.112 -0.032 -0.11
(0.088) (0.025) (0.089)
Non-production workers -0.175 -0.0431 -0.173
(0.137) (0.034) (0.139)
Profit ratio 0.089 0.032 0.087
(0.095) (0.028) (0.096)
Chittagong 0.0795** 0.049 0.0796**
(0.029) (0.033) (0.030)
Food 0.001 -0.112*** 0.002
(0.044) (0.020) (0.045)
Leather -0.126*** -0.0538*** -0.125***
(0.018) (0.005) (0.019)
Chemical -0.040 -0.0850*** -0.038
(0.033) (0.012) (0.034)
Electronics -0.010 -0.177*** -0.012
(0.040) (0.022) (0.039)
Other manufacturing industry -0.145*** -0.115*** -0.146***
(0.014) (0.011) (0.015)
Time dummies Yes Yes Yes
ᵡ2 statistic 154.61 989.47 153.62
p-value (0.000) (0.000) (0.000)
Number of observations 303 303 303
Notes: a
Marginal effects. The marginal effect of discrete variables is given by the discrete change in the
outcome for each observation and their average over the sample. Robust standard errors are in parentheses and
are clustered at the firm-level. The 2 statistic is for testing the null hypothesis that all the coefficients are zero.
The omitted categories are small firm, private domestic ownership, and Dhaka and textiles/garments industry.
*, **, and *** indicate significance at 10%, 5%, and 1%, respectively.
Source: Authors’ calculation from the Enterprise Survey data sets for 2007, 2011 and 2013.

24
Table 6. Robustness check for female full-time workers without industry and city dummies
Fractional logita
Permanent workers Production workers Non-production workers
(1) (2) (3) (4) (5) (6) (7) (8) (9)
QMLE QMLE GEE QMLE QMLE GEE QMLE QMLE GEE
Fixed effects Fixed effects Fixed effects Fixed effects Fixed effects Fixed effects
Medium firm 0.271** 0.036 0.257* 0.309** 0.031 0.305** 0.117 -0.001 0.144
(0.135) (0.098) (0.132) (0.146) (0.103) (0.146) (0.113) (0.015) (0.123)
Large firm 0.333*** 0.038 0.324*** 0.379*** 0.024 0.377*** 0.140*** 0.000 0.149***
(0.059) (0.074) (0.059) (0.065) (0.078) (0.065) (0.046) (0.024) (0.047)
Woman is an owner 0.038 0.005 0.037 0.048 0.005 0.047 0.021 0.001 0.023
(0.030) (0.019) (0.029) (0.034) (0.018) (0.034) (0.024) (0.007) (0.023)
Manager's experience -0.004** -0.001 -0.005*** -0.004** -0.001 -0.004** -0.003** -0.001* -0.003*
(0.002) (0.001) (0.002) (0.002) (0.001) (0.002) (0.002) (0.000) (0.002)
Firm age -0.013 0.016 -0.012 -0.010 0.018 -0.010 -0.007 0.012 -0.014
(0.021) (0.017) (0.020) (0.024) (0.017) (0.024) (0.019) (0.007) (0.018)
Firm has website -0.037 -0.040** -0.040 -0.043 -0.045** -0.044 0.019 0.006 0.015
(0.032) (0.019) (0.031) (0.036) (0.020) (0.036) (0.027) (0.006) (0.027)
Exporter 0.172*** 0.026 0.167*** 0.189*** 0.021 0.187*** 0.029 0.016* 0.025
(0.031) (0.026) (0.032) (0.036) (0.026) (0.036) (0.025) (0.009) (0.024)
Government ownership -0.054 -0.074*** -0.062 -0.068 -0.078*** -0.072 -0.026 0.000 -0.024
(0.051) (0.024) (0.051) (0.080) (0.018) (0.080) (0.070) (0.013) (0.072)
Private foreign ownership -0.172*** -0.107*** -0.170*** -0.144 -0.078*** -0.143 -0.071 -0.020*** -0.066
(0.065) (0.012) (0.064) (0.101) (0.024) (0.101) (0.057) (0.007) (0.054)
Skilled production workers 0.085 -0.005 0.076 0.034 -0.030 0.032 -0.075 -0.043* -0.054
(0.140) (0.082) (0.138) (0.186) (0.089) (0.186) (0.095) (0.025) (0.093)
Non-production workers -0.445*** -0.093 -0.433*** -0.201 0.031 -0.199 -0.281* -0.018 -0.301**
(0.160) (0.082) (0.157) (0.140) (0.089) (0.140) (0.149) (0.033) (0.150)
Profit ratio 0.009 0.020 0.011 -0.021 -0.010 -0.022 0.076 0.036 0.058
(0.065) (0.042) (0.064) (0.071) (0.037) (0.070) (0.077) (0.030) (0.066)
Time dummies Yes Yes Yes Yes Yes Yes Yes Yes Yes
Number of observations 303 303 303 303 303 303 303 303 303
Notes: a
Marginal effects. The marginal effect of discrete variables is given by the discrete change in the outcome for each observation and their average over the sample.
Robust standard errors are in parentheses and are clustered at the firm-level.
*, **, and *** indicate significance at 10%, 5%, and 1%, respectively. Source: Authors’ calculation from the Enterprise Survey data sets for 2007, 2011 and 2013.

25
Table 7. Robustness check for female full-time workers in textiles/garments industry
Fractional logita
Permanent workers Production workers Non-production workers
(1) (2) (3) (4) (5) (6) (7) (8) (9)
QMLE QMLE GEE QMLE QMLE GEE QMLE QMLE GEE
Fixed effects Fixed effects Fixed effects Fixed effects Fixed effects Fixed effects
Medium firm 0.656*** 0.647*** 0.0001 0.629*** 0.620*** 0.491*** 0.860*** 0.890*** 0.798***
(0.001) (0.008) (0.376) (0.006) (0.008) (0.026) (0.007) (0.006) (0.039)
Large firm 0.613*** 0.594*** -0.155 0.647*** 0.627*** 0.513*** 0.305*** 0.249*** 0.254***
(0.005) (0.007) (0.383) (0.007) (0.007) (0.036) (0.007) (0.015) (0.018)
Woman is an owner -0.005 -0.055 0.008 -0.004 -0.055 0.008 0.005 -0.080*** 0.048*
(0.032) (0.045) (0.033) (0.036) (0.052) (0.035) (0.027) (0.030) (0.028)
Manager's experience -0.003* -0.003 -0.004* -0.003 -0.003 -0.004* -0.004** -0.005** -0.004*
(0.002) (0.003) (0.002) (0.002) (0.003) (0.002) (0.002) (0.002) (0.002)
Firm age 0.018 0.022 0.017 0.022 0.015 0.027 0.008 0.100*** -0.024
(0.024) (0.044) (0.029) (0.027) (0.050) (0.026) (0.024) (0.039) (0.025)
Firm has website -0.121*** -0.120*** -0.112*** -0.133*** -0.127** -0.125*** -0.041 -0.035 -0.042
(0.035) (0.042) (0.034) (0.038) (0.049) (0.037) (0.038) (0.040) (0.041)
Exporter 0.144*** 0.040 0.137*** 0.151*** 0.040 0.135*** 0.040 0.095** 0.025
(0.037) (0.065) (0.036) (0.042) (0.074) (0.039) (0.030) (0.041) (0.028)
Government ownership -0.204*** -0.216** -0.221*** -0.241*** -0.280** -0.269*** -0.045 0.082 -0.053
(0.034) (0.090) (0.041) (0.051) (0.109) (0.050) (0.107) (0.104) (0.106)
Private foreign ownership -0.279*** -0.408*** -0.279** -0.319*** -0.461*** -0.315*** -0.120 -0.130** -0.140**
(0.100) (0.050) (0.109) (0.109) (0.048) (0.115) (0.079) (0.060) (0.067)
Skilled production workers 0.120 0.044 0.062 0.164 0.089 0.116 -0.063 -0.267 0.099
(0.132) (0.237) (0.133) (0.147) (0.263) (0.145) (0.140) (0.168) (0.141)
Non-production workers -0.311* -0.170 -0.237 0.069 0.214 0.120 -0.225 -0.057 -0.360*
(0.182) (0.273) (0.184) (0.216) (0.326) (0.202) (0.181) (0.251) (0.197)
Profit ratio 0.008 0.036 -0.007 -0.002 0.023 -0.017 0.041 0.112 -0.009
(0.068) (0.088) (0.065) (0.075) (0.102) (0.071) (0.083) (0.109) (0.053)
(Continued to next page)

26
Table 7. Continued
Fractional logita
Permanent workers Production workers Non-production workers
(1) (2) (3) (4) (5) (6) (7) (8) (9)
QMLE QMLE GEE QMLE QMLE GEE QMLE QMLE GEE
Fixed effects Fixed effects Fixed effects Fixed effects Fixed effects Fixed effects
Chittagong -0.027 -0.315*** -0.030 -0.043 -0.344*** -0.044 0.086** 0.104 0.108***
(0.031) (0.061) (0.033) (0.033) (0.069) (0.034) (0.037) (0.096) (0.035)
Time dummies Yes Yes Yes Yes Yes Yes Yes Yes Yes
Number of observations 192 192 192 192 192 192 192 192 192
Notes: a
Marginal effects. The marginal effect of discrete variables is given by the discrete change in the outcome for each observation and their average over the sample.
Robust standard errors are in parentheses and are clustered at the firm-level.
*, **, and *** indicate significance at 10%, 5%, and 1%, respectively.
Source: Authors’ calculation from the Enterprise Survey data sets for 2007, 2011 and 2013.
27
Table 8. Robustness check for female full-time workers in Dhaka city
Fractional logita
Permanent workers Production workers Non-production workers
(1) (2) (3) (4) (5) (6) (7) (8) (9)
QMLE QMLE GEE QMLE QMLE GEE QMLE QMLE GEE
Fixed effects Fixed effects Fixed effects Fixed effects Fixed effects Fixed effects
Medium firm 0.237 -0.030 0.249 0.276 -0.043 0.337* 0.124 0.007 0.145
(0.182) (0.069) (0.182) (0.205) (0.056) (0.203) (0.118) (0.025) (0.124)
Large firm 0.217** -0.015 0.224** 0.250** -0.042 0.284*** 0.142*** 0.018 0.150***
(0.097) (0.093) (0.096) (0.113) (0.103) (0.107) (0.037) (0.013) (0.037)
Woman is an owner 0.026 0.010 0.026 0.028 0.012 0.026 0.005 -0.008* 0.012
(0.028) (0.016) (0.028) (0.033) (0.015) (0.033) (0.018) (0.004) (0.019)
Manager's experience -0.003 -0.002 -0.003 -0.003 -0.001 -0.002 -0.002 -0.000 -0.002
(0.002) (0.001) (0.002) (0.003) (0.001) (0.003) (0.001) (0.000) (0.001)
Firm age 0.015 0.009 0.014 0.027 0.013 0.025 -0.006 0.009 -0.011
(0.021) (0.015) (0.021) (0.024) (0.015) (0.025) (0.019) (0.006) (0.019)
Firm has website -0.057** -0.042** -0.055** -0.080** -0.050** -0.068** 0.022 0.007 0.020
(0.028) (0.019) (0.028) (0.033) (0.020) (0.034) (0.023) (0.005) (0.024)
Exporter 0.111*** 0.031 0.112*** 0.131*** 0.037 0.134*** 0.013 0.013 0.010
(0.030) (0.023) (0.030) (0.035) (0.023) (0.034) (0.021) (0.009) (0.020)
Government ownership -0.134*** -0.052** -0.134*** -0.167*** -0.049** -0.159*** -0.021 0.003 -0.019
(0.028) (0.020) (0.028) (0.041) (0.020) (0.040) (0.062) (0.015) (0.066)
Private foreign ownership -0.012 -0.017 -0.012 0.286 0.143 0.271 -0.068*** -0.007 -0.070***
(0.072) (0.059) (0.071) (0.266) (0.242) (0.248) (0.021) (0.008) (0.021)
Skilled production workers 0.034 0.037 0.031 0.024 0.031 0.006 -0.115 -0.037* -0.103
(0.109) (0.068) (0.108) (0.141) (0.064) (0.134) (0.089) (0.019) (0.089)
Non-production workers -0.095 -0.076 -0.094 0.149 0.043 0.164 -0.030 0.009 -0.049
(0.157) (0.078) (0.159) (0.127) (0.079) (0.124) (0.121) (0.022) (0.127)
Profit ratio -0.006 0.014 -0.008 -0.038 0.002 -0.043 0.018 0.009 0.013
(0.066) (0.035) (0.066) (0.076) (0.031) (0.074) (0.062) (0.012) (0.059)
Food -0.207*** -0.290*** -0.205*** -0.254*** -0.265*** -0.245*** 0.039 -0.067*** 0.048
(0.040) (0.025) (0.040) (0.046) (0.025) (0.047) (0.063) (0.009) (0.063)
Leather -0.266*** -0.097*** -0.265*** -0.304*** -0.082*** -0.296*** -0.104*** 0.000 -0.100***
(0.024) (0.006) (0.024) (0.027) (0.006) (0.027) (0.021) (0.008) (0.023)
(Continued to next page)

28
Table 8. Continued
Fractional logita
Permanent workers Production workers Non-production workers
(1) (2) (3) (4) (5) (6) (7) (8) (9)
QMLE QMLE GEE QMLE QMLE GEE QMLE QMLE GEE
Fixed effects Fixed effects Fixed effects Fixed effects Fixed effects Fixed effects
Chemical -0.225*** -0.391*** -0.225*** -0.259*** -0.365*** -0.257*** -0.080*** -0.092*** -0.082***
(0.026) (0.028) (0.026) (0.033) (0.029) (0.031) (0.020) (0.013) (0.019)
Electronics -0.232*** -0.253*** -0.229*** -0.284*** -0.199*** -0.269*** -0.008 -0.134*** -0.005
(0.035) (0.020) (0.036) (0.035) (0.018) (0.041) (0.046) (0.019) (0.047)
Other manufacturing industry -0.288*** -0.224*** -0.287*** -0.321*** -0.176*** -0.323*** -0.128*** -0.112*** -0.121***
(0.032) (0.013) (0.032) (0.043) (0.013) (0.042) (0.017) (0.012) (0.018)
Time dummies Yes Yes Yes Yes Yes Yes Yes Yes Yes
Number of observations 234 234 234 234 234 234 234 234 234
Notes: a Marginal effects. The marginal effect of discrete variables is given by the discrete change in the outcome for each observation and their average over the sample.
Robust standard errors are in parentheses and are clustered at the firm-level.
*, **, and *** indicate significance at 10%, 5%, and 1%, respectively.
Source: Authors’ calculation from the Enterprise Survey data sets for 2007, 2011 and 2013.
29
Table 9. Robustness check for female full-time workers for the year 2013
Fractional logita
(1) (2) (3) (4) (5) (6)
Permanent
workers
Production
workers
Non-production
workers
Permanent
workers
Production
workers
Non-production
workers
QMLE QMLE QMLE QMLE QMLE QMLE
Medium firm 0.027* 0.034* -0.004 0.035** 0.045** -0.004
(0.015) (0.018) (0.015) (0.016) (0.019) (0.016)
Large firm 0.100*** 0.129*** 0.032 0.135*** 0.164*** 0.055**
(0.025) (0.031) (0.023) (0.027) (0.032) (0.025)
Woman is an owner 0.016 0.024 0.005 0.005 0.010 0.002
(0.014) (0.017) (0.013) (0.013) (0.016) (0.014)
Manager's experience 0.001** 0.001* 0.000 0.001** 0.001** 0.000
(0.001) (0.001) (0.001) (0.001) (0.001) (0.001)
Firm age -0.051*** -0.063*** 0.001 -0.059*** -0.072*** -0.000
(0.007) (0.009) (0.008) (0.008) (0.010) (0.008)
Firm has website 0.031** 0.041** 0.006 0.029** 0.038** 0.009
(0.014) (0.017) (0.014) (0.014) (0.017) (0.015)
Exporter 0.115*** 0.128*** 0.050** 0.126*** 0.141*** 0.057***
(0.025) (0.030) (0.022) (0.022) (0.025) (0.021)
Private foreign ownership 0.017 0.014 0.044 0.032 0.036 0.023
(0.024) (0.034) (0.035) (0.033) (0.043) (0.030)
Skilled production workers -0.080*** -0.083*** -0.029 -0.081*** -0.086** -0.030
(0.026) (0.032) (0.021) (0.028) (0.034) (0.022)
Non-production workers -0.134*** -0.023 -0.108*** -0.186*** -0.071* -0.094***
(0.033) (0.043) (0.031) (0.033) (0.042) (0.029)
Profit ratio 0.023 0.012 0.050* 0.010 0.000 0.033
(0.023) (0.027) (0.028) (0.023) (0.027) (0.029)
Food -0.081*** -0.085*** -0.051***
(0.009) (0.012) (0.010)
Leather -0.077*** -0.085*** -0.044***
(0.009) (0.012) (0.011)
Chemical -0.050*** -0.055*** 0.023
(0.013) (0.017) (0.026)
(Continued to next page)
30
Table 9. Continued
Fractional logita
(1) (2) (3) (4) (5) (6)
Permanent
workers
Production
workers
Non-production
workers
Permanent
workers
Production
workers
Non-production
workers
QMLE QMLE QMLE QMLE QMLE QMLE
Electronics -0.075*** -0.081** -0.030
(0.024) (0.033) (0.026)
Other manufacturing
industry -0.061*** -0.064*** -0.044***
(0.012) (0.015) (0.014)
Chittagong 0.053*** 0.076*** -0.039***
(0.016) (0.021) (0.009)
Number of observations 987 987 987 987 987 987
Notes: a Marginal effects. The marginal effect of discrete variables is given by the discrete change in the outcome for each observation and their average over the sample.
Robust standard errors are in parentheses and are clustered at the firm-level.
*, **, and *** indicate significance at 10%, 5%, and 1%, respectively.
Source: Authors’ calculation from the Enterprise Survey data sets for 2007, 2011 and 2013.

31
Figure 1. Years of schooling by gender, 1950–2010. Source: Authors’ calculation based on data from Barro and Lee (2013).
02
46
8
1940 1960 1980 2000 2020Year
Bangladesh E. Asia & Pacific
Lat America MENA
South Asia
Women
02
46
8
1940 1960 1980 2000 2020Year
Bangladesh E. Asia & Pacific
Lat America MENA
South Asia
Men

32
Appendix
Table A1. List of variable names and descriptions
Variable name Description
Dependent variables
Female full-time permanent workers Fraction in total full-time permanent workers
Female full-time production workers Fraction in total full-time production workers
Female full-time non-production
workers
Fraction in total full-time non-production workers
Firm-related variables
Small firm 1 firms with employees 19 or less
Medium firm 1 firms with between 20 and 99 employees
Large firm 1 firms with greater than or equal to 100 employees
Woman is an owner 1 firm owner is a woman
Manager's experience Manager’s experience in years
Firm age log of firm age since operation
Firm has website
1 firms use of own internet website
Profit ratio Ratio of total profit (total sales-total costs) to total sales
Exporter 1 firms with more than 10% annual sales derived from direct
export
Government ownership
1 firms that are subsidiary of government-owned firms
Private foreign ownership 1 firms with more than 10% foreign ownership
Private domestic ownership 1 firms with less than 10% foreign ownership
Skilled production workers Fraction in total full-time production workers
Non-production workers Fraction in total employment
Food 1 if industry category is food
Textiles/Garments 1 if industry category is textiles/garments
Leather 1 if industry category is leather
Chemical 1 if industry category is chemical
Electronics 1 if industry category is electronics
Other manufacturing industry 1 if industry category is others Source: Authors’ calculation from the Enterprise Survey data sets for 2007, 2011 and 2013.

33
Table A2. Robustness check for female full-time workers without clustered standard errors
Fractional logita
Permanent workers Production workers Non-production workers
(1) (2) (3) (4) (5) (6) (7) (8) (9)
QMLE QMLE GEE QMLE QMLE GEE QMLE QMLE GEE
Fixed effects Fixed effects Fixed effects Fixed effects Fixed effects Fixed effects
Medium firm 0.260* 0.030 0.253* 0.308** 0.033 0.331** 0.124 -0.003 0.165
(0.134) (0.069) (0.135) (0.147) (0.078) (0.154) (0.105) (0.010) (0.116)
Large firm 0.222*** 0.041 0.218*** 0.263*** 0.032 0.275*** 0.111** 0.004 0.128***
(0.077) (0.055) (0.081) (0.088) (0.059) (0.092) (0.046) (0.017) (0.044)
Woman is an owner 0.018 0.003 0.018 0.017 0.002 0.018 0.038 0.001 0.047**
(0.025) (0.015) (0.027) (0.030) (0.016) (0.031) (0.024) (0.005) (0.023)
Manager's experience -0.002 -0.001 -0.002 -0.002 -0.001 -0.002 -0.002 -0.000 -0.002*
(0.002) (0.001) (0.002) (0.002) (0.001) (0.002) (0.001) (0.000) (0.001)
Firm age 0.018 0.015 0.019 0.029 0.017 0.027 -0.008 0.012* -0.018
(0.020) (0.013) (0.019) (0.023) (0.014) (0.022) (0.020) (0.006) (0.018)
Firm has website -0.063** -0.042** -0.064** -0.071** -0.045** -0.068** -0.002 0.004 -0.007
(0.028) (0.017) (0.027) (0.032) (0.019) (0.031) (0.024) (0.005) (0.024)
Exporter 0.135*** 0.017 0.133*** 0.150*** 0.019 0.155*** 0.026 0.015* 0.024
(0.028) (0.020) (0.028) (0.033) (0.021) (0.031) (0.020) (0.008) (0.019)
Government ownership -0.129*** -0.079*** -0.129*** -0.158*** -0.080*** -0.152*** -0.021 -0.003 -0.013
(0.027) (0.015) (0.027) (0.040) (0.016) (0.042) (0.075) (0.013) (0.081)
Private foreign ownership -0.155** -0.104*** -0.154** -0.117 -0.082*** -0.121 -0.085** -0.018** -0.087**
(0.064) (0.011) (0.065) (0.103) (0.020) (0.105) (0.038) (0.007) (0.040)
Skilled production workers -0.013 0.001 -0.011 -0.073 -0.049 -0.081 -0.112 -0.032 -0.094
(0.114) (0.070) (0.110) (0.159) (0.076) (0.152) (0.090) (0.023) (0.087)
Non-production workers -0.153 -0.124* -0.156 0.123 0.058 0.137 -0.175 -0.043 -0.195
(0.148) (0.072) (0.152) (0.132) (0.081) (0.129) (0.135) (0.029) (0.142)
Profit ratio 0.011 0.012 0.011 -0.024 -0.009 -0.022 0.089 0.032 0.066
(0.062) (0.032) (0.064) (0.069) (0.032) (0.073) (0.093) (0.024) (0.081)
Chittagong 0.005 -0.101 0.005 -0.020 -0.107* -0.021 0.080** 0.049 0.078***
(0.030) (0.067) (0.028) (0.034) (0.057) (0.031) (0.034) (0.036) (0.028)
Food -0.199*** -0.461*** -0.200*** -0.238*** -0.442*** -0.233*** 0.001 -0.112*** 0.012
(0.033) (0.045) (0.031) (0.036) (0.045) (0.037) (0.051) (0.028) (0.043)
(Continued to next page)

34
Table A2. Continued
Fractional logita
Permanent workers Production workers Non-production workers
(1) (2) (3) (4) (5) (6) (7) (8) (9)
QMLE QMLE GEE QMLE QMLE GEE QMLE QMLE GEE
Fixed effects Fixed effects Fixed effects Fixed effects Fixed effects Fixed effects
Leather -0.274*** 0.007 -0.275*** -0.308*** -0.035 -0.304*** -0.126*** -0.054*** -0.118***
(0.025) (0.048) (0.022) (0.029) (0.043) (0.025) (0.018) (0.014) (0.023)
Chemical -0.219*** -0.405*** -0.219*** -0.253*** -0.387*** -0.250*** -0.040 -0.085*** -0.046
(0.033) (0.034) (0.025) (0.037) (0.034) (0.030) (0.040) (0.017) (0.032)
Electronics -0.163*** -0.302*** -0.163** -0.205*** -0.244*** -0.203*** -0.010 -0.177*** -0.004
(0.058) (0.030) (0.069) (0.065) (0.027) (0.076) (0.041) (0.041) (0.042)
Other manufacturing industry -0.305*** -0.260*** -0.305*** -0.333*** -0.215*** -0.334*** -0.145*** -0.115*** -0.138***
(0.028) (0.016) (0.026) (0.037) (0.014) (0.036) (0.015) (0.022) (0.015)
Time dummies Yes Yes Yes Yes Yes Yes Yes Yes Yes
Number of observations 303 303 303 303 303 303 303 303 303
Notes: a Marginal effects. The marginal effect of discrete variables is given by the discrete change in the outcome for each observation and their average over the sample.
Robust standard errors are in parentheses.
*, **, and *** indicate significance at 10%, 5%, and 1%, respectively.
Source: Authors’ calculation from the Enterprise Survey data sets for 2007, 2011 and 2013.