Embed Size (px)
Citation preview

MUNICIPAL MARKET UPDATE
NUVEEN ASSET MANAGEMENT Eric FreySVP, Client Portfolio Manager
PRESENTATION FOR: PRESENTED BY:
FOR ADVISOR USE ONLY. NOT INTENDED FOR DISTRIBUTION TO THE GENERAL PUBLIC.
May 2011
Updated through 4/30/2011

NUVEEN ASSET MANAGEMENTFOR ADVISOR USE ONLY. PLEASE REFER TO RISKS AND IMPORTANT DISCLOSURES FOR ADDITIONAL INFORMATION.
BIOGRAPHY
Eric Frey
SVP, Client Portfolio Manager
Nuveen Asset Management
Mr. Frey has worked for Nuveen since 1987 and currently serves as a client portfolio manager for Nuveen Asset
Management. Mr. Frey started in the financial industry in 1986 and has both corporate and consulting
experience. Prior to rejoining Nuveen Investments in 2003, Mr. Frey worked as a retail advisor, as a municipal
institutional salesperson, and in portfolio management.
Mr. Frey earned his BS in finance and economics from Lehigh University.
2
NUVEEN ASSET MANAGEMENTFOR ADVISOR USE ONLY. PLEASE REFER TO RISKS AND IMPORTANT DISCLOSURES FOR ADDITIONAL INFORMATION.
THE MUNICIPAL BOND MARKET HAS UNDERGONE LONG-TERM, STRUCTURAL CHANGES
• Municipal bond insurance is no longer broadly available and is not valued by investors
• Diverse credit risk, which is often exaggerated or misunderstood by the media
• Rating agencies and research teams need to cover more credits
• Broker / Dealer firm consolidation has impacted liquidity profile
• Demand for municipals is more heavily driven by individual investors
3
Result: heightened risk, but the opportunity for heightened rewards
NUVEEN ASSET MANAGEMENTFOR ADVISOR USE ONLY. PLEASE REFER TO RISKS AND IMPORTANT DISCLOSURES FOR ADDITIONAL INFORMATION.
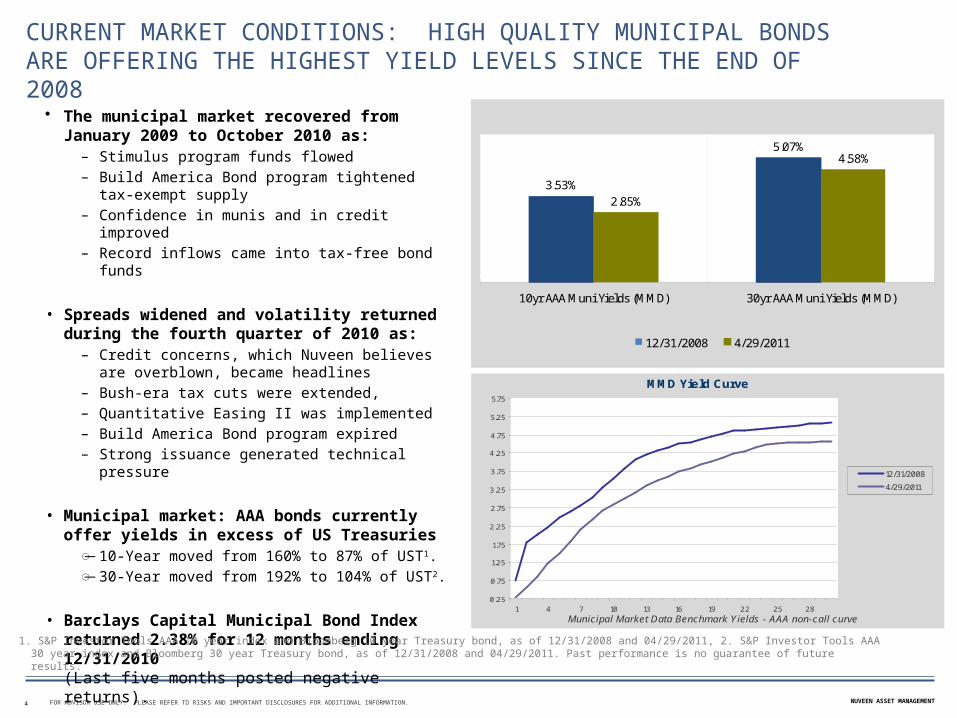
CURRENT MARKET CONDITIONS: HIGH QUALITY MUNICIPAL BONDS ARE OFFERING THE HIGHEST YIELD LEVELS SINCE THE END OF 2008
• The municipal market recovered from January 2009 to October 2010 as:
– Stimulus program funds flowed– Build America Bond program tightened tax-exempt
supply– Confidence in munis and in credit improved– Record inflows came into tax-free bond funds
• Spreads widened and volatility returned during the fourth quarter of 2010 as:
– Credit concerns, which Nuveen believes are overblown, became headlines
– Bush-era tax cuts were extended, – Quantitative Easing II was implemented– Build America Bond program expired– Strong issuance generated technical pressure
• Municipal market: AAA bonds currently offer yields in excess of US Treasuries
B̶ 10-Year moved from 160% to 87% of UST1.B̶ 30-Year moved from 192% to 104% of UST2.
• Barclays Capital Municipal Bond Index returned 2.38% for 12 months ending 12/31/2010 (Last five months posted negative returns).
4
1. S&P Investor Tools AAA 10 year index and Bloomberg 10 year Treasury bond, as of 12/31/2008 and 04/29/2011, 2. S&P Investor Tools AAA 30 year index and Bloomberg 30 year Treasury bond, as of 12/31/2008 and 04/29/2011. Past performance is no guarantee of future results.
3.53%
5.07%
2.85%
4.58%
10yr AAA Muni Yields (MMD) 30yr AAA Muni Yields (MMD)
12/31/2008 4/29/2011
MMD Yield Curve
0.25
0.75
1.25
1.75
2.25
2.75
3.25
3.75
4.25
4.75
5.25
5.75
1 4 7 10 13 16 19 22 25 28Municipal Market Data Benchmark Yields - AAA non-call curve
12/31/2008
4/29/2011
NUVEEN ASSET MANAGEMENTFOR ADVISOR USE ONLY. PLEASE REFER TO RISKS AND IMPORTANT DISCLOSURES FOR ADDITIONAL INFORMATION.
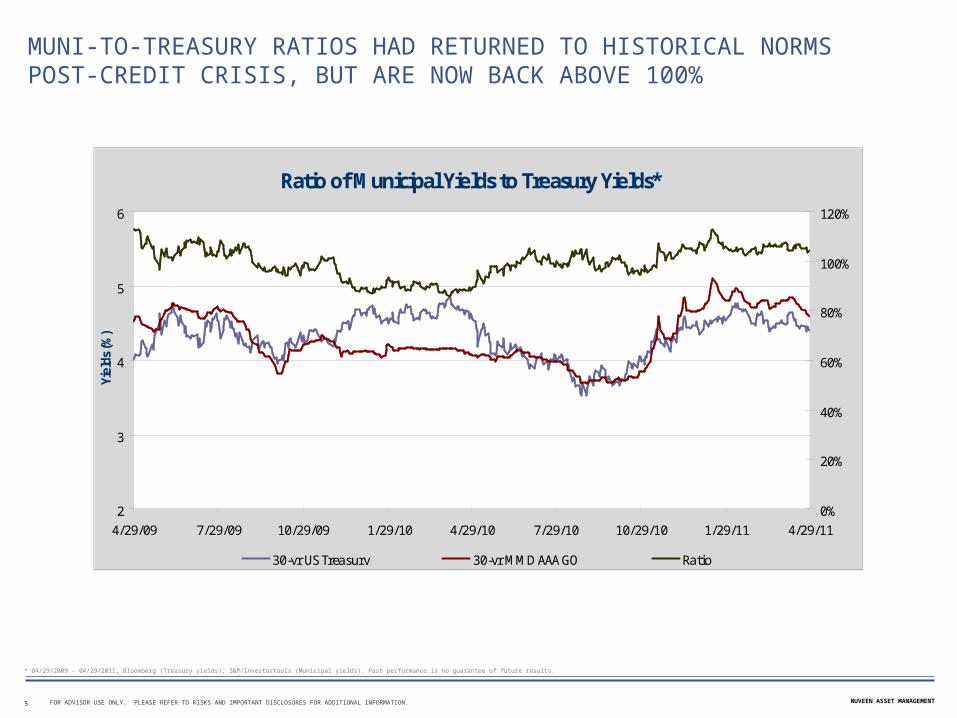
MUNI-TO-TREASURY RATIOS HAD RETURNED TO HISTORICAL NORMS POST-CREDIT CRISIS, BUT ARE NOW BACK ABOVE 100%
5
* 04/29/2009 – 04/29/2011; Bloomberg (Treasury yields); S&P/Investortools (Municipal yields). Past performance is no guarantee of future results.
Ratio of Municipal Yields to Treasury Yields*
2
3
4
5
6
4/29/09 7/29/09 10/29/09 1/29/10 4/29/10 7/29/10 10/29/10 1/29/11 4/29/11
Yiel
ds (%
)
0%
20%
40%
60%
80%
100%
120%
30-yr US Treasury 30-yr MMD AAA GO Ratio
NUVEEN ASSET MANAGEMENTFOR ADVISOR USE ONLY. PLEASE REFER TO RISKS AND IMPORTANT DISCLOSURES FOR ADDITIONAL INFORMATION.
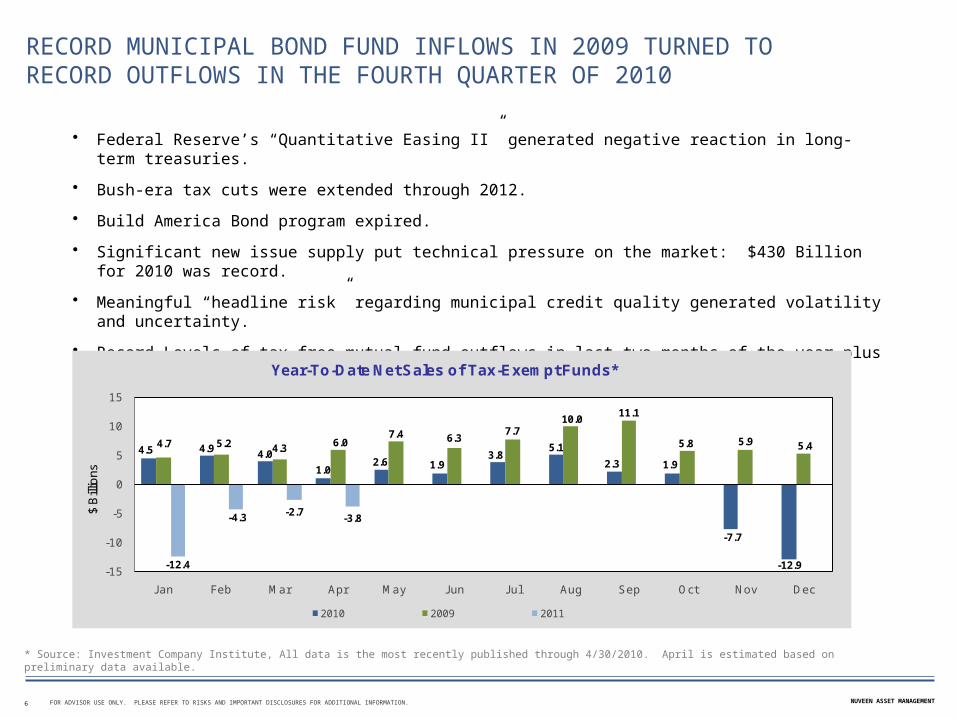
RECORD MUNICIPAL BOND FUND INFLOWS IN 2009 TURNED TO RECORD OUTFLOWS IN THE FOURTH QUARTER OF 2010
• Federal Reserve’s “Quantitative Easing II” generated negative reaction in long-term treasuries.
• Bush-era tax cuts were extended through 2012.
• Build America Bond program expired.
• Significant new issue supply put technical pressure on the market: $430 Billion for 2010 was record.
• Meaningful “headline risk” regarding municipal credit quality generated volatility and uncertainty.
• Record Levels of tax-free mutual fund outflows in last two months of the year plus January 2011.
* Source: Investment Company Institute, All data is the most recently published through 4/30/2010. April is estimated based on preliminary data available.
6
4.5 4.9 4.0
1.02.6 1.9
3.85.1
2.3 1.9
-7.7
-12.9
4.7 5.2 4.3 6.07.4 6.3
7.710.0
11.1
5.8 5.9 5.4
-12.4
-4.3-2.7
-3.8
-15
-10
-5
0
5
10
15
Jan Feb Mar Apr May Jun Jul Aug Sep Oct Nov Dec
$ B
illio
ns
Year-To-Date Net Sales of Tax-Exempt Funds*
2010 2009 2011
NUVEEN ASSET MANAGEMENTFOR ADVISOR USE ONLY. PLEASE REFER TO RISKS AND IMPORTANT DISCLOSURES FOR ADDITIONAL INFORMATION.
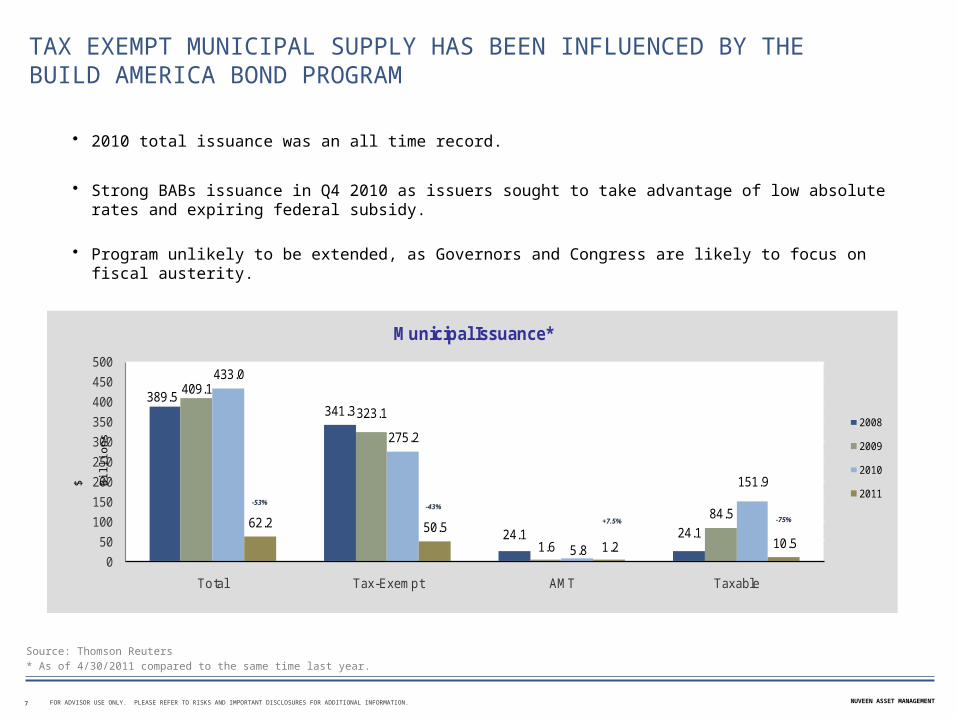
TAX EXEMPT MUNICIPAL SUPPLY HAS BEEN INFLUENCED BY THE BUILD AMERICA BOND PROGRAM
• 2010 total issuance was an all time record.
• Strong BABs issuance in Q4 2010 as issuers sought to take advantage of low absolute rates and expiring federal subsidy.
• Program unlikely to be extended, as Governors and Congress are likely to focus on fiscal austerity.
Source: Thomson Reuters
* As of 4/30/2011 compared to the same time last year.
7
389.5341.3
24.1 24.1
409.1
323.1
1.6
84.5
433.0
275.2
5.8
151.9
62.2 50.5
1.2 10.50
50
100
150
200
250
300
350
400
450
500
Total Tax-Exempt AMT Taxable
Municipal Issuance*
2008
2009
2010
2011-53%
-43%
+7.5% -75%
$ B
illio
ns
NUVEEN ASSET MANAGEMENTFOR ADVISOR USE ONLY. PLEASE REFER TO RISKS AND IMPORTANT DISCLOSURES FOR ADDITIONAL INFORMATION.
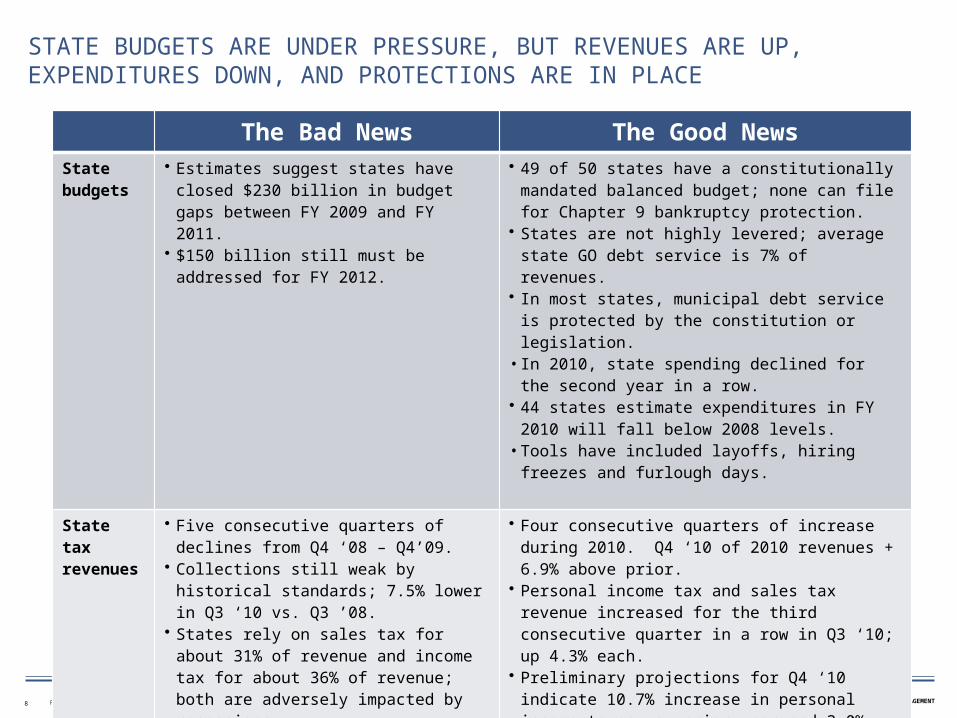
STATE BUDGETS ARE UNDER PRESSURE, BUT REVENUES ARE UP, EXPENDITURES DOWN, AND PROTECTIONS ARE IN PLACE
The Bad News The Good NewsState budgets
• Estimates suggest states have closed $230 billion in budget gaps between FY 2009 and FY 2011.
• $150 billion still must be addressed for FY 2012.
• 49 of 50 states have a constitutionally mandated balanced budget; none can file for Chapter 9 bankruptcy protection.
• States are not highly levered; average state GO debt service is 7% of revenues.
• In most states, municipal debt service is protected by the constitution or legislation.
• In 2010, state spending declined for the second year in a row.
• 44 states estimate expenditures in FY 2010 will fall below 2008 levels.
• Tools have included layoffs, hiring freezes and furlough days.
State tax revenues
• Five consecutive quarters of declines from Q4 ‘08 – Q4’09.
• Collections still weak by historical standards; 7.5% lower in Q3 ‘10 vs. Q3 ’08.
• States rely on sales tax for about 31% of revenue and income tax for about 36% of revenue; both are adversely impacted by recessions.
• Four consecutive quarters of increase during 2010. Q4 ‘10 of 2010 revenues + 6.9% above prior.
• Personal income tax and sales tax revenue increased for the third consecutive quarter in a row in Q3 ‘10; up 4.3% each.
• Preliminary projections for Q4 ‘10 indicate 10.7% increase in personal income taxes vs. prior year and 3.0% increase over 2008.
• State tax increases during Q3 ‘10 generated an estimated $1.3 billion additional revenue vs. prior year.
8
NUVEEN ASSET MANAGEMENTFOR ADVISOR USE ONLY. PLEASE REFER TO RISKS AND IMPORTANT DISCLOSURES FOR ADDITIONAL INFORMATION.
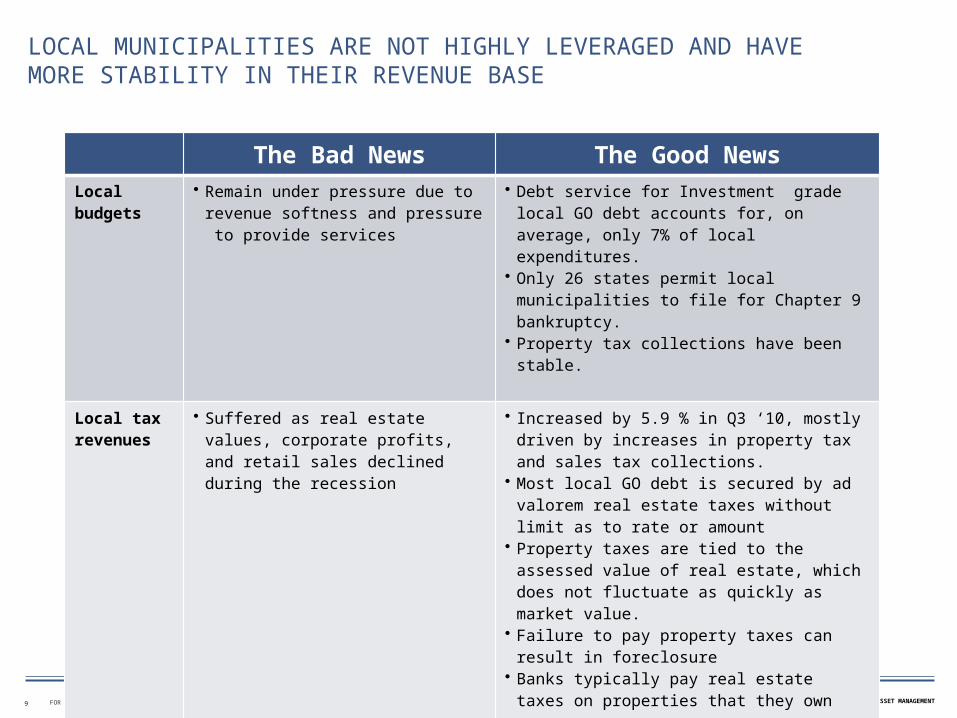
LOCAL MUNICIPALITIES ARE NOT HIGHLY LEVERAGED AND HAVE MORE STABILITY IN THEIR REVENUE BASE
9
The Bad News The Good NewsLocal budgets
• Remain under pressure due to revenue softness and pressure to provide services
• Debt service for Investment grade local GO debt accounts for, on average, only 7% of local expenditures.
• Only 26 states permit local municipalities to file for Chapter 9 bankruptcy.
• Property tax collections have been stable.
Local tax revenues
• Suffered as real estate values, corporate profits, and retail sales declined during the recession
• Increased by 5.9 % in Q3 ‘10, mostly driven by increases in property tax and sales tax collections.
• Most local GO debt is secured by ad valorem real estate taxes without limit as to rate or amount
• Property taxes are tied to the assessed value of real estate, which does not fluctuate as quickly as market value.
• Failure to pay property taxes can result in foreclosure
• Banks typically pay real estate taxes on properties that they own
NUVEEN ASSET MANAGEMENTFOR ADVISOR USE ONLY. PLEASE REFER TO RISKS AND IMPORTANT DISCLOSURES FOR ADDITIONAL INFORMATION.
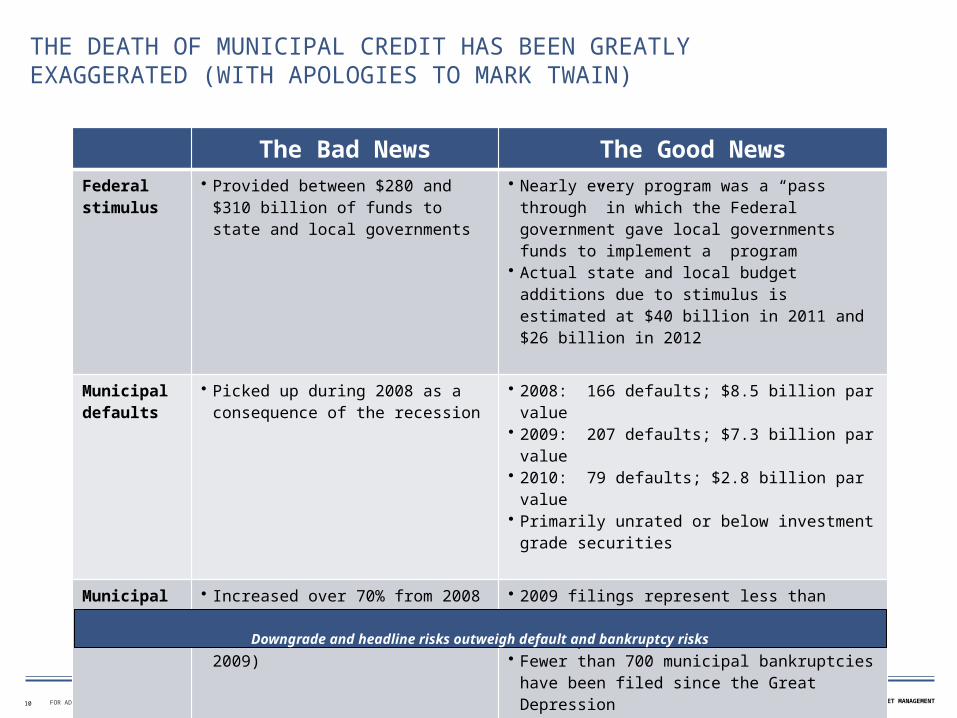
THE DEATH OF MUNICIPAL CREDIT HAS BEEN GREATLY EXAGGERATED (WITH APOLOGIES TO MARK TWAIN)
10
The Bad News The Good NewsFederal stimulus
• Provided between $280 and $310 billion of funds to state and local governments
• Nearly every program was a “pass through” in which the Federal government gave local governments funds to implement a program
• Actual state and local budget additions due to stimulus is estimated at $40 billion in 2011 and $26 billion in 2012
Municipal defaults
• Picked up during 2008 as a consequence of the recession
• 2008: 166 defaults; $8.5 billion par value• 2009: 207 defaults; $7.3 billion par value• 2010: 79 defaults; $2.8 billion par value• Primarily unrated or below investment grade
securities
Municipal bankruptcies
• Increased over 70% from 2008 to 2009(from 7 in 2008 to 12 in 2009)
• 2009 filings represent less than 0.013% of the over 89,000 municipalities
• Fewer than 700 municipal bankruptcies have been filed since the Great Depression
• States cannot currently file• Only 26 states allow municipalities to file• Process must be voluntary and is often expensive
and politically unpleasant
Downgrade and headline risks outweigh default and bankruptcy risks
NUVEEN ASSET MANAGEMENTFOR ADVISOR USE ONLY. PLEASE REFER TO RISKS AND IMPORTANT DISCLOSURES FOR ADDITIONAL INFORMATION.
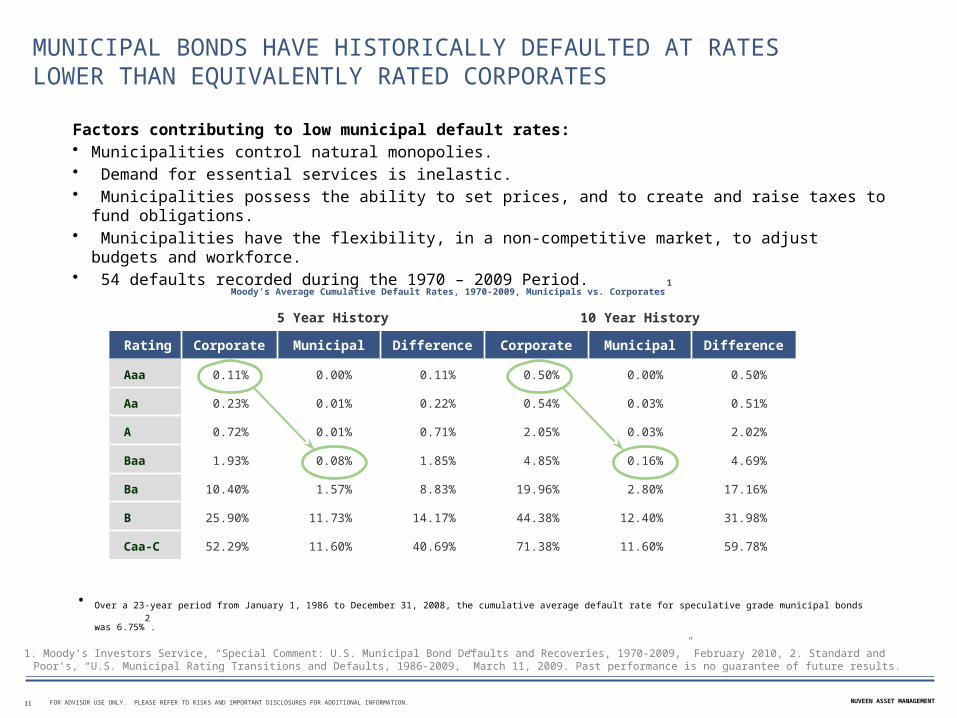
MUNICIPAL BONDS HAVE HISTORICALLY DEFAULTED AT RATES LOWER THAN EQUIVALENTLY RATED CORPORATES
Factors contributing to low municipal default rates: • Municipalities control natural monopolies.• Demand for essential services is inelastic.• Municipalities possess the ability to set prices, and to create and raise taxes to fund obligations.• Municipalities have the flexibility, in a non-competitive market, to adjust budgets and workforce.• 54 defaults recorded during the 1970 – 2009 Period.
1. Moody’s Investors Service, “Special Comment: U.S. Municipal Bond Defaults and Recoveries, 1970-2009,” February 2010, 2. Standard and Poor’s, “U.S. Municipal Rating Transitions and Defaults, 1986-2009,” March 11, 2009. Past performance is no guarantee of future results.
11
5 Year History 10 Year History
Rating Corporate Municipal Difference Corporate Municipal Difference
Aaa 0.11% 0.00% 0.11% 0.50% 0.00% 0.50%
Aa 0.23% 0.01% 0.22% 0.54% 0.03% 0.51%
A 0.72% 0.01% 0.71% 2.05% 0.03% 2.02%
Baa 1.93% 0.08% 1.85% 4.85% 0.16% 4.69%
Ba 10.40% 1.57% 8.83% 19.96% 2.80% 17.16%
B 25.90% 11.73% 14.17% 44.38% 12.40% 31.98%
Caa-C 52.29% 11.60% 40.69% 71.38% 11.60% 59.78%
Moody’s Average Cumulative Default Rates, 1970-2009, Municipals vs. Corporates1
• Over a 23-year period from January 1, 1986 to December 31, 2008, the cumulative average default rate for speculative grade municipal bonds was 6.75%2
.
NUVEEN ASSET MANAGEMENTFOR ADVISOR USE ONLY. PLEASE REFER TO RISKS AND IMPORTANT DISCLOSURES FOR ADDITIONAL INFORMATION.
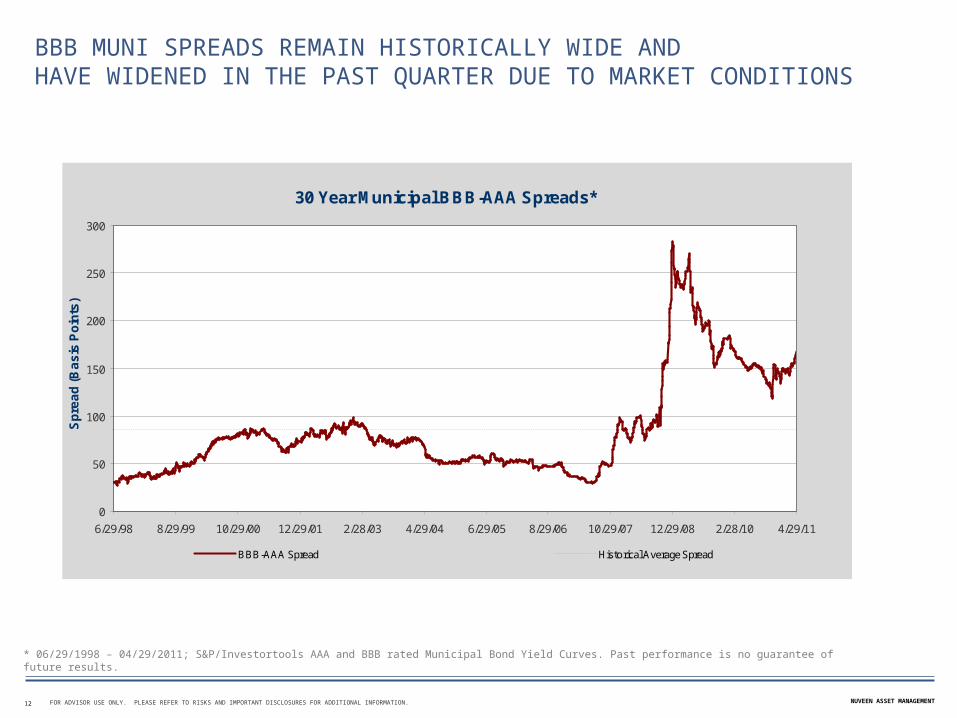
BBB MUNI SPREADS REMAIN HISTORICALLY WIDE AND HAVE WIDENED IN THE PAST QUARTER DUE TO MARKET CONDITIONS
* 06/29/1998 – 04/29/2011; S&P/Investortools AAA and BBB rated Municipal Bond Yield Curves. Past performance is no guarantee of future results.
12
30 Year Municipal BBB-AAA Spreads*
0
50
100
150
200
250
300
6/29/98 8/29/99 10/29/00 12/29/01 2/28/03 4/29/04 6/29/05 8/29/06 10/29/07 12/29/08 2/28/10 4/29/11
Sp
rea
d (
Ba
sis
Po
ints
)
BBB-AAA Spread Historical Average Spread
NUVEEN ASSET MANAGEMENTFOR ADVISOR USE ONLY. PLEASE REFER TO RISKS AND IMPORTANT DISCLOSURES FOR ADDITIONAL INFORMATION.
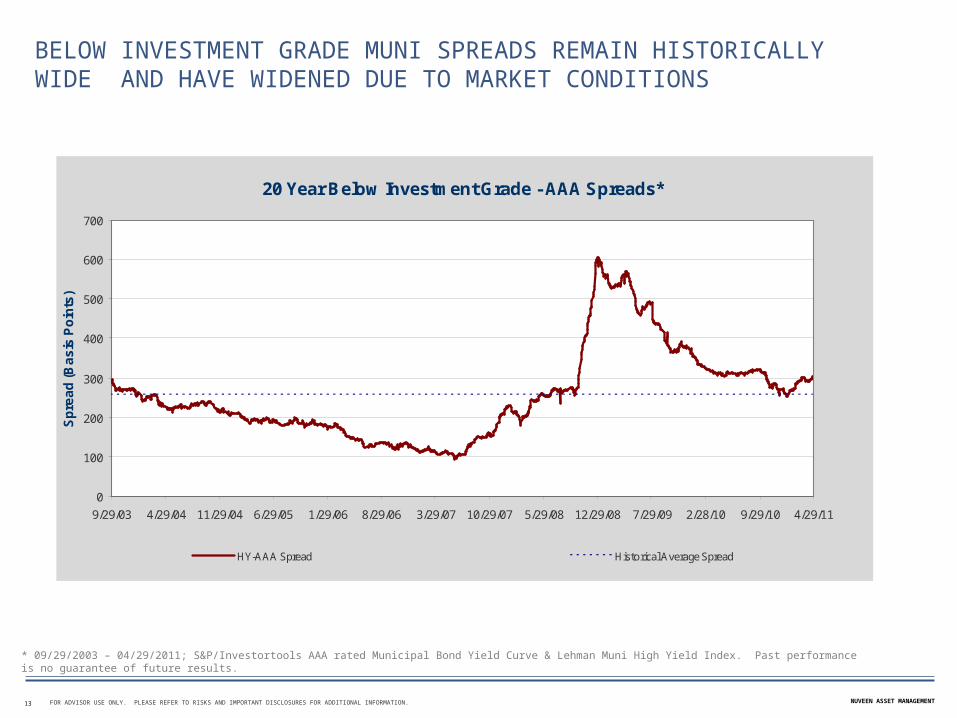
BELOW INVESTMENT GRADE MUNI SPREADS REMAIN HISTORICALLY WIDE AND HAVE WIDENED DUE TO MARKET CONDITIONS
* 09/29/2003 – 04/29/2011; S&P/Investortools AAA rated Municipal Bond Yield Curve & Lehman Muni High Yield Index. Past performance is no guarantee of future results.
13
20 Year Below Investment Grade - AAA Spreads*
0
100
200
300
400
500
600
700
9/29/03 4/29/04 11/29/04 6/29/05 1/29/06 8/29/06 3/29/07 10/29/07 5/29/08 12/29/08 7/29/09 2/28/10 9/29/10 4/29/11
Sp
rea
d (
Ba
sis
Po
ints
)
HY-AAA Spread Historical Average Spread
NUVEEN ASSET MANAGEMENTFOR ADVISOR USE ONLY. PLEASE REFER TO RISKS AND IMPORTANT DISCLOSURES FOR ADDITIONAL INFORMATION.
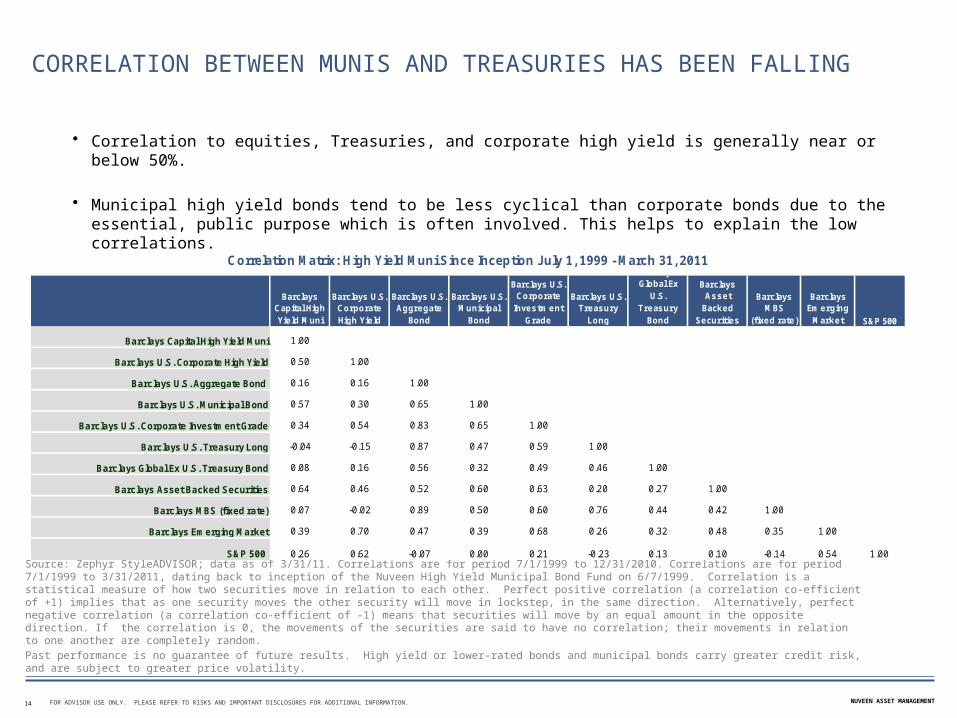
CORRELATION BETWEEN MUNIS AND TREASURIES HAS BEEN FALLING
• Correlation to equities, Treasuries, and corporate high yield is generally near or below 50%.
• Municipal high yield bonds tend to be less cyclical than corporate bonds due to the essential, public purpose which is often involved. This helps to explain the low correlations.
Source: Zephyr StyleADVISOR; data as of 3/31/11. Correlations are for period 7/1/1999 to 12/31/2010. Correlations are for period 7/1/1999 to 3/31/2011, dating back to inception of the Nuveen High Yield Municipal Bond Fund on 6/7/1999. Correlation is a statistical measure of how two securities move in relation to each other. Perfect positive correlation (a correlation co-efficient of +1) implies that as one security moves the other security will move in lockstep, in the same direction. Alternatively, perfect negative correlation (a correlation co-efficient of -1) means that securities will move by an equal amount in the opposite direction. If the correlation is 0, the movements of the securities are said to have no correlation; their movements in relation to one another are completely random.
Past performance is no guarantee of future results. High yield or lower-rated bonds and municipal bonds carry greater credit risk, and are subject to greater price volatility.
14
Barclays Capital High Yie ld M uni
Barclays U.S. Corporate High Yie ld
Barclays U.S. Aggregate
Bond
Barclays U.S. M unicipal
Bond
Barclays U.S. Corporate
Investm ent Grade
Barclays U.S. Treasury
Long
Barclays Global Ex
U.S. Treasury
Bond
Barclays Asset
Backed Securities
Barclays M BS
(fixed rate )
Barclays Em erging
M arket S&P 500
Barclays Capital High Yield Muni 1.00
Barclays U.S. Corporate High Yield 0.50 1.00
Barclays U.S. Aggregate Bond 0.16 0.16 1.00
Barclays U.S. Municipal Bond 0.57 0.30 0.65 1.00
Barclays U.S. Corporate Investment Grade 0.34 0.54 0.83 0.65 1.00
Barclays U.S. Treasury Long -0.04 -0.15 0.87 0.47 0.59 1.00
Barclays Global Ex U.S. Treasury Bond 0.08 0.16 0.56 0.32 0.49 0.46 1.00
Barclays Asset Backed Securities 0.64 0.46 0.52 0.60 0.63 0.20 0.27 1.00
Barclays MBS (fixed rate) 0.07 -0.02 0.89 0.50 0.60 0.76 0.44 0.42 1.00
Barclays Emerging Market 0.39 0.70 0.47 0.39 0.68 0.26 0.32 0.48 0.35 1.00
S&P 500 0.26 0.62 -0.07 0.00 0.21 -0.23 0.13 0.10 -0.14 0.54 1.00
Correlation Matrix: High Yield Muni Since Inception July 1, 1999 - March 31, 2011
NUVEEN ASSET MANAGEMENTFOR ADVISOR USE ONLY. PLEASE REFER TO RISKS AND IMPORTANT DISCLOSURES FOR ADDITIONAL INFORMATION.
RISKS AND OPPORTUNITIES ON THE HORIZON
• Extreme nature of the selloff in late 2010 may create an attractive entry point.
• Selloff was highly technical in nature in contrast to late 2008, which was liquidity driven.
• No apparent credit event: incidence of actual defaults has fallen sharply from 2008 – 2010.
• Supply and demand characteristics appear to be returning to much better balance: supply is lower than prior year, and depressed values have been attracting crossover buyers.
• Credit cycle – especially for GO debt – has not yet fully played out.
• While defaults could remain low, headline risks and ratings downgrades are still likely to be significant factors moving prices.
• Monoline Insurance: Industry has taken numerous credit ratings downgrades and loss of credibility among investors. Unlikely to see much market share increase for several years.
• Still see value in BBB range essential service credits. Spreads still significantly wider than average.
• See value in selected Healthcare credits as well as Industrial Development Revenue Bonds.
* As of 12/31/2010
15
NUVEEN ASSET MANAGEMENTFOR ADVISOR USE ONLY. PLEASE REFER TO RISKS AND IMPORTANT DISCLOSURES FOR ADDITIONAL INFORMATION.
RISKS AND IMPORTANT DISCLOSURES
This material is provided for informational purposes only to present our view on market opportunities. The statements contained herein are based solely
upon the opinions of Nuveen Asset Management and the data available at the time of publication. This material is not to be construed as investment,
legal or tax advice and contains no recommendations to buy or sell any specific securities, products or financial instruments. The reader should not
assume that any sectors or securities mentioned were or will be profitable and there can be no assurance that a particular asset class will provide
positive performance over any period of time. Past performance is no guarantee of future results. The analysis contained herein is based on numerous
assumptions that may or may not occur. Different benchmarks and economic periods will produce different results. Certain information was obtained
from third party sources which we believe to be reliable but are not guaranteed. Neither Nuveen nor any of its affiliates directors, employees or agents
accepts any liability for any loss or damage arising out of the use of all or any part of this information.
Certain information contained in this document constitutes “Forward-Looking Statements” (including observations about markets and industry and
regulatory trends as of the original date of this document), which can be identified by the use of forward-looking terminology such as “may”, “will”,
“should”, “expect”, “anticipate”, “target”, “project”, “estimate”, “intend”, “continue” or “believe”, or the negatives thereof or other variations thereon or
comparable terminology. Due to various risks and uncertainties beyond our control, actual events, results or performance may differ materially from
those reflected or contemplated in such forward-looking statements. Readers are cautioned not to place undue reliance on such statements. Nuveen
has no obligation to update any of the forward-looking statements in this document.
The yield curve is a line graph that plots the relationship between yields to maturity and time to maturity for bonds of the same asset class and credit
quality. The plotted line begins with the spot interest rate, which is the rate for the shortest maturity, and extends out in time, typically to 30 years.
The portfolio/index yield characteristics set forth do not reflect the deduction of advisory fees, transaction costs, and other expenses that a client would
incur. Further they will be impacted by the reinvestment of dividends, market value changes, and/or other earnings. It is not possible to invest directly in
an unmanaged index.
Build America Bonds issued by state and local governments are taxable issues. Asset-backed and mortgage-backed securities are subject to risks such
as prepayment risk, liquidity risk, default risk and adverse economic developments. Obligations of U.S. Government agencies and authorities are
supported by varying degrees but are generally not backed by the full faith of the U.S. Government; portfolios that invest in such securities are not
guaranteed and will fluctuate in value. Investing in municipal and corporate bonds involve risk including possible loss of principal. Debt or fixed income
securities are subject to credit risk and interest rate risk. The value of, and income generated by debt securities will decrease or increase based on
changes in market interest rates. Credit risk refers to an issuer's ability to make interest and principal payments when due. High yield or lower rated
bonds carry heightened credit risk and potential for default.
16