Embed Size (px)
Citation preview
Muskrat Falls Project - CE-22 (Public) Page 1 of 40
Muskrat Falls Project - CE-22 (Public) Page 2 of 40
Nalcor Energy - Lower Churchill Project
Hydraulic Modeling of the River - 2010 UpdateFinal Report - October 2010
H335459-MF1330-RPT-CA01-2501, Rev. 0, Page i
Table of Contents
List of Tables List of Figures Executive Summary
1. Introduction ......................................................................................................................................... 1-1
2. Extension of the Model to Lake Melville............................................................................................... 2-1
3. New Bathymetric Information ............................................................................................................. 3-1
4. Updated Project Layouts ...................................................................................................................... 4-1
5. Model Calibration Check ..................................................................................................................... 5-1
5.1 Steady State Model...................................................................................................................... 5-1 5.2 Unsteady Model.......................................................................................................................... 5-2
6. Consistency Between Steady and Unsteady Hydraulic Models ............................................................ 6-1
7. Conclusions.......................................................................................................................................... 7-1
Appendices Appendix A – Source of Bathymetry for Model Cross Sections Appendix B – Structure Discharge Rating Curves
Muskrat Falls Project - CE-22 (Public) Page 3 of 40

Nalcor Energy - Lower Churchill Project
Hydraulic Modeling of the River - 2010 UpdateFinal Report - October 2010
H335459-MF1330-RPT-CA01-2501, Rev. 0, Page ii
List of Tables
Number Title
Table 3.1 Additional Bathymetric Information Table 4.1 Hydraulic Model Geometries Table 4.2 Structure Details Table 5.1 Summary of Calibration Discrepancies
Muskrat Falls Project - CE-22 (Public) Page 4 of 40

Nalcor Energy - Lower Churchill Project
Hydraulic Modeling of the River - 2010 UpdateFinal Report - October 2010
H335459-MF1330-RPT-CA01-2501, Rev. 0, Page iii
List of Figures
Number Title
Figure 2.1 Hydraulic Model Extents Figure 3.1 Bathymetric Contours Figure 3.2 New Hydraulic Model Cross Sections Figure 5.1 Calibration to 2006 Parrott Survey Water Levels Figure 5.2 Calibration to 2006 LiDAR Survey Water Levels Figure 5.3 Calibration to 2007 Parrott Survey Water Levels Figure 5.4 Calibration to Rating Curves (1 of 2) Figure 5.5 Calibration to Rating Curves (2 of 2) Figure 5.6 Unsteady Model Calibration (1981) - Flows at Muskrat Falls Hydrometric Gauge Figure 6.1 Steady and Unsteady Models Simulated Water Level Profiles
Muskrat Falls Project - CE-22 (Public) Page 5 of 40

Nalcor Energy - Lower Churchill Project
Hydraulic Modeling of the River - 2010 UpdateFinal Report - October 2010
H335459-MF1330-RPT-CA01-2501, Rev. 0, Page iv
Executive Summary
Nalcor Energy – Lower Churchill Project (NE-LCP) is undertaking preliminary engineering studies of the development of the hydroelectric potential of the Lower Churchill River at Gull Island and Muskrat Falls. As part of these feasibility studies, Hatch has developed a numerical hydraulic model of the Lower Churchill River. The model was originally developed in 2007 under GI1110 and has been used to analyse the hydraulic regime in several other studies. Since 2007 there have been updates to project layouts and additional bathymetric and hydrometric data have become available. The objective of the current study is to update the hydraulic model based on this new information.
Eighty new cross sections were added to the model based on bathymetric surveys completed in 2006 and 2007. These sections replaced some sections in the original model that were based on much older bathymetric data, and filled in some parts of the river for which bathymetry data were not previously available. Calibration of the model for a range of flows was checked and it was determined that the new bathymetry provided for a successful calibration over the entire modelled reach. In some regions the updated model provided a better representation of measured water levels than the original model, and in some regions there was no difference. There is now a greater level of confidence in the model geometry where sections based on 1970s bathymetric surveys have been replaced with sections based on 2006 and 2007 surveys.
Updated structure details were incorporated into the hydraulic model so that the model could be used to assess the hydraulic regime at every stage of development of the two projects, whether Muskrat Falls or Gull Island is constructed first.
Also as part of this update, the hydraulic model was extended at the downstream end to the coast of Labrador based on nautical charts.
The result of this study is an up-to-date hydraulic model that can be used for the prediction of velocities and water levels throughout the Lower Churchill River. The model will be used for other MF1330 studies including the following.
Muskrat Falls Probable Maximum Flood (PMF) and Construction Design Flood (CDF) Study – 2010 Update
Muskrat Falls Dam Break Study – 2010 Update
Muskrat Falls Ice Study – 2010 Update
Gull Island CDF Analysis (1:60 year)
Muskrat Falls Project - CE-22 (Public) Page 6 of 40
Nalcor Energy - Lower Churchill Project
Hydraulic Modeling of the River - 2010 UpdateFinal Report - October 2010
H335459-MF1330-RPT-CA01-2501, Rev. 0, Page 1-1
1. Introduction
Nalcor Energy – Lower Churchill Project (NE-LCP) is undertaking preliminary engineering studies of the development of the hydroelectric potential of the Lower Churchill River at Gull Island and Muskrat Falls. These sites are located 231 km and 291 km downstream respectively from the Upper Churchill hydroelectric facility that was developed in the early 1970’s. The total potential capacity at the two sites is 3,074 megawatts (MW); the Gull Island site being the larger at 2,250 MW and the Muskrat Falls site having a capacity of 824 MW. In addition to the development of these sites, the overall concept includes various potential alternative power transmission arrangements involving combinations of AC and DC lines of various capacities.
In April 2007, Nalcor contracted Hatch Ltd. of St. John’s to undertake a program of studies to address aspects of this development. In January 2008 Hatch issued the final report of GI1110 – Hydraulic Modeling of the River to NE-LCP. The scope of work for that study included the development and calibration of a fully geo-referenced HEC-RAS open water hydraulic model that could be used to assess flow conditions in the existing river as well as during and post-construction. This model was used for several other studies completed by Hatch, including the PMF Study, the Ice Study, the Dam Break Study, and various other studies related to the preparation of the Environmental Impact Statement (EIS). Since the development of this hydraulic model, there have been changes to project layouts and additional bathymetric and hydrometric data collected. The objective of this study is to incorporate these additional data and to update the hydraulic model so that it may be used for other hydrotechnical studies and updates.
Muskrat Falls Project - CE-22 (Public) Page 7 of 40
Nalcor Energy - Lower Churchill Project
Hydraulic Modeling of the River - 2010 UpdateFinal Report - October 2010
H335459-MF1330-RPT-CA01-2501, Rev. 0, Page 2-1
2. Extension of the Model to Lake Melville
The original GI1110 hydraulic model extended part way through Goose Bay (approximate chainage -9.4 km, i.e. 9.4 km downstream of the river outlet). Typically for dam break modeling it is important that the downstream model boundary extends to a location where the results of a dam breach would not induce a significant increase in water level. These locations are usually large lakes or bodies of water influenced by tidal fluctuations. As part of the Churchill Falls Dam Break Study completed by Hatch in 2010 for Nalcor Energy – Churchill Falls (NE-CF), the model reach was extended downstream through Lake Melville to the Atlantic Ocean at Groswater Bay, in anticipation of the potentially large outflow volumes associated with a hypothetical dam breach in the Upper Churchill system. Nautical charts were acquired from the Canadian Hydrographic Service which provided detailed bathymetric information in this area. This information was manually digitized in ArcGIS, cross sections were cut using Hec-GeoRAS, and the model was extended to Groswater Bay on the coast of Labrador. The model centreline which represents the extents of the model is illustrated in Figure 2.1.
Muskrat Falls Project - CE-22 (Public) Page 8 of 40

Page 2-2
Figure 2.1Hydraulic Model Extents
MF1330 - Hydraulic Modeling of the River - 2010 UpdateNalcor Energy - Lower Churchill Project
333.6 km
102.3 km
42.8 km
0 km
-9.4 km
-224 km
Churchill Falls
Muskrat Falls
Gull Island
Muskrat Falls Project - CE-22 (Public) Page 9 of 40
Nalcor Energy - Lower Churchill Project
Hydraulic Modeling of the River - 2010 UpdateFinal Report - October 2010
H335459-MF1330-RPT-CA01-2501, Rev. 0, Page 3-1
3. New Bathymetric Information
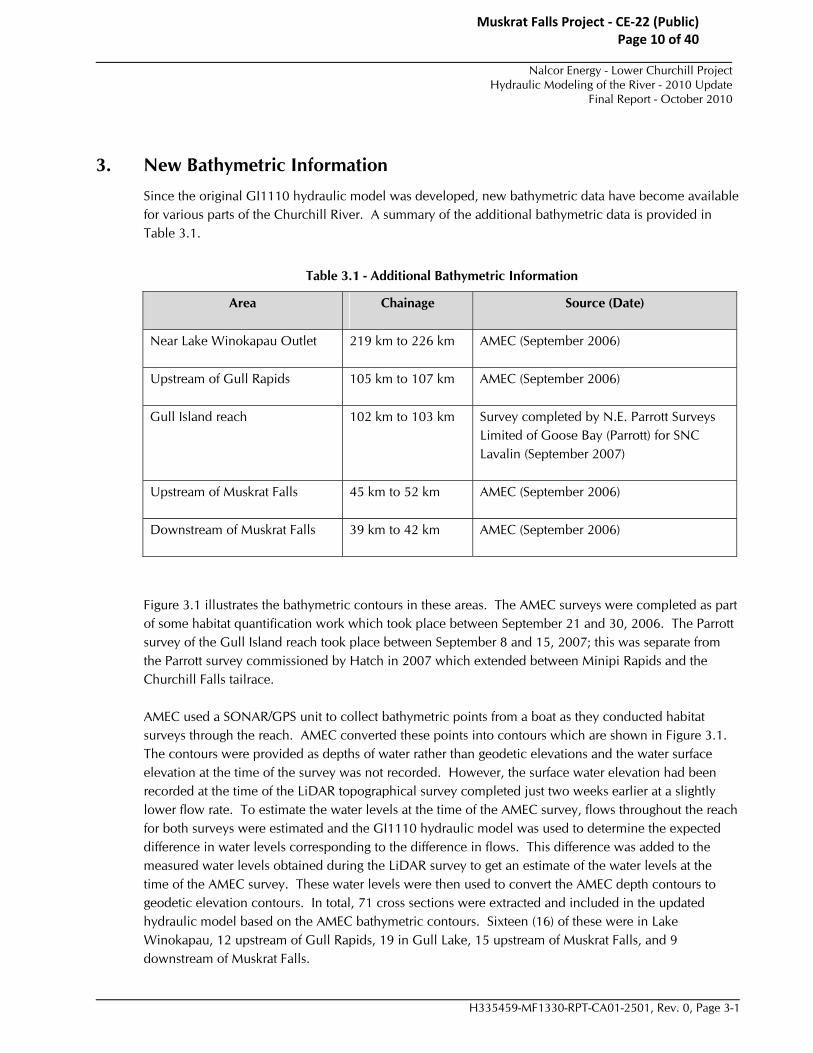
Since the original GI1110 hydraulic model was developed, new bathymetric data have become available for various parts of the Churchill River. A summary of the additional bathymetric data is provided in Table 3.1.
Table 3.1 - Additional Bathymetric Information
Area Chainage Source (Date)
Near Lake Winokapau Outlet 219 km to 226 km AMEC (September 2006)
Upstream of Gull Rapids 105 km to 107 km AMEC (September 2006)
Gull Island reach 102 km to 103 km Survey completed by N.E. Parrott Surveys Limited of Goose Bay (Parrott) for SNC Lavalin (September 2007)
Upstream of Muskrat Falls 45 km to 52 km AMEC (September 2006)
Downstream of Muskrat Falls 39 km to 42 km AMEC (September 2006)
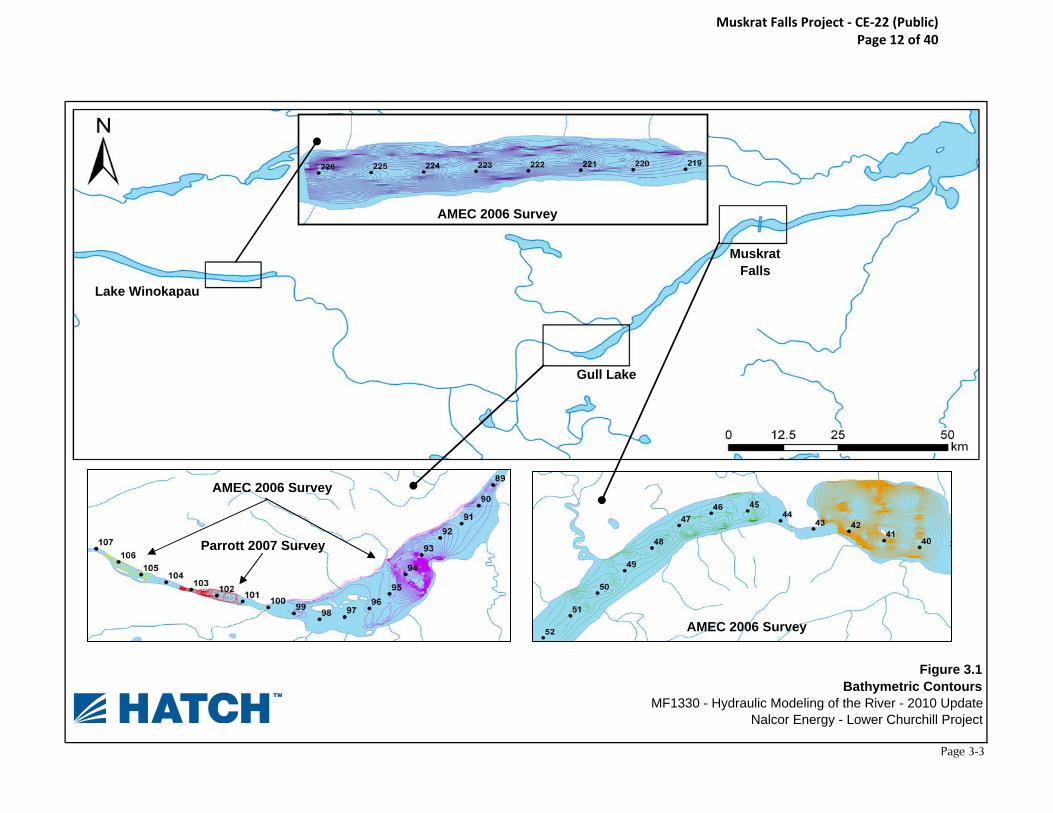
Figure 3.1 illustrates the bathymetric contours in these areas. The AMEC surveys were completed as part of some habitat quantification work which took place between September 21 and 30, 2006. The Parrott survey of the Gull Island reach took place between September 8 and 15, 2007; this was separate from the Parrott survey commissioned by Hatch in 2007 which extended between Minipi Rapids and the Churchill Falls tailrace.
AMEC used a SONAR/GPS unit to collect bathymetric points from a boat as they conducted habitat surveys through the reach. AMEC converted these points into contours which are shown in Figure 3.1. The contours were provided as depths of water rather than geodetic elevations and the water surface elevation at the time of the survey was not recorded. However, the surface water elevation had been recorded at the time of the LiDAR topographical survey completed just two weeks earlier at a slightly lower flow rate. To estimate the water levels at the time of the AMEC survey, flows throughout the reach for both surveys were estimated and the GI1110 hydraulic model was used to determine the expected difference in water levels corresponding to the difference in flows. This difference was added to the measured water levels obtained during the LiDAR survey to get an estimate of the water levels at the time of the AMEC survey. These water levels were then used to convert the AMEC depth contours to geodetic elevation contours. In total, 71 cross sections were extracted and included in the updated hydraulic model based on the AMEC bathymetric contours. Sixteen (16) of these were in Lake Winokapau, 12 upstream of Gull Rapids, 19 in Gull Lake, 15 upstream of Muskrat Falls, and 9 downstream of Muskrat Falls.
Muskrat Falls Project - CE-22 (Public) Page 10 of 40

Nalcor Energy - Lower Churchill Project
Hydraulic Modeling of the River - 2010 UpdateFinal Report - October 2010
H335459-MF1330-RPT-CA01-2501, Rev. 0, Page 3-2
Bathymetric contours in the Gull Island reach (based on surveys completed by Parrott in 2007) were provided as geodetic elevation contours, so the procedure noted above was not required for that area. However, the 2007 Parrott contours were compared with the raw sounding data and significant differences between the derived contours and the source data were noted in some areas. Also it was determined that towards the upstream and downstream extents of the contour data, there were very little raw data from which to develop these contours which suggests that the contours may be unrealistic towards the edges of the surveyed area. Based on these problems with the bathymetric contours, some of the original cross sections (based on surveys completed in the 1970s) were considered to be more reliable. In total, nine new cross sections based on the 2007 Parrot survey were added to the model (102.1 km, 102.2 km, 102.3 km, 102.4 km, 102.5 km, 102.6 km, 102.8 km, 103 km, and 103.2 km).
In total, 80 new cross sections were included in the hydraulic model (not including additional sections related to the model extension at the downstream end described in Section 2). All of the new cross sections were compared to cross sections from the original model so that any significant discrepancies could be identified. In general, the new bathymetric sections were very similar to the original cross sections; as such, very little difference in model results was expected.
Figure 3.2 illustrates the location of the 80 new cross sections that were included in the updated hydraulic model. Appendix A includes a list of all of the cross sections in the hydraulic model and the source of bathymetry for each.
Muskrat Falls Project - CE-22 (Public) Page 11 of 40
Page 3-3
Figure 3.1Bathymetric Contours
MF1330 - Hydraulic Modeling of the River - 2010 UpdateNalcor Energy - Lower Churchill Project
AMEC 2006 Survey
AMEC 2006 Survey
AMEC 2006 Survey
Parrott 2007 Survey
Gull Lake
Muskrat Falls
Lake Winokapau
Muskrat Falls Project - CE-22 (Public) Page 12 of 40

Page 3-4
Figure 3.2New Hydraulic Model Cross Sections
MF1330 - Hydraulic Modeling of the River - 2010 UpdateNalcor Energy - Lower Churchill Project
Lake Winokapau
Gull Lake
Muskrat Falls
Muskrat Falls Project - CE-22 (Public) Page 13 of 40
Nalcor Energy - Lower Churchill Project
Hydraulic Modeling of the River - 2010 UpdateFinal Report - October 2010
H335459-MF1330-RPT-CA01-2501, Rev. 0, Page 4-1
4. Updated Project Layouts
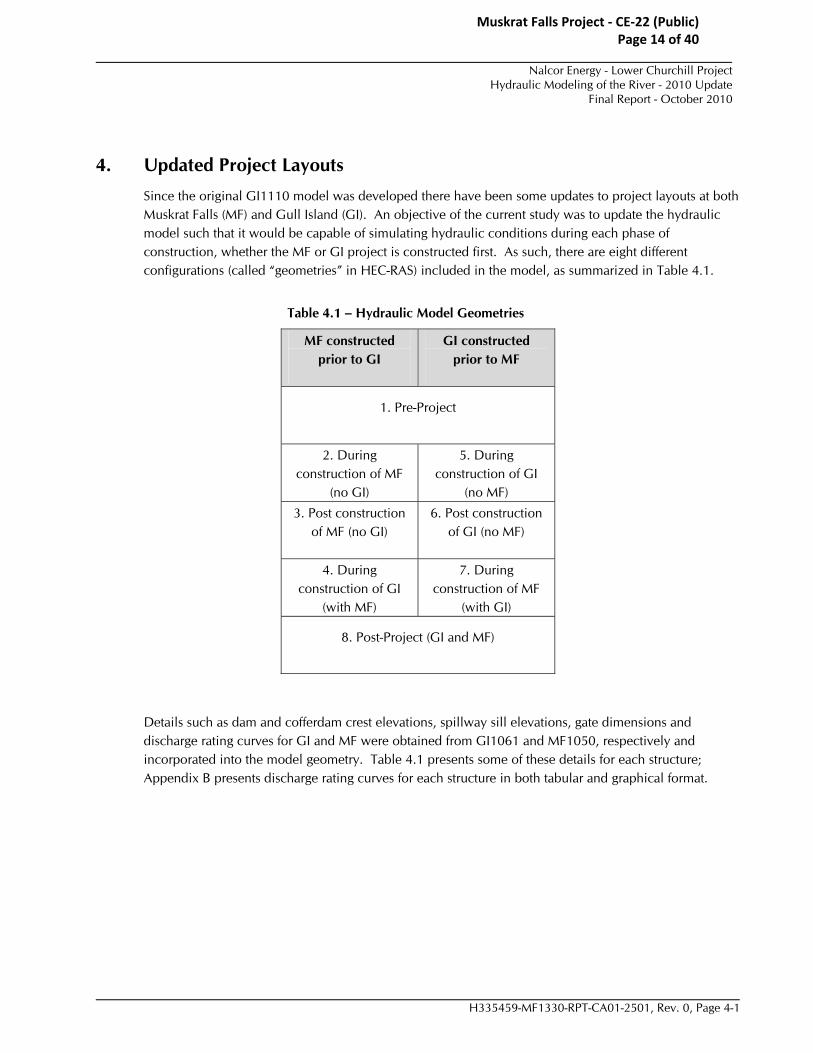
Since the original GI1110 model was developed there have been some updates to project layouts at both Muskrat Falls (MF) and Gull Island (GI). An objective of the current study was to update the hydraulic model such that it would be capable of simulating hydraulic conditions during each phase of construction, whether the MF or GI project is constructed first. As such, there are eight different configurations (called “geometries” in HEC-RAS) included in the model, as summarized in Table 4.1.
Table 4.1 – Hydraulic Model Geometries
MF constructed prior to GI
GI constructed prior to MF
1. Pre-Project
2. During construction of MF
(no GI)
5. During construction of GI
(no MF)
3. Post construction of MF (no GI)
6. Post construction of GI (no MF)
4. During construction of GI
(with MF)
7. During construction of MF
(with GI)
8. Post-Project (GI and MF)
Details such as dam and cofferdam crest elevations, spillway sill elevations, gate dimensions and discharge rating curves for GI and MF were obtained from GI1061 and MF1050, respectively and incorporated into the model geometry. Table 4.1 presents some of these details for each structure; Appendix B presents discharge rating curves for each structure in both tabular and graphical format.
Muskrat Falls Project - CE-22 (Public) Page 14 of 40

Nalcor Energy - Lower Churchill Project
Hydraulic Modeling of the River - 2010 UpdateFinal Report - October 2010
H335459-MF1330-RPT-CA01-2501, Rev. 0, Page 4-2
Table 4.2 - Structure Details
Structure Dam Crest Elevation
Discharge Facility Sill Elevation
Muskrat Falls Cofferdam
26 m 4 Spillway Gates
(12.5 m wide x 14.8 m high)
Gates: 5 m
Muskrat Falls Main Dam
45.5 m South
39.5 m North
4 Spillway Gates
(12.5 m wide x 14.8 m high)
Overflow North Dam (430 m long)
Gates: 5 m
Overflow North Dam: 39.5 m
Gull Island Cofferdam
61.4 m 2 Inverted U-shaped Diversion Tunnels (14 m wide x 20.15 m high)
Tunnels: 16 m
Gull Island Main Dam
129 m 8 Spillway Gates
(12.9 m wide x 20.1 m high)
Gates: 105.4 m
Muskrat Falls Project - CE-22 (Public) Page 15 of 40

Nalcor Energy - Lower Churchill Project
Hydraulic Modeling of the River - 2010 UpdateFinal Report - October 2010
H335459-MF1330-RPT-CA01-2501, Rev. 0, Page 5-1
5. Model Calibration Check
Both steady and unsteady versions of the hydraulic model were updated as part of this work. In a steady state model, flow does not vary with time. In an unsteady model, the variation of flow over time is simulated, for example in the propagation of a natural or dam breach flood. The calibration of both models is discussed below.
5.1 Steady State Model
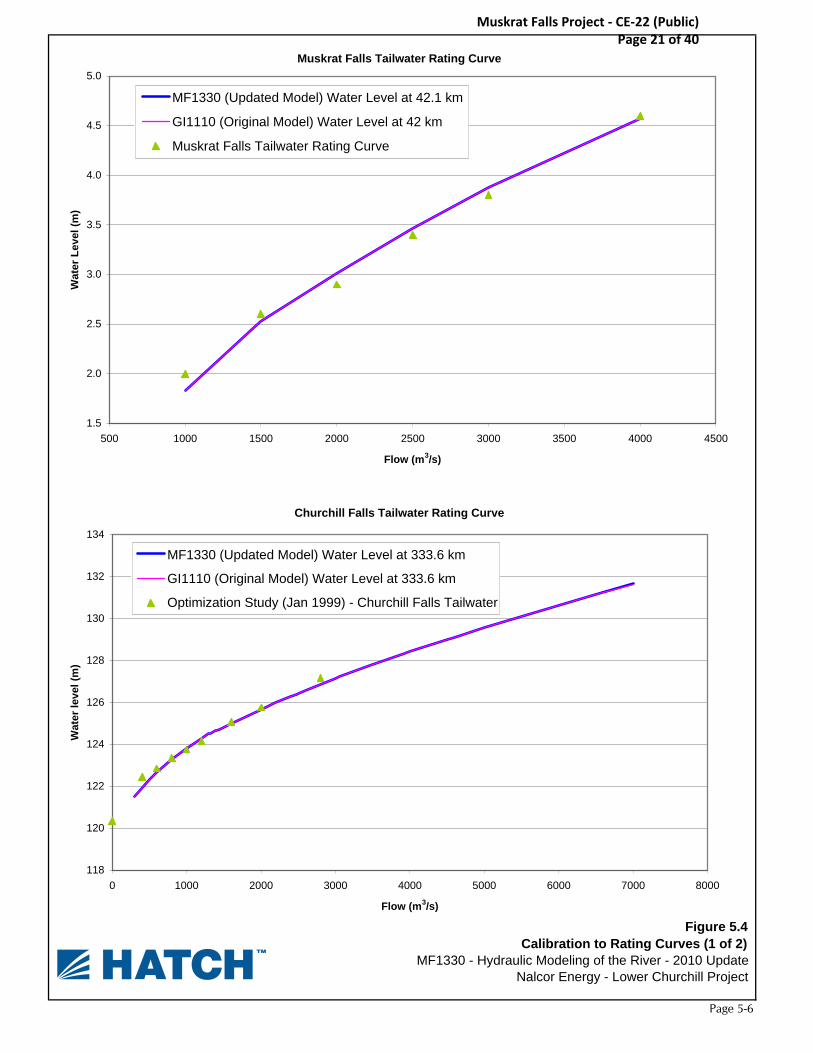
Calibration of the original GI1110 hydraulic model was completed using a variety of data sources including surveyed water levels and rating curves. The same calibration data were used to check the calibration of the updated model.
Figures 5.1 to 5.5 illustrate the results of the calibration for both the original GI1110 model and the updated MF1330 model. As shown, the results of both models are similar and an acceptable calibration was achieved in both models throughout the reach. There are a few areas in which simulated levels differed from observed levels by more than expected. These areas are summarized in Table 5.1 and a comment is provided regarding the implications of these discrepancies and how the accuracy may be increased if required.
Table 5.1 - Summary of Calibration Discrepancies
Location (Chainage) Calibration Result Comment
Lake Winokapau Outlet (206 km to 210 km)
Simulated levels are lower than observed by 2 - 5 m for the flow during the 2007 Parrott Survey.
This discrepancy has not been a concern for the studies completed to date. If more accuracy is desired for specific analyses in this area, additional bathymetry should be obtained.
Muskrat Falls hydrometric station (43.8 km)
Simulated levels are lower than observed by approximately 0.5 m for most flows.
This discrepancy has not been a concern for the studies completed to date. The assumed location of the hydrometric station may be slightly inaccurate which could affect the water levels since the profile is steep in this region. If required, an attempt could be made to increase the accuracy by adding additional cross sections.
Blackrock Bridge (24.1 km)
Simulated levels are higher than observed by approximately 0.3 m for average flows.
This discrepancy has not been a concern for the studies completed to date. It is possible that the rating curve was developed for different tidal condition than used for simulations. Accuracy of rating curve should be checked prior to collecting additional bathymetry.
Muskrat Falls Project - CE-22 (Public) Page 16 of 40

Nalcor Energy - Lower Churchill Project
Hydraulic Modeling of the River - 2010 UpdateFinal Report - October 2010
H335459-MF1330-RPT-CA01-2501, Rev. 0, Page 5-2
Additional calibration information in the Gull Island reach was obtained by Hatch for GI1500, Detailed Engineering for Gull Island South Side Access. During the 2007 Parrott survey in the Gull Island reach, water levels were measured at both North and South shores for each surveyed transect between chainage 102.9 km and 103.5 km. These measured water levels were compared to simulated water levels for the flow estimated at the time of the survey; water levels were within 10 cm for each cross section in this short reach. LiDAR topographic contours at 30 cm intervals were available between approximate chainages 100.8 km and 103.0 km. Although LiDAR cannot directly measure the elevation of the water surface, the elevation of the land where the LiDAR contours cross the river can be assumed to equal the water surface elevation. A slight adjustment was made to the 1975 survey section at 101.9 km to ensure a good match between measured and simulated water levels in this reach.
Although there are water level gauges upstream and downstream of Grizzle Rapids that have been in operation since September 2008, the data has not yet been released by Environment Canada from its internal quality control process and therefore could not be used to check the calibration of the hydraulic model in this study.
5.2 Unsteady Model
As part of GI1140 (PMF and Construction Design Flood Study), the GI1110 hydraulic model was used for channel routing in place of the SSARR hydrological model. Dynamic hydraulic models are based on the physical characteristics of the river channel and solution of the Saint-Venant equations of unsteady flow and are not subject to the uncertainties of extrapolation applicable to hydrological routing approaches. The calibration of the GI1110 hydraulic model under unsteady flow conditions was tested for 1981 since this was the year in which the hydrograph at Muskrat Falls predicted by the SSARR hydrological model was in closest agreement with recorded flows. Based on this good agreement, the lateral inflow hydrographs (tributary flows) predicted by the hydrological model for 1981 were also assumed to be close to actual. In the current study, the calibration of the updated unsteady hydraulic model was checked using the same year. The outflows from the Churchill Falls powerhouse (03OD005) and lateral inflow hydrographs from the SSARR model were routed through the hydraulic model. Simulated flows at Muskrat Falls were compared with measured flows (at Water Survey of Canada Station 03OE001) and the hydrographs were in close agreement, especially at the peak of the hydrograph, as shown in Figure 5.6.
Muskrat Falls Project - CE-22 (Public) Page 17 of 40

Page 5-3
Figure 5.1Calibration to 2006 Parrott Survey Water Levels
MF1330 - Hydraulic Modeling of the River - 2010 UpdateNalcor Energy - Lower Churchill Project
-10
-8
-6
-4
-2
0
2
4
-5 0 5 10 15 20 25 30 35 40
Chainage (km)
Ele
va
tio
n (
m)
MF1330 (Updated Model) Water Surface Profile
GI1110 (Original Model) Water Surface Profile
Parrott 2006 Survey
MF1330 (Updated Model) Thalweg
Muskrat Falls Project - CE-22 (Public) Page 18 of 40

Page 5-4
Figure 5.2Calibration to 2006 LiDAR Survey Water Levels
MF1330 - Hydraulic Modeling of the River - 2010 UpdateNalcor Energy - Lower Churchill Project
0
10
20
30
40
50
60
70
40 50 60 70 80 90 100 110 120 130
Chainage (km)
Ele
va
tio
n (
m)
MF1330 (Updated Model) Water Surface Profile
GI1110 (Original Model) Water Surface Profile
LiDAR 2006 Survey
MF1330 (Updated Model) Thalweg
Muskrat Falls Project - CE-22 (Public) Page 19 of 40

Page 5-5
Figure 5.3Calibration to 2007 Parrott Survey Water Levels
MF1330 - Hydraulic Modeling of the River - 2010 UpdateNalcor Energy - Lower Churchill Project
50
60
70
80
90
100
110
120
130
120 170 220 270 320
Chainage (km)
Ele
va
tio
n (
m)
MF1330 (Updated Model) Water Surface Profile
GI1110 (Original Model) Water Surface Profile
Parrott 2007 Survey
MF1330 (Updated Model) Thalweg
Muskrat Falls Project - CE-22 (Public) Page 20 of 40
Page 5-6
Figure 5.4Calibration to Rating Curves (1 of 2)
MF1330 - Hydraulic Modeling of the River - 2010 UpdateNalcor Energy - Lower Churchill Project
Apr. 14, 2010
Muskrat Falls Tailwater Rating Curve
1.5
2.0
2.5
3.0
3.5
4.0
4.5
5.0
500 1000 1500 2000 2500 3000 3500 4000 4500
Flow (m3/s)
Wat
er L
evel
(m
)
MF1330 (Updated Model) Water Level at 42.1 km
GI1110 (Original Model) Water Level at 42 km
Muskrat Falls Tailwater Rating Curve
Churchill Falls Tailwater Rating Curve
118
120
122
124
126
128
130
132
134
0 1000 2000 3000 4000 5000 6000 7000 8000
Flow (m3/s)
Wat
er l
evel
(m
)
MF1330 (Updated Model) Water Level at 333.6 km
GI1110 (Original Model) Water Level at 333.6 km
Optimization Study (Jan 1999) - Churchill Falls Tailwater
Muskrat Falls Project - CE-22 (Public) Page 21 of 40

Page 5-7
Figure 5.5Calibration to Rating Curves (2 of 2)
MF1330 - Hydraulic Modeling of the River - 2010 UpdateNalcor Energy - Lower Churchill Project
Apr. 14, 2010
Muskrat Falls Hydrometric Station Rating Curve
12
14
16
18
20
22
24
0 1000 2000 3000 4000 5000 6000 7000 8000
Flow (m3/s)
Wat
er L
evel
(m
)
MF1330 (Updated Model) Water Level at 43.8 km
GI1110 (Original Model) Water Level at 43.8 km
Muskrat Falls Hydrometric Station Rating Curve
Blackrock Bridge Rating Curve
0.0
0.5
1.0
1.5
2.0
2.5
3.0
3.5
4.0
4.5
5.0
0 1000 2000 3000 4000 5000 6000 7000 8000
Flow (m3/s)
Wat
er L
evel
(m
)
MF1330 (Updated Model) Water Level at 24.1 km
GI1110 (Original Model) Water Level at 24.1 km
Blackrock Bridge Rating Curve
Muskrat Falls Project - CE-22 (Public) Page 22 of 40

Page 5-8
Figure 5.6Unsteady Model Calibration (1981) - Flows at Muskrat Falls Hydrometric Gauge
MF1330 - Hydraulic Modeling of the River - 2010 UpdateNalcor Energy - Lower Churchill Project
0
1000
2000
3000
4000
5000
6000
0 100 200 300 400 500 600 700 800
Time (6 hour steps) from March 31
Flo
w (
m3 /s
)
Measured
Modelled (SSARR Hydrological Model)
Modelled (HEC-RAS Hydraulic Model)
Muskrat Falls Project - CE-22 (Public) Page 23 of 40

Nalcor Energy - Lower Churchill Project
Hydraulic Modeling of the River - 2010 UpdateFinal Report - October 2010
H335459-MF1330-RPT-CA01-2501, Rev. 0, Page 6-1
6. Consistency Between Steady and Unsteady Hydraulic Models
Due to the extremely transient nature of unsteady flow simulations, the original GI1110 hydraulic model required modification to remove numerical instabilities for the PMF and Dam Break studies (GI1140 and GI1190, respectively). None of these modifications significantly changed the conveyance characteristics of the model, but added a great deal to its robustness in dealing with rapid change in discharge. The result was a very robust model that while adequately representing the hydraulic characteristics of the study area also allows for a wide range of simulations and discharge variations of several orders of magnitude. Modifications for the purpose of model stability in unsteady flow mode included simplifications of cross sectional geometry, addition of interpolated sections, and introduction of a “pilot” channel to smooth the channel bottom profile. Pilot channels are added to provide additional flow depth to the cross section without significantly affecting the total conveyance of the section. They typically take the shape of a small notch in the bottom of the cross section. Pilot channels are often required for the simulation of low flows as the model can become unstable if depths are too low. Also pilot channels can help to smooth out irregularities in the channel bottom which also helps the stability of the model. The original model without these modifications (the steady model) is favoured for estimating water levels in the reach under non-flood conditions; the unsteady model is used for the simulation of floods. After the two models were updated, a consistency check was performed to ensure that both models included the most up-to-date information, and that the only differences were for the purpose of model stability.
The user-defined cross sections in the two models are the same with one exception: the unsteady model does not include the user-defined section at chainage 200 km (downstream of Lake Winokapau), the bathymetry of which was obtained in a 1979 survey. This section presented an abrupt change in cross-sectional area compared to the adjacent sections, which tends to cause numerical instability in time-varying flow computations. It was found necessary to omit the section so as to simplify the model geometry and achieve computational stability. The effect of this simplification is only apparent for a short distance upstream and is not expected to influence the conveyance capacity of the reach during flood events.
The thalweg (channel bottom) profile of the two models is different as a result of the pilot channels that were introduced in the unsteady model for computational stability. These pilot channels add negligible conveyance area to the sections and therefore should not affect computed water levels. The minimum channel elevation of the pilot channels were calculated such that the average slope of the reach was maintained.
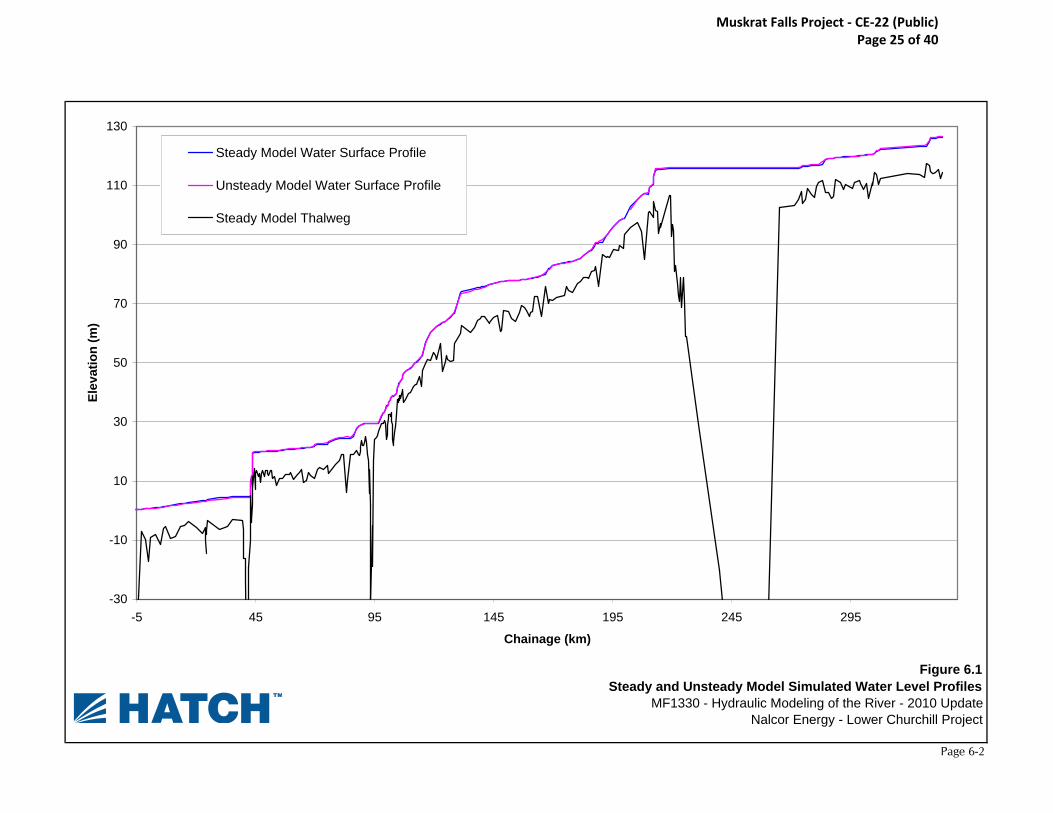
Simulated water levels from the two models for a flow approximately equal to the maximum annual flow were compared. Figure 6.1 compares the two water surface profiles. The water levels were within 0.5 m at 95 percent of the cross sections upstream of Goose Bay; the maximum difference between the two models was approximately one meter.
Muskrat Falls Project - CE-22 (Public) Page 24 of 40
Page 6-2
Figure 6.1Steady and Unsteady Model Simulated Water Level Profiles
MF1330 - Hydraulic Modeling of the River - 2010 UpdateNalcor Energy - Lower Churchill Project
-30
-10
10
30
50
70
90
110
130
-5 45 95 145 195 245 295
Chainage (km)
Ele
vati
on
(m
)
Steady Model Water Surface Profile
Unsteady Model Water Surface Profile
Steady Model Thalweg
Muskrat Falls Project - CE-22 (Public) Page 25 of 40
Nalcor Energy - Lower Churchill Project
Hydraulic Modeling of the River - 2010 UpdateFinal Report - October 2010
H335459-MF1330-RPT-CA01-2501, Rev. 0, Page 7-1
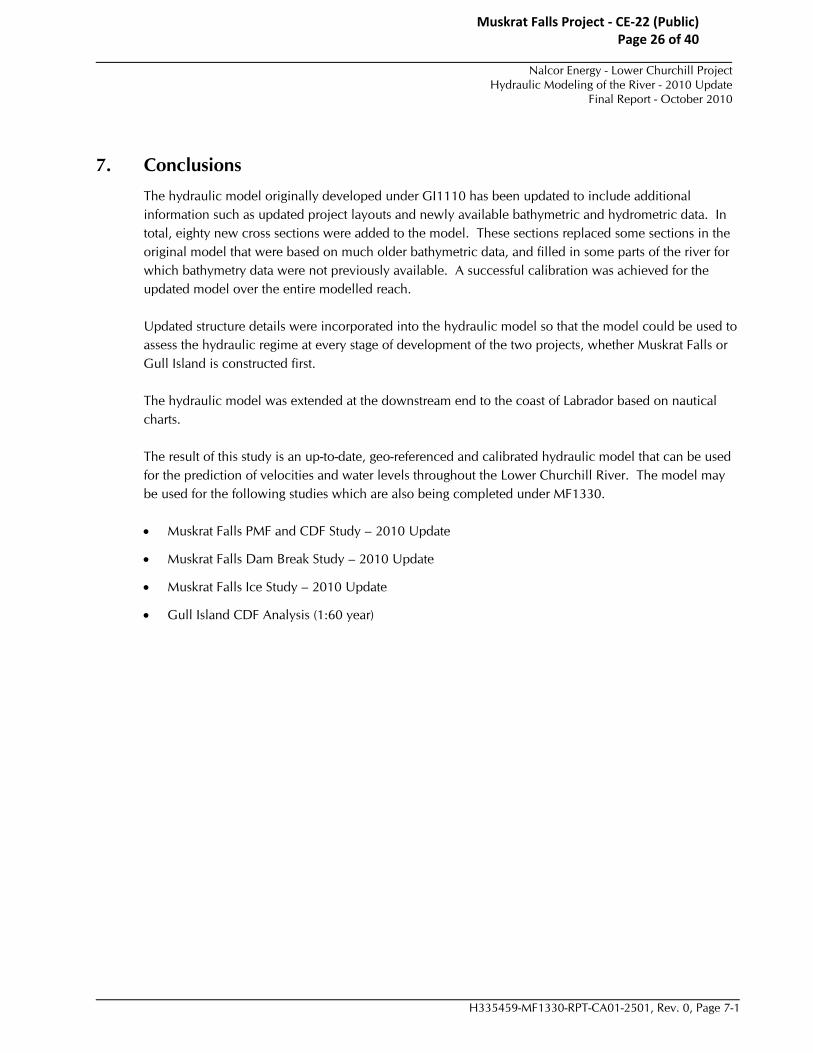
7. Conclusions
The hydraulic model originally developed under GI1110 has been updated to include additional information such as updated project layouts and newly available bathymetric and hydrometric data. In total, eighty new cross sections were added to the model. These sections replaced some sections in the original model that were based on much older bathymetric data, and filled in some parts of the river for which bathymetry data were not previously available. A successful calibration was achieved for the updated model over the entire modelled reach.
Updated structure details were incorporated into the hydraulic model so that the model could be used to assess the hydraulic regime at every stage of development of the two projects, whether Muskrat Falls or Gull Island is constructed first.
The hydraulic model was extended at the downstream end to the coast of Labrador based on nautical charts.
The result of this study is an up-to-date, geo-referenced and calibrated hydraulic model that can be used for the prediction of velocities and water levels throughout the Lower Churchill River. The model may be used for the following studies which are also being completed under MF1330.
Muskrat Falls PMF and CDF Study – 2010 Update
Muskrat Falls Dam Break Study – 2010 Update
Muskrat Falls Ice Study – 2010 Update
Gull Island CDF Analysis (1:60 year)
Muskrat Falls Project - CE-22 (Public) Page 26 of 40

Nalcor Energy - Lower Churchill Project
Hydraulic Modeling of the River - 2010 UpdateFinal Report - October 2010
H335459-MF1330-RPT-CA01-2501, Rev. 0
Appendix A
Source of Bathymetry for Model Cross Sections
Muskrat Falls Project - CE-22 (Public) Page 27 of 40

Page 1 of 8
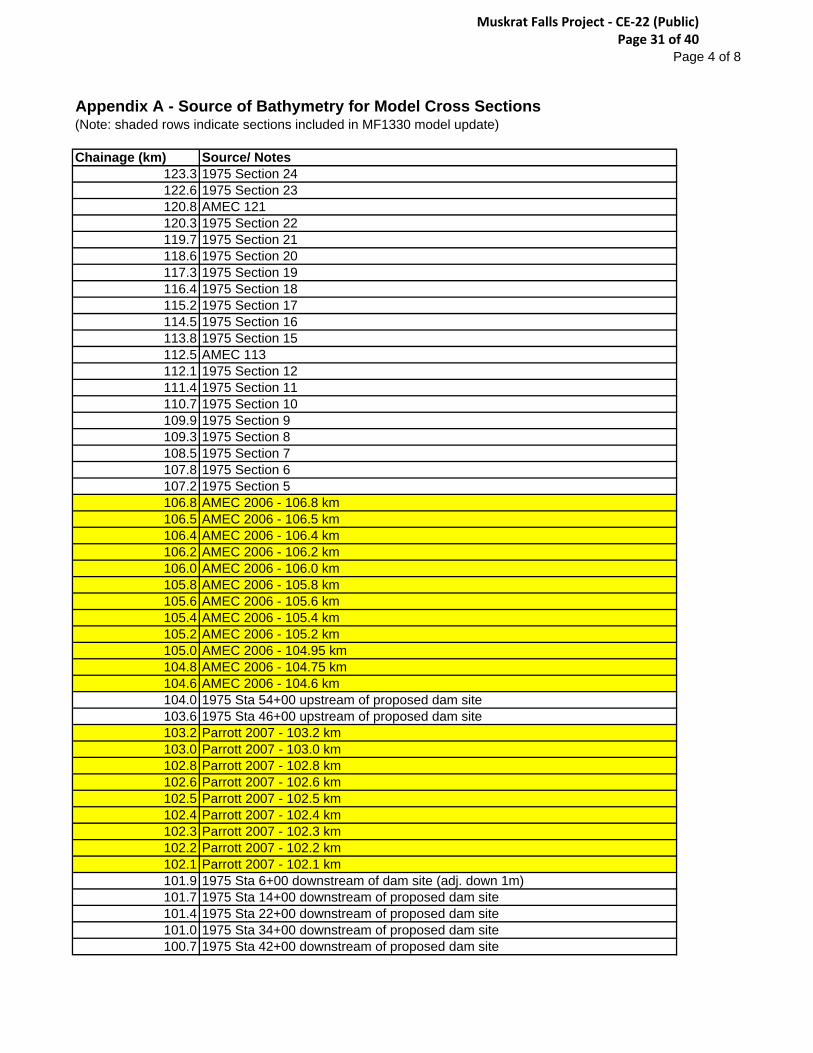
Appendix A - Source of Bathymetry for Model Cross Sections(Note: shaded rows indicate sections included in MF1330 model update)
Chainage (km) Source/ Notes333.6 2007 Parrott 334332.7 1975 Section 100331.9 1975 Section 101330.6 1975 Section 102329.9 2007 Parrott 330329.3 1975 Section 103328.4 2007 Parrott 328327.9 1975 Section 104 adj. up 1 m326.8 1975 Section 105326.0 2007 Parrott 326324.0 2007 Parrott 324318.8 2007 Parrott 319307.7 1975 Section 15306.7 1975 Section 16305.8 2007 Parrott 306305.0 1975 Section 17304.0 2007 Parrott 304303.9 1975 Section 18302.6 1975 Section 19301.6 1975 Section 20300.4 1975 Section 21299.0 1975 Section 22298.5 1975 Section 23296.4 1975 Section 24295.7 1975 Section 25292.8 1975 Section 27291.7 1975 Section 28290.7 1975 Section 29288.7 1975 Section 30287.9 1975 Section 31286.7 1975 Section 32285.4 2006 AMEC 285284.4 1975 Section 34283.0 1975 Section 35281.5 Derived section280.7 1975 Section 36 adj. down 1 m279.6 2006 AMEC 280278.4 1975 Section 38 adj. down 2 m276.7 1975 Section 39275.8 1975 Section 40274.8 2006 AMEC 275274.1 1975 Section 41272.8 1975 Section 42271.5 2006 AMEC 271265.0 2006 AMEC 265260.0 2006 AMEC 260250.0 2006 AMEC 250240.0 2006 AMEC 240
Muskrat Falls Project - CE-22 (Public) Page 28 of 40

Page 2 of 8
Appendix A - Source of Bathymetry for Model Cross Sections(Note: shaded rows indicate sections included in MF1330 model update)
Chainage (km) Source/ Notes231.0 2006 AMEC 230226.0 AMEC 2006 - 226 km225.5 AMEC 2006 - 225.5 km225.0 AMEC 2006 - 225 km224.5 AMEC 2006 - 224.5 km224.0 AMEC 2006 - 224 km223.5 AMEC 2006 - 223.5 km223.0 AMEC 2006 - 223 km222.5 AMEC 2006 - 222.5 km222.0 AMEC 2006 - 222 km221.5 AMEC 2006 - 221.5 km221.0 AMEC 2006 - 221 km220.5 AMEC 2006 - 220.5 km220.0 AMEC 2006 - 220 km219.5 AMEC 2006 - 219.5 km219.0 AMEC 2006 - 219 km218.6 AMEC 2006 - 218.6 km215.2 1979 Section H 74 adj. up 7 m215.1 2007 Parrott 215214.4 1979 Section H 77 adj. up 7 m213.7 1979 Section H 76 adj. up 7 m213.0 1979 Section 77 H adj. up 7 m212.1 1979 Section 78 H adj. up 7.5 m212.0 2007 Parrott 212210.4 2007 Parrott 210.5210.1 2007 Parrott 210208.5 2007 Parrott 209 (assumptions req'd)207.1 2007 Parrott 207205.5 2007 Parrott 205202.4 2006 AMEC 202200.0 1979 Section 2 H adj. up 2 m199.4 1979 Section 3 H adj. up 2.5 m197.9 2007 Parrott 198197.4 1979 Section 4 H adj. up 3 m195.5 1979 Section 5 H adj. up 3 m193.8 2006 AMEC 194192.8 2006 AMEC 193192.4 1979 Section 7 H adj. up 1.5 m190.9 1979 Section 8 H adj. up 4 m189.1 2007 Parrott 189189.0 1979 Section 9 H adj. up 2 m187.9 2007 Parrott 188187.5 1979 Section 10 H adj. up 2.5 m185.9 1979 Section 11 H adj. up 2 m185.0 2007 Parrott 185184.4 1979 Section 12 H adj. up 2.1 m182.7 1979 Section 13 H adj. up 2 m181.4 1979 Section 14 H adj. up 2 m
Muskrat Falls Project - CE-22 (Public) Page 29 of 40

Page 3 of 8
Appendix A - Source of Bathymetry for Model Cross Sections(Note: shaded rows indicate sections included in MF1330 model update)
Chainage (km) Source/ Notes180.0 2007 Parrott 180178.0 1979 Section 16 H adj. up 3 m176.5 2006 AMEC 177175.4 2007 Parrott 175174.6 1979 Section 18 H adj. up 3 m173.2 1979 Section 19 H adj. up 3 m171.3 1979 Section 20 H adj. up 3 m169.6 2007 PARROTT 170168.4 1979 Section 22 H (Interpolated elevation) adj. up 3 m168.0 2007 PARROTT 168166.7 1979 Section 23 H adj. up 3.5 m165.0 2007 PARROTT 165163.5 1979 Section 25 H (Interpolated elevation) adj. up 0.5 m162.0 1979 Section 26 H (Interpolated elevation) adj. up 2 m161.3 2007 PARROTT 162160.6 1979 Section 27 H (Interpolated elevation) adj. up 2 m160.0 2007 PARROTT 160158.7 1979 Section 28 H (Interpolated elevation) adj. up 1.5 m158.0 2007 PARROTT 158156.7 1979 Section 29 H (Interpolated elevation) adj. up 4 m155.9 1979 Section 30 H (Interpolated elevation) adj. up 4 m154.0 2006 AMEC 154152.5 1979 Section 32 H (Interpolated elevation) adj. up 5.4 m151.2 1979 Section 33 H (Interpolated elevation) adj. up 6 m149.2 1979 Section 34 H (Interpolated elevation) adj. up 6.6 m148.9 2007 PARROTT 149148.3 1979 Section 35 H (Interpolated elevation) adj. up 6 m148.0 2007 PARROTT 148146.7 1979 Section 36 H (Interpolated elevation) adj. up 7 m145.1 1979 Section 37 H (Interpolated elevation) adj. up 8 m144.7 2007 PARROTT 145143.4 1979 Section 38 H adj. up 10 m143.2 2007 PARROTT 143141.1 1979 Section 39 H adj. up 9.5 m140.3 1979 Section 40 H adj. up 9 m140.0 AMEC 140139.4 1979 Section 41 H adj. up 9 m138.1 2007 PARROTT 138137.1 2007 PARROTT 137135.1 2007 PARROTT 135131.5 2007 PARROTT 131.5 km (Above Minipi Rapids)131.1 2007 PARROTT 131.1 (Above Minipi Rapids)128.6 1975 Section 28128.0 2007 PARROTT 128126.9 1975 Section 27125.6 1975 Section 26125.0 AMEC 125124.6 1975 Section 25
Muskrat Falls Project - CE-22 (Public) Page 30 of 40
Page 4 of 8
Appendix A - Source of Bathymetry for Model Cross Sections(Note: shaded rows indicate sections included in MF1330 model update)
Chainage (km) Source/ Notes123.3 1975 Section 24122.6 1975 Section 23120.8 AMEC 121120.3 1975 Section 22119.7 1975 Section 21118.6 1975 Section 20117.3 1975 Section 19116.4 1975 Section 18115.2 1975 Section 17114.5 1975 Section 16113.8 1975 Section 15112.5 AMEC 113112.1 1975 Section 12111.4 1975 Section 11110.7 1975 Section 10109.9 1975 Section 9109.3 1975 Section 8108.5 1975 Section 7107.8 1975 Section 6107.2 1975 Section 5106.8 AMEC 2006 - 106.8 km106.5 AMEC 2006 - 106.5 km106.4 AMEC 2006 - 106.4 km106.2 AMEC 2006 - 106.2 km106.0 AMEC 2006 - 106.0 km105.8 AMEC 2006 - 105.8 km105.6 AMEC 2006 - 105.6 km105.4 AMEC 2006 - 105.4 km105.2 AMEC 2006 - 105.2 km105.0 AMEC 2006 - 104.95 km104.8 AMEC 2006 - 104.75 km104.6 AMEC 2006 - 104.6 km104.0 1975 Sta 54+00 upstream of proposed dam site103.6 1975 Sta 46+00 upstream of proposed dam site103.2 Parrott 2007 - 103.2 km103.0 Parrott 2007 - 103.0 km102.8 Parrott 2007 - 102.8 km102.6 Parrott 2007 - 102.6 km102.5 Parrott 2007 - 102.5 km102.4 Parrott 2007 - 102.4 km102.3 Parrott 2007 - 102.3 km102.2 Parrott 2007 - 102.2 km102.1 Parrott 2007 - 102.1 km101.9 1975 Sta 6+00 downstream of dam site (adj. down 1m)101.7 1975 Sta 14+00 downstream of proposed dam site101.4 1975 Sta 22+00 downstream of proposed dam site101.0 1975 Sta 34+00 downstream of proposed dam site100.7 1975 Sta 42+00 downstream of proposed dam site
Muskrat Falls Project - CE-22 (Public) Page 31 of 40
Page 5 of 8
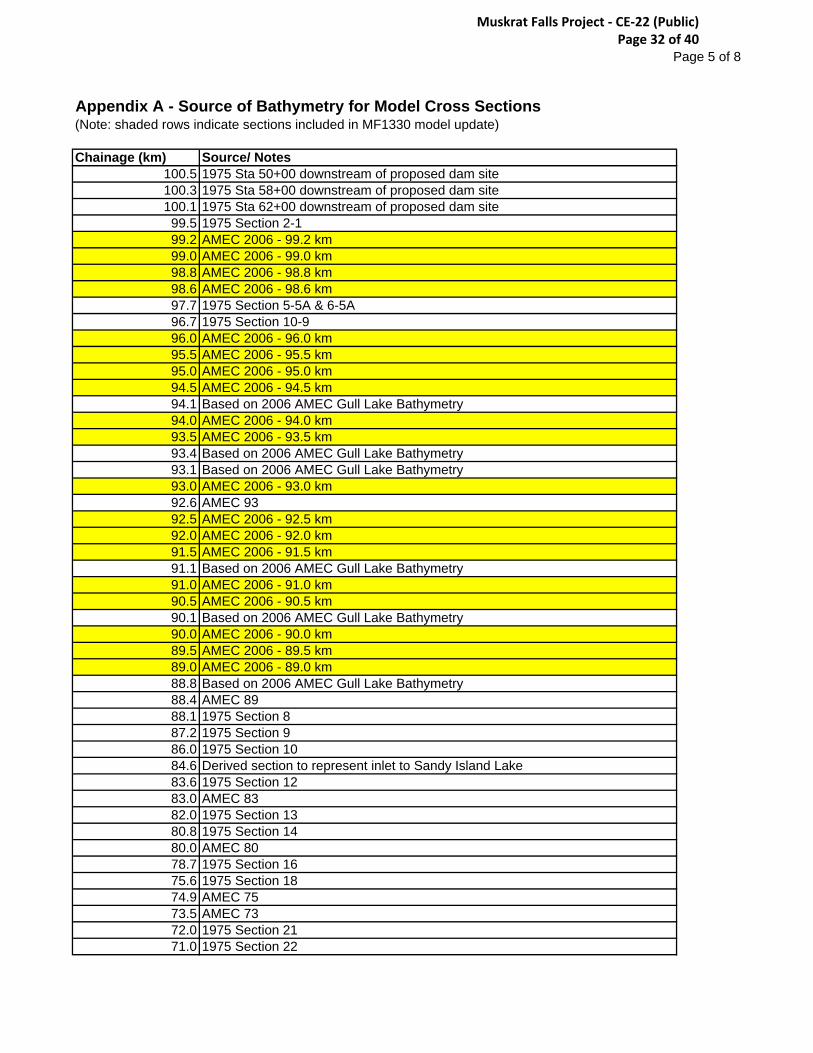
Appendix A - Source of Bathymetry for Model Cross Sections(Note: shaded rows indicate sections included in MF1330 model update)
Chainage (km) Source/ Notes100.5 1975 Sta 50+00 downstream of proposed dam site100.3 1975 Sta 58+00 downstream of proposed dam site100.1 1975 Sta 62+00 downstream of proposed dam site99.5 1975 Section 2-199.2 AMEC 2006 - 99.2 km99.0 AMEC 2006 - 99.0 km98.8 AMEC 2006 - 98.8 km98.6 AMEC 2006 - 98.6 km97.7 1975 Section 5-5A & 6-5A96.7 1975 Section 10-996.0 AMEC 2006 - 96.0 km95.5 AMEC 2006 - 95.5 km95.0 AMEC 2006 - 95.0 km94.5 AMEC 2006 - 94.5 km94.1 Based on 2006 AMEC Gull Lake Bathymetry94.0 AMEC 2006 - 94.0 km93.5 AMEC 2006 - 93.5 km93.4 Based on 2006 AMEC Gull Lake Bathymetry93.1 Based on 2006 AMEC Gull Lake Bathymetry93.0 AMEC 2006 - 93.0 km92.6 AMEC 9392.5 AMEC 2006 - 92.5 km92.0 AMEC 2006 - 92.0 km91.5 AMEC 2006 - 91.5 km91.1 Based on 2006 AMEC Gull Lake Bathymetry91.0 AMEC 2006 - 91.0 km90.5 AMEC 2006 - 90.5 km90.1 Based on 2006 AMEC Gull Lake Bathymetry90.0 AMEC 2006 - 90.0 km89.5 AMEC 2006 - 89.5 km89.0 AMEC 2006 - 89.0 km88.8 Based on 2006 AMEC Gull Lake Bathymetry88.4 AMEC 8988.1 1975 Section 887.2 1975 Section 986.0 1975 Section 1084.6 Derived section to represent inlet to Sandy Island Lake83.6 1975 Section 1283.0 AMEC 8382.0 1975 Section 1380.8 1975 Section 1480.0 AMEC 8078.7 1975 Section 1675.6 1975 Section 1874.9 AMEC 7573.5 AMEC 7372.0 1975 Section 2171.0 1975 Section 22
Muskrat Falls Project - CE-22 (Public) Page 32 of 40

Page 6 of 8
Appendix A - Source of Bathymetry for Model Cross Sections(Note: shaded rows indicate sections included in MF1330 model update)
Chainage (km) Source/ Notes69.8 2006 AMEC 7069.6 1975 Section 2368.0 2006 AMEC 6867.2 1975 Section 2566.5 1975 Section 2665.2 1975 Section 2764.4 2006 AMEC 6463.2 1975 Section 2862.3 1975 Section 2961.0 1975 Section 3059.6 1975 Section 3159.0 1975 Section 3257.5 1975 Section 3356.2 1975 Section 3455.0 1975 Section 3553.6 AMEC 5453.0 1975 Section 3752.0 1975 Section 3851.5 AMEC 2006 - 51.5 km51.0 AMEC 2006 - 51.0 km50.5 AMEC 2006 - 50.5 km50.0 AMEC 2006 - 50.0 km49.7 AMEC 2006 - 49.7 km49.0 AMEC 2006 - 49.0 km48.5 AMEC 2006 - 48.5 km48.0 AMEC 2006 - 48.0 km47.5 AMEC 2006 - 47.5 km47.0 AMEC 2006 - 47.0 km46.5 AMEC 2006 - 46.5 km46.0 AMEC 2006 - 46.0 km45.5 AMEC 2006 - 45.5 km45.0 AMEC 2006 - 45.0 km44.8 AMEC 4544.5 AMEC 2006 - 44.5 km43.8 Based on Geoscott Exploration Consultants Contours (1998)43.7 Based on Geoscott Exploration Consultants Contours (1998)43.6 Based on Geoscott Exploration Consultants Contours (1998)43.5 Based on Geoscott Exploration Consultants Contours (1998)43.3 Based on Geoscott Exploration Consultants Contours (1998)43.1 Based on Geoscott Exploration Consultants Contours (1998)42.8 Based on Geoscott Explorations Consultants Contours (1998)42.7 Based on Geoscott Exploration Consultants Contours (1998)42.1 AMEC 2006 - 42.1 km41.8 AMEC 2006 - 41.8 km41.4 AMEC 2006 - 41.4 km41.1 AMEC 2006 - 41.1 km40.8 AMEC 2006 - 40.8 km40.5 AMEC 2006 - 40.5 km
Muskrat Falls Project - CE-22 (Public) Page 33 of 40

Page 7 of 8
Appendix A - Source of Bathymetry for Model Cross Sections(Note: shaded rows indicate sections included in MF1330 model update)
Chainage (km) Source/ Notes40.0 AMEC 2006 - 40.0 km39.7 AMEC 2006 - 39.7 km39.5 AMEC 2006 - 39.5 km35.0 2006 PARROTT 3533.0 2006 PARROTT 3329.8 2006 PARROTT 3024.5 2006 PARROTT24.2 Based on 2006 PARROTT survey points - upstream of causeway24.2 Based on 2006 PARROTT survey points - directly upstream of causeway24.1 Blackrock Bridge24.1 Based on 2006 PARROTT survey points - directly downstream of causeway24.1 Based on 2006 PARROTT survey points - downstream of causeway23.7 2006 PARROTT22.6 2006 PARROTT20.0 2006 PARROTT 2016.7 2006 PARROTT 1715.2 2006 PARROTT 1513.3 2006 PARROTT 1311.1 2006 PARROTT 119.2 2006 PARROTT 97.0 2006 PARROTT 76.3 2006 PARROTT 65.0 2006 PARROTT 52.8 2006 PARROTT 30.8 2006 PARROTT 1
-0.2 2006 PARROTT 0-1.5 2006 PARROTT -1-3.0 2006 PARROTT -2-4.8 Nautical Charts-9.4 Nautical Charts
-11.6 Nautical Charts-16.1 Nautical Charts-21.4 Nautical Charts-27.3 Nautical Charts-31.8 Nautical Charts-37.4 Nautical Charts-42.5 Nautical Charts-47.9 Nautical Charts-53.6 Nautical Charts-59.7 Nautical Charts-65.3 Nautical Charts-71.0 Nautical Charts-76.1 Nautical Charts-81.0 Nautical Charts-86.1 Nautical Charts-91.0 Nautical Charts-95.9 Nautical Charts
-101.0 Nautical Charts
Muskrat Falls Project - CE-22 (Public) Page 34 of 40
Page 8 of 8
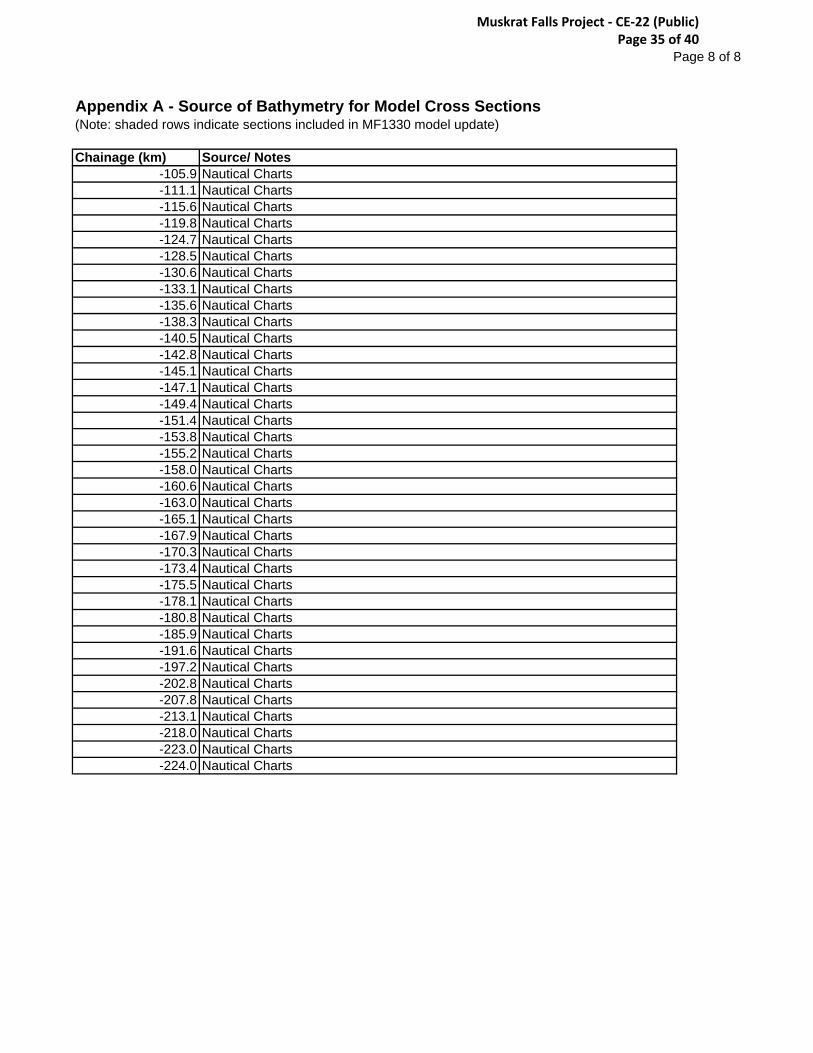
Appendix A - Source of Bathymetry for Model Cross Sections(Note: shaded rows indicate sections included in MF1330 model update)
Chainage (km) Source/ Notes-105.9 Nautical Charts-111.1 Nautical Charts-115.6 Nautical Charts-119.8 Nautical Charts-124.7 Nautical Charts-128.5 Nautical Charts-130.6 Nautical Charts-133.1 Nautical Charts-135.6 Nautical Charts-138.3 Nautical Charts-140.5 Nautical Charts-142.8 Nautical Charts-145.1 Nautical Charts-147.1 Nautical Charts-149.4 Nautical Charts-151.4 Nautical Charts-153.8 Nautical Charts-155.2 Nautical Charts-158.0 Nautical Charts-160.6 Nautical Charts-163.0 Nautical Charts-165.1 Nautical Charts-167.9 Nautical Charts-170.3 Nautical Charts-173.4 Nautical Charts-175.5 Nautical Charts-178.1 Nautical Charts-180.8 Nautical Charts-185.9 Nautical Charts-191.6 Nautical Charts-197.2 Nautical Charts-202.8 Nautical Charts-207.8 Nautical Charts-213.1 Nautical Charts-218.0 Nautical Charts-223.0 Nautical Charts-224.0 Nautical Charts
Muskrat Falls Project - CE-22 (Public) Page 35 of 40
Nalcor Energy - Lower Churchill Project
Hydraulic Modeling of the River - 2010 UpdateFinal Report - October 2010
H335459-MF1330-RPT-CA01-2501, Rev. 0
Appendix B
Structure Discharge Rating Curves
Muskrat Falls Project - CE-22 (Public) Page 36 of 40

Appendix B - Muskrat Falls and Gull Island Discharge Rating Curves
Gull Island Diversion Rating Curve (Open Water Conditions)Source: GI1061 Figure 4-1
One Diversion Tunnel
Both Diversion Tunnels
33.4 0 034.3 50 10035.2 100 20035.6 150 30036.2 200 40036.5 250 50036.8 300 60037.0 350 70037.3 400 80037.6 450 90037.8 500 100038.1 550 110038.4 600 120038.7 650 130039.0 700 140039.3 750 150039.6 800 160039.9 850 170040.3 900 180040.7 950 190041.1 1000 200041.5 1050 210041.9 1100 220042.3 1150 230042.8 1200 240043.2 1250 250043.7 1300 260044.2 1350 270044.7 1400 280045.2 1450 290045.8 1500 300046.3 1550 310046.9 1600 320047.5 1650 330048.1 1700 340048.7 1750 350049.4 1800 360050.0 1850 370050.7 1900 380051.4 1950 390052.1 2000 400052.8 2050 410053.6 2100 420054.3 2150 430055.1 2200 440055.9 2250 450056.7 2300 460057.5 2350 470058.4 2400 4800
Flow (m3/s)
Headpond Water Level (m)
Gull Island Diversion Rating Curve (Open Water Conditions)
30
35
40
45
50
55
60
0 1000 2000 3000 4000 5000 6000
Flow (m3/s)
Hea
dp
on
d W
ater
Lev
el (
m)
Both Diversion Tunnels
Muskrat Falls Project - CE-22 (Public) Page 37 of 40

Appendix B - Muskrat Falls and Gull Island Discharge Rating Curves
Gull Island Spillway Rating CurveSource: GI1061 Figure 5-1
One Gate Eight (8) Gates105.6 1.9 15.1106.0 9.9 79.3106.4 21.5 172.0106.8 35.9 287.1107.2 52.7 421.7107.6 71.7 573.8108.0 92.8 742.2108.4 115.7 925.8108.8 140.5 1,123.9109.2 167.0 1,335.9109.6 195.1 1,561.1110.4 256.2 2,049.8110.8 289.0 2,312.4111.2 323.3 2,586.8111.6 359.1 2,872.6112.4 434.7 3,477.7112.8 474.5 3,796.4113.2 515.7 4,125.6113.6 558.1 4,465.2114.4 646.8 5,174.5114.8 693.0 5,543.9115.2 740.4 5,922.9115.6 788.9 6,311.4116.4 889.5 7,116.1116.8 941.5 7,532.1117.2 994.6 7,957.1117.6 1,048.9 8,390.8118.4 1,160.5 9,284.2118.8 1,218.0 9,743.6119.2 1,276.4 10,211.4119.6 1,335.9 10,687.4120.4 1,458.0 11,663.8120.8 1,520.5 12,164.0121.2 1,584.0 12,672.1121.6 1,648.5 13,187.9122.0 1,713.9 13,711.5122.4 1,780.3 14,242.7122.8 1,847.7 14,781.4123.2 1,916.0 15,327.6123.6 1,985.2 15,881.3124.0 2,055.3 16,442.2124.4 2,126.3 17,010.5124.8 2,198.2 17,585.9125.2 2,271.1 18,168.5125.6 2,344.8 18,758.2126.0 2,419.4 19,355.0126.4 2,494.8 19,958.7126.8 2,571.2 20,569.3127.0 2,609.7 20,877.2
Flow (m3/s)Headpond Water Level (m)
Gull Island Spillway Rating Curve
100
105
110
115
120
125
130
0 5,000 10,000 15,000 20,000 25,000
Flow (m3/s)
He
ad
po
nd
Wa
ter
Le
ve
l (m
)
Eight (8) Gates
Muskrat Falls Project - CE-22 (Public) Page 38 of 40
Appendix B - Muskrat Falls and Gull Island Discharge Rating Curves
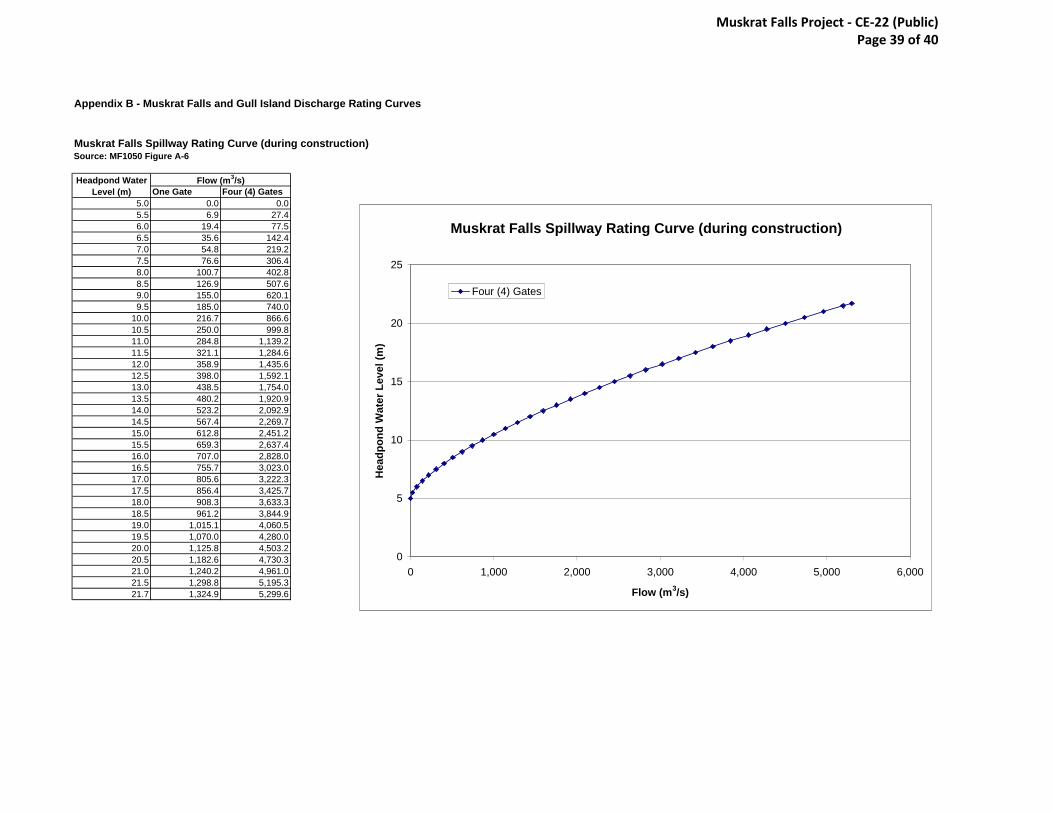
Muskrat Falls Spillway Rating Curve (during construction)Source: MF1050 Figure A-6
One Gate Four (4) Gates5.0 0.0 0.05.5 6.9 27.46.0 19.4 77.56.5 35.6 142.47.0 54.8 219.27.5 76.6 306.48.0 100.7 402.88.5 126.9 507.69.0 155.0 620.19.5 185.0 740.0
10.0 216.7 866.610.5 250.0 999.811.0 284.8 1,139.211.5 321.1 1,284.612.0 358.9 1,435.612.5 398.0 1,592.113.0 438.5 1,754.013.5 480.2 1,920.914.0 523.2 2,092.914.5 567.4 2,269.715.0 612.8 2,451.215.5 659.3 2,637.416.0 707.0 2,828.016.5 755.7 3,023.017.0 805.6 3,222.317.5 856.4 3,425.718.0 908.3 3,633.318.5 961.2 3,844.919.0 1,015.1 4,060.519.5 1,070.0 4,280.020.0 1,125.8 4,503.220.5 1,182.6 4,730.321.0 1,240.2 4,961.021.5 1,298.8 5,195.321.7 1,324.9 5,299.6
Flow (m3/s)Headpond Water Level (m)
Muskrat Falls Spillway Rating Curve (during construction)
0
5
10
15
20
25
0 1,000 2,000 3,000 4,000 5,000 6,000
Flow (m3/s)
Hea
dp
on
d W
ater
Lev
el (
m)
Four (4) Gates
Muskrat Falls Project - CE-22 (Public) Page 39 of 40
Appendix B - Muskrat Falls and Gull Island Discharge Rating Curves
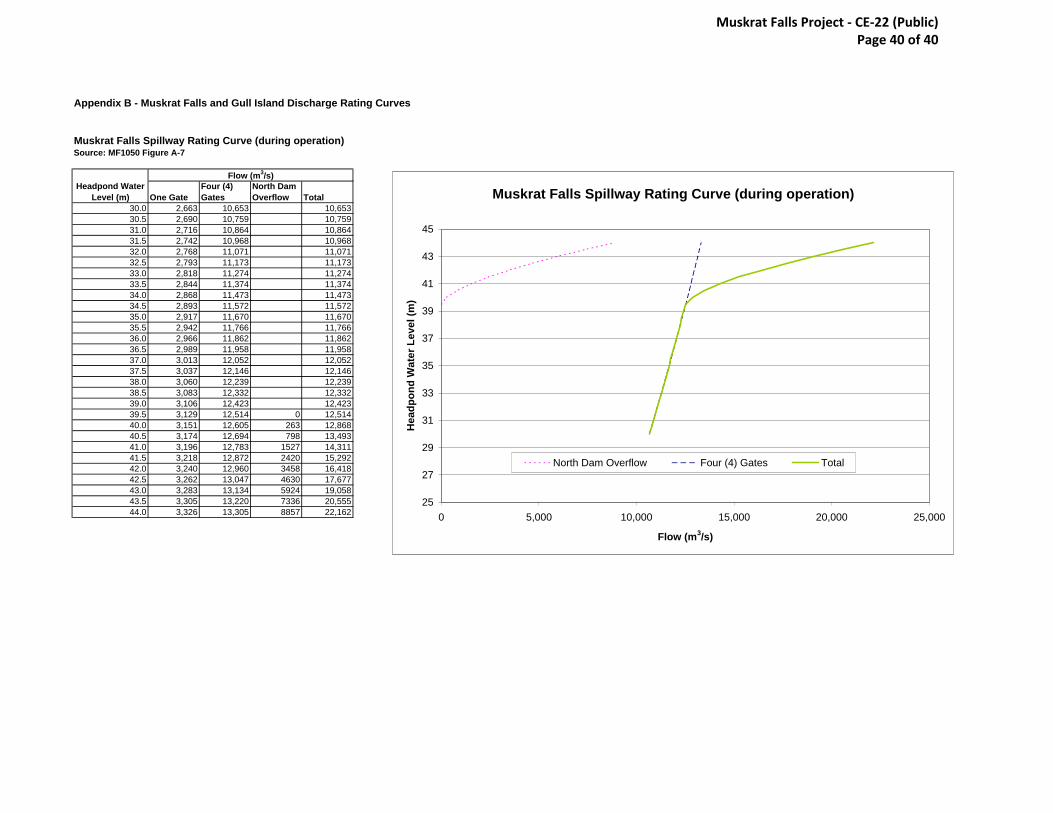
Muskrat Falls Spillway Rating Curve (during operation)Source: MF1050 Figure A-7
One GateFour (4) Gates
North Dam Overflow Total
30.0 2,663 10,653 10,65330.5 2,690 10,759 10,75931.0 2,716 10,864 10,86431.5 2,742 10,968 10,96832.0 2,768 11,071 11,07132.5 2,793 11,173 11,17333.0 2,818 11,274 11,27433.5 2,844 11,374 11,37434.0 2,868 11,473 11,47334.5 2,893 11,572 11,57235.0 2,917 11,670 11,67035.5 2,942 11,766 11,76636.0 2,966 11,862 11,86236.5 2,989 11,958 11,95837.0 3,013 12,052 12,05237.5 3,037 12,146 12,14638.0 3,060 12,239 12,23938.5 3,083 12,332 12,33239.0 3,106 12,423 12,42339.5 3,129 12,514 0 12,51440.0 3,151 12,605 263 12,86840.5 3,174 12,694 798 13,49341.0 3,196 12,783 1527 14,31141.5 3,218 12,872 2420 15,29242.0 3,240 12,960 3458 16,41842.5 3,262 13,047 4630 17,67743.0 3,283 13,134 5924 19,05843.5 3,305 13,220 7336 20,55544.0 3,326 13,305 8857 22,162
Headpond Water Level (m)
Flow (m3/s)
Muskrat Falls Spillway Rating Curve (during operation)
25
27
29
31
33
35
37
39
41
43
45
0 5,000 10,000 15,000 20,000 25,000
Flow (m3/s)
Hea
dp
on
d W
ater
Lev
el (
m)
North Dam Overflow Four (4) Gates Total
Muskrat Falls Project - CE-22 (Public) Page 40 of 40