Embed Size (px)
Citation preview
This report may not be copied or published without the written consent of Mesilla Valley Transportation Solutions, LLC
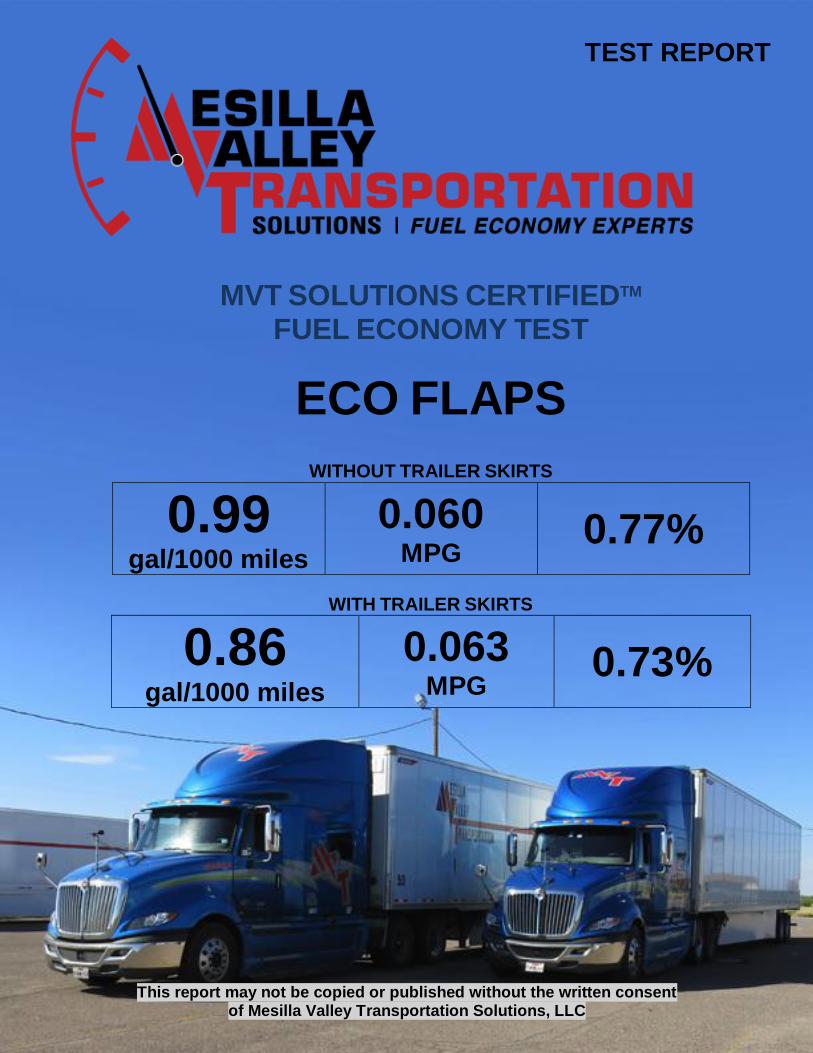
MVT SOLUTIONS CERTIFIEDTM
FUEL ECONOMY TEST
ECO FLAPS
WITHOUT TRAILER SKIRTS
0.99 gal/1000 miles
0.060 MPG
0.77%
WITH TRAILER SKIRTS
0.86 gal/1000 miles
0.063 MPG
0.73%
TEST REPORT
1
Fuel Economy Test: Eco Flaps 24” Splash Guards
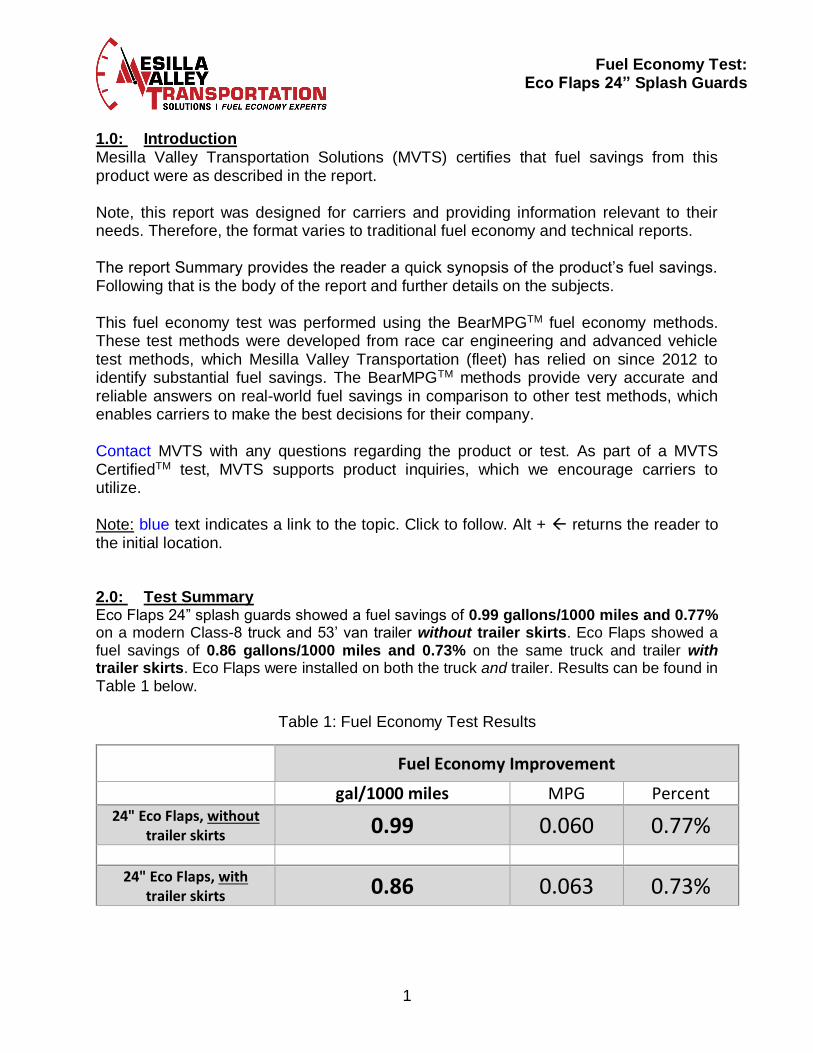
1.0: Introduction Mesilla Valley Transportation Solutions (MVTS) certifies that fuel savings from this product were as described in the report. Note, this report was designed for carriers and providing information relevant to their needs. Therefore, the format varies to traditional fuel economy and technical reports. The report Summary provides the reader a quick synopsis of the product’s fuel savings. Following that is the body of the report and further details on the subjects. This fuel economy test was performed using the BearMPGTM fuel economy methods. These test methods were developed from race car engineering and advanced vehicle test methods, which Mesilla Valley Transportation (fleet) has relied on since 2012 to identify substantial fuel savings. The BearMPGTM methods provide very accurate and reliable answers on real-world fuel savings in comparison to other test methods, which enables carriers to make the best decisions for their company. Contact MVTS with any questions regarding the product or test. As part of a MVTS CertifiedTM test, MVTS supports product inquiries, which we encourage carriers to utilize. Note: blue text indicates a link to the topic. Click to follow. Alt + returns the reader to the initial location. 2.0: Test Summary Eco Flaps 24” splash guards showed a fuel savings of 0.99 gallons/1000 miles and 0.77% on a modern Class-8 truck and 53’ van trailer without trailer skirts. Eco Flaps showed a fuel savings of 0.86 gallons/1000 miles and 0.73% on the same truck and trailer with trailer skirts. Eco Flaps were installed on both the truck and trailer. Results can be found in
Table 1 below.
Table 1: Fuel Economy Test Results
Fuel Economy Improvement
gal/1000 miles MPG Percent 24" Eco Flaps, without
trailer skirts 0.99 0.060 0.77%
24" Eco Flaps, with trailer skirts 0.86 0.063 0.73%
2
Fuel Economy Test: Eco Flaps 24” Splash Guards
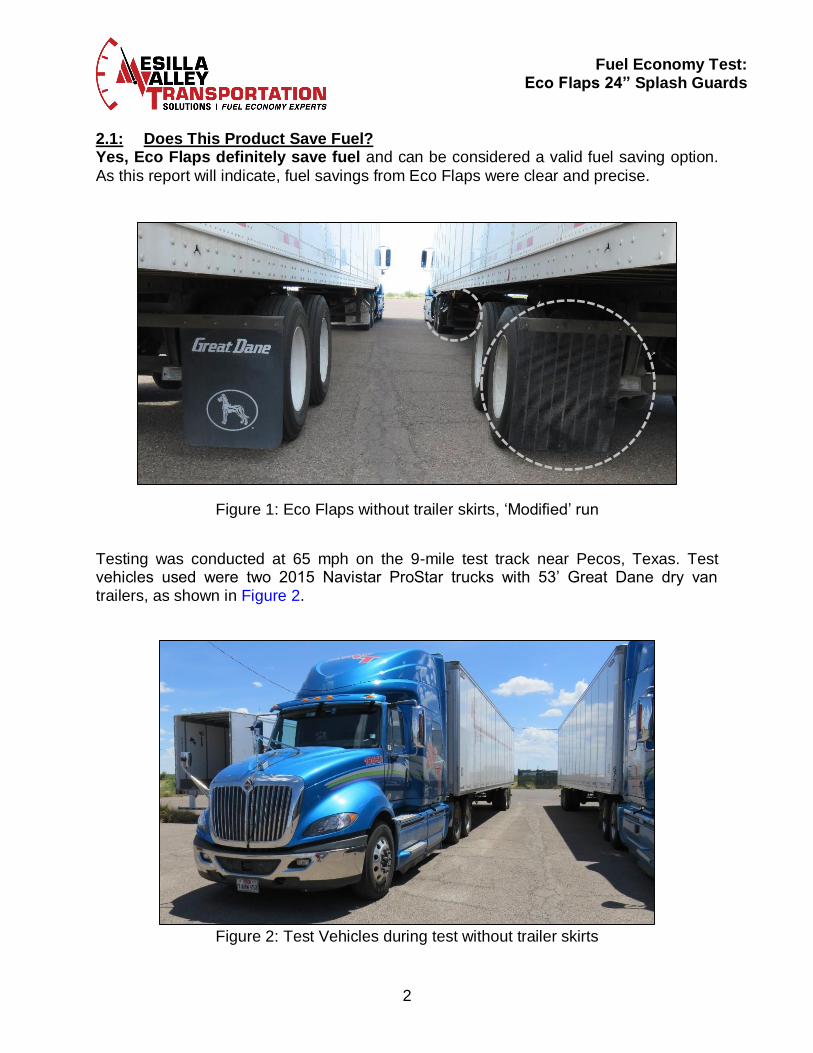
2.1: Does This Product Save Fuel? Yes, Eco Flaps definitely save fuel and can be considered a valid fuel saving option.
As this report will indicate, fuel savings from Eco Flaps were clear and precise.
Figure 1: Eco Flaps without trailer skirts, ‘Modified’ run
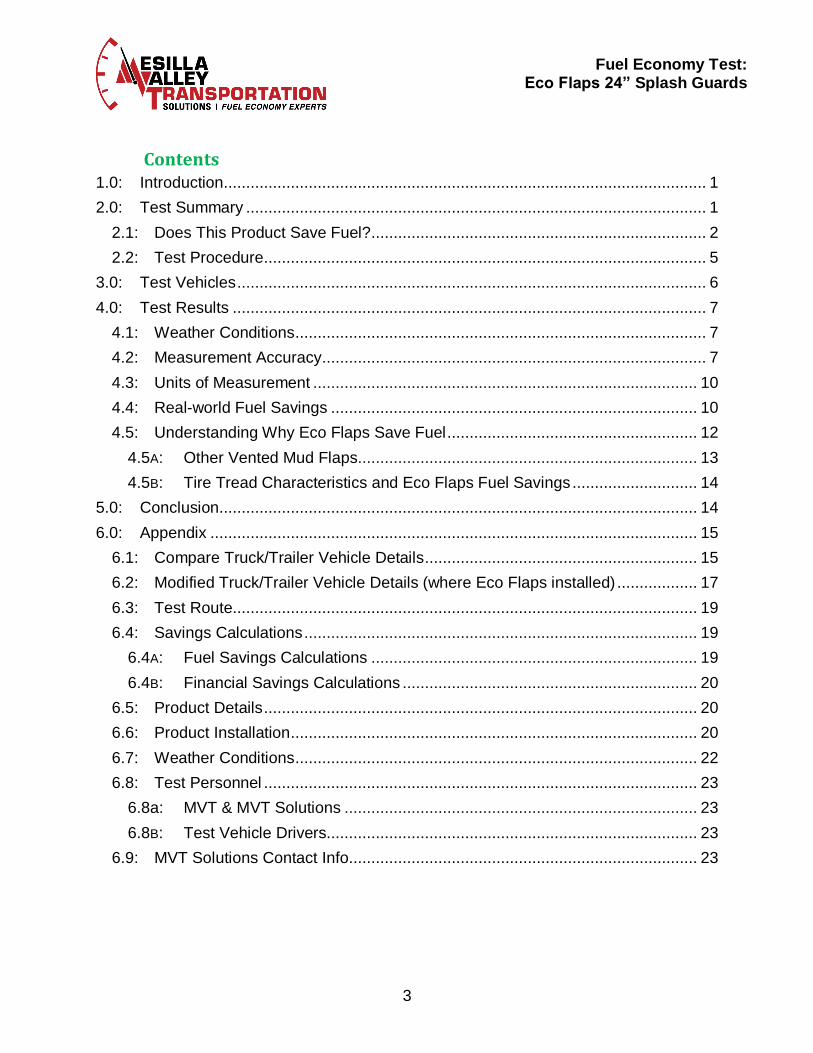
Testing was conducted at 65 mph on the 9-mile test track near Pecos, Texas. Test vehicles used were two 2015 Navistar ProStar trucks with 53’ Great Dane dry van trailers, as shown in Figure 2.
Figure 2: Test Vehicles during test without trailer skirts
3
Fuel Economy Test: Eco Flaps 24” Splash Guards
Contents 1.0: Introduction ............................................................................................................ 1
2.0: Test Summary ....................................................................................................... 1
2.1: Does This Product Save Fuel? ........................................................................... 2
2.2: Test Procedure ................................................................................................... 5
3.0: Test Vehicles ......................................................................................................... 6
4.0: Test Results .......................................................................................................... 7
4.1: Weather Conditions ............................................................................................ 7
4.2: Measurement Accuracy...................................................................................... 7
4.3: Units of Measurement ...................................................................................... 10
4.4: Real-world Fuel Savings .................................................................................. 10
4.5: Understanding Why Eco Flaps Save Fuel ........................................................ 12
4.5A: Other Vented Mud Flaps............................................................................ 13
4.5B: Tire Tread Characteristics and Eco Flaps Fuel Savings ............................ 14
5.0: Conclusion ........................................................................................................... 14
6.0: Appendix ............................................................................................................. 15
6.1: Compare Truck/Trailer Vehicle Details ............................................................. 15
6.2: Modified Truck/Trailer Vehicle Details (where Eco Flaps installed) .................. 17
6.3: Test Route........................................................................................................ 19
6.4: Savings Calculations ........................................................................................ 19
6.4A: Fuel Savings Calculations ......................................................................... 19
6.4B: Financial Savings Calculations .................................................................. 20
6.5: Product Details ................................................................................................. 20
6.6: Product Installation ........................................................................................... 20
6.7: Weather Conditions .......................................................................................... 22
6.8: Test Personnel ................................................................................................. 23
6.8a: MVT & MVT Solutions ............................................................................... 23
6.8B: Test Vehicle Drivers................................................................................... 23
6.9: MVT Solutions Contact Info.............................................................................. 23
4
Fuel Economy Test: Eco Flaps 24” Splash Guards
List of Figures Figure 1: Eco Flaps without trailer skirts, ‘Modified’ run .................................................. 2
Figure 2: Test Vehicles during test without trailer skirts .................................................. 2 Figure 3: ‘Baseline’ run, test with trailer skirts ................................................................. 5
Figure 4: Eco Flaps truck install, ‘Modified’ run ............................................................... 6 Figure 5: Fuel Economy Accuracy Bell Curve (without trailer skirts) ............................... 8
Figure 6: Fuel Economy Accuracy Graph (with trailer skirts) ........................................... 9 Figure 7: Why Mud Flaps Create Aerodynamic Drag .................................................... 12
Figure 8: Vented Eco Flap ............................................................................................. 13 Figure 9: Trailer Eco Flap install and comparison ......................................................... 21
Figure 10: Truck Eco Flap install ................................................................................... 21
List of Tables
Table 1: Fuel Economy Test Results............................................................................... 1
Table 2: Fuel Economy Test Results with Accuracy........................................................ 7 Table 3: Weather Data .................................................................................................. 22
5
Fuel Economy Test: Eco Flaps 24” Splash Guards
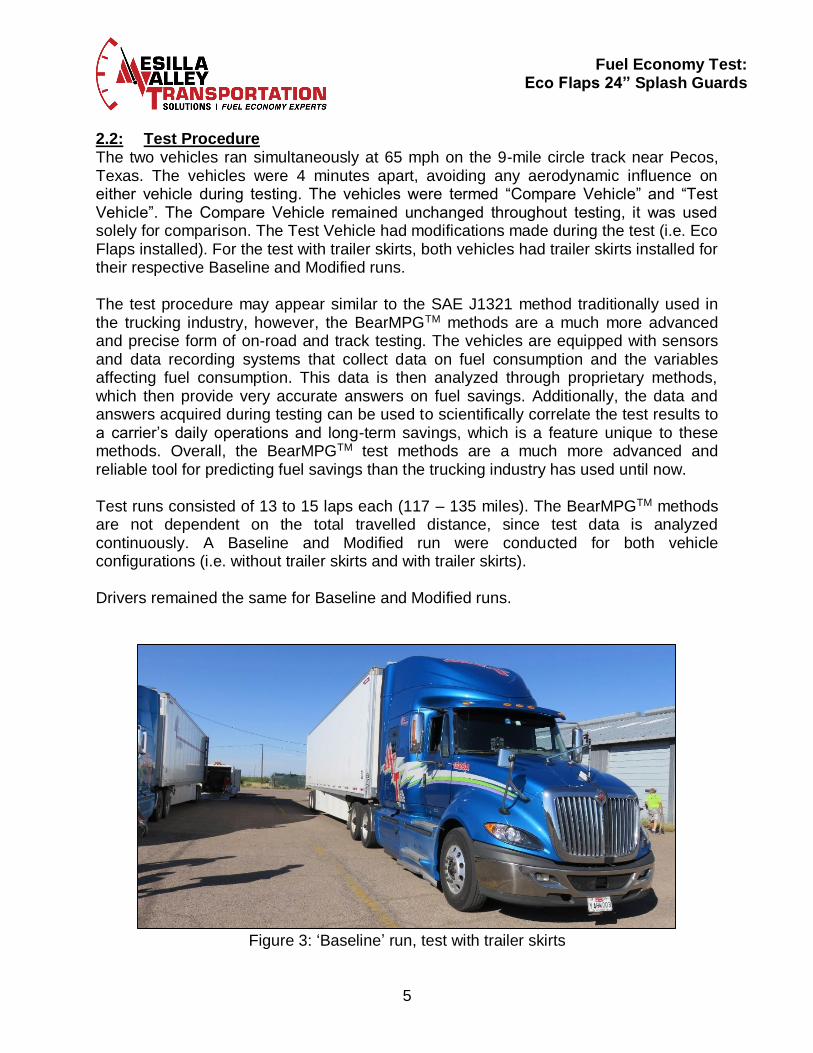
2.2: Test Procedure The two vehicles ran simultaneously at 65 mph on the 9-mile circle track near Pecos, Texas. The vehicles were 4 minutes apart, avoiding any aerodynamic influence on either vehicle during testing. The vehicles were termed “Compare Vehicle” and “Test Vehicle”. The Compare Vehicle remained unchanged throughout testing, it was used solely for comparison. The Test Vehicle had modifications made during the test (i.e. Eco Flaps installed). For the test with trailer skirts, both vehicles had trailer skirts installed for their respective Baseline and Modified runs. The test procedure may appear similar to the SAE J1321 method traditionally used in the trucking industry, however, the BearMPGTM methods are a much more advanced and precise form of on-road and track testing. The vehicles are equipped with sensors and data recording systems that collect data on fuel consumption and the variables affecting fuel consumption. This data is then analyzed through proprietary methods, which then provide very accurate answers on fuel savings. Additionally, the data and answers acquired during testing can be used to scientifically correlate the test results to a carrier’s daily operations and long-term savings, which is a feature unique to these methods. Overall, the BearMPGTM test methods are a much more advanced and reliable tool for predicting fuel savings than the trucking industry has used until now. Test runs consisted of 13 to 15 laps each (117 – 135 miles). The BearMPGTM methods are not dependent on the total travelled distance, since test data is analyzed continuously. A Baseline and Modified run were conducted for both vehicle configurations (i.e. without trailer skirts and with trailer skirts). Drivers remained the same for Baseline and Modified runs.
Figure 3: ‘Baseline’ run, test with trailer skirts
6
Fuel Economy Test: Eco Flaps 24” Splash Guards
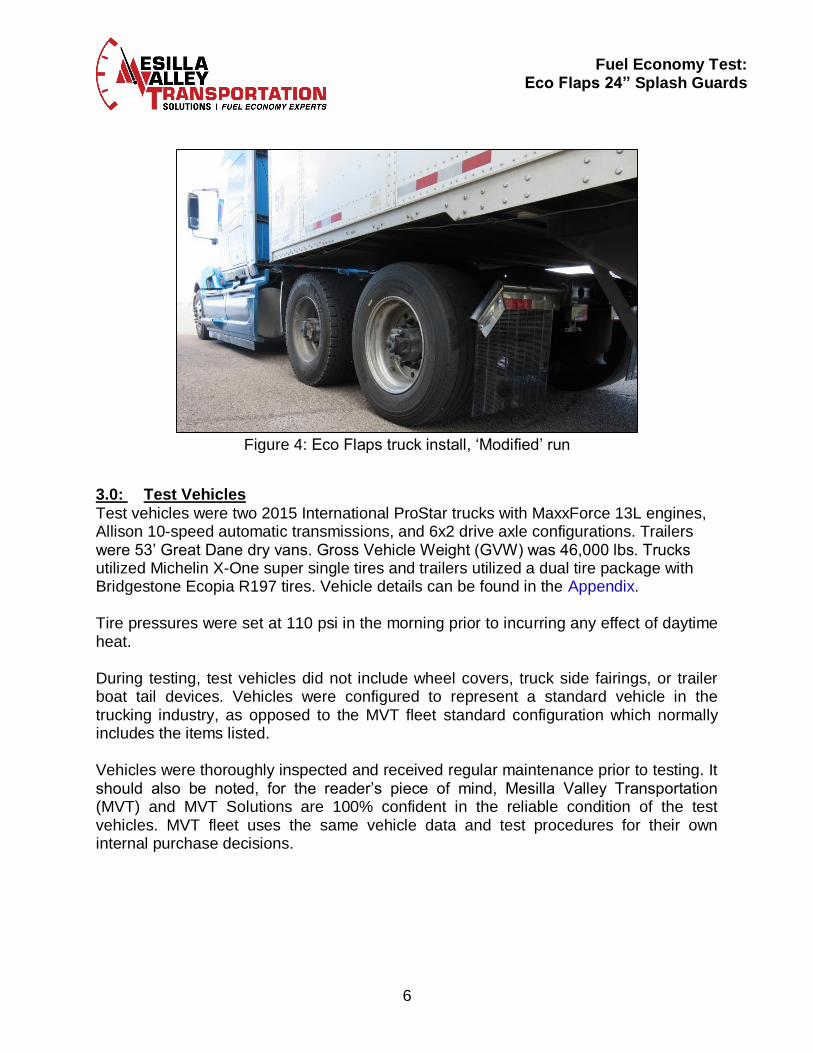
Figure 4: Eco Flaps truck install, ‘Modified’ run
3.0: Test Vehicles
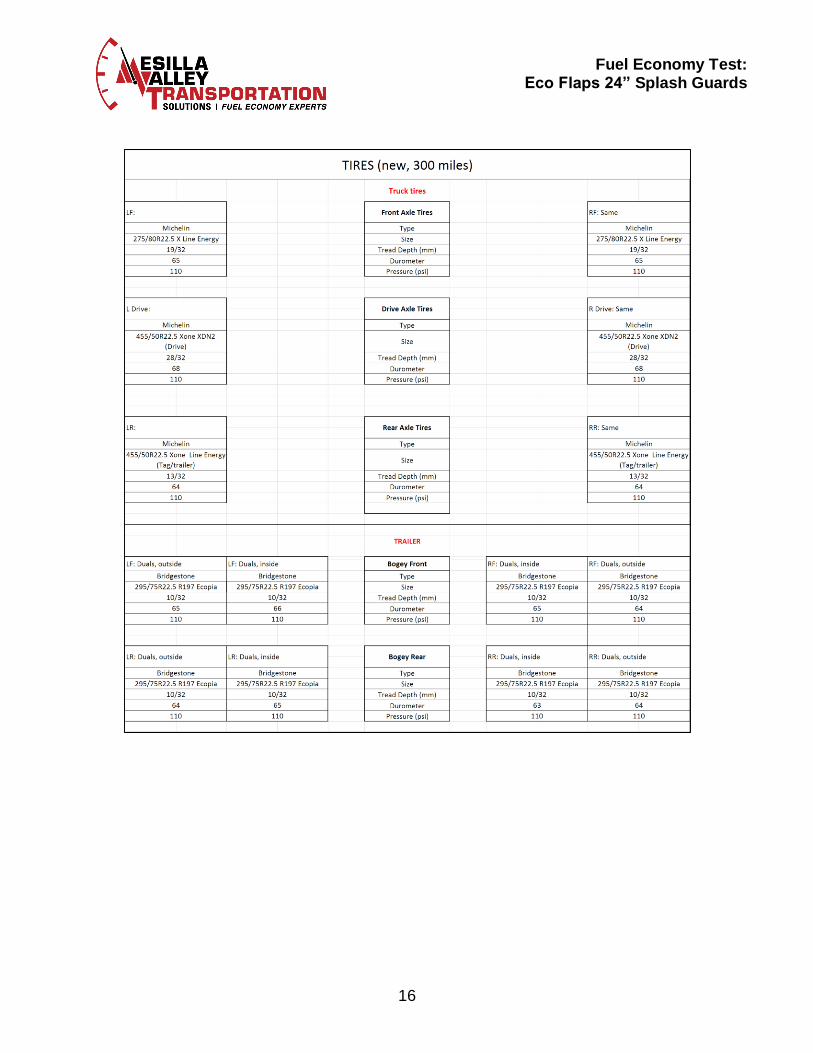
Test vehicles were two 2015 International ProStar trucks with MaxxForce 13L engines, Allison 10-speed automatic transmissions, and 6x2 drive axle configurations. Trailers were 53’ Great Dane dry vans. Gross Vehicle Weight (GVW) was 46,000 lbs. Trucks utilized Michelin X-One super single tires and trailers utilized a dual tire package with Bridgestone Ecopia R197 tires. Vehicle details can be found in the Appendix. Tire pressures were set at 110 psi in the morning prior to incurring any effect of daytime heat. During testing, test vehicles did not include wheel covers, truck side fairings, or trailer boat tail devices. Vehicles were configured to represent a standard vehicle in the trucking industry, as opposed to the MVT fleet standard configuration which normally includes the items listed. Vehicles were thoroughly inspected and received regular maintenance prior to testing. It should also be noted, for the reader’s piece of mind, Mesilla Valley Transportation (MVT) and MVT Solutions are 100% confident in the reliable condition of the test vehicles. MVT fleet uses the same vehicle data and test procedures for their own internal purchase decisions.
7
Fuel Economy Test: Eco Flaps 24” Splash Guards
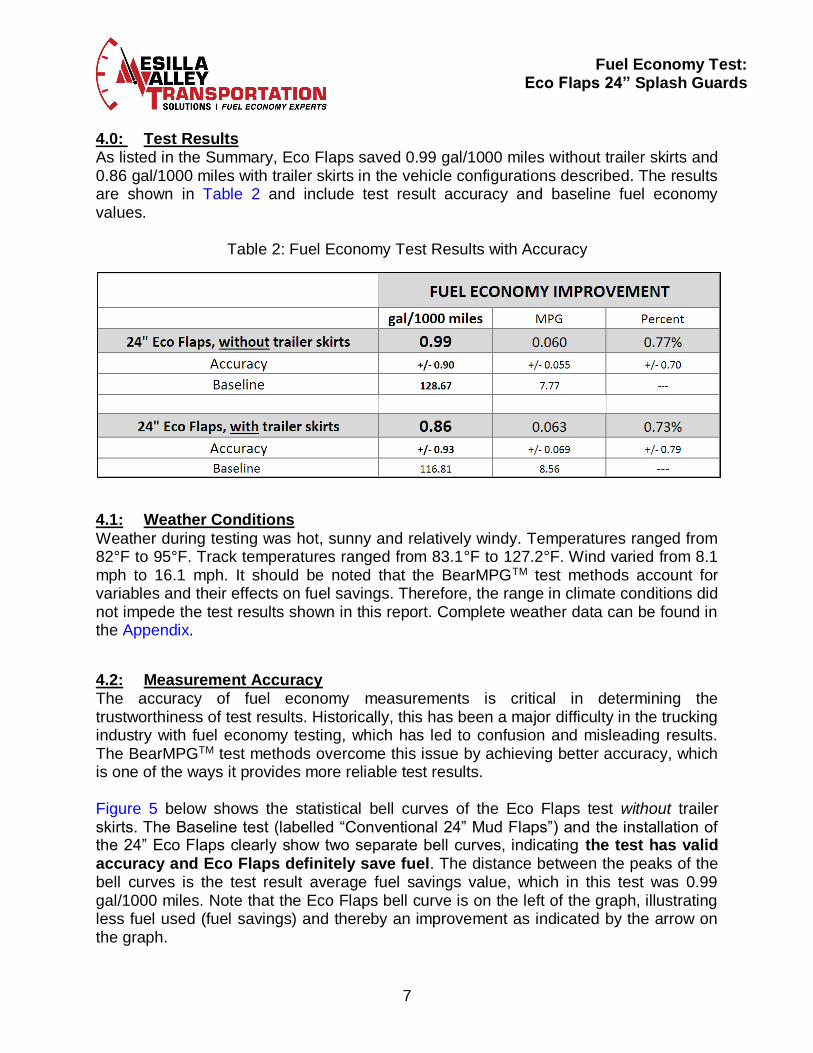
4.0: Test Results As listed in the Summary, Eco Flaps saved 0.99 gal/1000 miles without trailer skirts and 0.86 gal/1000 miles with trailer skirts in the vehicle configurations described. The results are shown in Table 2 and include test result accuracy and baseline fuel economy values.
Table 2: Fuel Economy Test Results with Accuracy
4.1: Weather Conditions
Weather during testing was hot, sunny and relatively windy. Temperatures ranged from 82°F to 95°F. Track temperatures ranged from 83.1°F to 127.2°F. Wind varied from 8.1 mph to 16.1 mph. It should be noted that the BearMPGTM test methods account for variables and their effects on fuel savings. Therefore, the range in climate conditions did not impede the test results shown in this report. Complete weather data can be found in the Appendix.
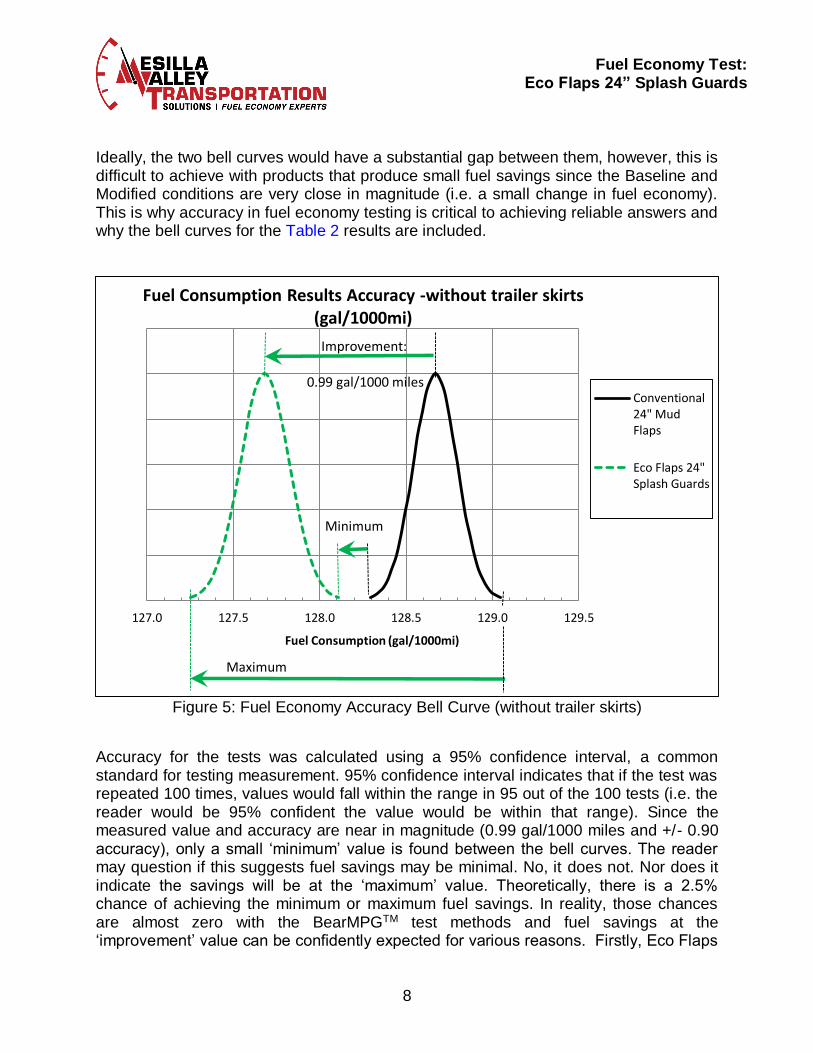
4.2: Measurement Accuracy The accuracy of fuel economy measurements is critical in determining the trustworthiness of test results. Historically, this has been a major difficulty in the trucking industry with fuel economy testing, which has led to confusion and misleading results. The BearMPGTM test methods overcome this issue by achieving better accuracy, which is one of the ways it provides more reliable test results. Figure 5 below shows the statistical bell curves of the Eco Flaps test without trailer skirts. The Baseline test (labelled “Conventional 24” Mud Flaps”) and the installation of the 24” Eco Flaps clearly show two separate bell curves, indicating the test has valid accuracy and Eco Flaps definitely save fuel. The distance between the peaks of the bell curves is the test result average fuel savings value, which in this test was 0.99 gal/1000 miles. Note that the Eco Flaps bell curve is on the left of the graph, illustrating less fuel used (fuel savings) and thereby an improvement as indicated by the arrow on the graph.
8
Fuel Economy Test: Eco Flaps 24” Splash Guards
Ideally, the two bell curves would have a substantial gap between them, however, this is difficult to achieve with products that produce small fuel savings since the Baseline and Modified conditions are very close in magnitude (i.e. a small change in fuel economy). This is why accuracy in fuel economy testing is critical to achieving reliable answers and why the bell curves for the Table 2 results are included.
Figure 5: Fuel Economy Accuracy Bell Curve (without trailer skirts)
Accuracy for the tests was calculated using a 95% confidence interval, a common standard for testing measurement. 95% confidence interval indicates that if the test was repeated 100 times, values would fall within the range in 95 out of the 100 tests (i.e. the reader would be 95% confident the value would be within that range). Since the measured value and accuracy are near in magnitude (0.99 gal/1000 miles and +/- 0.90 accuracy), only a small ‘minimum’ value is found between the bell curves. The reader may question if this suggests fuel savings may be minimal. No, it does not. Nor does it indicate the savings will be at the ‘maximum’ value. Theoretically, there is a 2.5% chance of achieving the minimum or maximum fuel savings. In reality, those chances are almost zero with the BearMPGTM test methods and fuel savings at the ‘improvement’ value can be confidently expected for various reasons. Firstly, Eco Flaps
127.0 127.5 128.0 128.5 129.0 129.5
Fuel Consumption (gal/1000mi)
Fuel Consumption Results Accuracy -without trailer skirts (gal/1000mi)
Conventional24" MudFlaps
Eco Flaps 24"Splash Guards
Improvement:
0.99 gal/1000 miles
Minimum
Maximum
9
Fuel Economy Test: Eco Flaps 24” Splash Guards
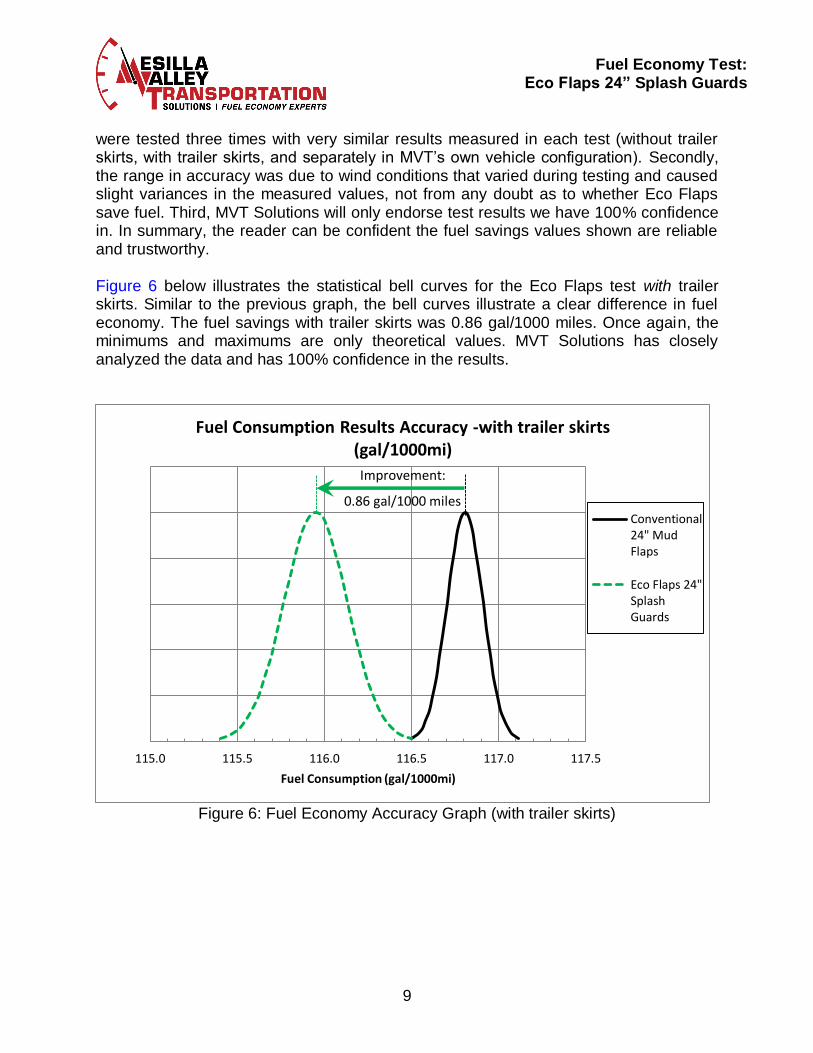
were tested three times with very similar results measured in each test (without trailer skirts, with trailer skirts, and separately in MVT’s own vehicle configuration). Secondly, the range in accuracy was due to wind conditions that varied during testing and caused slight variances in the measured values, not from any doubt as to whether Eco Flaps save fuel. Third, MVT Solutions will only endorse test results we have 100% confidence in. In summary, the reader can be confident the fuel savings values shown are reliable and trustworthy. Figure 6 below illustrates the statistical bell curves for the Eco Flaps test with trailer skirts. Similar to the previous graph, the bell curves illustrate a clear difference in fuel economy. The fuel savings with trailer skirts was 0.86 gal/1000 miles. Once again, the minimums and maximums are only theoretical values. MVT Solutions has closely analyzed the data and has 100% confidence in the results.
Figure 6: Fuel Economy Accuracy Graph (with trailer skirts)
115.0 115.5 116.0 116.5 117.0 117.5
Fuel Consumption (gal/1000mi)
Fuel Consumption Results Accuracy -with trailer skirts (gal/1000mi)
Conventional24" MudFlaps
Eco Flaps 24"SplashGuards
Improvement:
0.86 gal/1000 miles
10
Fuel Economy Test: Eco Flaps 24” Splash Guards
4.3: Units of Measurement The reader may not be familiar with units of gal/1000 miles (gallons per 1000 miles) since it is not traditionally used in the trucking industry. The following paragraphs will briefly explain the reasons for these units and how they help carriers better calculate fuel savings. Units of gal/1000 miles more reliably calculate fuel savings when compared to other units such as miles-per-gallon (MPG) and percent (%). Those units are prone to error from changing variables such as load, driver behavior, and duty cycle. For example, gal/1000 miles values are not affected by load for an aerodynamic product, an empty Class-8 unit at 34,000 lbs. will save the same gal/1000 miles in fuel as one loaded to 80,000 lbs. However, when viewed in percent (%) or MPG the values will change. This causes a carrier to experience varied results in real-world operation and difficulty predicting the financial benefits of the product. An example of this exists within the Eco Flaps test itself, although it is relatively small. Eco Flaps saved more fuel without trailer skirts than with trailer skirts (0.99 vs. 0.86 gal/1000 miles). However, MPG values indicate the savings were less without trailer skirts (0.060 vs. 0.063 MPG). This is misleading until understanding the difference is due to the change in vehicle baseline fuel economy, not the product fuel savings. As shown in Table 2, the baseline fuel economy without trailer skirts was 7.77 MPG and with trailer skirts was 8.56 MPG. The greater MPG of the test with trailer skirts caused an offset in the MPG savings of the Eco Flaps, however, more fuel was actually saved in the condition without trailer skirts. Units of gal/1000 miles are the most reliable units of measurement for aerodynamic fuel savings due to its scientific and mathematical relationship to fuel consumption. Further detail is beyond the scope of this report and the reader is advised to contact MVT Solutions for further detail.
4.4: Real-world Fuel Savings The test proves that Eco Flaps save fuel and that savings can be expected in a carrier’s real-world, daily operations. Fuel savings during testing vary to common daily operations, however, the two conditions are directly related by science, which can be used to predict fuel savings in long-term daily operations accurately and reliably. It should also be noted that gal/1000 miles values in this report are a valid estimate for a long-haul fleet. The main variables affecting fuel savings in testing versus real-world operations that a carrier should consider are:
Duty Cycle Climate Vehicle Configuration
11
Fuel Economy Test: Eco Flaps 24” Splash Guards
Driver behavior also effects fuel economy, however, it is not a factor when using units of gal/1000 miles for aerodynamic products. Reasons for this are out of the scope of this report and the reader is encouraged to contact MVTS if they require more information or values for their specific fleet. To calculate fuel saved from gal/1000 miles measurements, multiply the fuel savings value by the thousands of miles travelled by the vehicle. For example, if a vehicle travels 125,000 miles per year without trailer skirts (0.99 gal/1000 miles savings in testing) the fuel savings calculation is: (0.99 gal/1000 miles) x (125) = 123.75 gallons per year fuel saved
12
Fuel Economy Test: Eco Flaps 24” Splash Guards
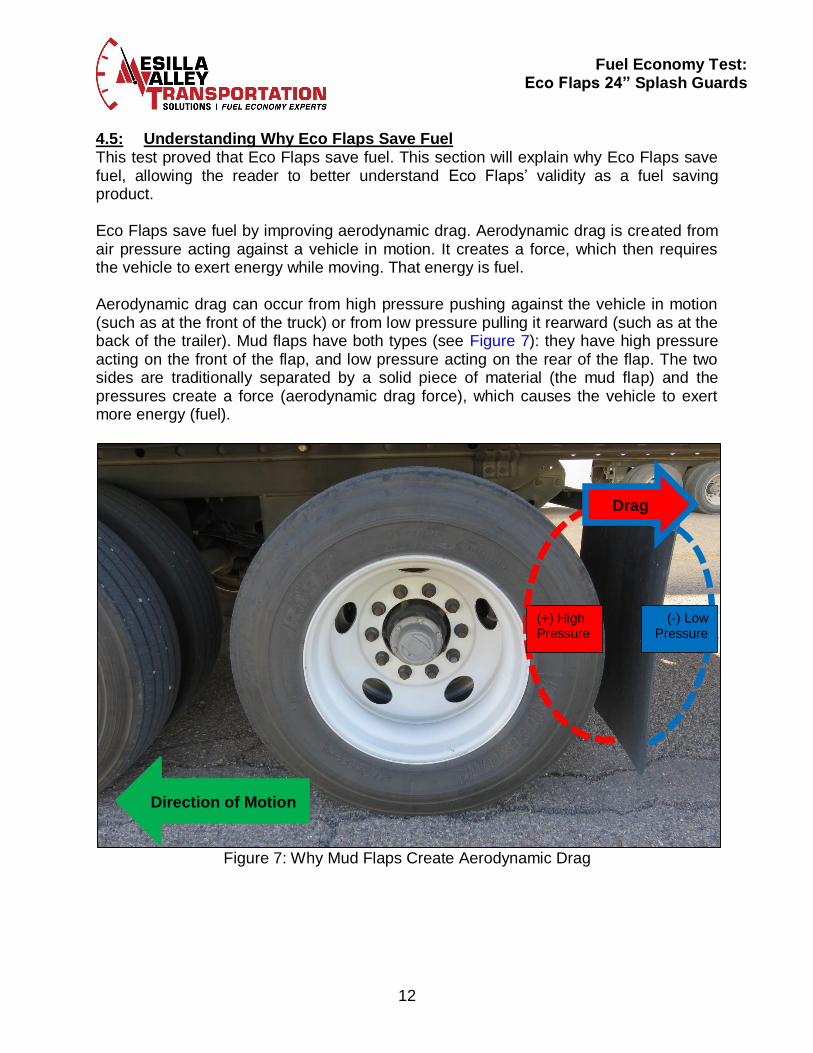
4.5: Understanding Why Eco Flaps Save Fuel This test proved that Eco Flaps save fuel. This section will explain why Eco Flaps save fuel, allowing the reader to better understand Eco Flaps’ validity as a fuel saving product. Eco Flaps save fuel by improving aerodynamic drag. Aerodynamic drag is created from air pressure acting against a vehicle in motion. It creates a force, which then requires the vehicle to exert energy while moving. That energy is fuel. Aerodynamic drag can occur from high pressure pushing against the vehicle in motion (such as at the front of the truck) or from low pressure pulling it rearward (such as at the back of the trailer). Mud flaps have both types (see Figure 7): they have high pressure acting on the front of the flap, and low pressure acting on the rear of the flap. The two sides are traditionally separated by a solid piece of material (the mud flap) and the pressures create a force (aerodynamic drag force), which causes the vehicle to exert more energy (fuel).
Figure 7: Why Mud Flaps Create Aerodynamic Drag
Direction of Motion
(+) High Pressure
(-) Low Pressure
Drag
13
Fuel Economy Test: Eco Flaps 24” Splash Guards
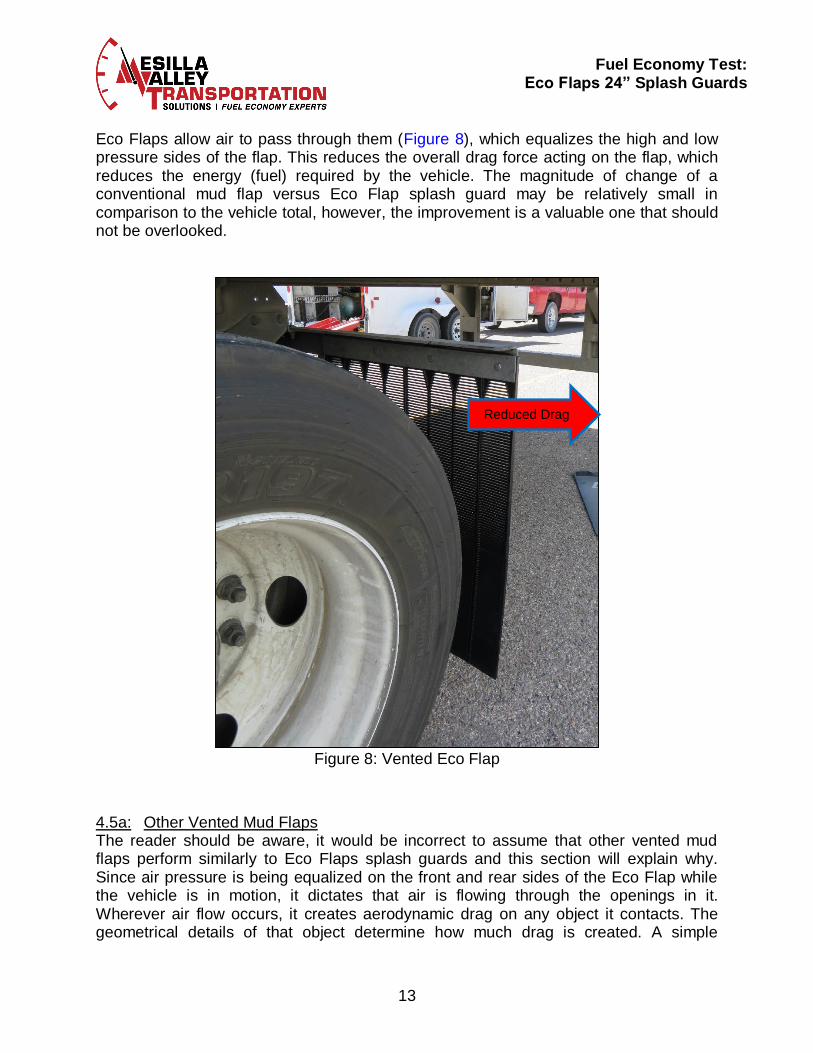
Eco Flaps allow air to pass through them (Figure 8), which equalizes the high and low pressure sides of the flap. This reduces the overall drag force acting on the flap, which reduces the energy (fuel) required by the vehicle. The magnitude of change of a conventional mud flap versus Eco Flap splash guard may be relatively small in comparison to the vehicle total, however, the improvement is a valuable one that should not be overlooked.
Figure 8: Vented Eco Flap
4.5a: Other Vented Mud Flaps The reader should be aware, it would be incorrect to assume that other vented mud flaps perform similarly to Eco Flaps splash guards and this section will explain why. Since air pressure is being equalized on the front and rear sides of the Eco Flap while the vehicle is in motion, it dictates that air is flowing through the openings in it. Wherever air flow occurs, it creates aerodynamic drag on any object it contacts. The geometrical details of that object determine how much drag is created. A simple
Reduced Drag
14
Fuel Economy Test: Eco Flaps 24” Splash Guards
example of geometric details with aerodynamic drag is a golf ball, whose small dimples reduce its aerodynamic drag and make it travel further. Like a golf ball, small details in how air travels through the splash guard is also important. Therefore, the geometry of the openings in Eco Flaps will have a substantial effect on the overall drag reduction (and therefore fuel savings) of the product. Furthermore, small changes to the design of the openings may reduce or negate any improvement in fuel economy. Overall, it would be incorrect to assume that other vented splash guards perform the same as Eco Flaps. Further testing would be required to compare other designs.
4.5b: Tire Tread Characteristics and Eco Flaps Fuel Savings A secondary topic to consider is that tire tread characteristics may effect the fuel savings of Eco Flaps since rotating tires generate a significant amount of air flow. Lug-style tread design or greater tread depth may create higher pressure on the front side of the mud flap than the low tread depth tires used in this test. If that is the case, greater fuel savings would exist for Eco Flaps when used with a more significant tread. Further testing is required to quantify any effects of tire tread on Eco Flaps fuel savings. 5.0: Conclusion This test proved that Eco Flaps save fuel, with answers that were clear and precise. The fuel savings were 0.99 gal/1000 miles on a Class-8 vehicle without trailer skirts and 0.86 gal/1000 miles with trailer skirts. These values can be used to estimate a carrier’s savings in real-world operations. More precision can be obtained through the use of a carrier’s vehicle information, which MVT Solutions can assist with.
15
Fuel Economy Test: Eco Flaps 24” Splash Guards
6.0: Appendix
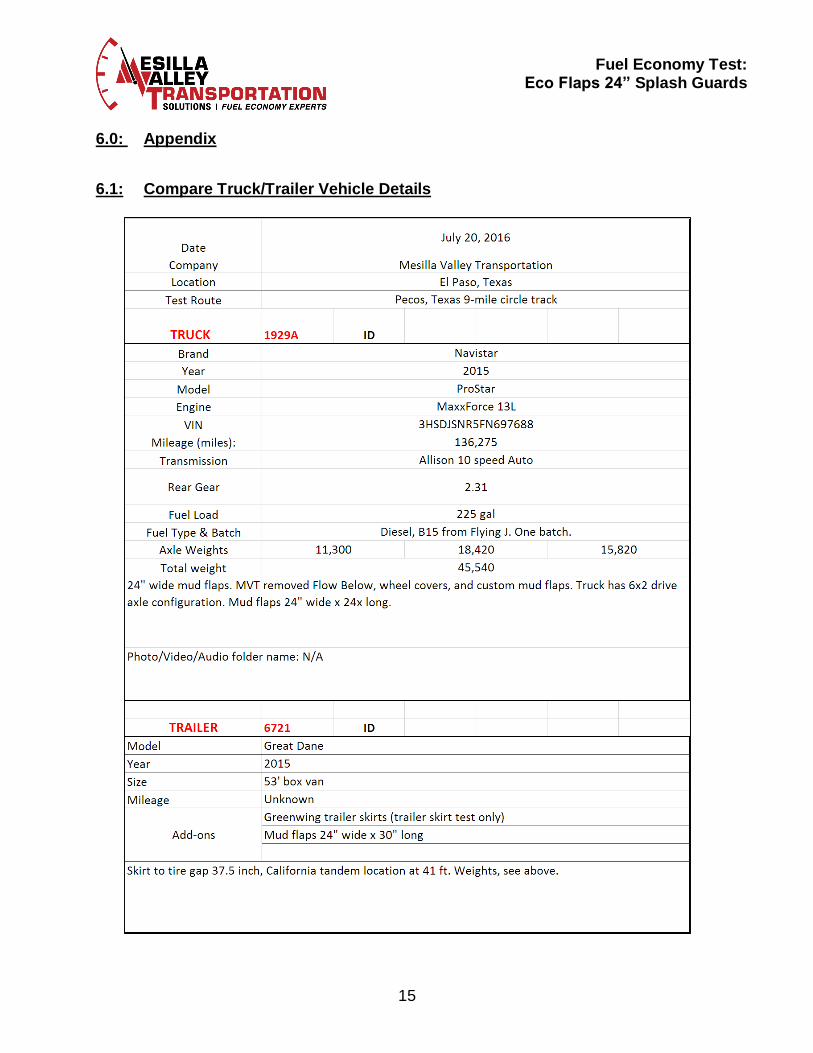
6.1: Compare Truck/Trailer Vehicle Details
16
Fuel Economy Test: Eco Flaps 24” Splash Guards
17
Fuel Economy Test: Eco Flaps 24” Splash Guards
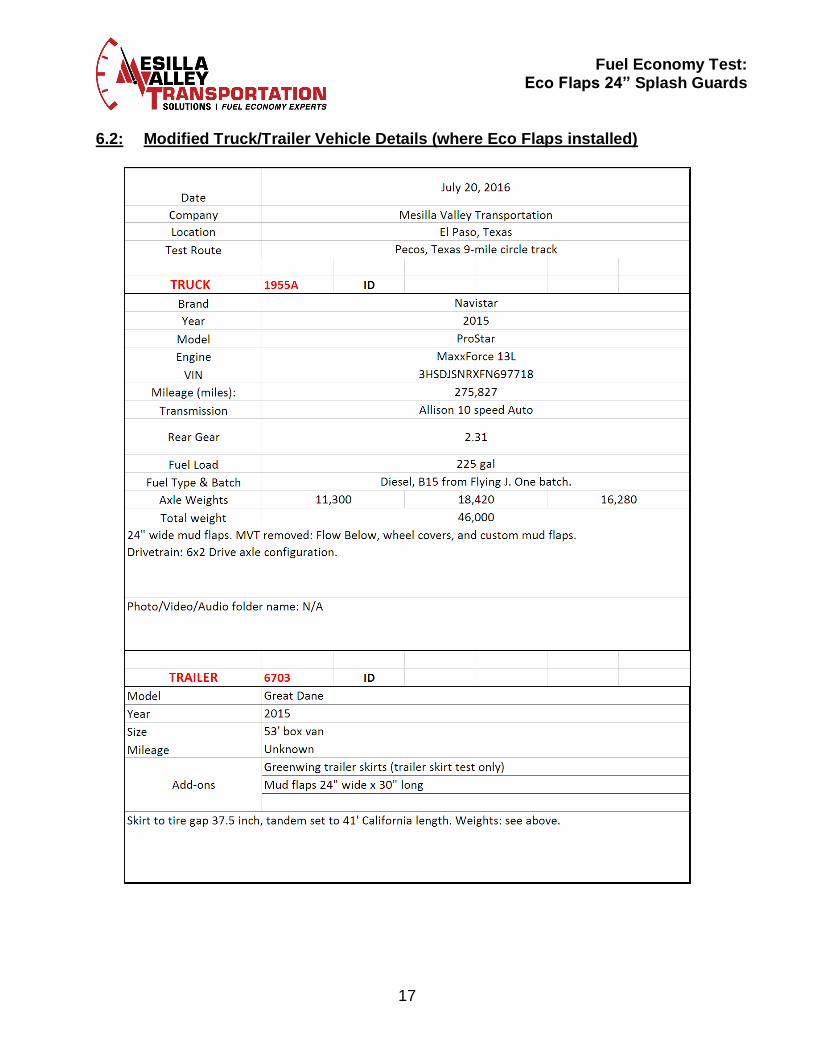
6.2: Modified Truck/Trailer Vehicle Details (where Eco Flaps installed)
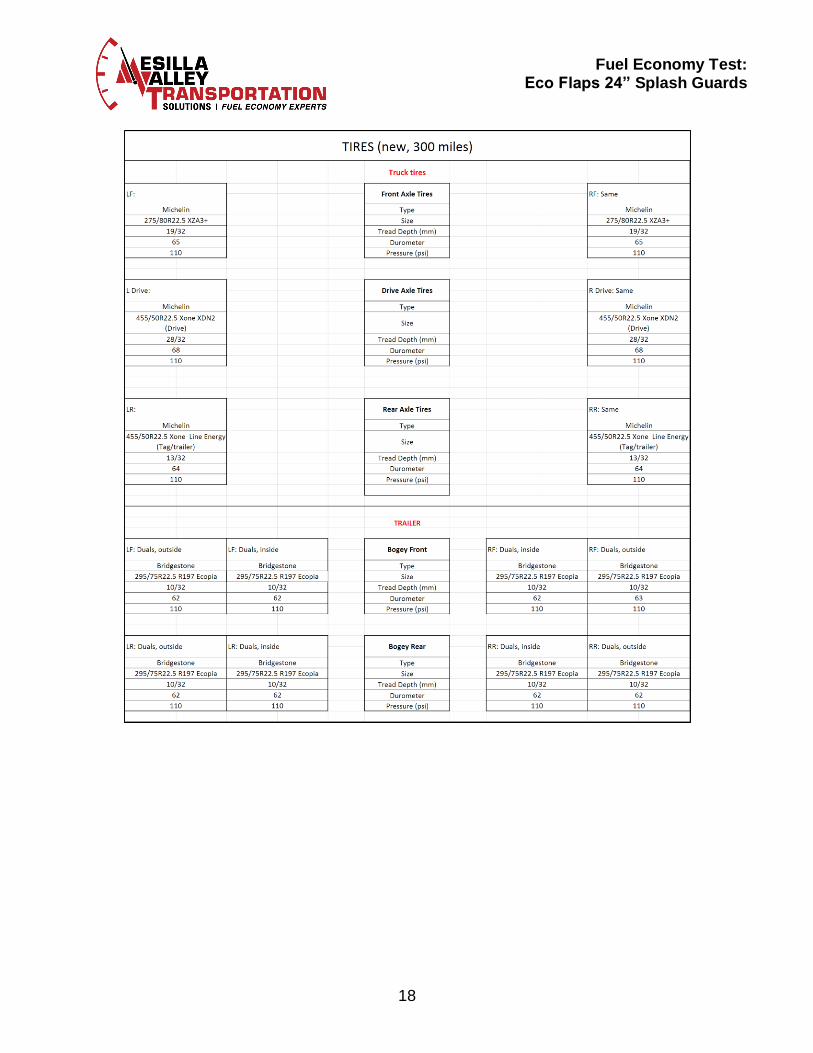
18
Fuel Economy Test: Eco Flaps 24” Splash Guards
19
Fuel Economy Test: Eco Flaps 24” Splash Guards
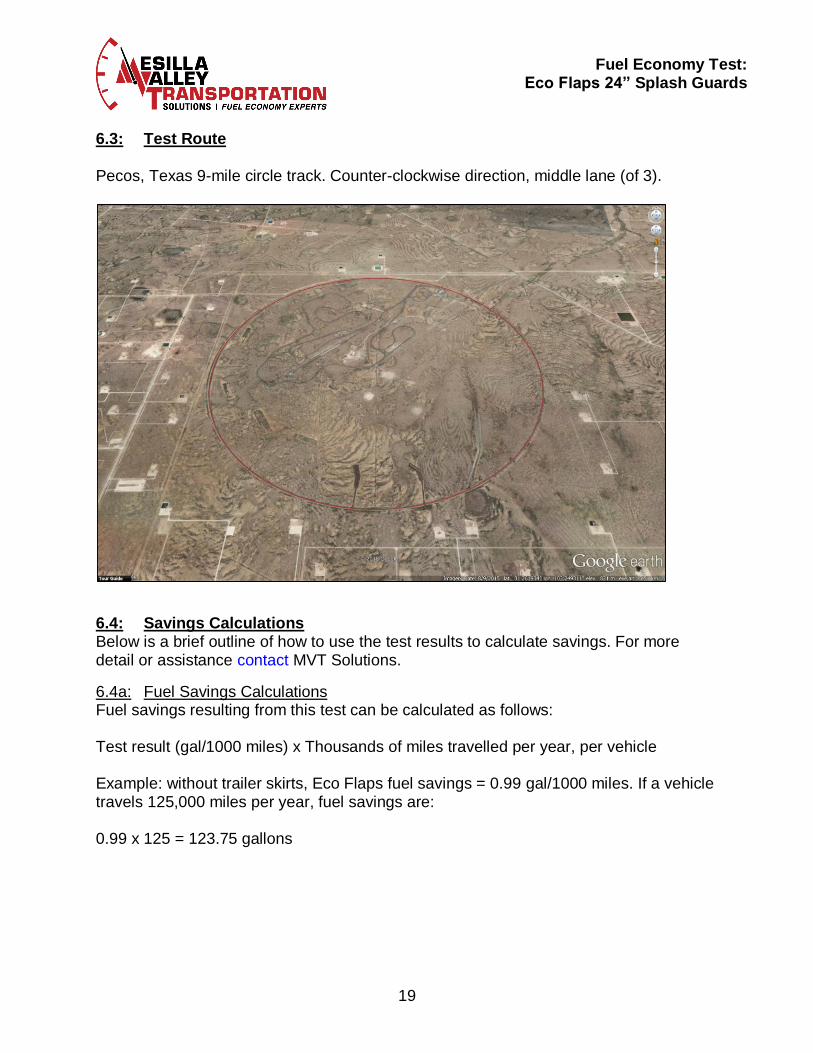
6.3: Test Route Pecos, Texas 9-mile circle track. Counter-clockwise direction, middle lane (of 3).
6.4: Savings Calculations Below is a brief outline of how to use the test results to calculate savings. For more detail or assistance contact MVT Solutions.
6.4a: Fuel Savings Calculations Fuel savings resulting from this test can be calculated as follows: Test result (gal/1000 miles) x Thousands of miles travelled per year, per vehicle Example: without trailer skirts, Eco Flaps fuel savings = 0.99 gal/1000 miles. If a vehicle travels 125,000 miles per year, fuel savings are: 0.99 x 125 = 123.75 gallons
20
Fuel Economy Test: Eco Flaps 24” Splash Guards
6.4b: Financial Savings Calculations Financial calculations can be made by multiplying the fuel saved by the fuel price. Using the U.S. average retail price of diesel fuel in 2015, $2.707 /gal: 123.75 gallons/year x $2.707 /gal = $334.99 /year in fuel savings To continue calculating the net financial savings requires input of the product investment, fleet trailer to truck ratio and other pertinent variables unique to each carrier. Contact MVTS for assistance if required.
6.5: Product Details Product Company Contact: Eco Flaps 5210 Maryland Way Brentwood, TN 37027 866-543-5277 [email protected] www.ecoflaps.com Test Product:
Eco Flaps splash guards
Dimensions o Truck: 24” width x 24” height o Trailer: 24” width x 30” height
Note: other sizes available based on vehicle configuration.
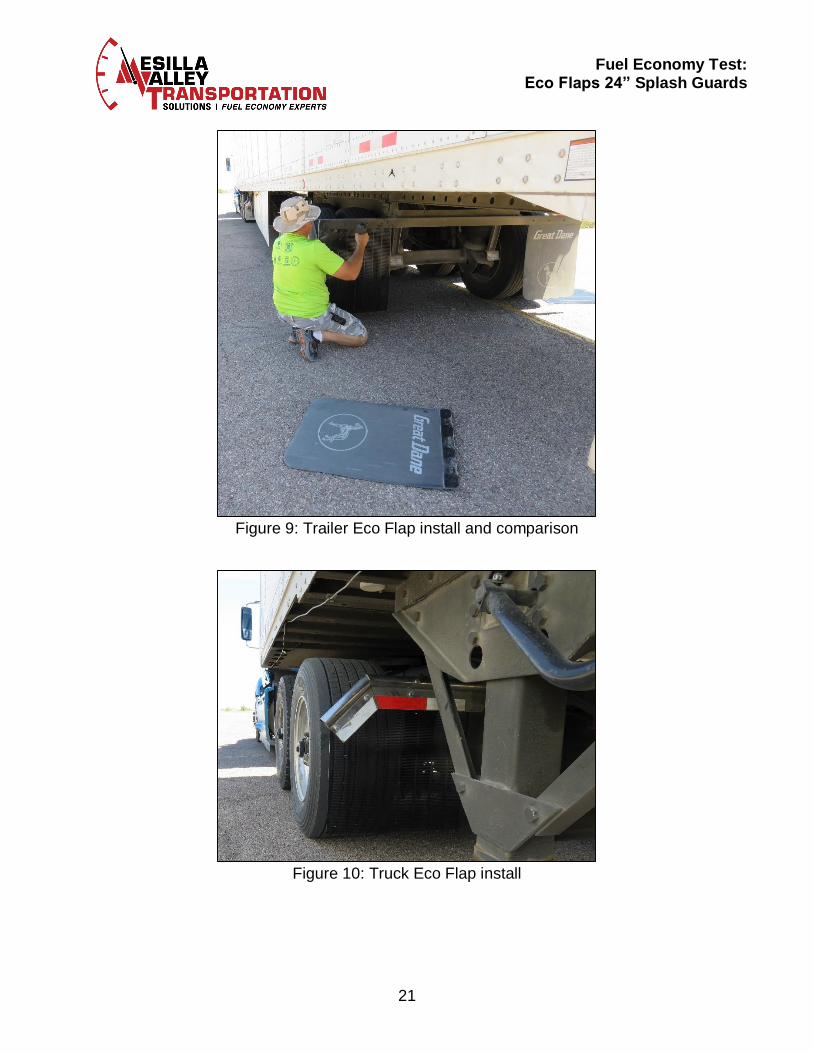
6.6: Product Installation Eco Flaps were installed as directed with ‘BACK’ label facing rearward on the vehicle. Outer edge of the Eco Flaps was aligned with the outer edge of the tire.
21
Fuel Economy Test: Eco Flaps 24” Splash Guards
Figure 9: Trailer Eco Flap install and comparison
Figure 10: Truck Eco Flap install
22
Fuel Economy Test: Eco Flaps 24” Splash Guards
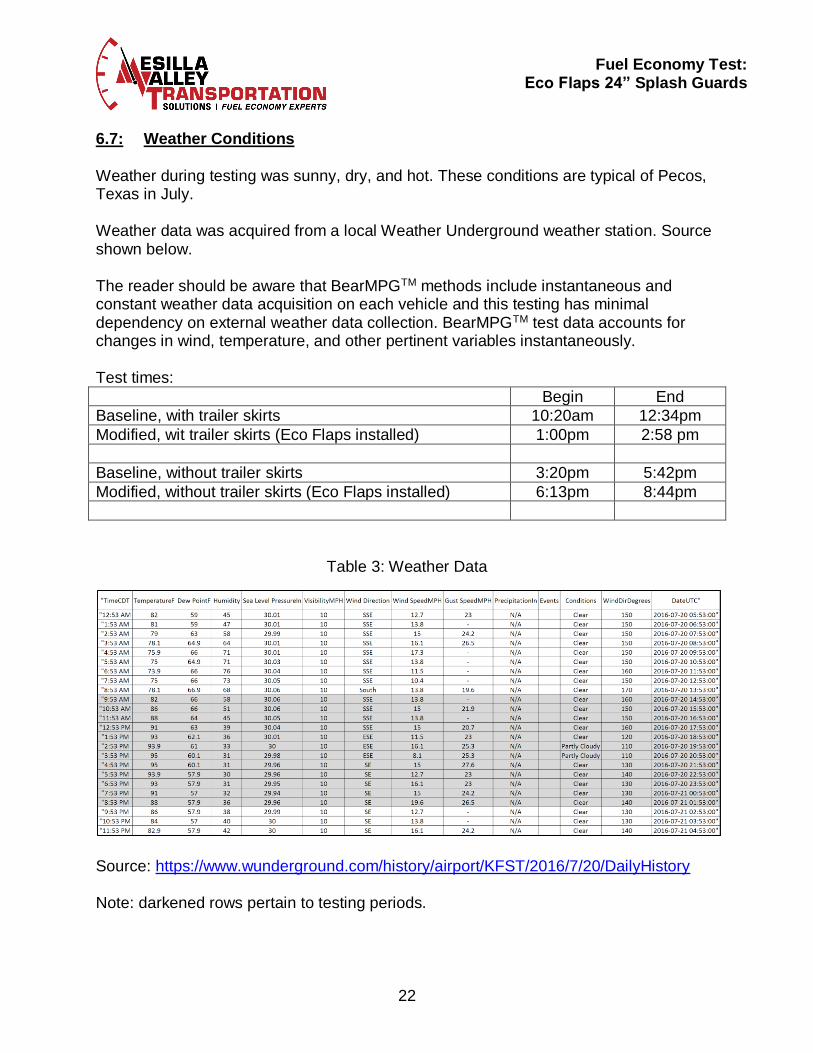
6.7: Weather Conditions Weather during testing was sunny, dry, and hot. These conditions are typical of Pecos, Texas in July. Weather data was acquired from a local Weather Underground weather station. Source shown below. The reader should be aware that BearMPGTM methods include instantaneous and constant weather data acquisition on each vehicle and this testing has minimal dependency on external weather data collection. BearMPGTM test data accounts for changes in wind, temperature, and other pertinent variables instantaneously. Test times:
Begin End
Baseline, with trailer skirts 10:20am 12:34pm
Modified, wit trailer skirts (Eco Flaps installed) 1:00pm 2:58 pm
Baseline, without trailer skirts 3:20pm 5:42pm
Modified, without trailer skirts (Eco Flaps installed) 6:13pm 8:44pm
Table 3: Weather Data
Source: https://www.wunderground.com/history/airport/KFST/2016/7/20/DailyHistory Note: darkened rows pertain to testing periods.
23
Fuel Economy Test: Eco Flaps 24” Splash Guards
6.8: Test Personnel
6.8a: MVT & MVT Solutions
Allan Dahringer, Director of Maintenance, MVT
Allen Gattis, Research & Development, MVT
Nestor Vidaurri, Jr, Service Programs Manager, MVT
Louis Valverde, Corp. Parts Manager, MVT
Jose Hernandez, Technician, MVT
Ron Knowles, Shop Manager, MVT (Nashville)
Daryl Bear, Lead Engineer, MVT Solutions
6.8b: Test Vehicle Drivers Test without trailer skirts:
Ron Knowles (Compare vehicle), Allan Dahringer (Modified vehicle with Eco Flaps)
Test with trailer skirts:
Allen Gattis (Compare Vehicle), Jose Hernandez (Modified vehicle with Eco Flaps)
6.9: MVT Solutions Contact Info Test Engineer: Daryl Bear [email protected] 317-603-9325 Website: www.m-v-t-s.com