Embed Size (px)
Citation preview
Climate-Friendly Agribusiness Value Chains Sector Project (RRP MYA 48409-003)
Detailed Poverty and Social Impact Analysis
August 2018
MYA: Climate-Friendly Agribusiness Value Chains Sector Project
CURRENCY EQUIVALENTS
(As of 16 August 2018)
Currency unit – Myanmar Kyat (MMK) MMK1.00 = $0.000666
$1.00 = MK1,501.00
ABBREVIATIONS
ADB − Asian Development Bank ASEAN − Association of Southeast Asian Nations CDZ − central dry zone CEC − Commodity Exchange Center DOA − Department of Agriculture GDP − gross domestic product IHLCS − Integrated Household Living Conditions Surveys LIFT − Livelihoods and Food Security Trust Fund MOALI − Ministry of Agriculture, Livestock and Irrigation
NGO − nongovernment organization PPP − purchase power parity
NOTE
In this report, “$” refers to United States dollars.
I. EXECUTIVE SUMMARY
1. The proposed Climate-Friendly Agribusiness Value Chains Sector Project will invest in pro-poor and inclusive agricultural value chains in three countries of the Greater Mekong Subregion – the Republic of the Union of Myanmar (Myanmar), the Lao People’s Democratic Republic (Lao PDR), and the Kingdom of Cambodia. This report presents the findings of the socio-economic, poverty and gender assessment undertaken during the preparation and design of the Climate-Friendly Agribusiness Value Chains Sector Project in Myanmar.
2. The project preparatory technical assistance social development consultant team carried out participatory socioeconomic assessments in selected target areas to better understand the social, poverty and gender aspects of the target populations in subproject areas.
3. Findings showed that the local farming populations in subproject areas 1 and 2 are largely homogeneous although there are more casual workers and underemployed households in subproject area 1.
4. The target populations needs and demands were assessed in relation to the proposed subprojects. It was found that women and men expressed the same priorities. In Feasibility Study 1 (beans and pulses processing) both men and women were motivated to gain benefits in moving up the value chain and participate in capacity building activities. There is a good fit with beneficiaries absorptive capacity for the intervention.
5. In Feasibility Study 1 (seed farm improvements), there is a good fit with absorptive capacity of male and female technical staff and rice seed growers, for the upgrading and improvements related to rice seed production.
6. In Feasibility Studies 2 and 3 (irrigation interventions through rehabilitation of tertiary canals and shallow tube wells) farmers overriding priority was to have access to a reliable supply of water that would allow them to cultivate two crops per year. Farmers are vulnerable to erratic climatic events.
7. For ensuring that there is a poverty focus to project interventions, it is recommended that identified poor households in subproject areas should be targeted for unskilled job opportunities related to civil works. Gender disparities in employment remain extensive in Myanmar, primarily because of traditional attitudes about appropriate occupations for women and men. This is particularly true for the construction sector, where it is believed that women either cannot or do not wish to engage in manual labor. Women are already engaged in manual labor (e.g., rural road repair), and there are many unskilled construction jobs that women could do in order to earn cash wages.
2
II. INTRODUCTION
8. This report presents the findings of the poverty and social assessment undertaken during the preparation and design of the Climate-Friendly Agribusiness Value Chains Sector Project in Myanmar.
9. The proposed project will invest in pro-poor and inclusive agricultural value chains in three countries of the Greater Mekong Subregion – the Republic of the Union of Myanmar (Myanmar), the Lao People’s Democratic Republic (Lao PDR) and the Kingdom of Cambodia (Cambodia).1
10. The approach to project preparation included identifying a small number of representative subprojects and feasibility studies based on established criteria (e.g., contribution to food security, energy security, water security, environmental sustainability, and positive social impacts) and through stakeholder consultations. Myanmar has experience in sector modality in terms of identifying and realizing subprojects during project implementation, and has (i) an agricultural sector development plan; (ii) reasonable institutional capacity to implement the plan; and (iii) suitable policies applicable to the sector. Furthermore, capacity building will be integral to the investment.
11. Three subprojects have been identified and feasibility studies were conducted. The subprojects and feasibility studies are:
(i) Subproject 1: Chepa seed farm in Shwebo District (ii) Subproject 2: Renovation of minor irrigation canal of Direct Main L2 of Kyi Ywa (iii) Subproject 3: Tube well irrigation in Kunn Village
12. The social development consultant team carried out participatory socioeconomic assessments with populations in these three areas, and the findings are presented in this report. The social, poverty and gender aspects of the target populations were analyzed to better understand the social context and conditions of the beneficiaries in the subproject areas. In addition, the proposed subprojects were discussed with beneficiaries in order to elicit their views, opinions and recommendations. The detailed gender analysis is presented separately together with a gender action plan for the project.
A. Method used for preparing the poverty and social assessment
13. Because of limited time allocated (1 person-month for International Specialist and 1.5 person-months for National Specialist), information concerning the beneficiary populations in the subproject areas was collected from:
(i) secondary data including recent social survey reports and publications; (ii) focus groups (both mixed gender and with women separately) with target
beneficiaries; (iii) key informant interviews with local village leaders; (iv) interviews both face-to-face and by telephone with key informants; (v) meetings with key staff from the Ministry of Agriculture, Livestock and Irrigation
(MOALI) and Ministry of Social Welfare; and (vi) meeting with ADB Rural Development Specialist.
1 ADB. 2015. Proposed Loans and Grants Cambodia, Lao People’s Democratic Republic and Myanmar: Climate-
Friendly Agribusiness Value Chains Sector Project. Manila.
3
B. Background
14. Myanmar has the lowest life expectancy and the second-highest rate of infant and child mortality among the Association of Southeast Asian Nations (ASEAN) countries. Only one-third of the population has access to the electricity grid, and road density remains low at 219.8 kilometer per 1,000 square kilometer of land area. With the liberalization of the telecommunications sector in 2013, mobile and internet penetration has increased significantly from less than 20% and 10% in 2014, to 60% and 25% respectively.
15. Poverty in Myanmar is concentrated in rural areas, where poor people rely on agricultural and casual employment for their livelihoods. Many live near the poverty line and are sensitive to economy-wide shocks. Since the majority of the poor are engaged in small scale agriculture, they may be shielded from recent inflationary pressure but the urban poor are likely to be highly affected by recent bouts of food price inflation.
16. Economic growth in Myanmar eased to 7% in 2015-2016 due to a supply shock from heavy flooding, a slowdown in new investment flows and a more challenging external environment. The heavy floods in July 2015 affected some of the poorest and most vulnerable people in the country and caused inflationary pressures.
17. As the largest country in mainland Southeast Asia, Myanmar has one of the lowest population densities in the region, with fertile lands, significant potential to increase its production, yields and profits in agriculture, and a rich endowment of natural resources.2
C. Analysis of poverty issues in Myanmar3
18. Key health indicators in the Millennium Development Goals have improved in Myanmar over the last 2 decades.4 Even so, the country continues to suffer some of the worst health conditions in the world. Malaria, tuberculosis, and HIV cause substantial mortality and morbidity. Reported malaria cases are six times higher and tuberculosis prevalence 1.3 times higher than the average reported among seven of the 10 countries in the ASEAN.5 Increasingly, non-communicable diseases are responsible for a high proportion of deaths as rapid urbanization and socioeconomic changes lead to increasingly unhealthy lifestyles.
19. Years of underinvestment have created challenges in Myanmar’s education sector, and education indicators still lag behind other ASEAN countries. As a critical foundation for evidence-based reforms, in early 2012 the government announced the first systematic analysis of the entire education sector in two decades. The reports included four technical annexes supported by ADB and other development partners and covering secondary education, higher education, TVET, along with a labor market analysis on the demand for higher education and TVET graduates (footnote 4). Myanmar’s education system has suffered prolonged underinvestment. Public investment on education was less than 1% of its gross domestic product (GDP) in 2011, the lowest among 16 Asian economies, where average spending was 3.6%. Between 2011 and 2013, government education expenditure more than tripled in nominal terms (from MMK310 billion to MMK1.1 trillion), rising from roughly 0.8% to about 2% of GDP, alongside rapidly increases in
2 World Bank website (access in 2016) 3 Schmitt-Degenhardt, Stephan. August 2013. A Regional Perspective on Poverty in Myanmar. UNDP. 4 ADB. 2015. Myanmar Human Capital Development, Employment and Labor Markets. Manila. 5 Cambodia, Indonesia, the Lao People’s Democratic Republic (Lao PDR), Malaysia, the Philippines, Thailand, and
Viet Nam.
4
GDP.6 Confirmed budget figures for 2014 and 2015 have shown further increases of more than 20% a year (footnote 4).
20. Low public expenditure on education in recent years has meant that households bear the brunt of costs, and were the source of about 70% of total education spending in Myanmar in 2010.7 Data from the Household Living Condition Survey 2009–2010 show education accounts for an average of 4.7% of total household cash expenditures in households with at least one child studying (footnote 4). A wide variation in household spending in education is seen across expenditure quintiles. Households in the poorest quintile with children in school spent roughly MMK27,650 a year on education in 2011, or 2.3% of total expenditure. Households in the richest quintile with children in school spent roughly MMK203,000, or 6.6% of total expenditure.
21. Analysis also points to sharp disparities across states and regions, with gaps widening in secondary education. Particularly since access to TVET is very limited for those not completing secondary schooling, workforce prospects are particularly bleak for most rural and poor youths (including 69% of girls and 67% of boys in poor households) who are unable to complete middle school, especially given international evidence that a middle school education is often a minimum prerequisite to access formal and/or modern sector employment and participate in opportunities that economic growth brings.8
22. Poverty incidence. Based on the results of the Myanmar Integrated Household Living Conditions Surveys (IHLCS) of 2005 and 2010, the poverty incidence and the poverty depth were reduced by almost 7 percentage points (from 29.6% to 22.7%), or by 5.2% annually between 2005 and 2010. By international comparison, Myanmar performed well in terms of poverty reduction (regionally, only Sri Lanka, Thailand and Viet Nam reduced their poverty by a higher annual percentage (but over a longer period). At the same time, GDP increased by 7.8% annually.9
23. The overall poverty rate changes substantially if measured according to the internationally used poverty lines of $1.25 and $2.00 per day, at purchase power parity (PPP). At $1.25 PPP, it decreases to only 1.7%, and at $2.00 PPP per day, it increases to 26.5%.10
24. However, poverty reduction was uneven between the States and Regions of the Union. While the poverty incidence decreased in almost all states by up to 66%, it increased in Ayeyarwady, Kayin, Rakhine, and Yangon.
25. Inequality between urban and rural areas increased slightly from 1.6 times higher in 2005, to 1.8 times in 2010. These ratios are however average for the Asia-Pacific region (in Bhutan they are 18 and almost six in Viet Nam) Out of 22 countries, Myanmar is slightly above median.11
6 World Bank. 2014. Myanmar: Decentralizing Funding to Schools Project.
http://wwwwds.worldbank.org/external/default/WDSContentServer/WDSP/IB/2014/04/07/000442464 _20140407113344/Rendered/PDF/IPP6960REVISED0Box385175B00PUBLIC0.pdf
7 Comprehensive Education Sector Review (CESR), ADB, and Australian Aid. 2013. Myanmar Comprehensive Education Sector Review Phase 1: Rapid Assessment: Technical Annex on the Secondary Education Subsector. Yangon. http://www.adb.org/projects/documents/cesr-p1rapid-assessment-annex-secondary-education-tacr
8 Spohr, Chris. 2003. Formal Schooling and Workforce Participation in a Rapidly Developing Economy. Journal of Development Economics, Vol. 70/2.
9 http://www.economywatch.com/economic-statistics/Myanmar/GDP_Constant_Prices_National_Currency/ (in constant prices, national currency).
10 World Bank PPP exchange rate of MMK535.61 per $ PPP, calculated at 365 days per year. This yields an equivalent of MMK244,372 and MMK390,995 for the respective poverty lines.
11 ADB. 2012.
5
26. However, there was only slightly more disposable income per person in 2010 than in 2005. As the compound inflation rate between 2005 and 2010 was approximately 128%,12 a basket of goods equivalent to the median consumption expenditure of MMK194,233 in 2005 would cost MMK422,851 in 2010. The actual 2010 median expenditure was MMK477,109 per year, leaving an increase of MMK54,258 (in 2010 prices) over 5 years, or 2.4% annually.13 This calculation disregards relative price changes. The price of rice also increased over the same period by approximately 134.7%,14 and so parts of this calculated improvement are likely to have been used up by relative price increases of rice alone.
27. Poverty and ethnicity. There are no significant variations between the expected and the actual poverty rate of ethnicities. As the IHLCS does not ask for the ethnic background of the respondents, the main language spoken was used as proxy for ethnicity. As expected, the median poverty gap is highest for the Chin speaking and lowest for the Kayah speaking people. For those states where the mother tongue spoken is an indicator for the state, the ranking remains however roughly the same between state and mother tongue. Only the Kayin people appear to be somewhat poorer as people than the average of the Kayin state. The sample is however small. Should the population census be valid it would appear that the household surveys underrepresented the Kayin and Hindi or other Indian and foreign languages, and overrepresented other indigenous languages (footnote 3).
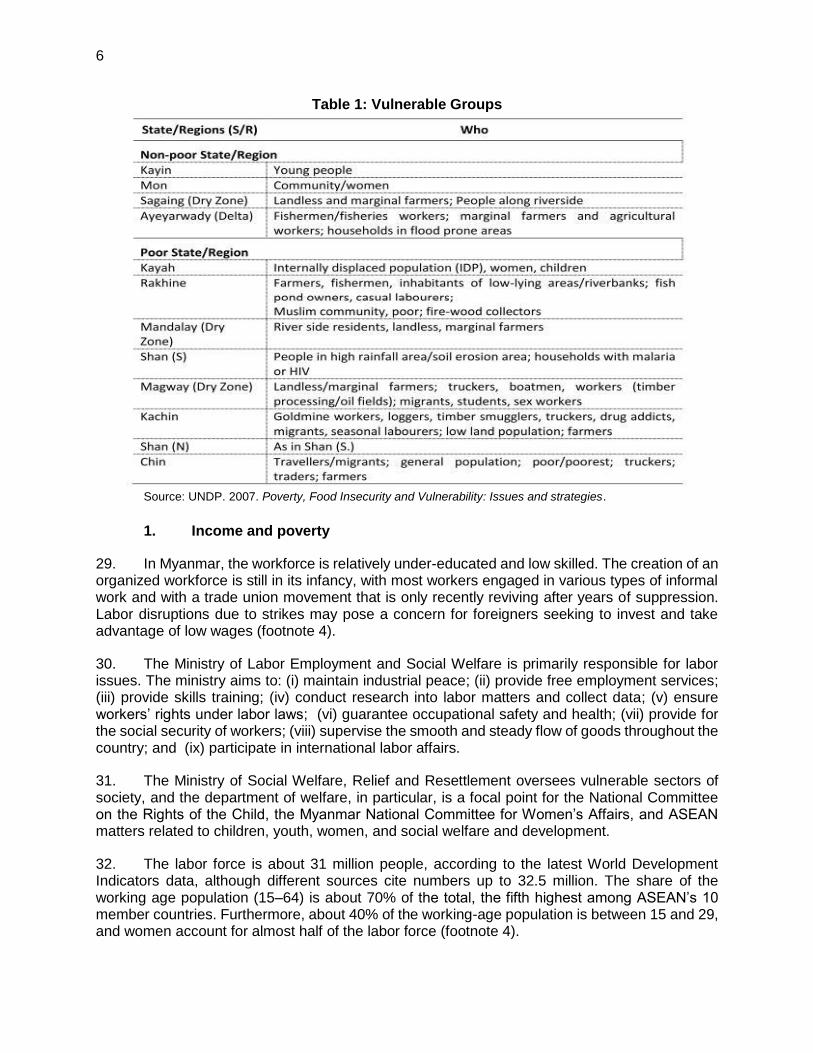
28. Reasons for poverty entry. The poverty dynamics report highlights some key reasons why people enter into poverty. The main reasons for entry into poverty are predominantly the effects of storms, floods and stagnant water, and the lack of, loss of, or inability to work. But entrants into poverty are also much less likely than the chronically poor to be associated with agriculture and more likely to be associated with manufacturing, construction, trades and/or repairs and other - presumably because of a loss of markets or job. Based on a UNDP 2007 analysis, the following table shows which groups of people by state are the most vulnerable and therefore likely to enter into poverty:
12 World Bank data. 13 The average expenditure increased by only 0.7% annually, indicating a more equal expenditure distribution over the
population. 14 According to CSO data, 1 Pyi of Emata rice cost in 2005 MMK318.74, and in 2009 MMK737.25, which is an annual
increase of 23.32%. As 2010 data are not available, it is assumed that its price increased from 2009 to 2010 roughly in line with overall inflation of 1.47% (World Bank data), yielding a compound price increase of 134.7%. Note that the IHLCS revealed an actual average price of Emata of MMK916 in 2010.
6
Table 1: Vulnerable Groups
Source: UNDP. 2007. Poverty, Food Insecurity and Vulnerability: Issues and strategies.
1. Income and poverty
29. In Myanmar, the workforce is relatively under-educated and low skilled. The creation of an organized workforce is still in its infancy, with most workers engaged in various types of informal work and with a trade union movement that is only recently reviving after years of suppression. Labor disruptions due to strikes may pose a concern for foreigners seeking to invest and take advantage of low wages (footnote 4).
30. The Ministry of Labor Employment and Social Welfare is primarily responsible for labor issues. The ministry aims to: (i) maintain industrial peace; (ii) provide free employment services; (iii) provide skills training; (iv) conduct research into labor matters and collect data; (v) ensure workers’ rights under labor laws; (vi) guarantee occupational safety and health; (vii) provide for the social security of workers; (viii) supervise the smooth and steady flow of goods throughout the country; and (ix) participate in international labor affairs.
31. The Ministry of Social Welfare, Relief and Resettlement oversees vulnerable sectors of society, and the department of welfare, in particular, is a focal point for the National Committee on the Rights of the Child, the Myanmar National Committee for Women’s Affairs, and ASEAN matters related to children, youth, women, and social welfare and development.
32. The labor force is about 31 million people, according to the latest World Development Indicators data, although different sources cite numbers up to 32.5 million. The share of the working age population (15–64) is about 70% of the total, the fifth highest among ASEAN’s 10 member countries. Furthermore, about 40% of the working-age population is between 15 and 29, and women account for almost half of the labor force (footnote 4).
7
33. Labor force participation in Myanmar is higher than in other Asian countries. Myanmar has an almost 80% labor force participation rate, the second highest in Asia after Cambodia. The rates for both Myanmar and Cambodia continued to increase during 2000 to 2012, but declined in many other countries.
34. A key labor market problem in Myanmar is that much of the workforce is unskilled, with low educational attainment.
35. According to a survey by the Japanese External Trade Organization, wages in Myanmar are the lowest in the region. However, employers report that finding skilled and talented workers is challenging, and attracting the professional diaspora back to the country may be difficult on grounds of these migrant workers earnings expectations and adjusting to a different standard of living (footnote 4).
36. Unemployment in Myanmar is low by regional standards. Official data on unemployment are lacking, although there are numerous other data sources. The World Bank’s World Development Indicators suggest that unemployment in Myanmar ranks in the middle of ASEAN and neighboring countries, at around 4%, higher than in Brunei Darussalam, Cambodia, India, the Lao PDR, Malaysia, Thailand, and Viet Nam (footnote 4).
37. The World Bank data also indicate that women have slightly higher unemployment rates (at 5%) than men (4%). In youth unemployment, however, the differences are more pronounced, with female youth unemployment at 13% and male youth unemployment at 10%.
38. The nature of work in Myanmar is predominantly informal. Some 41% of the workforce is classified as own account workers, while 15% are contributing family members and 18% casual workers. Together, 74% of the workforce can be classified as informal.15 While unemployment is low, there is considerable underemployment, with more than a third of the workforce (38%) working less than 44 hours per week (41 for women). Underemployment is also on the rise, climbing 3.6 percentage points from 2005 to 2010 (footnote 16).
39. Underemployment gap. Underemployment at household level is negatively correlated with household expenditure. The average underemployment gap per household is only slightly lower for poor households than for non-poor. It can be concluded from this that it is not underemployment which leads to poverty, but the low return of employment received by poor (versus non-poor). In the case of employed people, the low return is a result of low wages. In fact, since 2005, real wages have barely grown. In the case of the self-employed, it is likely a result of low productivity.
40. Migration. Based on survey figures there were approximately one million migrants in 2010.16 This possibly excludes emigrants – those who settled abroad or in other regions without intending to return. This figure is highly likely to be on the very low side. In Thailand alone, there were approximately 1.45 million migrant workers officially registered in 2012. As unofficial
15 MNPED, Swedish International Development Cooperation Agency (Sida), United Nations Children’s Fund (UNICEF),
and United Nations Development Program (UNDP). 2011. Integrated Household Living Conditions Survey in Myanmar (2009–2010): MDG Data Report. Yangon.
16 All information based on UNDP 2013. Role of remittances in economic wellbeing and poverty. Note that these results must be treated with much care; the survey is unlikely to be really representative, and the database for such analysis appeared to be very small.
8
migration is likely to be significantly higher than official migration, the apparent discrepancy is large.
41. Only 6.3% of households have migrant workers, with poor households being about 30% more likely to have migrant workers than non-poor households. But there are strong variations between the states. In Chin, Taninthayi and Kayin for example, there are up to five times more migrant-sending households than the national average and they send by far the greatest number of migrant workers per household.
42. Remittances are very important for those households who receive them. At Union level, remittances make up about 57% of overall household expenditure (or MMK1.1 million per year), with 75% for rural and 45% for urban households. But at Union level, the importance of remittances does not appear very high, representing only 3.4% of household income. Based on these figures, the whole country would have received approximately $80 million in 2010, lower than the World Bank’s estimate of $133 million, which itself was assumed to have been a very low estimate.
43. Overall, remittance-receiving households have 6% higher consumption expenditures than those without, ranging from 14% less in Taninthayi State to 30% more in Mandalay region. Among remittance-receiving households, remittance income increases (not uniformly) from about MMK500,000 Kyat annually for the poorest decile, to MMK1.6 million for the richest. Over the whole population, this translates into MMK20,000 to MMK110,000 Kyat.
44. Throughout the Union, food poverty, general poverty, and the poverty gap is higher for remittance-receiving households than for non-receiving households. If correct, this would indicate that particularly the poorest of the poor households send out migrant workers, confirming the poverty alleviation function of migration and remittances. These workers however, are likely to be very low skilled, and only able to afford to migrate to the least favorable areas, and able only to send marginal amounts of remittance home.
45. There appear to be very strong variations among the regions and states. Though Chin, Taninthayi and Kayin appear to receive less remittance per migrant worker – indicating potentially lower skills per worker, on average households in these states receive by far highest remittance amounts: approximately three times the national average for Kayin and Chin, and twice the average for Taninthayi state. In Chin, the poorest state of all, average remittance (over MMK186,000) represents approximately 12% of overall household consumption expenditure, and 40% of the total expenditure of remittance-receiving households.
46. Main occupation. Over 50% of the households surveyed are engaged in agriculture as their main occupation. Wholesale, retail trade and repairs are the second largest occupation at over 15% of the total. Across the major occupations, poor and non-poor are almost equally distributed. As can be expected, the poor are slightly more prevalent in low-skilled jobs such as agriculture, fishing mining, and construction, while non-poor are more prevalent in jobs in the hotels and restaurants sector and transportation.
47. Men are much more likely to be engaged in agriculture or fishing; women are more likely to be engaged in trade, education, other services and manufacturing. For poor households the gender differences become less significant and female-headed poor households are more substantially likely to be engaged in manufacturing and trade.
9
48. Own account workers. Overall, 22% of household members – or roughly one person per household works on own account (median: 16.7%), but 42.4% of the households are without any own account worker. Myanmar’s business sector appears to be at least twice the global average, leading to the conclusion that the vast majority of these businesses are necessity businesses, which indicates levels of poverty and lack of opportunity. The share of own account workers in rural areas is higher than in urban areas, showing also that employment is more difficult to obtain in rural areas. Male and female-headed households have on average similar shares of own-account workers, but the median for male-headed households is about 17% while it is 0% for female-headed households. This indicates a slightly more two poled distribution of own account workers among female-headed households than among male: over 50% (50.8%) do not have any own account workers in the household (versus 40.3% for male), and those who do, have a high share. The Shan and Chinese-speaking households in particular stand out as having a high percentage of own account workers.
49. Agricultural land ownership. Approximately 45% of the population owns land, with an average acreage of 6.25 and a median of 4 acres. Although there are ten times more rural than urban-based landowners, the rural population also makes up 70% of the total population, thus resulting in 14% of urban and 59% of the rural population being landowners. The average size of landholding does not differ much between urban and rural populations.
50. The population in Chin state has the smallest average and median-sized rural land holding at 2.1 and 2.0 acre, respectively, representing 34% and 50% of the overall mean and median. This is followed by Shan in the East, and, in terms of median only, Rakhine, Kachin, Kayin, and Shan in the South. In all other states the mean / median landholding is at least 4 acres.
51. The size of landholding is positively correlated with household expenditure. Male-headed households have landholdings which are approximately 50% larger that female-headed landholdings (mean and median).
52. 30% of the poor are reported to have landholdings of 5 acres or more. In fact, there are households with up to 60 acres of land that still fall under the category of poor. In comparison, the Livelihoods and Food Security Trust Fund (LIFT) Baseline Survey Report17 found that 1.3% of households with landholdings of 5 acres and above reported a monthly average income of below MMK25,000 (or 80% of the poverty line), and 7.8% below MMK50,000 per month. Poverty despite such large landholdings might be a sign of either infertile land or lack of resources for land cultivation. Two hundred forty poor households have 3 acres which is also the median landownership size. The modal value of for poor households is 2 acres (289 households).
53. The average landholding size of poor agricultural households is 4.4 acres, while that of non-poor is 7.3 acres, indicating that probably at least 5 acres are required to break out of poverty.
54. Mechanization. Only 2.1% (133) of the surveyed households were reportedly mechanized (i.e., by either ownership or co-ownership of tractor), and of these only nine poor households.18 Mechanization of the farm is positively correlated with household expenditure.
17 LIFT. 2012. LIFT Baseline Survey Report. Yangon. 18 A closer look at the link between land ownership and mechanization shows however that the response to the
corresponding questions were very incomplete; most larger land holdings would not own or co-own a tractor. For those who owned between 30 acres and 400 acres, only one out of 93 households owned a tractor, and only 24 out of 1,145 who owned between 10-30 acres owned a tractor.
10
55. Most significant problems. Drought, followed by crop pest infestations and flooding were seen by respondents as the most significant problems faced in agriculture. The multiple-choice answers provided by the survey are partially overlapping: irrigation is, for example, the principal answer to drought, and low crop yields are the consequence of a variety of problems.
56. Both access to credit and access to markets, were only cited by 1.3% and 0.4%, respectively, of those who stated that they had a problem in agriculture. Similarly, lack of labor was only stated by 1.1% of respondents, although it was frequently mentioned in discussions.
57. The diversity of problems faced by poor farmers is significant. In some states such as Kachin, Bago, Mon, Rakhine, Yangon and Shan (East), and to a lesser degree also in Shan (North and East) and Taninthayi, there were a range of major problems cited indicating that problems were at individual farm level rather than affecting the whole state. On the other hand, there are states with very clearly identified major problems. In Chin the problem of vermin and/or insect infestation was cited by 41% of total respondents. In Sagaing, Magway, Mandalay and Shan (South) and to a lesser degree Kayah, drought was cited by 35%, 61%, 64%, 39% and 15% of households, respectively. In Ayeyarwady, both floods (11%) and vermin/insect infestation (13%) were cited, and in Kayin state low selling price of crops was cited by 15% and vermin and/or insect infestation by 14% of respondents.
58. Crop Losses. Myanmar loses on average annually almost 8% of its harvest due to natural calamities (storm, flood, drought, pests). The state particularly strongly affected by flood is reportedly Ayeyarwady; by drought Sagaing, Magway and Mandalay, and by pests, Chin state. Overall, the states which are worst affected by calamities are Magway, Mandalay, Ayeyarwady and Sagaing, each losing annually around 10% or more of crops due to calamities.
59. Gender dimensions of poverty. The sex-disaggregated data on poverty are extremely limited. Poverty is currently measured only at the household level because it is difficult to calculate individual measures of income or expenditure poverty. Nor is there a clear definition of income poverty of individuals due to lack of data. Earnings may be disaggregated by the sex of the earner, who may not control that income. For example, men may control the money that women earn.19 Household expenditure data are often used to measure poverty because they are more accurate than income measurements. But these data do not include the sex of the person making or benefiting from the expenditure. Women in Myanmar typically decide on and are responsible for small daily expenditures, but men may control large expenditures and spend more on personal consumption, while women tend to spend more on family needs first. Thus, even if women control household expenditures, they may still be the poorest members of the household (footnote 20). Myanmar housewives traditionally keep hold of and save the money that men earn, but this does not mean that they are able to control spending. Decisions related to large family expenditures are made either jointly or mainly by men. In Myanmar culture and society, women are usually expected to depend on men from childhood to old age. In general, when choosing a husband, girls and women in Myanmar take into consideration men’s earning capacity and financial status. For this reason, it is not common for women to have separate savings or bank accounts particularly in poor families. Men are heads of household and the main household decision-makers reflecting the lead position bestowed on them by society.
60. As an alternative, the analysis of outcome indicators of poverty, such as lack of education, illiteracy, poor nutrition and poor health, indicate some gender differences in the 2009–2010
19 L. Corner. 2008. Making the MDGs Work for All: Gender-Responsive Rights-Based Approaches to the MDGs. New
York: UNIFEM (now part of UN Women).
11
IHLCS data.20 The immunization coverage for girls under the age of one year was greater than for boys at 87.5% compared with 86.8% for boys, but the proportion of malnourished girls younger than 5 years was slightly larger than for boys of that age at 5.9%, compared with 4.9% for boys.
61. In terms of education, female-headed households with no adult males had an enrollment ratio that was 10% lower than households with adult males. Within female-headed households, the enrollment ratio for males was somewhat larger than for females.21
62. Because the poverty headcount ratio does not capture the degree of poverty or distribution of poverty among the poor, poverty can be measured through time-use or time-allocation which allow comparisons between females and males, and showing differences between the amount and type of work done by women and men. Men are more likely to be in paid work while women are more likely to spend most of their time on unpaid domestic and care work. Men also tend to have more rest and leisure time than women. A comparison of time use might indicate that women’s time constraints reduce their access to education, training, information, health care, social services, employment, and other income-earning opportunities. The greater time constraints face by Myanmar women in society are generally accepted by them as normal.
63. Female-headed households and poverty: A 2013 study showed that 80% of Myanmar households were headed by a male and 20% by a female; in 72% of female-headed households the head was widowed. A total of 13% of female-headed households had adult males in them, and these households were similar to male-headed households in terms of household size, composition, resources, and well-being. In Myanmar society, a son frequently acts as head of household in the absence of a male parent. However, the 7% of female-headed houses with no adult males had fewer resources and diverse income sources (footnote 20). The IHLCS data also indicated that there were regional differences related to numbers of female-headed households, possibly due to high levels of male out migration from some areas or higher levels of civil unrest in some regions that forced men away from their homes.22
64. On average, female-headed households are not poorer than male-headed households, but the average may conceal a polarized distribution. At the lower end of the scale, female headship may result from desertion, divorce, or separation, and the woman head of household may be less educated, have an insecure livelihood, and have many children and other dependents. There is significant social stigma attached to divorce and separation and women themselves are blamed for these circumstances and may not receive support. If any particular analysis focuses only on the average across all female-headed households, these poor households may be overlooked (footnote 20).
65. It is more revealing to disaggregate household data by income level and household headship, enabling the poorest female- and male-headed households to be identified and then their situations analyzed. This analysis will show that some female-headed households, particularly those without adult males and older women living alone, are among the poorest and require special attention. Many women in male-headed households are also poor because they may suffer deprivation in all areas of capability. In fact, some of the poorest women may live in male-headed households and even in male-headed non-poor households, particularly if they are elderly, disabled, or victims of gender-based violence. The real issue is to identify which
20 B.N. Tiwari, S. Rahman, and K. Tun. 2011. Poverty, Food Insecurity and Vulnerability: Issues and Strategies
(Myanmar). Background Paper for Development Policy Options. Yangon. 21 J. Desai. 2013. The Gender Dimensions of Living Conditions in Myanmar. Yangon. This report is a gender analysis
of two Integrated Household Living Conditions Surveys, in 2004–2005 and 2009–2010. 22 IHLCS data for 2004–2005 and 2009–2010.
12
households suffer from hunger and poverty (footnote 20). Older women are the poorest members of the household. Very old men may also be frequently powerless in the community because they may have devoted little time in the past to taking care of their families.
D. Conclusion: Poverty in Myanmar
66. According to the national poverty line, Myanmar had reduced its overall poverty, its food poverty, and its poverty gap up by 2010, but the real improvements since 2005 in terms of purchasing power were rather small. There are also indications that the uniform national poverty line is may be misrepresenting the situation at state level: in 12 out of the 17 observed regions, the actual poverty rate might be higher.
67. Myanmar’s poverty is widespread, but shallow, with the median income only 25% above the poverty line. Small improvements could thus bring a large number of people out of poverty, and small shocks can also bring an even larger number of people into poverty. Myanmar is exposed to many natural calamities, costing annually an estimated 8% of agricultural output. Currently the country’s economic development depends strongly on natural resources with volatile prices, thus making it sensitive to shocks.
68. Myanmar’s inequality is extremely low. GDP increases in countries with low income (or consumption) inequality have high impact on poverty reduction. But GDP growth is also likely to temporarily increase Myanmar’s inequality.
69. Findings related to Myanmar’s labor market indicate that work is not equally distributed or paid for. Most poor are working poor, indicating very low returns on work, i.e., low productivity. Retail, community service and similar businesses predictably yield a very low return on investment in rural areas.
70. The median poor household spends approximately 24% of its total consumption on rice while the average for the country is almost 20%. Given the low ratio of median income to poverty line, a price increase or decrease of rice by only 10% can therefore bring 150,000 people into poverty, or lift them out of poverty. Productivity increases in rice production, handling and transport, or reasonably priced imports, are therefore very relevant to poverty reduction.
71. The median poor consumes daily 365 grams of rice and the overall average is 445 grams. As the MOALI estimate is 11% higher than this result, it might be that the rice sufficiency is actually higher than usually estimated.
72. With a very high likelihood, a land holding which is smaller than 3 acres is linked to poverty in agricultural households. A land holding of at least three acres would seem to be the minimal threshold for a viable agricultural household, and a holding of approximately 5 acres may provide households with a way of escaping from poverty. These values only represent averages in Myanmar.
73. Poor and non-poor have a similar credit sources and collateral assets, but the poor, and especially the food poor, take out loans mostly for consumptive purposes, while the non-poor do so for investment purposes. Over 40% of the households surveyed and almost 50% of the households defined as poor are indebted, with an overall average debt size of MMK200,000. Debt size for a median poor household is almost MMK50,000. Depending upon the interest rate paid e.g., 20% per month, quarter or half year, household debt represents up to half the poverty gap of the poor household.
13
74. Power connection to the national grid does apparently not lead directly to a reduction in energy expenditures, but seems to increase income generation by approximately MMK10,000 per person per year. In other words, complete national grid connection could lift 20% of the poor out of poverty, without considering additional multiplier effects. Local transport is a significant expense for the median poor household, at about 70% of the amount of the poverty gap. Transport expenses decrease with a higher road density.
75. Education and health care expenses are comparable across all states, but health care expenses show large variations at district level. For the median poor household, health care and education expenses are not significant, but the poor spend significantly less than the non-poor on education, which reinforce low earning ability and poverty status in the medium term.
76. Causes of Poverty. Three sets of factors have been cited as the major causes of poverty in Myanmar: (i) lack of income and assets to satisfy basic needs; (ii) weak economic, social, and political power of certain groups, leading to their exclusion from development benefits; and (iii) vulnerability to shocks (e.g., natural disasters such as typhoon-cyclone Nargis, and economic shocks such as rising fuel prices) because of the limited coping abilities of persons, households, and communities.23
77. The reasons for low income and asset levels in Myanmar include the following:
(i) lack of technological progress in agriculture; a small manufacturing sector, little value added from exports, macroeconomic instability, and untapped tourism potential;
(ii) underemployment, which rose from 34% in 2005 to 37% in 2010, affecting both rural and urban areas;
(iii) larger families in rural areas, leading to fragmentation of farm land and lower farm incomes; low returns on physical assets from low level of agricultural productivity; inadequate infrastructure support, price disincentives, and lack of diversified sources of income; and
(iv) undue reliance on natural resource-based exports, which resulted in an inability to create economic opportunities for the majority of the population (footnote 24).
78. Social Profile of the Poor in Myanmar. The poor in Myanmar can be characterized according to demographics, economic activity of household members, access to water supply, housing and sanitation, health and nutrition, and education. The survey results found that poor households tend to have larger numbers of household members than non-poor households. Poor households also have more economically active members, implying that poverty is not because of lack of work but because of low returns on work performed.24
79. Most poor households are engaged in agricultural activities and/or have members employed as casual laborers. Poor households have smaller farms than non-poor households. Landlessness is much higher among poor households (34%) than non-poor households (19%). Compared to non-poor households, poor households have less access to housing (32% versus 59%), safe drinking water (62% versus 72%), sanitation (72% versus 84%), and electricity (28% versus 55%). Children of poor households have less immunization coverage (76%) than those of non-poor households (86%). Access to maternal health care of poor households (77%) is less
23 B.N. Tiwari, S. Rahman and Khine Tun. 2011. Poverty, Food Insecurity and Vulnerability: Issues and Strategies
(Myanmar). Background Paper for Development Policy Options. Yangon. (ADB Interim Country Partnership Strategy: Myanmar, 2012–2014).
24 ADB Interim Country Partnership Strategy: Myanmar, 2012–2014.
14
than those of non-poor households (86%). Poor households are likely to be less literate than non-poor households (84% versus 93%). They have lower net primary school enrolment (81% versus 90%) and secondary school enrolment (35% versus 59%), and lower overall educational attainment than non-poor households. Only approximately 22% of the heads of poor household have completed middle school or higher, compared with 40% of heads of non-poor household. In rural areas where most of the poor live, 75% of the population has only completed primary education compared with 37% in urban areas.
III. IDENTIFIED FEASIBILITY STUDIES AND/OR SUBPROJECTS AND DESCRIPTION OF PROJECT’S TARGET PROVINCES
80. The project area will focus on three regions namely, Magway, Mandalay and Sagaing in central dry zone.
A. Socio-Economic Description of the Target Areas
81. The Central Dry Zone (CDZ) lies within Myanmar’s central plains, which are bounded by mountains to the east and west. Encompassing parts of Mandalay, Magway and Sagaing, the CDZ covers more than 75,000 square kilometers and represents 13% of the country’s land area. The population of the CDZ is estimated to be approximately 10 million people, out of a total national population of 51.4 million (LIFT 2015; Department of Population 2014). Most are engaged in marginally profitable agriculture-based livelihoods and are subject to shocks and stresses such as erratic rainfall patterns, price fluctuations and degrading soil quality. The result is chronically high levels of food insecurity, malnutrition and crippling indebtedness.
B. Identification of Subprojects
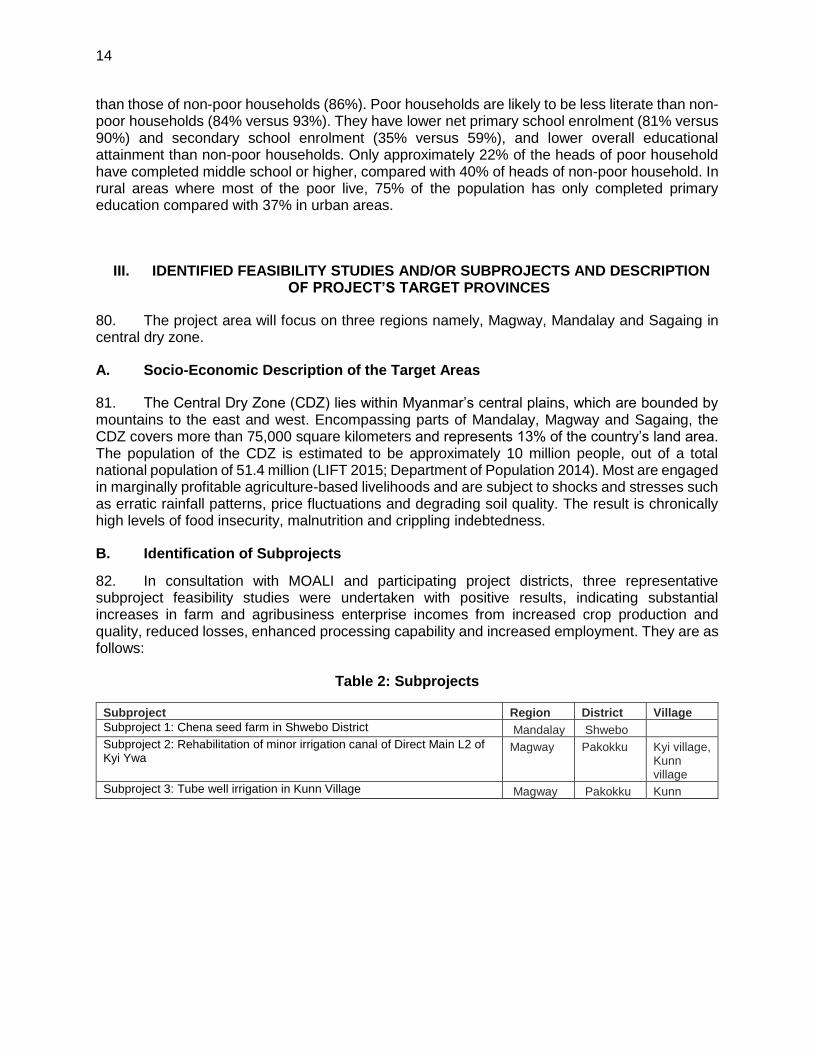
82. In consultation with MOALI and participating project districts, three representative subproject feasibility studies were undertaken with positive results, indicating substantial increases in farm and agribusiness enterprise incomes from increased crop production and quality, reduced losses, enhanced processing capability and increased employment. They are as follows:
Table 2: Subprojects
Subproject Region District Village
Subproject 1: Chena seed farm in Shwebo District Mandalay Shwebo
Subproject 2: Rehabilitation of minor irrigation canal of Direct Main L2 of Kyi Ywa
Magway Pakokku Kyi village, Kunn village
Subproject 3: Tube well irrigation in Kunn Village Magway Pakokku Kunn

15
C. Feasibility Study 1 – Chepa Seed Farm
1. Beneficiaries
83. The beneficiaries include DOA staff who are actively involved in overseeing rice seed cultivation and production.
Table 3: List of Staff at Chepa Seed Farm Sr. Name Gender Designation
1 U Min Swe Male Seeds Farm Manager/ Deputy Staff Officer
2 Daw Tin Moe New Female Deputy Staff Officer
3 Daw Swe Mar Win Htike Female Assistant Staff Officer
4 U Myo Khant Male Deputy Asst. Staff Officer
5 Daw Nu Nu Nge Female Deputy Asst. Staff Officer
6 U Win Myint Mg Male Clerk
84. The total number of technical DOA staff working at the seed farm is five officers. Of these, three are female staff.
85. There is a local seed growers association in the area, made up of 33 seed growers. Some of these obtain rice seed from Chepa seed farm. The other important seed farm in the area is Yay Oo seed farm. Of the 33 seed growers, three are women farmers.
86. Two of the growers are situated in nearby Min Kone village (of Min Kone village tract) and have relatively large areas for rice seed cultivation: 30 acres and 20 acres, respectively. From Chepa village, there are three growers who obtain seed from Chepa seed farm, and have 10 acres; 5 acres and 5 acres, respectively for rice seed cultivation. Seven farmers in Chepa village itself, (and who are not members of the Seed Growers Association) also purchase rice seed from Chepa seed farm.
16
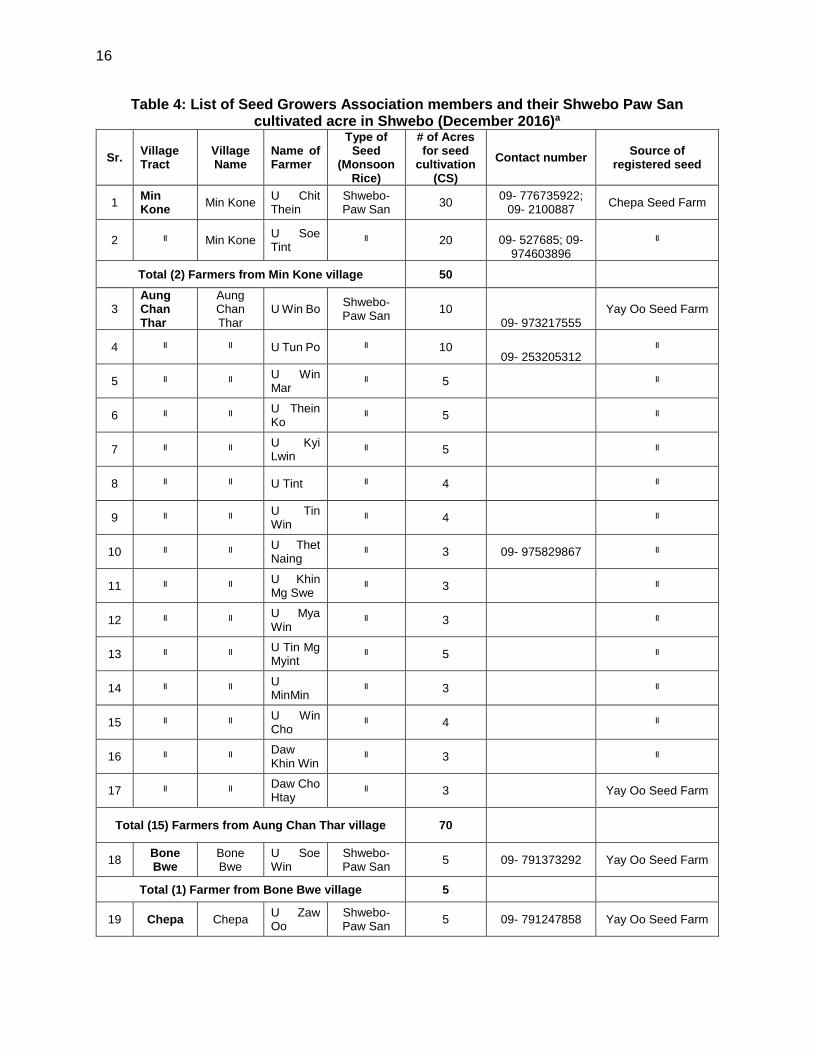
Table 4: List of Seed Growers Association members and their Shwebo Paw San cultivated acre in Shwebo (December 2016)a
Sr. Village Tract
Village Name
Name of Farmer
Type of Seed
(Monsoon Rice)
# of Acres for seed
cultivation (CS)
Contact number Source of
registered seed
1 Min Kone
Min Kone U Chit Thein
Shwebo- Paw San
30 09- 776735922;
09- 2100887 Chepa Seed Farm
2 ။ Min Kone U Soe Tint
။ 20 09- 527685; 09-974603896
။
Total (2) Farmers from Min Kone village 50
3 Aung Chan Thar
Aung Chan Thar
U Win Bo Shwebo- Paw San
10 09- 973217555
Yay Oo Seed Farm
4 ။ ။ U Tun Po ။ 10 09- 253205312
။
5 ။ ။ U Win Mar
။ 5
။
6 ။ ။ U Thein Ko
။ 5
။
7 ။ ။ U Kyi Lwin
။ 5 ။
8 ။ ။ U Tint ။ 4
။
9 ။ ။ U Tin Win
။ 4
။
10 ။ ။ U Thet Naing
။ 3 09- 975829867 ။
11 ။ ။ U Khin Mg Swe
။ 3 ။
12 ။ ။ U Mya Win
။ 3 ။
13 ။ ။ U Tin Mg Myint
။ 5 ။
14 ။ ။ U MinMin
။ 3
။
15 ။ ။ U Win Cho
။ 4
။
16 ။ ။ Daw Khin Win
။ 3 ။
17 ။ ။ Daw Cho Htay
။ 3 Yay Oo Seed Farm
Total (15) Farmers from Aung Chan Thar village 70
18 Bone Bwe
Bone Bwe
U Soe Win
Shwebo- Paw San
5 09- 791373292 Yay Oo Seed Farm
Total (1) Farmer from Bone Bwe village 5
19 Chepa Chepa U Zaw Oo
Shwebo- Paw San
5 09- 791247858 Yay Oo Seed Farm
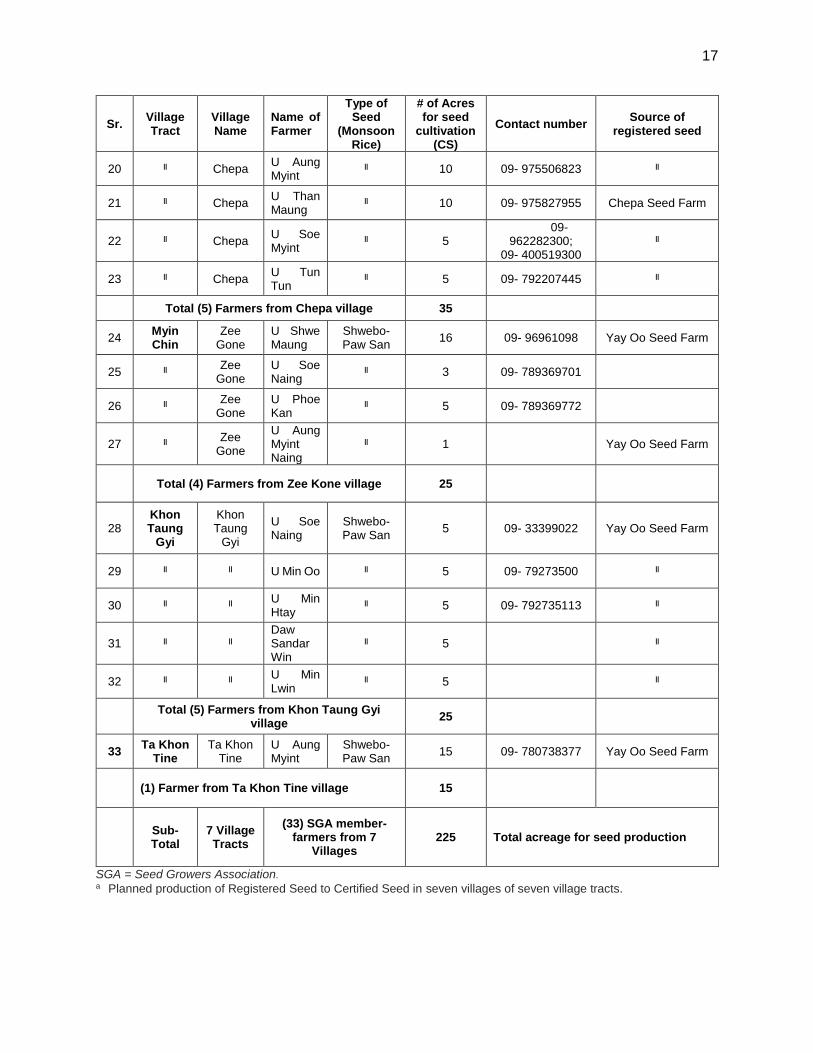
17
Sr. Village Tract
Village Name
Name of Farmer
Type of Seed
(Monsoon Rice)
# of Acres for seed
cultivation (CS)
Contact number Source of
registered seed
20 ။ Chepa U Aung Myint
။ 10 09- 975506823 ။
21 ။ Chepa U Than Maung
။ 10 09- 975827955 Chepa Seed Farm
22 ။ Chepa U Soe Myint
။ 5 09-
962282300; 09- 400519300
။
23 ။ Chepa U Tun Tun
။ 5 09- 792207445 ။
Total (5) Farmers from Chepa village 35
24 Myin Chin
Zee Gone
U Shwe Maung
Shwebo- Paw San
16 09- 96961098 Yay Oo Seed Farm
25 ။ Zee Gone
U Soe Naing
။ 3 09- 789369701
26 ။ Zee Gone
U Phoe Kan
။ 5 09- 789369772
27 ။ Zee Gone
U Aung Myint Naing
။ 1 Yay Oo Seed Farm
Total (4) Farmers from Zee Kone village 25
28 Khon Taung
Gyi
Khon Taung
Gyi
U Soe Naing
Shwebo- Paw San
5 09- 33399022 Yay Oo Seed Farm
29 ။ ။ U Min Oo ။ 5 09- 79273500 ။
30 ။ ။ U Min Htay
။ 5 09- 792735113 ။
31 ။ ။ Daw Sandar Win
။ 5 ။
32 ။ ။ U Min Lwin
။ 5 ။
Total (5) Farmers from Khon Taung Gyi
village 25
33 Ta Khon
Tine Ta Khon
Tine U Aung Myint
Shwebo- Paw San
15 09- 780738377 Yay Oo Seed Farm
(1) Farmer from Ta Khon Tine village 15
Sub-Total
7 Village Tracts
(33) SGA member- farmers from 7
Villages 225 Total acreage for seed production
SGA = Seed Growers Association. a Planned production of Registered Seed to Certified Seed in seven villages of seven village tracts.
18
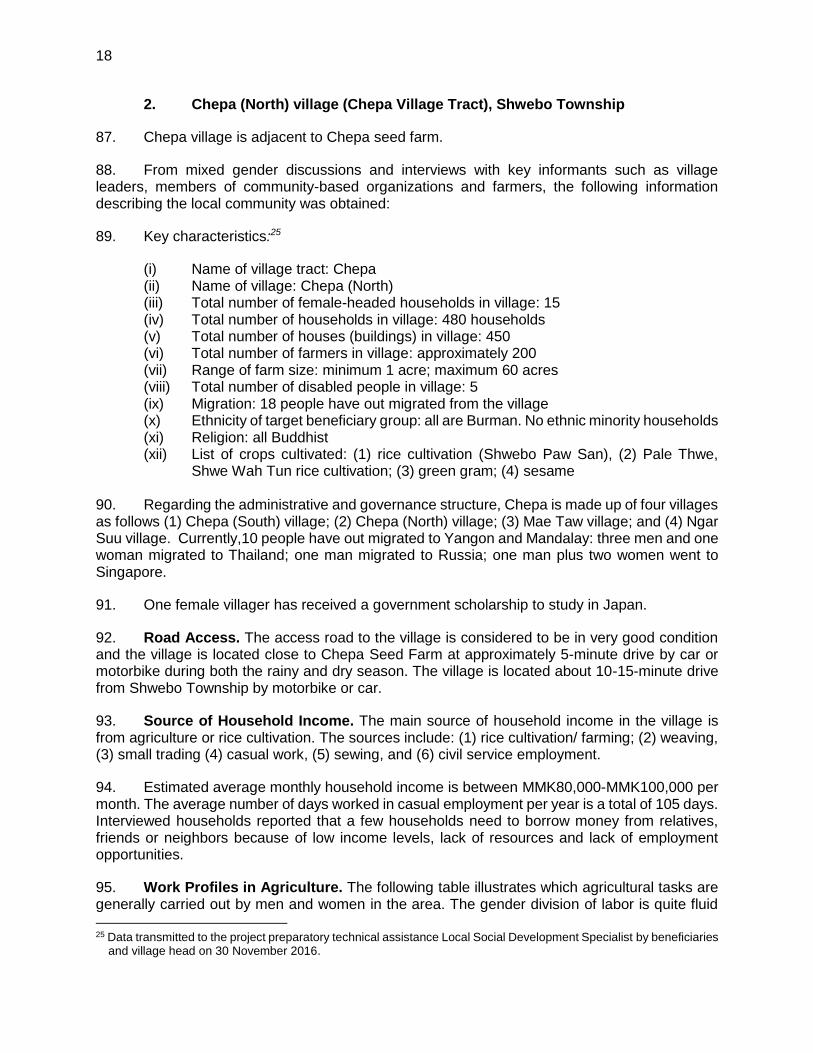
2. Chepa (North) village (Chepa Village Tract), Shwebo Township
87. Chepa village is adjacent to Chepa seed farm.
88. From mixed gender discussions and interviews with key informants such as village leaders, members of community-based organizations and farmers, the following information describing the local community was obtained:
89. Key characteristics:25
(i) Name of village tract: Chepa (ii) Name of village: Chepa (North) (iii) Total number of female-headed households in village: 15 (iv) Total number of households in village: 480 households (v) Total number of houses (buildings) in village: 450 (vi) Total number of farmers in village: approximately 200 (vii) Range of farm size: minimum 1 acre; maximum 60 acres (viii) Total number of disabled people in village: 5 (ix) Migration: 18 people have out migrated from the village (x) Ethnicity of target beneficiary group: all are Burman. No ethnic minority households (xi) Religion: all Buddhist (xii) List of crops cultivated: (1) rice cultivation (Shwebo Paw San), (2) Pale Thwe,
Shwe Wah Tun rice cultivation; (3) green gram; (4) sesame
90. Regarding the administrative and governance structure, Chepa is made up of four villages as follows (1) Chepa (South) village; (2) Chepa (North) village; (3) Mae Taw village; and (4) Ngar Suu village. Currently,10 people have out migrated to Yangon and Mandalay: three men and one woman migrated to Thailand; one man migrated to Russia; one man plus two women went to Singapore.
91. One female villager has received a government scholarship to study in Japan.
92. Road Access. The access road to the village is considered to be in very good condition and the village is located close to Chepa Seed Farm at approximately 5-minute drive by car or motorbike during both the rainy and dry season. The village is located about 10-15-minute drive from Shwebo Township by motorbike or car.
93. Source of Household Income. The main source of household income in the village is from agriculture or rice cultivation. The sources include: (1) rice cultivation/ farming; (2) weaving, (3) small trading (4) casual work, (5) sewing, and (6) civil service employment.
94. Estimated average monthly household income is between MMK80,000-MMK100,000 per month. The average number of days worked in casual employment per year is a total of 105 days. Interviewed households reported that a few households need to borrow money from relatives, friends or neighbors because of low income levels, lack of resources and lack of employment opportunities.
95. Work Profiles in Agriculture. The following table illustrates which agricultural tasks are generally carried out by men and women in the area. The gender division of labor is quite fluid
25 Data transmitted to the project preparatory technical assistance Local Social Development Specialist by beneficiaries
and village head on 30 November 2016.
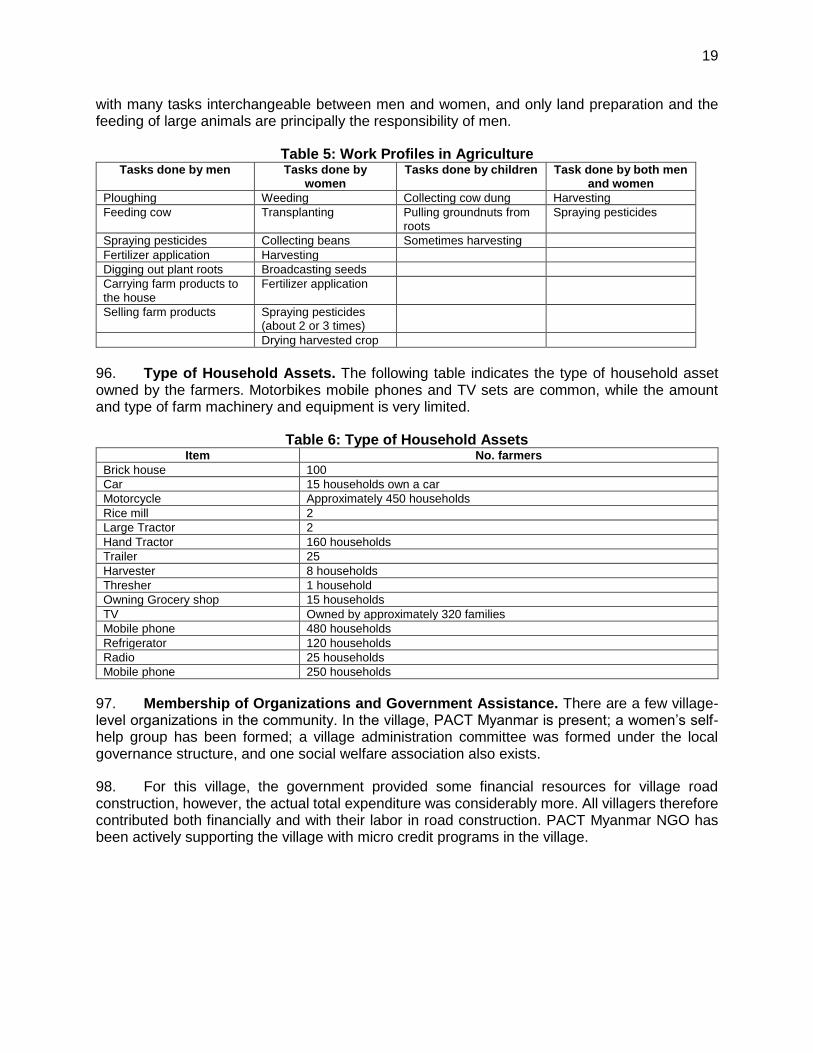
19
with many tasks interchangeable between men and women, and only land preparation and the feeding of large animals are principally the responsibility of men.
Table 5: Work Profiles in Agriculture Tasks done by men Tasks done by
women Tasks done by children Task done by both men
and women
Ploughing Weeding Collecting cow dung Harvesting
Feeding cow Transplanting Pulling groundnuts from roots
Spraying pesticides
Spraying pesticides Collecting beans Sometimes harvesting
Fertilizer application Harvesting
Digging out plant roots Broadcasting seeds
Carrying farm products to the house
Fertilizer application
Selling farm products Spraying pesticides (about 2 or 3 times)
Drying harvested crop
96. Type of Household Assets. The following table indicates the type of household asset owned by the farmers. Motorbikes mobile phones and TV sets are common, while the amount and type of farm machinery and equipment is very limited.
Table 6: Type of Household Assets Item No. farmers
Brick house 100
Car 15 households own a car
Motorcycle Approximately 450 households
Rice mill 2
Large Tractor 2
Hand Tractor 160 households
Trailer 25
Harvester 8 households
Thresher 1 household
Owning Grocery shop 15 households
TV Owned by approximately 320 families
Mobile phone 480 households
Refrigerator 120 households
Radio 25 households
Mobile phone 250 households
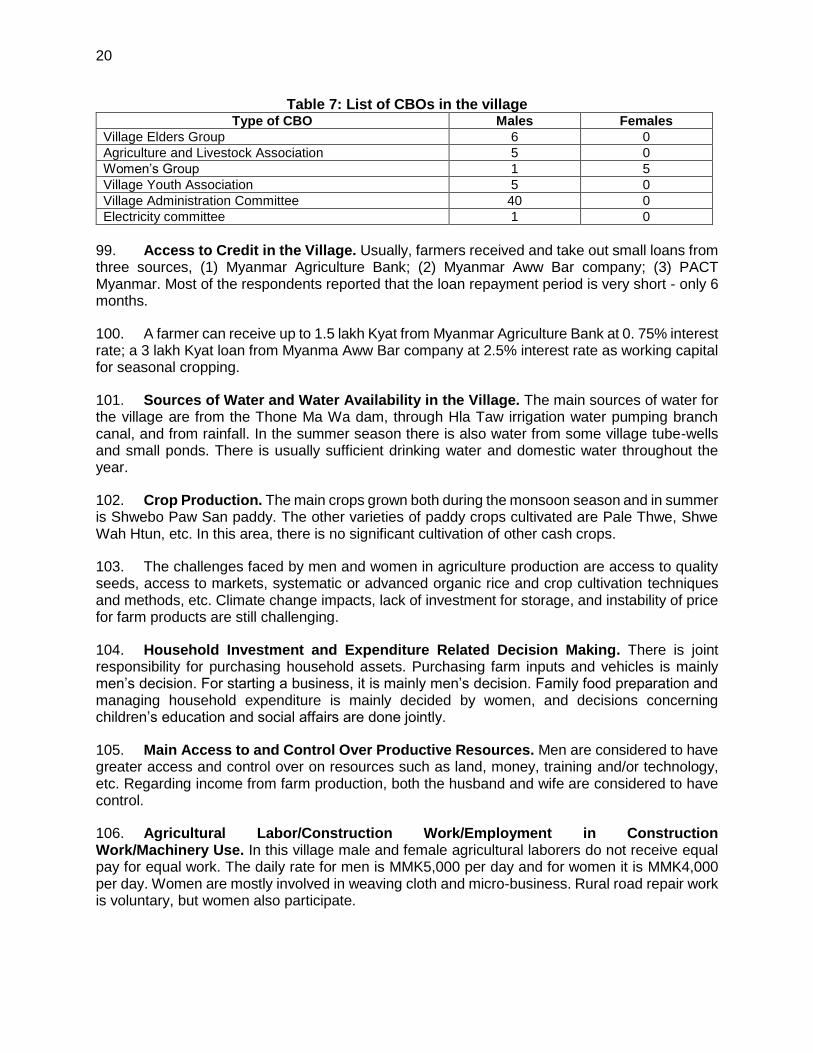
97. Membership of Organizations and Government Assistance. There are a few village-level organizations in the community. In the village, PACT Myanmar is present; a women’s self-help group has been formed; a village administration committee was formed under the local governance structure, and one social welfare association also exists.
98. For this village, the government provided some financial resources for village road construction, however, the actual total expenditure was considerably more. All villagers therefore contributed both financially and with their labor in road construction. PACT Myanmar NGO has been actively supporting the village with micro credit programs in the village.
20
Table 7: List of CBOs in the village Type of CBO Males Females
Village Elders Group 6 0
Agriculture and Livestock Association 5 0
Women’s Group 1 5
Village Youth Association 5 0
Village Administration Committee 40 0
Electricity committee 1 0
99. Access to Credit in the Village. Usually, farmers received and take out small loans from three sources, (1) Myanmar Agriculture Bank; (2) Myanmar Aww Bar company; (3) PACT Myanmar. Most of the respondents reported that the loan repayment period is very short - only 6 months.
100. A farmer can receive up to 1.5 lakh Kyat from Myanmar Agriculture Bank at 0. 75% interest rate; a 3 lakh Kyat loan from Myanma Aww Bar company at 2.5% interest rate as working capital for seasonal cropping.
101. Sources of Water and Water Availability in the Village. The main sources of water for the village are from the Thone Ma Wa dam, through Hla Taw irrigation water pumping branch canal, and from rainfall. In the summer season there is also water from some village tube-wells and small ponds. There is usually sufficient drinking water and domestic water throughout the year.
102. Crop Production. The main crops grown both during the monsoon season and in summer is Shwebo Paw San paddy. The other varieties of paddy crops cultivated are Pale Thwe, Shwe Wah Htun, etc. In this area, there is no significant cultivation of other cash crops.
103. The challenges faced by men and women in agriculture production are access to quality seeds, access to markets, systematic or advanced organic rice and crop cultivation techniques and methods, etc. Climate change impacts, lack of investment for storage, and instability of price for farm products are still challenging.
104. Household Investment and Expenditure Related Decision Making. There is joint responsibility for purchasing household assets. Purchasing farm inputs and vehicles is mainly men’s decision. For starting a business, it is mainly men’s decision. Family food preparation and managing household expenditure is mainly decided by women, and decisions concerning children’s education and social affairs are done jointly.
105. Main Access to and Control Over Productive Resources. Men are considered to have greater access and control over on resources such as land, money, training and/or technology, etc. Regarding income from farm production, both the husband and wife are considered to have control.
106. Agricultural Labor/Construction Work/Employment in Construction Work/Machinery Use. In this village male and female agricultural laborers do not receive equal pay for equal work. The daily rate for men is MMK5,000 per day and for women it is MMK4,000 per day. Women are mostly involved in weaving cloth and micro-business. Rural road repair work is voluntary, but women also participate.
21
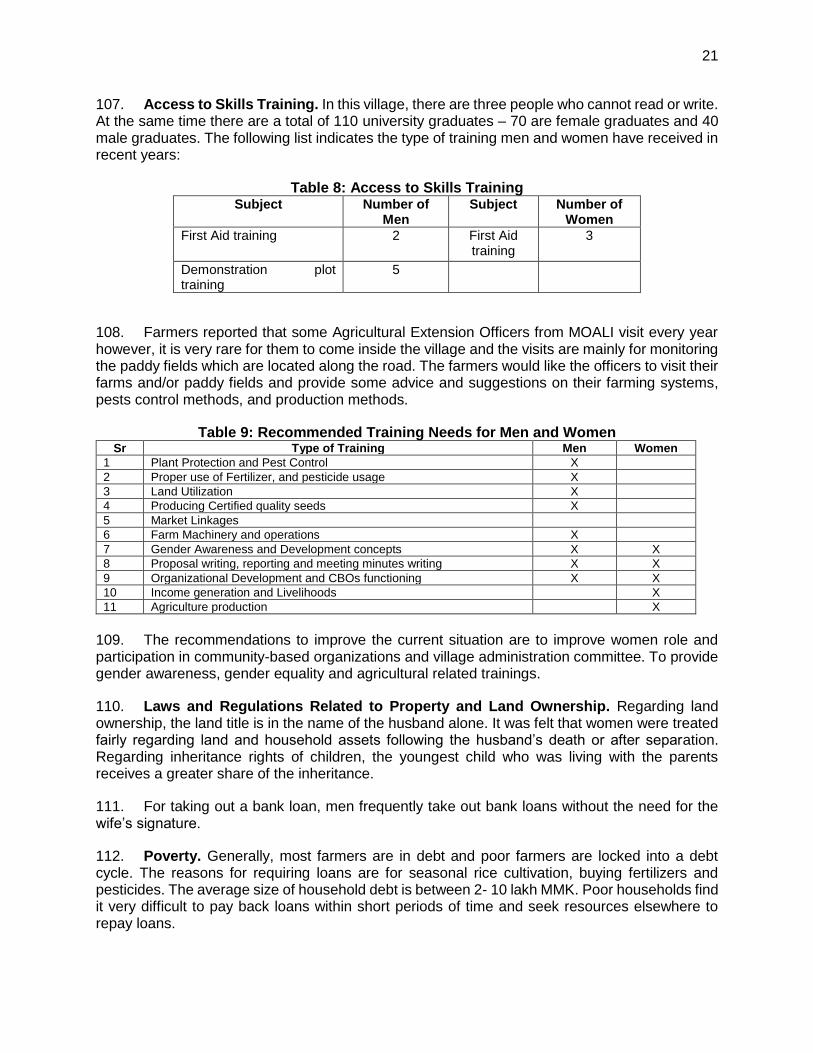
107. Access to Skills Training. In this village, there are three people who cannot read or write. At the same time there are a total of 110 university graduates – 70 are female graduates and 40 male graduates. The following list indicates the type of training men and women have received in recent years:
Table 8: Access to Skills Training Subject Number of
Men Subject Number of
Women
First Aid training 2 First Aid training
3
Demonstration plot training
5
108. Farmers reported that some Agricultural Extension Officers from MOALI visit every year however, it is very rare for them to come inside the village and the visits are mainly for monitoring the paddy fields which are located along the road. The farmers would like the officers to visit their farms and/or paddy fields and provide some advice and suggestions on their farming systems, pests control methods, and production methods.
Table 9: Recommended Training Needs for Men and Women Sr Type of Training Men Women
1 Plant Protection and Pest Control X
2 Proper use of Fertilizer, and pesticide usage X
3 Land Utilization X
4 Producing Certified quality seeds X
5 Market Linkages
6 Farm Machinery and operations X
7 Gender Awareness and Development concepts X X
8 Proposal writing, reporting and meeting minutes writing X X
9 Organizational Development and CBOs functioning X X
10 Income generation and Livelihoods X
11 Agriculture production X
109. The recommendations to improve the current situation are to improve women role and participation in community-based organizations and village administration committee. To provide gender awareness, gender equality and agricultural related trainings.
110. Laws and Regulations Related to Property and Land Ownership. Regarding land ownership, the land title is in the name of the husband alone. It was felt that women were treated fairly regarding land and household assets following the husband’s death or after separation. Regarding inheritance rights of children, the youngest child who was living with the parents receives a greater share of the inheritance.
111. For taking out a bank loan, men frequently take out bank loans without the need for the wife’s signature.
112. Poverty. Generally, most farmers are in debt and poor farmers are locked into a debt cycle. The reasons for requiring loans are for seasonal rice cultivation, buying fertilizers and pesticides. The average size of household debt is between 2- 10 lakh MMK. Poor households find it very difficult to pay back loans within short periods of time and seek resources elsewhere to repay loans.
22
113. Vulnerability and Inclusion. Regarding services and village infrastructure, the village has easy access to primary health care services at the rural health center. There is also a primary school for 100 children.
114. Gender-based and domestic violence. There were reportedly no cases of gender-based violence in the village. However, it is understood that data on this issue is very difficult to access during a short stay and people may be reluctant to speak out.
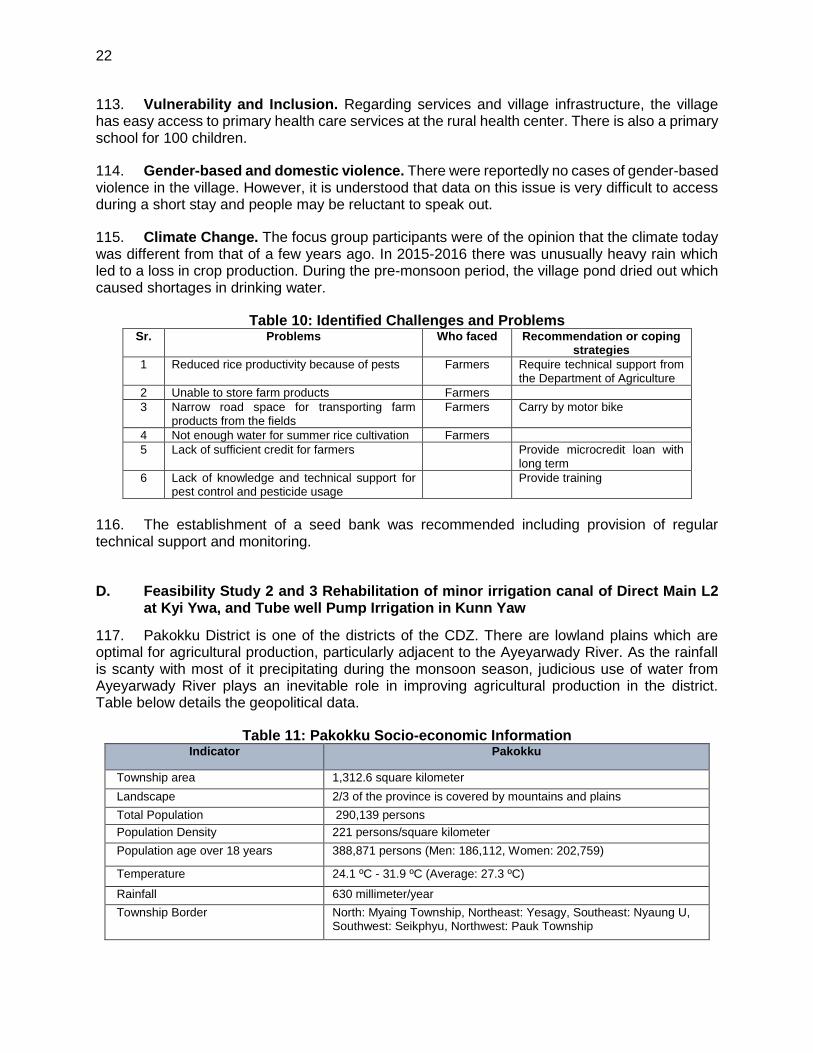
115. Climate Change. The focus group participants were of the opinion that the climate today was different from that of a few years ago. In 2015-2016 there was unusually heavy rain which led to a loss in crop production. During the pre-monsoon period, the village pond dried out which caused shortages in drinking water.
Table 10: Identified Challenges and Problems Sr. Problems Who faced Recommendation or coping
strategies
1 Reduced rice productivity because of pests Farmers Require technical support from the Department of Agriculture
2 Unable to store farm products Farmers
3 Narrow road space for transporting farm products from the fields
Farmers Carry by motor bike
4 Not enough water for summer rice cultivation Farmers
5 Lack of sufficient credit for farmers Provide microcredit loan with long term
6 Lack of knowledge and technical support for pest control and pesticide usage
Provide training
116. The establishment of a seed bank was recommended including provision of regular technical support and monitoring.
D. Feasibility Study 2 and 3 Rehabilitation of minor irrigation canal of Direct Main L2 at Kyi Ywa, and Tube well Pump Irrigation in Kunn Yaw
117. Pakokku District is one of the districts of the CDZ. There are lowland plains which are optimal for agricultural production, particularly adjacent to the Ayeyarwady River. As the rainfall is scanty with most of it precipitating during the monsoon season, judicious use of water from Ayeyarwady River plays an inevitable role in improving agricultural production in the district. Table below details the geopolitical data.
Table 11: Pakokku Socio-economic Information Indicator Pakokku
Township area 1,312.6 square kilometer
Landscape 2/3 of the province is covered by mountains and plains
Total Population 290,139 persons
Population Density 221 persons/square kilometer
Population age over 18 years 388,871 persons (Men: 186,112, Women: 202,759)
Temperature 24.1 ºC - 31.9 ºC (Average: 27.3 ºC)
Rainfall 630 millimeter/year
Township Border North: Myaing Township, Northeast: Yesagy, Southeast: Nyaung U, Southwest: Seikphyu, Northwest: Pauk Township
23
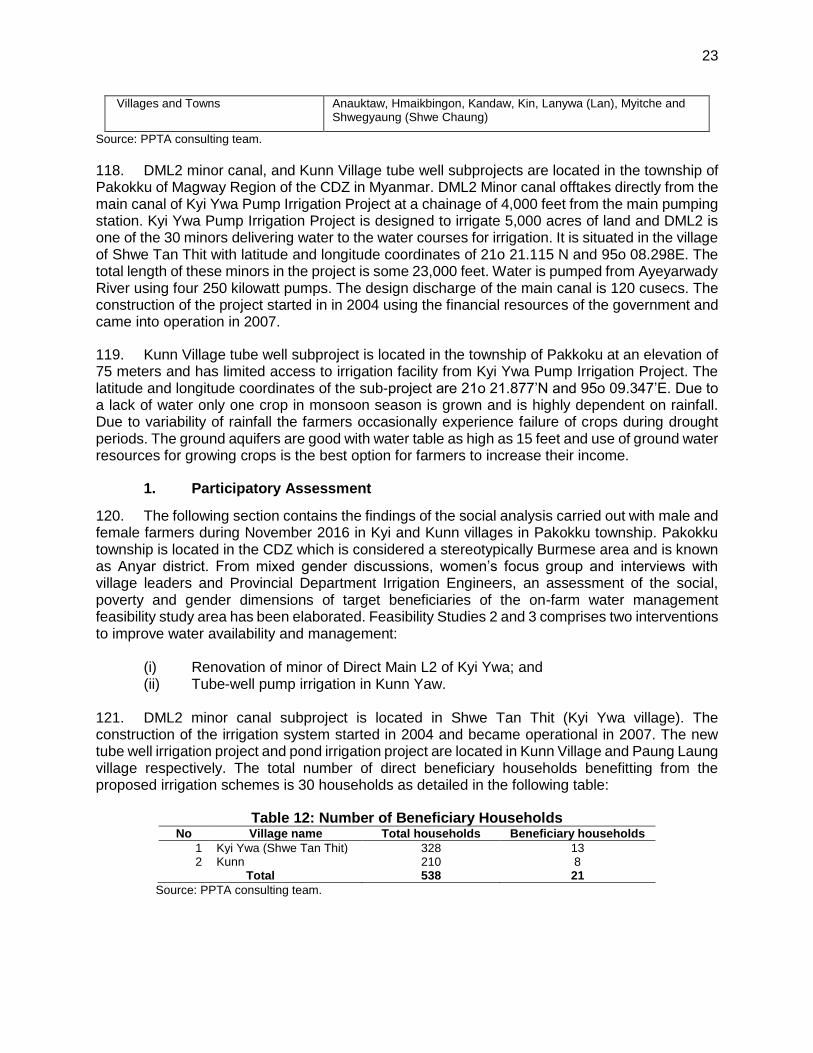
Villages and Towns Anauktaw, Hmaikbingon, Kandaw, Kin, Lanywa (Lan), Myitche and Shwegyaung (Shwe Chaung)
Source: PPTA consulting team.
118. DML2 minor canal, and Kunn Village tube well subprojects are located in the township of Pakokku of Magway Region of the CDZ in Myanmar. DML2 Minor canal offtakes directly from the main canal of Kyi Ywa Pump Irrigation Project at a chainage of 4,000 feet from the main pumping station. Kyi Ywa Pump Irrigation Project is designed to irrigate 5,000 acres of land and DML2 is one of the 30 minors delivering water to the water courses for irrigation. It is situated in the village of Shwe Tan Thit with latitude and longitude coordinates of 21o 21.115 N and 95o 08.298E. The total length of these minors in the project is some 23,000 feet. Water is pumped from Ayeyarwady River using four 250 kilowatt pumps. The design discharge of the main canal is 120 cusecs. The construction of the project started in in 2004 using the financial resources of the government and came into operation in 2007.
119. Kunn Village tube well subproject is located in the township of Pakkoku at an elevation of 75 meters and has limited access to irrigation facility from Kyi Ywa Pump Irrigation Project. The latitude and longitude coordinates of the sub-project are 21o 21.877’N and 95o 09.347’E. Due to a lack of water only one crop in monsoon season is grown and is highly dependent on rainfall. Due to variability of rainfall the farmers occasionally experience failure of crops during drought periods. The ground aquifers are good with water table as high as 15 feet and use of ground water resources for growing crops is the best option for farmers to increase their income.
1. Participatory Assessment
120. The following section contains the findings of the social analysis carried out with male and female farmers during November 2016 in Kyi and Kunn villages in Pakokku township. Pakokku township is located in the CDZ which is considered a stereotypically Burmese area and is known as Anyar district. From mixed gender discussions, women’s focus group and interviews with village leaders and Provincial Department Irrigation Engineers, an assessment of the social, poverty and gender dimensions of target beneficiaries of the on-farm water management feasibility study area has been elaborated. Feasibility Studies 2 and 3 comprises two interventions to improve water availability and management:
(i) Renovation of minor of Direct Main L2 of Kyi Ywa; and (ii) Tube-well pump irrigation in Kunn Yaw.
121. DML2 minor canal subproject is located in Shwe Tan Thit (Kyi Ywa village). The construction of the irrigation system started in 2004 and became operational in 2007. The new tube well irrigation project and pond irrigation project are located in Kunn Village and Paung Laung village respectively. The total number of direct beneficiary households benefitting from the proposed irrigation schemes is 30 households as detailed in the following table:
Table 12: Number of Beneficiary Households No Village name Total households Beneficiary households
1 Kyi Ywa (Shwe Tan Thit) 328 13 2 Kunn 210 8
Total 538 21
Source: PPTA consulting team.
24
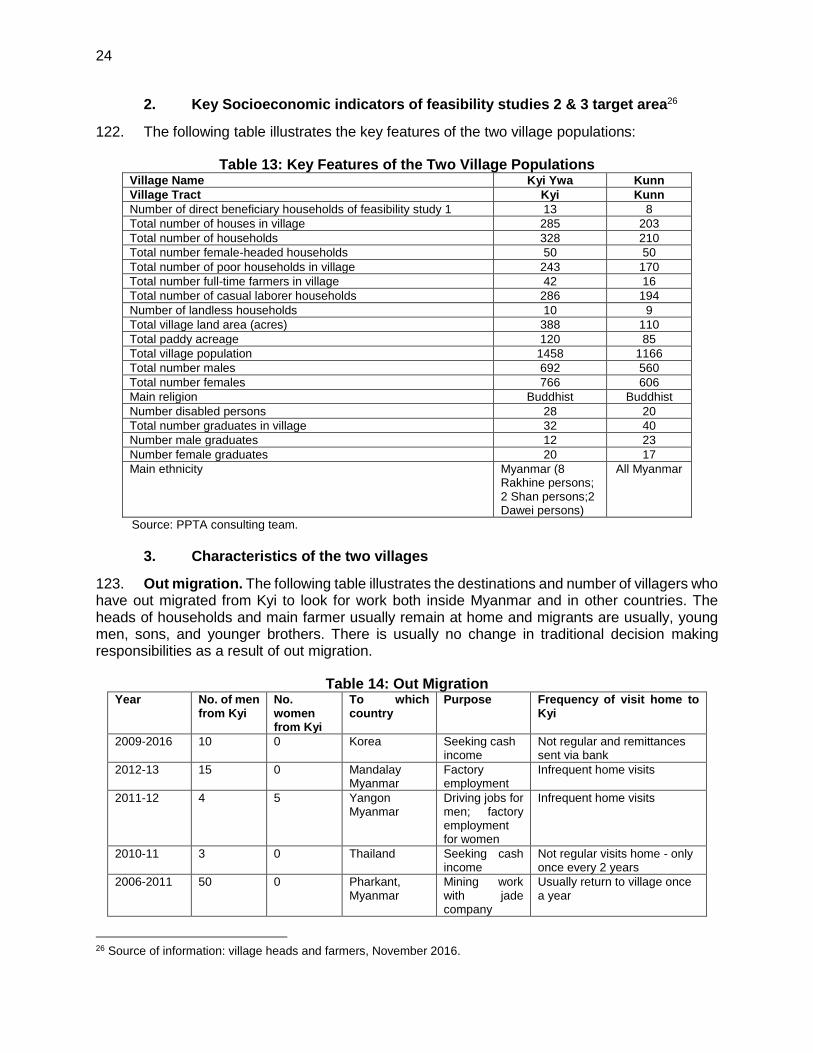
2. Key Socioeconomic indicators of feasibility studies 2 & 3 target area26
122. The following table illustrates the key features of the two village populations:
Table 13: Key Features of the Two Village Populations Village Name Kyi Ywa Kunn
Village Tract Kyi Kunn
Number of direct beneficiary households of feasibility study 1 13 8
Total number of houses in village 285 203
Total number of households 328 210
Total number female-headed households 50 50
Total number of poor households in village 243 170
Total number full-time farmers in village 42 16
Total number of casual laborer households 286 194
Number of landless households 10 9
Total village land area (acres) 388 110
Total paddy acreage 120 85
Total village population 1458 1166
Total number males 692 560
Total number females 766 606
Main religion Buddhist Buddhist
Number disabled persons 28 20
Total number graduates in village 32 40
Number male graduates 12 23
Number female graduates 20 17
Main ethnicity Myanmar (8 Rakhine persons; 2 Shan persons;2 Dawei persons)
All Myanmar
Source: PPTA consulting team.
3. Characteristics of the two villages
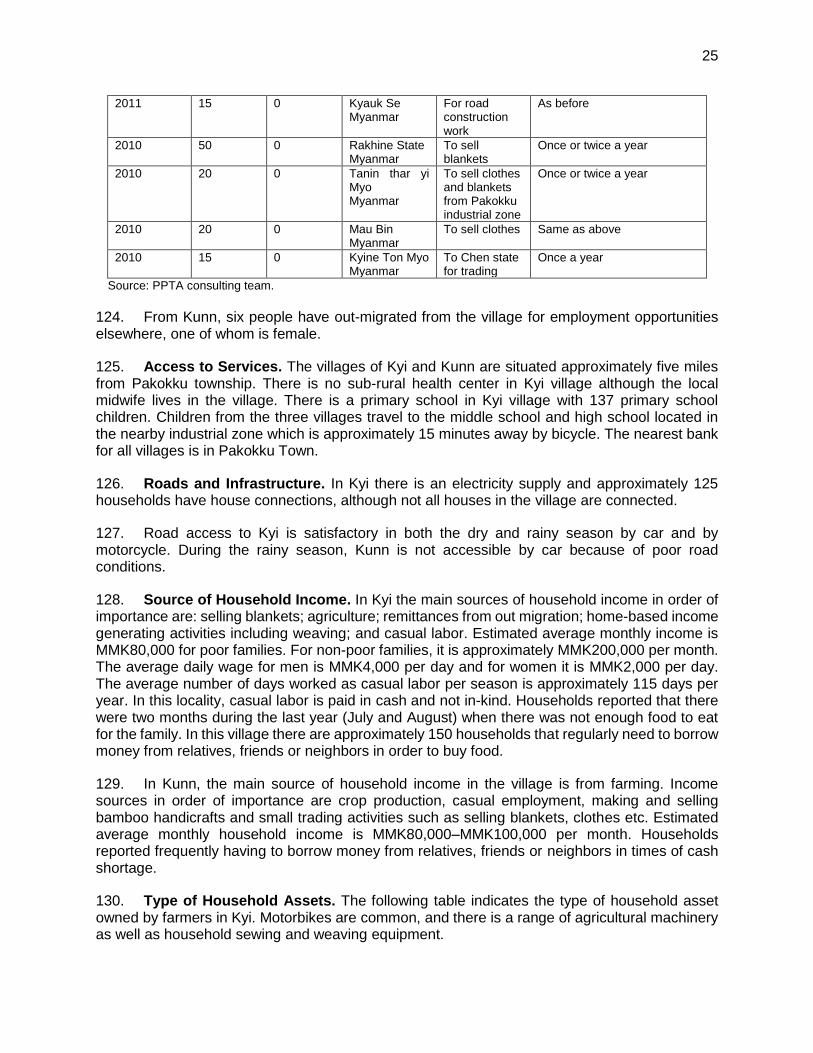
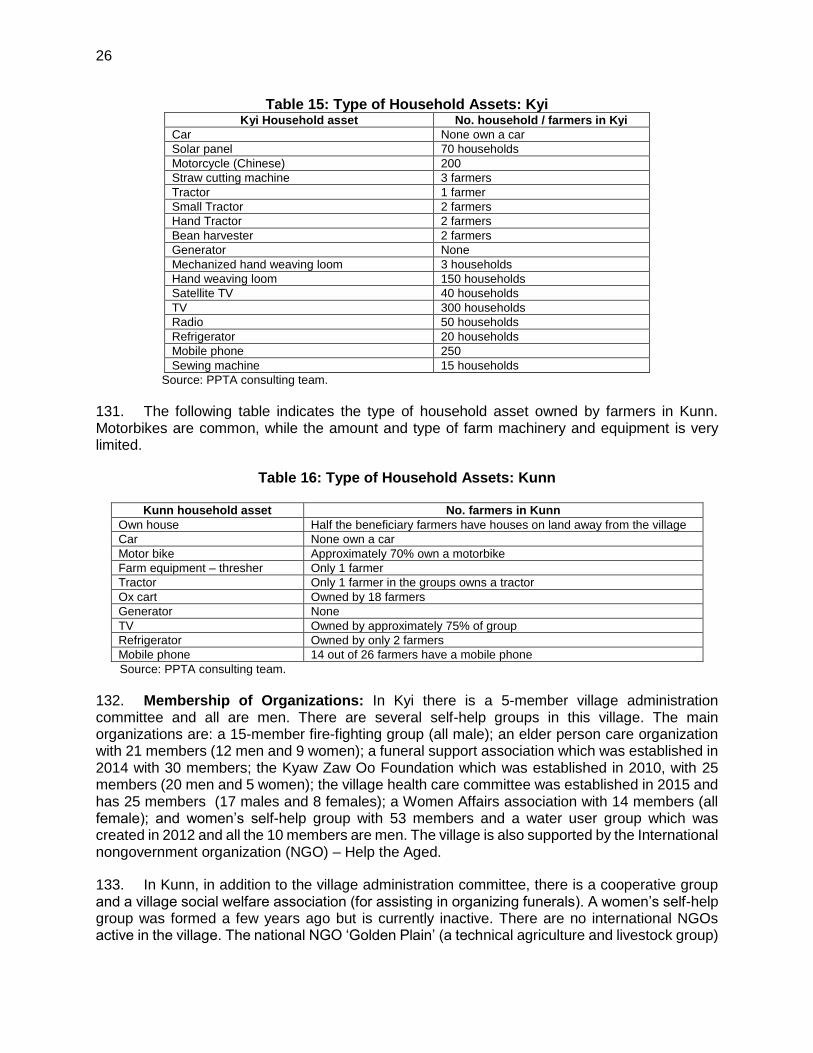
123. Out migration. The following table illustrates the destinations and number of villagers who have out migrated from Kyi to look for work both inside Myanmar and in other countries. The heads of households and main farmer usually remain at home and migrants are usually, young men, sons, and younger brothers. There is usually no change in traditional decision making responsibilities as a result of out migration.
Table 14: Out Migration Year No. of men
from Kyi No. women from Kyi
To which country
Purpose Frequency of visit home to Kyi
2009-2016 10 0 Korea Seeking cash income
Not regular and remittances sent via bank
2012-13 15 0 Mandalay Myanmar
Factory employment
Infrequent home visits
2011-12 4 5 Yangon Myanmar
Driving jobs for men; factory employment for women
Infrequent home visits
2010-11 3 0 Thailand Seeking cash income
Not regular visits home - only once every 2 years
2006-2011 50 0 Pharkant, Myanmar
Mining work with jade company
Usually return to village once a year
26 Source of information: village heads and farmers, November 2016.
25
2011 15 0 Kyauk Se Myanmar
For road construction work
As before
2010 50 0 Rakhine State Myanmar
To sell blankets
Once or twice a year
2010 20 0 Tanin thar yi Myo Myanmar
To sell clothes and blankets from Pakokku industrial zone
Once or twice a year
2010 20 0 Mau Bin Myanmar
To sell clothes Same as above
2010 15 0 Kyine Ton Myo Myanmar
To Chen state for trading
Once a year
Source: PPTA consulting team.
124. From Kunn, six people have out-migrated from the village for employment opportunities elsewhere, one of whom is female.
125. Access to Services. The villages of Kyi and Kunn are situated approximately five miles from Pakokku township. There is no sub-rural health center in Kyi village although the local midwife lives in the village. There is a primary school in Kyi village with 137 primary school children. Children from the three villages travel to the middle school and high school located in the nearby industrial zone which is approximately 15 minutes away by bicycle. The nearest bank for all villages is in Pakokku Town.
126. Roads and Infrastructure. In Kyi there is an electricity supply and approximately 125 households have house connections, although not all houses in the village are connected.
127. Road access to Kyi is satisfactory in both the dry and rainy season by car and by motorcycle. During the rainy season, Kunn is not accessible by car because of poor road conditions.
128. Source of Household Income. In Kyi the main sources of household income in order of importance are: selling blankets; agriculture; remittances from out migration; home-based income generating activities including weaving; and casual labor. Estimated average monthly income is MMK80,000 for poor families. For non-poor families, it is approximately MMK200,000 per month. The average daily wage for men is MMK4,000 per day and for women it is MMK2,000 per day. The average number of days worked as casual labor per season is approximately 115 days per year. In this locality, casual labor is paid in cash and not in-kind. Households reported that there were two months during the last year (July and August) when there was not enough food to eat for the family. In this village there are approximately 150 households that regularly need to borrow money from relatives, friends or neighbors in order to buy food.
129. In Kunn, the main source of household income in the village is from farming. Income sources in order of importance are crop production, casual employment, making and selling bamboo handicrafts and small trading activities such as selling blankets, clothes etc. Estimated average monthly household income is MMK80,000–MMK100,000 per month. Households reported frequently having to borrow money from relatives, friends or neighbors in times of cash shortage.
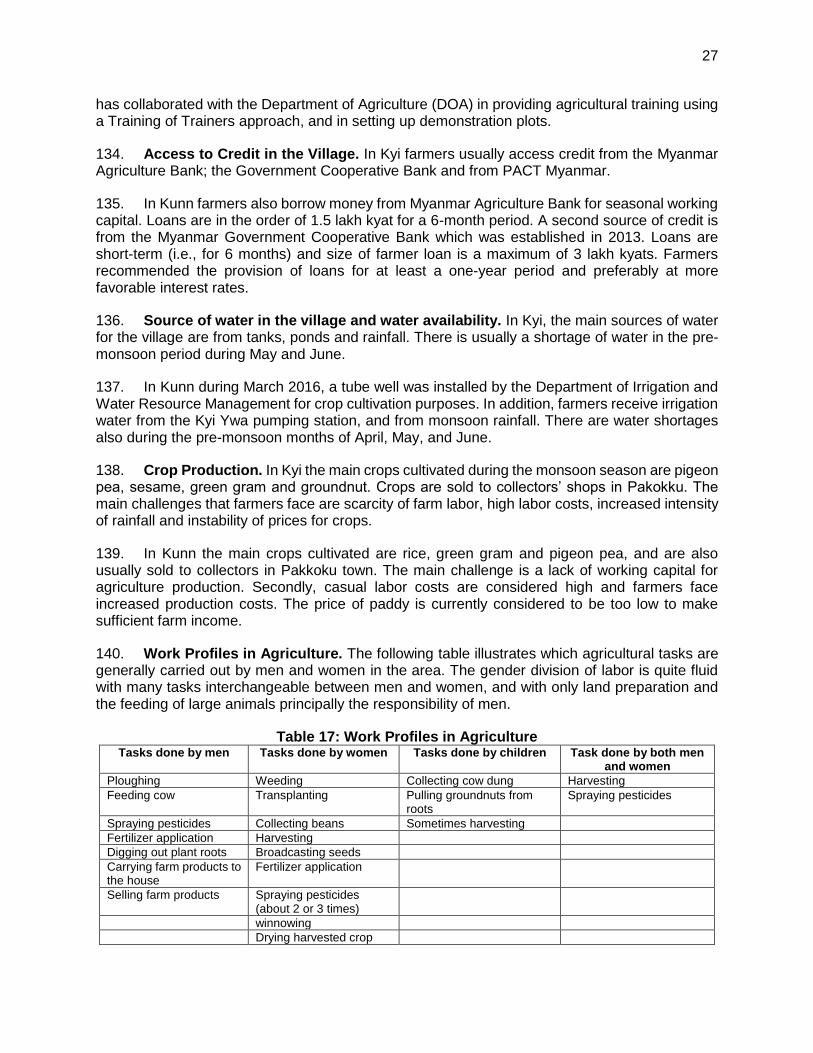
130. Type of Household Assets. The following table indicates the type of household asset owned by farmers in Kyi. Motorbikes are common, and there is a range of agricultural machinery as well as household sewing and weaving equipment.
26
Table 15: Type of Household Assets: Kyi Kyi Household asset No. household / farmers in Kyi
Car None own a car
Solar panel 70 households
Motorcycle (Chinese) 200
Straw cutting machine 3 farmers
Tractor 1 farmer
Small Tractor 2 farmers
Hand Tractor 2 farmers
Bean harvester 2 farmers
Generator None
Mechanized hand weaving loom 3 households
Hand weaving loom 150 households
Satellite TV 40 households
TV 300 households
Radio 50 households
Refrigerator 20 households
Mobile phone 250
Sewing machine 15 households
Source: PPTA consulting team.
131. The following table indicates the type of household asset owned by farmers in Kunn. Motorbikes are common, while the amount and type of farm machinery and equipment is very limited.
Table 16: Type of Household Assets: Kunn
Kunn household asset No. farmers in Kunn
Own house Half the beneficiary farmers have houses on land away from the village
Car None own a car
Motor bike Approximately 70% own a motorbike
Farm equipment – thresher Only 1 farmer
Tractor Only 1 farmer in the groups owns a tractor
Ox cart Owned by 18 farmers
Generator None
TV Owned by approximately 75% of group
Refrigerator Owned by only 2 farmers
Mobile phone 14 out of 26 farmers have a mobile phone
Source: PPTA consulting team.
132. Membership of Organizations: In Kyi there is a 5-member village administration committee and all are men. There are several self-help groups in this village. The main organizations are: a 15-member fire-fighting group (all male); an elder person care organization with 21 members (12 men and 9 women); a funeral support association which was established in 2014 with 30 members; the Kyaw Zaw Oo Foundation which was established in 2010, with 25 members (20 men and 5 women); the village health care committee was established in 2015 and has 25 members (17 males and 8 females); a Women Affairs association with 14 members (all female); and women’s self-help group with 53 members and a water user group which was created in 2012 and all the 10 members are men. The village is also supported by the International nongovernment organization (NGO) – Help the Aged.
133. In Kunn, in addition to the village administration committee, there is a cooperative group and a village social welfare association (for assisting in organizing funerals). A women’s self-help group was formed a few years ago but is currently inactive. There are no international NGOs active in the village. The national NGO ‘Golden Plain’ (a technical agriculture and livestock group)
27
has collaborated with the Department of Agriculture (DOA) in providing agricultural training using a Training of Trainers approach, and in setting up demonstration plots.
134. Access to Credit in the Village. In Kyi farmers usually access credit from the Myanmar Agriculture Bank; the Government Cooperative Bank and from PACT Myanmar.
135. In Kunn farmers also borrow money from Myanmar Agriculture Bank for seasonal working capital. Loans are in the order of 1.5 lakh kyat for a 6-month period. A second source of credit is from the Myanmar Government Cooperative Bank which was established in 2013. Loans are short-term (i.e., for 6 months) and size of farmer loan is a maximum of 3 lakh kyats. Farmers recommended the provision of loans for at least a one-year period and preferably at more favorable interest rates.
136. Source of water in the village and water availability. In Kyi, the main sources of water for the village are from tanks, ponds and rainfall. There is usually a shortage of water in the pre-monsoon period during May and June.
137. In Kunn during March 2016, a tube well was installed by the Department of Irrigation and Water Resource Management for crop cultivation purposes. In addition, farmers receive irrigation water from the Kyi Ywa pumping station, and from monsoon rainfall. There are water shortages also during the pre-monsoon months of April, May, and June.
138. Crop Production. In Kyi the main crops cultivated during the monsoon season are pigeon pea, sesame, green gram and groundnut. Crops are sold to collectors’ shops in Pakokku. The main challenges that farmers face are scarcity of farm labor, high labor costs, increased intensity of rainfall and instability of prices for crops.
139. In Kunn the main crops cultivated are rice, green gram and pigeon pea, and are also usually sold to collectors in Pakkoku town. The main challenge is a lack of working capital for agriculture production. Secondly, casual labor costs are considered high and farmers face increased production costs. The price of paddy is currently considered to be too low to make sufficient farm income.
140. Work Profiles in Agriculture. The following table illustrates which agricultural tasks are generally carried out by men and women in the area. The gender division of labor is quite fluid with many tasks interchangeable between men and women, and with only land preparation and the feeding of large animals principally the responsibility of men.
Table 17: Work Profiles in Agriculture Tasks done by men Tasks done by women Tasks done by children Task done by both men
and women
Ploughing Weeding Collecting cow dung Harvesting
Feeding cow Transplanting Pulling groundnuts from roots
Spraying pesticides
Spraying pesticides Collecting beans Sometimes harvesting
Fertilizer application Harvesting
Digging out plant roots Broadcasting seeds
Carrying farm products to the house
Fertilizer application
Selling farm products Spraying pesticides (about 2 or 3 times)
winnowing
Drying harvested crop
28
Source: PPTA consulting team.
141. Decision Making Inside the Household. Men are responsible for household-related chores such as cutting straw; feeding cows, searching for, collecting and carrying firewood. Men also help women in weaving tasks such as spinning thread and sometime take care of children.
142. Women are responsible for cooking family meals, washing, cleaning the house and compound and filling the water container, taking care of children, making clothes, weaving, doing tasks for husband as requested, and taking the children to school.
143. Investment and Expenditure Related Decision Making. In Kyi men are responsible for making the majority of decisions concerning farm activities, business activities, purchasing inputs such as fertilizer, seed, pesticides and the purchase of livestock. Men are also responsible for social welfare decisions such are family funeral arrangements. For decisions concerning children’s education expenditure and health care expenditure there is joint decision-making. For household expenditure, there is joint decision-making although women usually take responsibility for managing finances. Responsibility for selling agricultural produce lies mainly with women and income from the sale of products is received by the woman of the household in the majority of cases.
144. In Kunn, the various investment and expenditure-related decisions for the household and the farm are illustrated in the following table.
Table 18: Investment Decision Making Type of investment Main Decision Maker Type of Expenditure Main Decision Maker
Purchasing household assets
Mainly men Food purchase Women
Purchasing farm inputs Men Clothes purchase Elder daughter
Purchasing bikes or vehicles
Men Children’ education Both
Starting business Both Social obligations (funeral etc.)
Men
Community management contributions
Men
145. Access to and Control over Productive Assets. In Kyi, it is mainly men who have the greatest access and control. The majority of land titles are in men’s names alone and only a small minority of women have land titles in their names. Control over household income and any cash generated from casual employment or income generating activity may be done jointly in some households and in others it is mainly done by the husband. Men have greater access to technical information and knowledge, training opportunities, extension services and market information. Both the husband and wife have access to markets although men usually have greater access.
146. The Kyi meeting participants agreed that the participation of village women in local meetings and on the village development committee should increase so that they represent an equal proportion of representative membership.
147. In Kunn, the main responsibility for selling the farm’s agricultural products lies with both husband and wife. However, control over the income earned from production and outside employment is mainly with the husband. Approximately 80% of household income is given to the wife to manage household expenditure, and 20% is retained by the husband for personal use. It is the husband or head of household who has the main control over productive assets such as
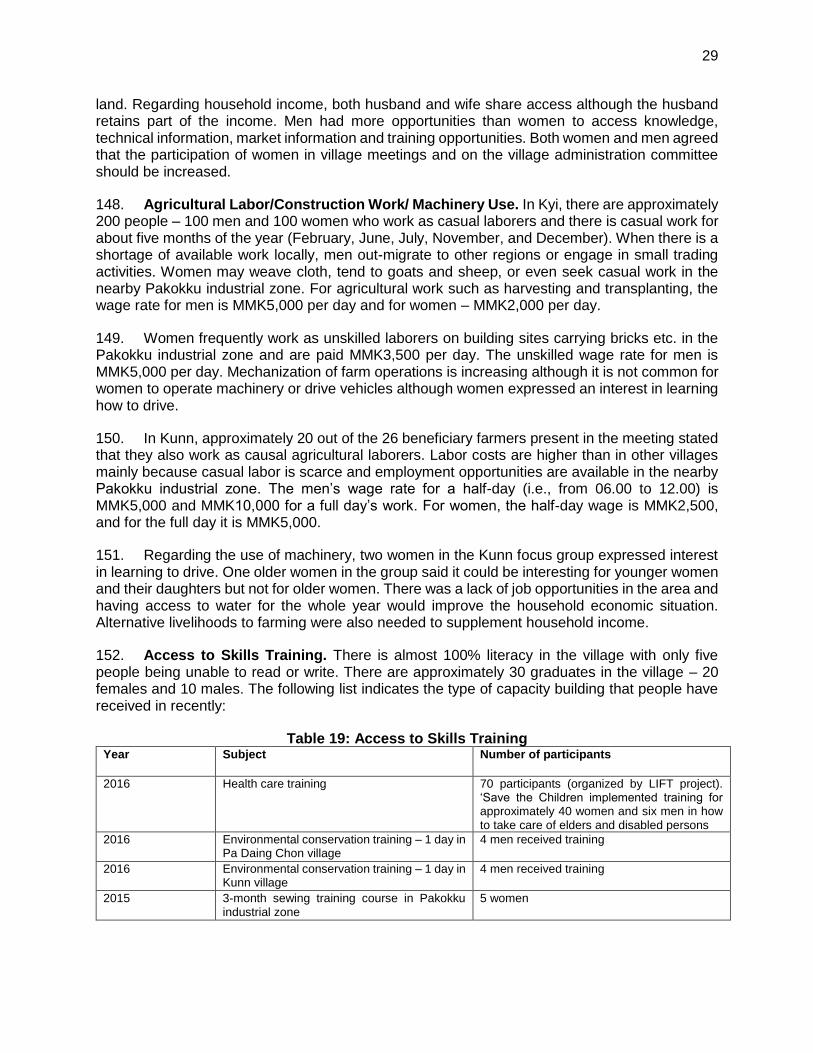
29
land. Regarding household income, both husband and wife share access although the husband retains part of the income. Men had more opportunities than women to access knowledge, technical information, market information and training opportunities. Both women and men agreed that the participation of women in village meetings and on the village administration committee should be increased.
148. Agricultural Labor/Construction Work/ Machinery Use. In Kyi, there are approximately 200 people – 100 men and 100 women who work as casual laborers and there is casual work for about five months of the year (February, June, July, November, and December). When there is a shortage of available work locally, men out-migrate to other regions or engage in small trading activities. Women may weave cloth, tend to goats and sheep, or even seek casual work in the nearby Pakokku industrial zone. For agricultural work such as harvesting and transplanting, the wage rate for men is MMK5,000 per day and for women – MMK2,000 per day.
149. Women frequently work as unskilled laborers on building sites carrying bricks etc. in the Pakokku industrial zone and are paid MMK3,500 per day. The unskilled wage rate for men is MMK5,000 per day. Mechanization of farm operations is increasing although it is not common for women to operate machinery or drive vehicles although women expressed an interest in learning how to drive.
150. In Kunn, approximately 20 out of the 26 beneficiary farmers present in the meeting stated that they also work as causal agricultural laborers. Labor costs are higher than in other villages mainly because casual labor is scarce and employment opportunities are available in the nearby Pakokku industrial zone. The men’s wage rate for a half-day (i.e., from 06.00 to 12.00) is MMK5,000 and MMK10,000 for a full day’s work. For women, the half-day wage is MMK2,500, and for the full day it is MMK5,000.
151. Regarding the use of machinery, two women in the Kunn focus group expressed interest in learning to drive. One older women in the group said it could be interesting for younger women and their daughters but not for older women. There was a lack of job opportunities in the area and having access to water for the whole year would improve the household economic situation. Alternative livelihoods to farming were also needed to supplement household income.
152. Access to Skills Training. There is almost 100% literacy in the village with only five people being unable to read or write. There are approximately 30 graduates in the village – 20 females and 10 males. The following list indicates the type of capacity building that people have received in recently:
Table 19: Access to Skills Training Year Subject Number of participants
2016 Health care training 70 participants (organized by LIFT project). ‘Save the Children implemented training for approximately 40 women and six men in how to take care of elders and disabled persons
2016 Environmental conservation training – 1 day in Pa Daing Chon village
4 men received training
2016 Environmental conservation training – 1 day in Kunn village
4 men received training
2015 3-month sewing training course in Pakokku industrial zone
5 women
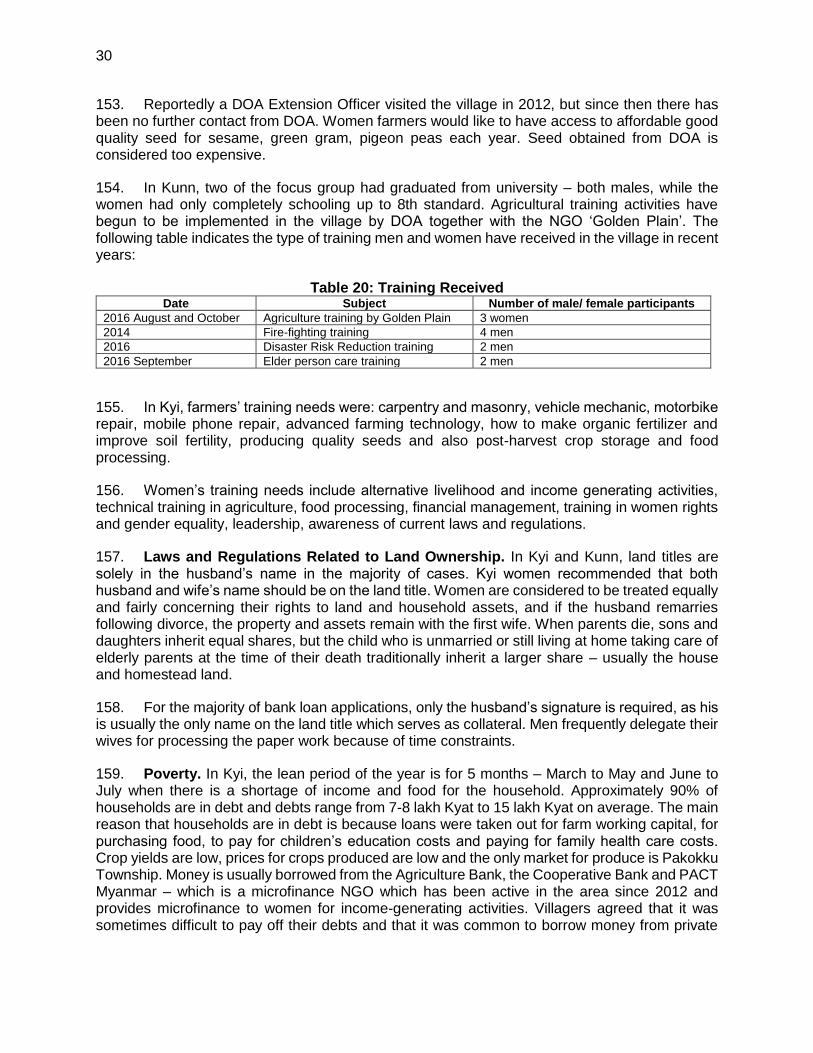
30
153. Reportedly a DOA Extension Officer visited the village in 2012, but since then there has been no further contact from DOA. Women farmers would like to have access to affordable good quality seed for sesame, green gram, pigeon peas each year. Seed obtained from DOA is considered too expensive.
154. In Kunn, two of the focus group had graduated from university – both males, while the women had only completely schooling up to 8th standard. Agricultural training activities have begun to be implemented in the village by DOA together with the NGO ‘Golden Plain’. The following table indicates the type of training men and women have received in the village in recent years:
Table 20: Training Received Date Subject Number of male/ female participants
2016 August and October Agriculture training by Golden Plain 3 women
2014 Fire-fighting training 4 men
2016 Disaster Risk Reduction training 2 men
2016 September Elder person care training 2 men
155. In Kyi, farmers’ training needs were: carpentry and masonry, vehicle mechanic, motorbike repair, mobile phone repair, advanced farming technology, how to make organic fertilizer and improve soil fertility, producing quality seeds and also post-harvest crop storage and food processing.
156. Women’s training needs include alternative livelihood and income generating activities, technical training in agriculture, food processing, financial management, training in women rights and gender equality, leadership, awareness of current laws and regulations.
157. Laws and Regulations Related to Land Ownership. In Kyi and Kunn, land titles are solely in the husband’s name in the majority of cases. Kyi women recommended that both husband and wife’s name should be on the land title. Women are considered to be treated equally and fairly concerning their rights to land and household assets, and if the husband remarries following divorce, the property and assets remain with the first wife. When parents die, sons and daughters inherit equal shares, but the child who is unmarried or still living at home taking care of elderly parents at the time of their death traditionally inherit a larger share – usually the house and homestead land.
158. For the majority of bank loan applications, only the husband’s signature is required, as his is usually the only name on the land title which serves as collateral. Men frequently delegate their wives for processing the paper work because of time constraints.
159. Poverty. In Kyi, the lean period of the year is for 5 months – March to May and June to July when there is a shortage of income and food for the household. Approximately 90% of households are in debt and debts range from 7-8 lakh Kyat to 15 lakh Kyat on average. The main reason that households are in debt is because loans were taken out for farm working capital, for purchasing food, to pay for children’s education costs and paying for family health care costs. Crop yields are low, prices for crops produced are low and the only market for produce is Pakokku Township. Money is usually borrowed from the Agriculture Bank, the Cooperative Bank and PACT Myanmar – which is a microfinance NGO which has been active in the area since 2012 and provides microfinance to women for income-generating activities. Villagers agreed that it was sometimes difficult to pay off their debts and that it was common to borrow money from private
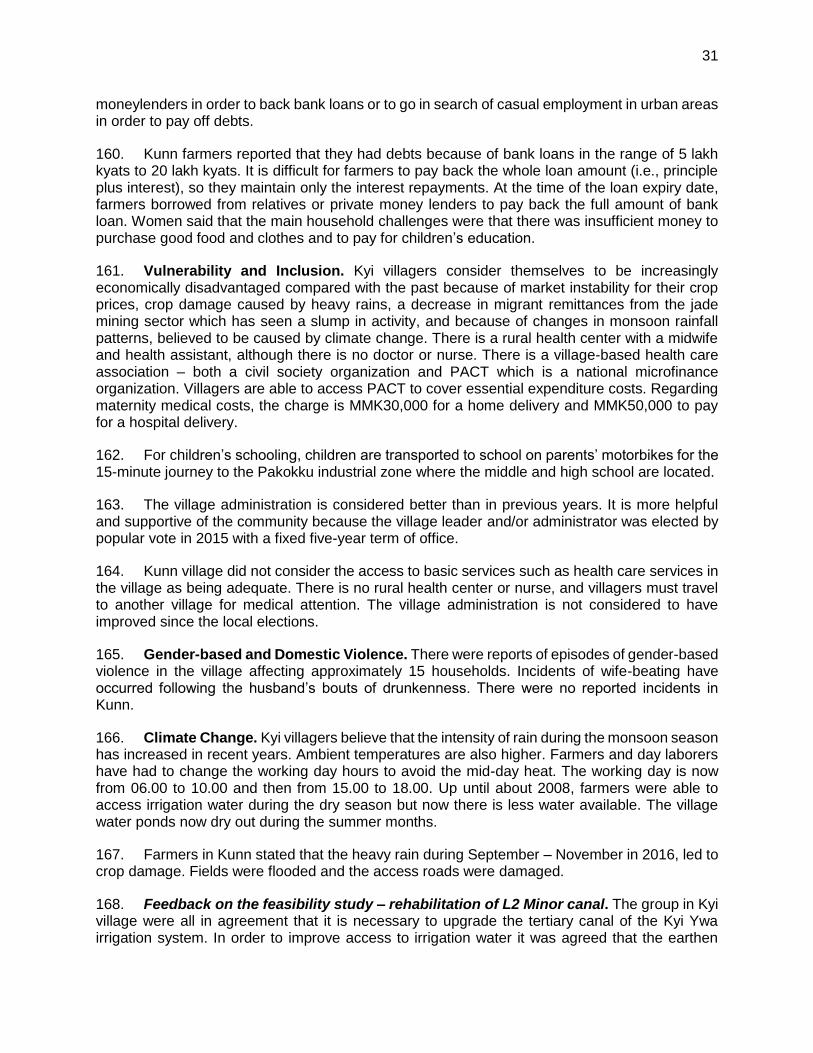
31
moneylenders in order to back bank loans or to go in search of casual employment in urban areas in order to pay off debts.
160. Kunn farmers reported that they had debts because of bank loans in the range of 5 lakh kyats to 20 lakh kyats. It is difficult for farmers to pay back the whole loan amount (i.e., principle plus interest), so they maintain only the interest repayments. At the time of the loan expiry date, farmers borrowed from relatives or private money lenders to pay back the full amount of bank loan. Women said that the main household challenges were that there was insufficient money to purchase good food and clothes and to pay for children’s education.
161. Vulnerability and Inclusion. Kyi villagers consider themselves to be increasingly economically disadvantaged compared with the past because of market instability for their crop prices, crop damage caused by heavy rains, a decrease in migrant remittances from the jade mining sector which has seen a slump in activity, and because of changes in monsoon rainfall patterns, believed to be caused by climate change. There is a rural health center with a midwife and health assistant, although there is no doctor or nurse. There is a village-based health care association – both a civil society organization and PACT which is a national microfinance organization. Villagers are able to access PACT to cover essential expenditure costs. Regarding maternity medical costs, the charge is MMK30,000 for a home delivery and MMK50,000 to pay for a hospital delivery.
162. For children’s schooling, children are transported to school on parents’ motorbikes for the 15-minute journey to the Pakokku industrial zone where the middle and high school are located.
163. The village administration is considered better than in previous years. It is more helpful and supportive of the community because the village leader and/or administrator was elected by popular vote in 2015 with a fixed five-year term of office.
164. Kunn village did not consider the access to basic services such as health care services in the village as being adequate. There is no rural health center or nurse, and villagers must travel to another village for medical attention. The village administration is not considered to have improved since the local elections.
165. Gender-based and Domestic Violence. There were reports of episodes of gender-based violence in the village affecting approximately 15 households. Incidents of wife-beating have occurred following the husband’s bouts of drunkenness. There were no reported incidents in Kunn.
166. Climate Change. Kyi villagers believe that the intensity of rain during the monsoon season has increased in recent years. Ambient temperatures are also higher. Farmers and day laborers have had to change the working day hours to avoid the mid-day heat. The working day is now from 06.00 to 10.00 and then from 15.00 to 18.00. Up until about 2008, farmers were able to access irrigation water during the dry season but now there is less water available. The village water ponds now dry out during the summer months.
167. Farmers in Kunn stated that the heavy rain during September – November in 2016, led to crop damage. Fields were flooded and the access roads were damaged.
168. Feedback on the feasibility study – rehabilitation of L2 Minor canal. The group in Kyi village were all in agreement that it is necessary to upgrade the tertiary canal of the Kyi Ywa irrigation system. In order to improve access to irrigation water it was agreed that the earthen
32
canal needed to be lined with cement and that it should be 4 feet wide with a depth of 2-3 feet. Farmers explained that during the dry season irrigation water was needed on crops both in the morning and evening. Improvements were also needed to ensure that all farmland in the irrigation area had access to water from the Kyi Ywa Pump Irrigation Scheme. It was felt that the Province Department of Irrigation and Water Utilization Management had a top-down approach and that farmers concerns were not always taken into account. Farmers agreed that the canal rehabilitation would have a positive impact for some of the farmers in the village, and that it would allow them to cultivate two crops per year. An added benefit would be that increased job opportunities for casual labor would be created. However, women’s workload would increase as they would be involved in increased crop cultivation tasks. The women’s group however disagreed, and said that there would be no significant impact on their workload. A major constraint is that water pumping charges which are paid to the Province Department of Irrigation and Water Utilization Management is considered expensive for small farmers.
169. Feedback from the Kyi women’s focus group provided additional opinions. More farmer participation in decision-making was recommended. Farmers should be allowed to grow the crops they preferred, and water distribution should be regular and systematic. During the construction of the Kyi Ywa Pump Irrigation Scheme, in 2008, farmers lost on average 1.5 acres each for which they received not compensation. The fear remains that farmers will not be compensated for any land lost during the proposed intervention
170. Feedback about the proposed tube well intervention in Kunn village. Regarding the proposed tube well irrigation system in Kunn village, farmers were of the opinion that whilst it was a good idea, not all farmers in the locality would gain benefit, because a major problem is flooding affecting large numbers of farmers. They agreed that the shallow tube well irrigation system would have a positive impact – but only for some of the farmers in the community. Increased income from increased cropping would benefit only some of the farming community. However, they agreed that more job opportunities would be created, although the increase in cropping may lead to a small increase in women’s workload.
171. Regarding the proposal to improve the land depression by laser leveling, the farmers did not have any experience of laser leveling, so it was difficult for them to discuss this. However, the Assistant Engineer of the Department of Irrigation and Water Resource Management said it would be expensive. Some farmers expressed interest in implementing laser leveling, but they were worried about the investment cost. The Assistant Engineer agreed that the project could demonstrate this in some of the plots. However, he recommended digging a channel to carry away the water collected in the depression during the monsoon season.
IV. MAIN FINDINGS AND RECOMMENDATIONS OF SOCIAL ASSESSMENT
172. For the proposed subprojects, both men and women were motivated to gain benefits and participate in the subprojects capacity building activities and improve production, improve access to markets and in the case of the beans and pulses processors’ group, to move up the value chain and increase revenue.
173. For ensuring that there is a poverty focus to project interventions, it is recommended that identified poor households in subproject areas should be targeted for unskilled job opportunities related to civil works. Gender disparities in employment remain extensive in Myanmar, primarily because of traditional attitudes about appropriate occupations for women and men. This is particularly true for the construction sector, where it is believed that women either cannot or do not wish to engage in manual labor. Women are already engaged in manual labor (e.g., rural road
33
repair), and there are many unskilled construction jobs that women could do in order to earn cash wages. It would also be possible to teach women building skills to allow them to earn equal wages.
174. The target populations’ needs and demands were assessed in relation to the proposed subprojects. It was found that women and men expressed the same priorities. In feasibility study 1 (seed farm improvements), there is a good fit with absorptive capacity of technical staff and rice seed growers, for the upgrading and improvements related to rice seed production. In feasibility study 2 and 3 (irrigation interventions) farmers’ over-riding priority was to have access to a reliable supply of water that would allow them to cultivate two crops per year. Farmers are vulnerable to erratic climatic events.