Embed Size (px)
Citation preview

Breakdown of CIP:Breakdown of CIP:Mystery ormyth?Mystery ormyth?by A.Wong & J. Zhangby A.Wong & J. Zhang
Discussant: Dagfinn RimeDiscussant: Dagfinn RimeBI Norwegian Business SchoolBI Norwegian Business School
ECB/Fed-GRFECB/Fed-GRF
OverivewApparently deviations fromCIP!
Du, Tepper, and Verdelhan (2018)
Very important topicArbitrage suggest malfunctioningmarketsNice paper studying long dated relations
I Lots of details on Cross-currency Basis SwapsI Conceptually similar to FX swaps
Decompose deviations into . . .I credit risk premiumI liqudidity premium
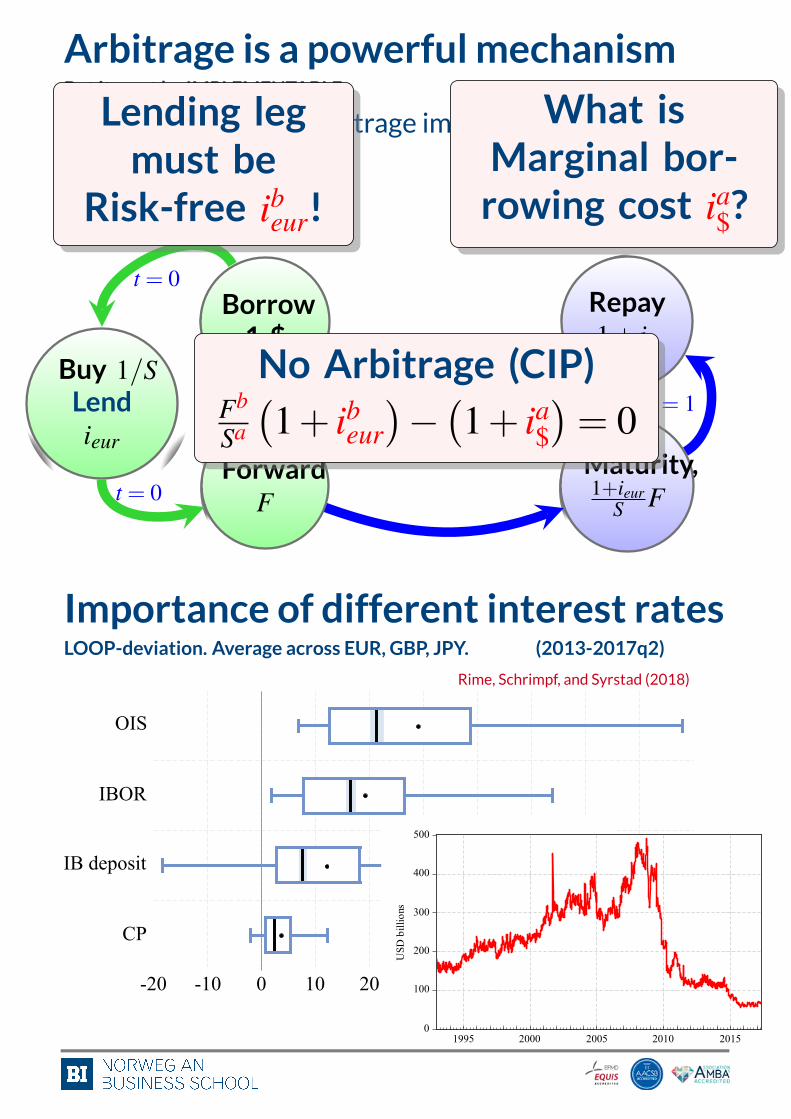
Arbitrage is a powerful mechanismBut it must be IMPLEMENTABLE
HOW is CIP arbitrage implemented?
Borrow1 $
Buy 1/SLendieur
t = 0
ForwardFt = 0
Maturity,1+ieur
S F
Repay1+ i$
t = 1No Arbitrage (CIP)
Fb
Sa
(1+ ibeur
)−(1+ ia$
)= 0
Lending legmust be
Risk-free ibeur!What is
Marginal bor-rowing cost ia$?
Importance of different interest ratesLOOP-deviation. Average across EUR, GBP, JPY. (2013-2017q2)
Rime, Schrimpf, and Syrstad (2018)
-20 -10 0 10 20 30 40 50 60 70 80
OIS
IBOR
IB deposit
CP
Basis points0
100
200
300
400
500
1995 2000 2005 2010 2015
USD
bill
ions
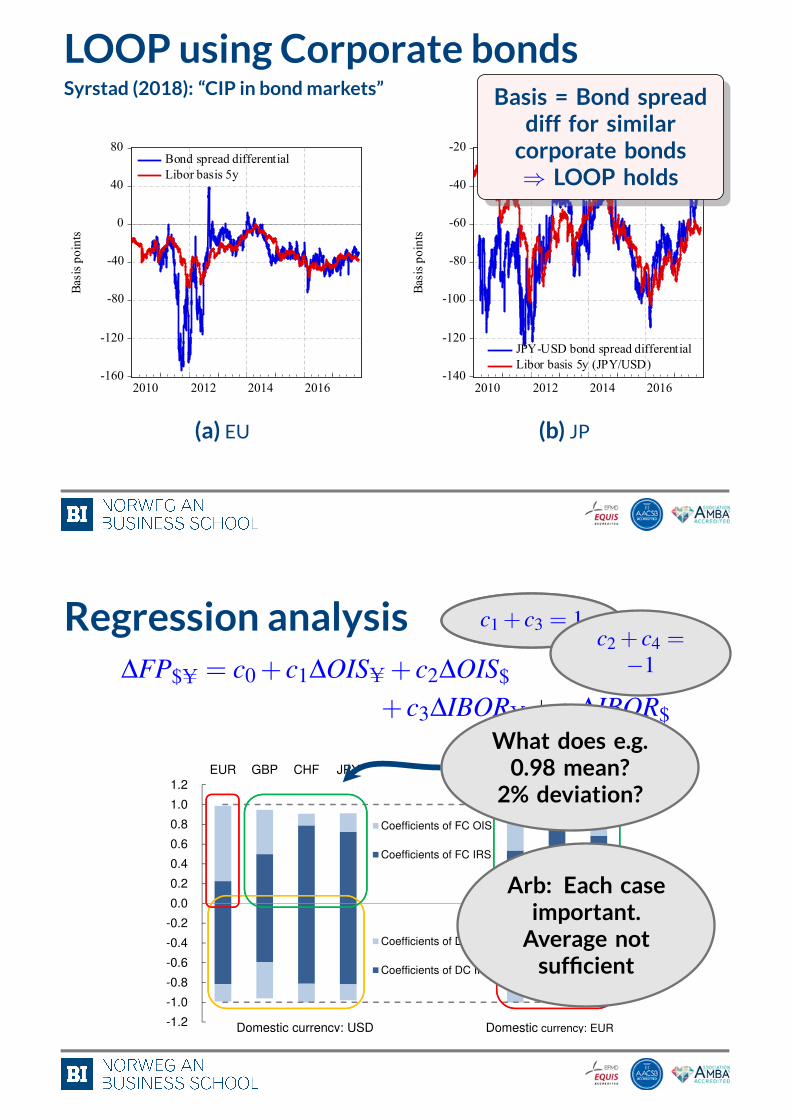
LOOP using Corporate bondsSyrstad (2018): “CIP in bondmarkets”
-160
-120
-80
-40
0
40
80
2010 2012 2014 2016
Bond spread differentialLibor basis 5y
Basi
s poi
nts
(a) EU-140
-120
-100
-80
-60
-40
-20
2010 2012 2014 2016
JPY-USD bond spread differentialLibor basis 5y (JPY/USD)
Basi
s poi
nts
(b) JP
Basis = Bond spreaddiff for similarcorporate bonds⇒ LOOP holds
Regression analysis∆FP$U = c0 + c1∆OISU+ c2∆OIS$
+ c3∆IBORU+ c4∆IBOR$
40
model predicts.
-1.2
-1.0
-0.8
-0.6
-0.4
-0.2
0.0
0.2
0.4
0.6
0.8
1.0
1.2EUR GBP CHF JPY GBP CHF JPY
Coefficients of FC OIS
Coefficients of FC IRS
Coefficients of DC OIS
Coefficients of DC IRS
Domestic currency: USD Domestic currency: EUR
FIGURE 9. SUM OF COEFFICIENTS OF IRS AND OIS
Source: Table 4
Moreover, the results are highly robust across the currency pairs. The relative
size of the OIS and IRS coefficients, i.e., the relative share of counterparty and
liquidity risk premiums, for each of the currencies is extremely consistent across
the currency pairs, i.e., regardless of which currency is in the other leg. As shown
in Figure 9, the relative size of the light and dark blue bars for EUR is almost
uniform across the currency pairs (circled in red). The light blue bars are longer,
suggesting that the counterparty risk premium accounts for a larger share of the
Libor-OIS spread in the EUR Libor market, all falling within the range of 70-
80%. The relative size of the bars for USD is also very much the same across the
currency pairs with longer dark blue bars (circled in yellow), reflecting a larger
proportion of the liquidity risk premium, about 60% vis-a-vis GBP and slightly
above 80% vis-a-vis the other three currencies. Similarly, the relative size of
c1 + c3 = 1c1 + c3 = 1c2 + c4 =−1
What does e.g.0.98 mean?2% deviation?
Arb: Each caseimportant.Average notsufficient
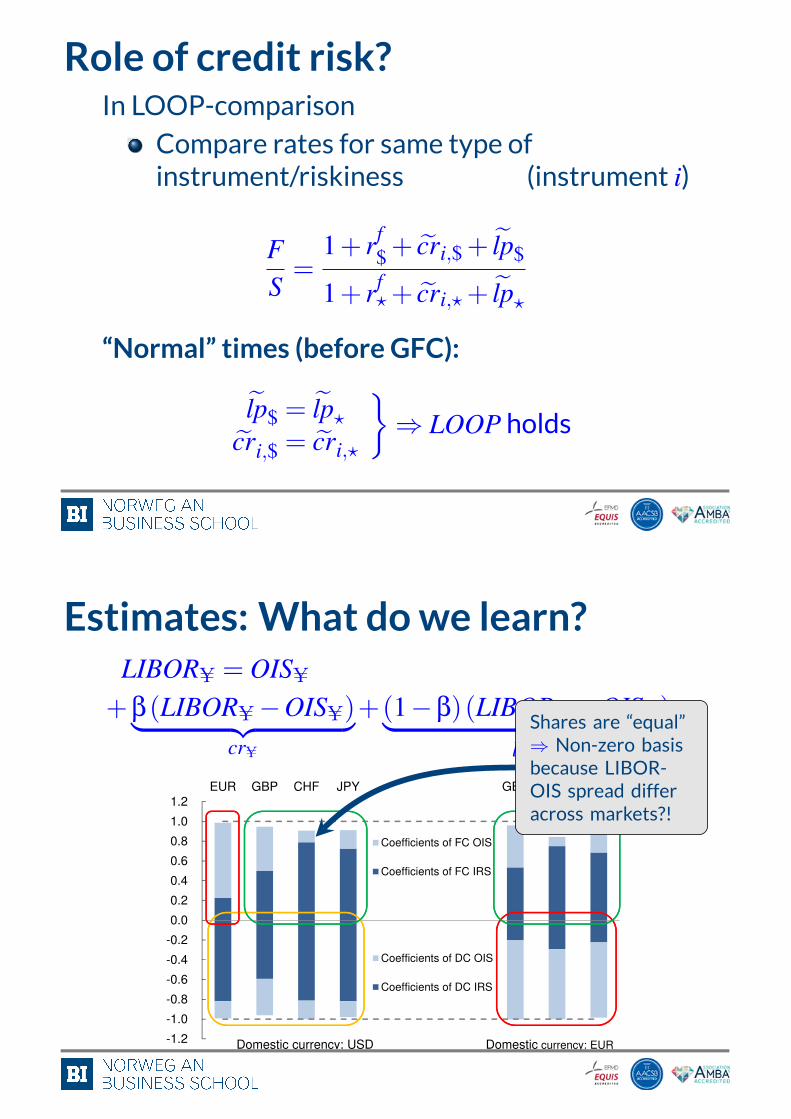
Role of credit risk?In LOOP-comparison
Compare rates for same type ofinstrument/riskiness (instrument i)
FS=
1+ rf$ + cri,$ + lp$
1+ rf?+ cri,?+ lp?
“Normal” times (before GFC):lp$ = lp?
cri,$ = cri,?
}⇒ LOOP holds
Estimates: What dowe learn?LIBORU = OISU
+β(LIBORU−OISU)︸ ︷︷ ︸crU
+(1−β)(LIBORU−OISU)︸ ︷︷ ︸lpU
40
model predicts.
-1.2
-1.0
-0.8
-0.6
-0.4
-0.2
0.0
0.2
0.4
0.6
0.8
1.0
1.2EUR GBP CHF JPY GBP CHF JPY
Coefficients of FC OIS
Coefficients of FC IRS
Coefficients of DC OIS
Coefficients of DC IRS
Domestic currency: USD Domestic currency: EUR
FIGURE 9. SUM OF COEFFICIENTS OF IRS AND OIS
Source: Table 4
Moreover, the results are highly robust across the currency pairs. The relative
size of the OIS and IRS coefficients, i.e., the relative share of counterparty and
liquidity risk premiums, for each of the currencies is extremely consistent across
the currency pairs, i.e., regardless of which currency is in the other leg. As shown
in Figure 9, the relative size of the light and dark blue bars for EUR is almost
uniform across the currency pairs (circled in red). The light blue bars are longer,
suggesting that the counterparty risk premium accounts for a larger share of the
Libor-OIS spread in the EUR Libor market, all falling within the range of 70-
80%. The relative size of the bars for USD is also very much the same across the
currency pairs with longer dark blue bars (circled in yellow), reflecting a larger
proportion of the liquidity risk premium, about 60% vis-a-vis GBP and slightly
above 80% vis-a-vis the other three currencies. Similarly, the relative size of
Shares are “equal”⇒ Non-zero basisbecause LIBOR-OIS spread differacross markets?!
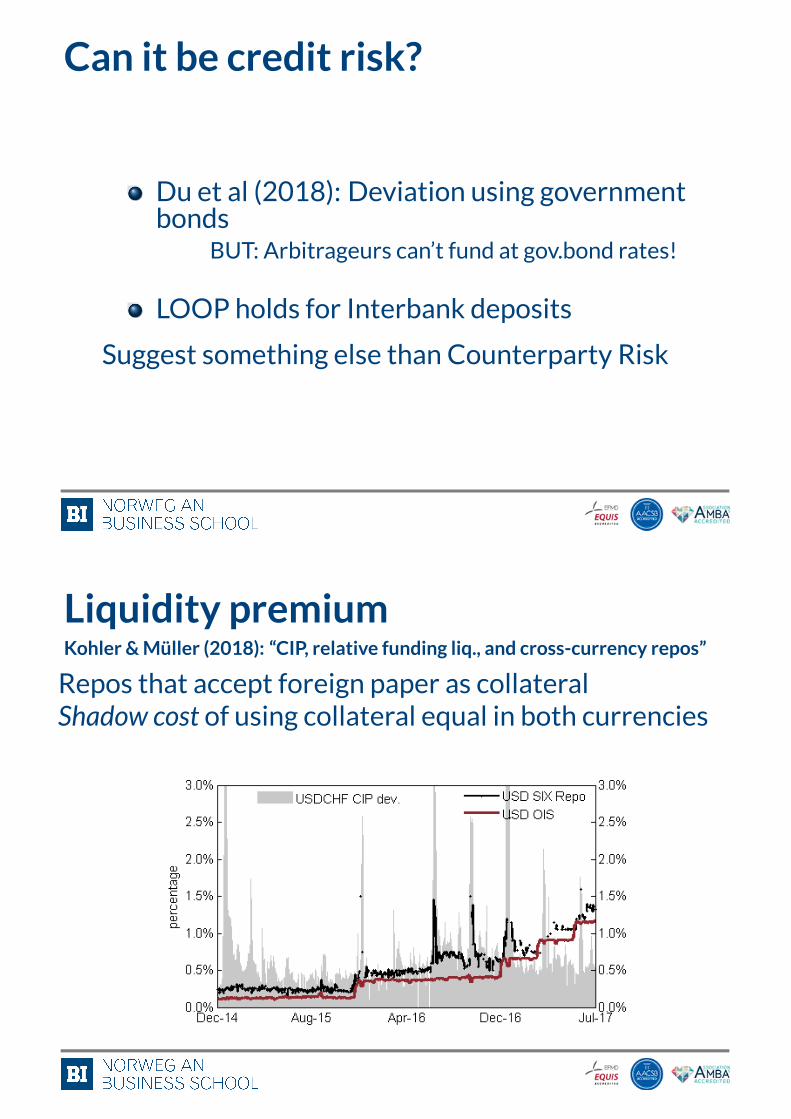
Can it be credit risk?
Du et al (2018): Deviation using governmentbondsBUT: Arbitrageurs can’t fund at gov.bond rates!
LOOP holds for Interbank depositsSuggest something else than Counterparty Risk
Liquidity premiumKohler &Müller (2018): “CIP, relative funding liq., and cross-currency repos”Repos that accept foreign paper as collateralShadow cost of using collateral equal in both currencies
deviations.28
Figure 1 depicts US dollar CCY SIX Repo rates (black line), US dollar OIS rates (red
line) and the USDCHF FX basis derived from OIS interest rate differentials, all shown for a
maturity of one week. Recall that US dollar CCY SIX Repo rates are not available on a daily
basis, which explains the missing observations compared to US dollar OIS rates in Figure 1.
The following observations can be made: first, US dollar CCY SIX Repo rates indeed trade
above US dollar OIS rates. Second, the USDCHF FX basis spikes towards quarter-ends. 1W
US dollar OIS rates fail to capture these dynamics while 1W US dollar CCY SIX Repo rates
interestingly exhibit similar quarter-end spikes.
Fig. 1. US dollar CCY SIX Repo, US dollar OIS interest rates and the USDCHF FX basis
Figure 1 shows US dollar CCY SIX Repo rates (black line), US dollar OIS rates (red line) and the USDCHFOIS-based FX basis (grey shaded). All instruments are depicted for a maturity of one week.
These stylized facts are first evidence that the spread between US dollar CCY repo and
US dollar OIS rates on the one hand and OIS-based CIP deviations on the other move
very much in parallel, in particular, over quarter-ends. To provide further evidence for our
hypothesis, the predictive power of the spread between US dollar CCY SIX Repo and US
28In fact, there is hardly any price difference between Swiss franc CCY repo and Swiss franc OIS rates orbetween euro CCY repo and euro OIS rates. The same is not true for US dollar interest rates where CCYrepos trade at a considerable and persistent premium compared to OIS. It is hence the US dollar CCY repowhich makes the difference when testing CIP in Equation (2).
23

SummaryVery interesting paper on a hot topicClarify economic interpretation ofregression resultsWhat does themagnitudes imply?Do constrained panel regressions:Get consistent USD-premiums acrosscurrenciesTriangular relation: Do Risk-shares add up?
Thank you!Thank you!home.bi.no/dagfinn.rimehome.bi.no/dagfinn.rime
[email protected]@bi.no
References IWenxin Du, Alexander Tepper, and Adrien Verdelhan.Deviations from covered interest rate parity. Journal ofFinance, 73(3):915–957, 2018.
Daniel Kohler and BenjaminMüller. Covered interest rateparity, relative funding liquidity and cross-currencyrepos. typescript, Swiss National Bank, 2018. URLhttps://www.snb.ch/n/mmr/reference/sem_2018_09_21_mueller/source/sem_2018_09_21_mueller.n.pdf.
Dagfinn Rime, Andreas Schrimpf, andOlav Syrstad.Covered interest parity arbitrage. Working Paper 15,Norges Bank, 2018.
Olav Syrstad. Covered interest rate parity in bondmarkets.typescript, Norges Bank, 2018.