Embed Size (px)
Citation preview
National Automobile Dealers Association
2009 Bi-Annual Survey of
Dealership Satisfaction with
Dealer System Providers’ Products and Services
Market Research Study
October 2009

Copyright © 2009, NADA All Rights Reserved. 2
National Automobile Dealers Association
I. Overall Dealership Satisfaction
II. System Functionality
III. DSP Customer Service Satisfaction
IV. Third Party Vendors
V. Vendor Training and Education

Copyright © 2009, NADA All Rights Reserved. 3
Introduction and Study Methodology• 984 telephone surveys were completed by Friedman-Swift Associates from May 2009 to June
2009.
• Dealerships included in this study have used their current DSP vendor for at least one year.
• Dealership personnel interviewed have personally used their current DSP vendor for at least 6 months.
• Infiniti and Saturn dealerships were excluded from the study since these dealers do not choose their DSP.
• DSP vendors active in the U.S. market that were below the survey threshold for number of customers included: AFS Information Systems, DPC Systems, Dubuque Data Services, Jarvis Computer Software, Karmak, Lightyear Dealer Technologies (DealerBuilt), MPK Automotive, NeoSynergy, PBS Financial, Procede Software, Quorum, Rapid Systems, Systems 2000, Inc.
• Maximum margin of error:
- Total sample is plus or minus 3%
- Per dealership management group is plus or minus 6%
- Per individual vendor is plus or minus 7%
• The following dealership positions were interviewed and grouped accordingly:
- Dealers/General Managers (GM)
- General Sales Managers/New Car Sales Managers
- Office Managers (OM)/Controllers
- Parts Managers
- Service Managers

I. Overall Dealership
Satisfaction
Copyright © 2009, NADA All Rights Reserved. 5
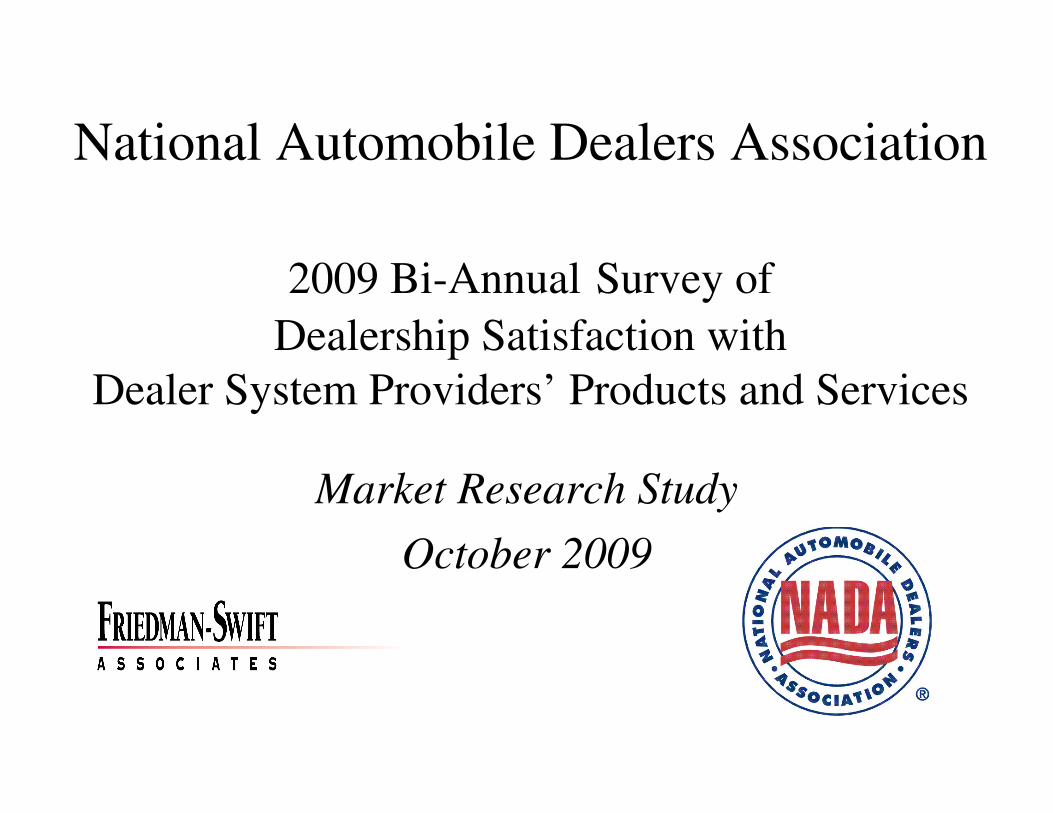
Overall Dealership Satisfaction
Definitely
would
repurchase
Satisfied
customers
Definitely
would
recommend

Copyright © 2009, NADA All Rights Reserved. 6
How satisfied are you overall with the products and
services received from (your DSP vendor)?
79%78%
72%
14%
19%
13%
7%8% 8%
0%
20%
40%
60%
80%
100%
2005 2007 2009
Very & Somewhat
Satisfied
Neither
Very & Somewhat
Dissatisfied
Q.12
2009 Weighted Base = 984
2009 Actual Base = 984
Overall Dealership SatisfactionAll Dealership Positions surveyed

Copyright © 2009, NADA All Rights Reserved. 7
How satisfied are you overall with the products and services
received from (your DSP vendor)?
Q.12
81%
93%
80%
75%72%
51%
76%77%79%79%
0%
20%
40%
60%
80%
100%
OM/Controller Service Mgr. Parts Mgr. Sales Mgr. Dealer/GM
2009 Weighted Base = 984
2009 Actual Base = 984
Overall Dealership SatisfactionAll Dealership Positions surveyed
Percentages represent very satisfied and somewhat satisfied ratings
2009 Mean = 72%
2007 Mean = 79%
2005 Mean = 78%
2009 Mean
GOAL = 90% Satisfaction
Greater than mean Less than mean
Solids = 2009 DataStripes = 2007 Data
Equivalent to mean

Copyright © 2009, NADA All Rights Reserved. 8
How satisfied are you overall with the products and services
received from (your DSP vendor)?
GOAL = 90% Satisfaction
Q.122009 Weighted Base = 984
2009 Actual Base = 984
Overall Dealership SatisfactionAll Dealership Positions surveyed
Percentages represent very satisfied and somewhat satisfied ratings
2009 Mean = 72%
2007 Mean = 79%
2005 Mean = 78%
86%
74%
90%
79% 78%79%
73%
86%84% 82% 80% 78%
71% 70%
0%
20%
40%
60%
80%
100%
Auto/Mate AutoSoft Arkona ACS ADAM R&R ADP
.
2009 Mean
Greater than mean Less than mean
Solids = 2009 DataStripes = 2007 Data
Equivalent to mean

Copyright © 2009, NADA All Rights Reserved. 9
If you could choose which DSP vendor your dealership used, would
you switch from (your DSP vendor) to another vendor?
70%73%
67%
16% 18% 17%14%
9%
16%
0%
20%
40%
60%
80%
2005 2007 2009
Yes
No
Do not know
Q.2
2009 Weighted Base = 774
2009 Actual Base = 787
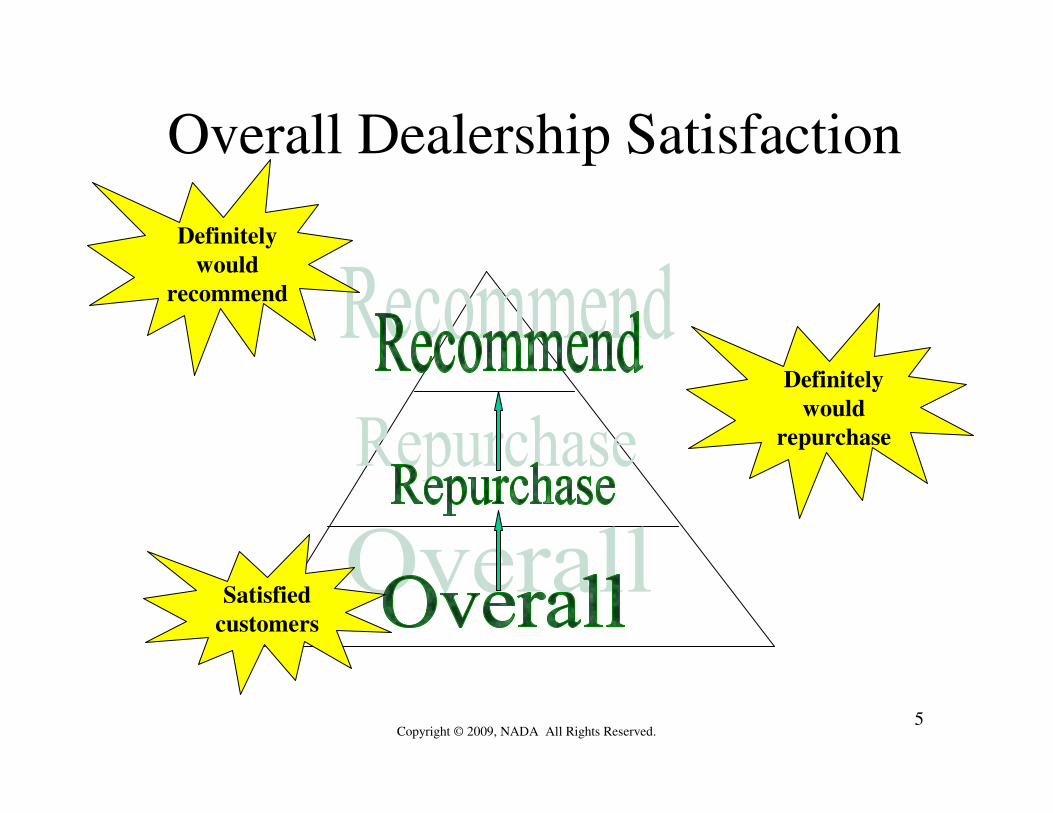
19% of 2009 Dealer/GMs surveyed plan on switching vendors when their contract is up,
while 21% are undecided
Likelihood of Switching
Overall Dealership SatisfactionOff. Mgr./Controller, Sales Mgr., Service Mgr., Parts Mgr. surveyed
Copyright © 2009, NADA All Rights Reserved. 10
When your contract is up, do you plan to switch from (your DSP vendor)?
16%
58%60% 60%
25%
19%21%
13%
22%
0%
20%
40%
60%
80%
2005 2007 2009
Yes
No
Do not know
Q.12009 Weighted Base = 210
2009 Actual Base = 197
Likelihood of Switching
Overall Dealership SatisfactionDealer/GM surveyed
Copyright © 2009, NADA All Rights Reserved. 11
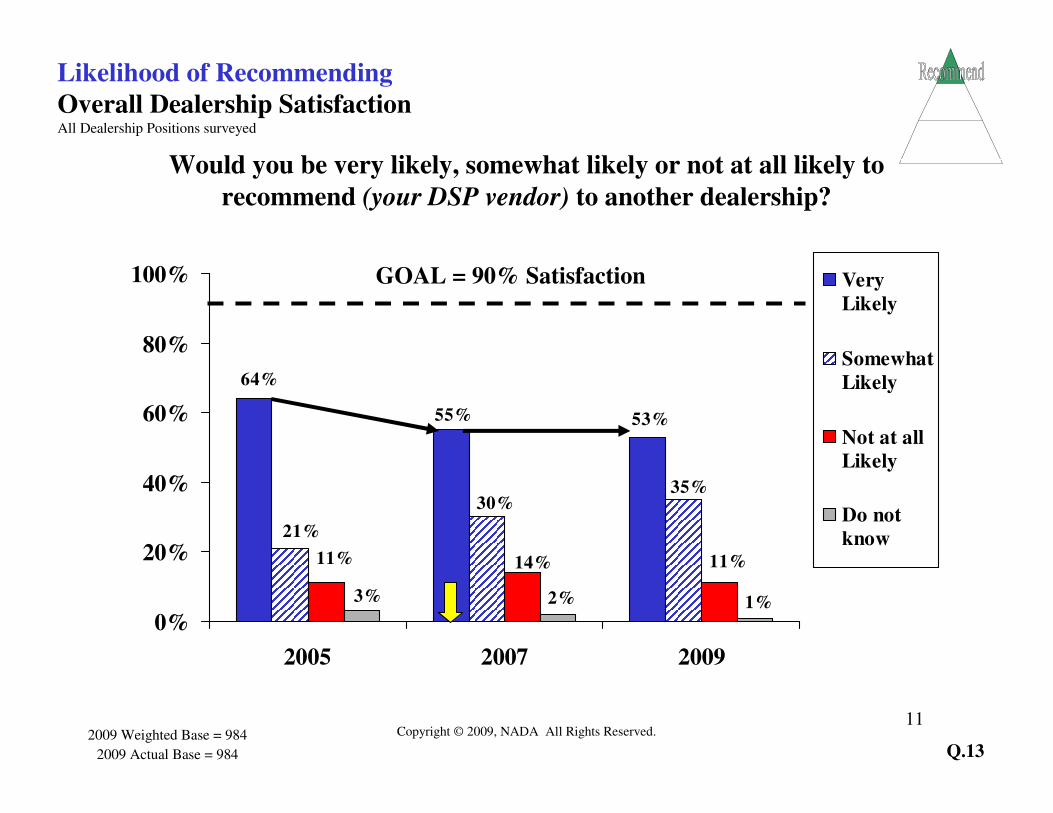
Would you be very likely, somewhat likely or not at all likely to
recommend (your DSP vendor) to another dealership?
53%55%
64%
21%
30%35%
11%11% 14%
1%2%3%
0%
20%
40%
60%
80%
100%
2005 2007 2009
Very
Likely
Somewhat
Likely
Not at all
Likely
Do not
know
Q.132009 Weighted Base = 984
2009 Actual Base = 984
Likelihood of Recommending
Overall Dealership SatisfactionAll Dealership Positions surveyed
GOAL = 90% Satisfaction

Copyright © 2009, NADA All Rights Reserved. 12
Would you be very likely, somewhat likely or not at all likely to
recommend (your DSP vendor) to another dealership?
Q.13
Likelihood of Recommending
2009 Weighted Base = 984
2009 Actual Base = 984
Overall Dealership SatisfactionAll Dealership Positions surveyed
Percentages represent very likely responses
2009 Mean
2009 Mean = 53%
2007 Mean = 55%
2005 Mean = 64%
67%
50%
75%
50%
42%
62%60%
35%
53%
58%
0%
20%
40%
60%
80%
100%
Parts Mgr. Service Mgr. OM/Controller Sales Mgr. Dealer/GM
GOAL = 90% Satisfaction
Greater than mean Less than mean
Solids = 2009 DataStripes = 2007 Data
Equivalent to mean

Copyright © 2009, NADA All Rights Reserved. 13
Would you be very likely, somewhat likely or not at all likely to
recommend (your DSP vendor) to another dealership?
Q.13
Likelihood of Recommending
2009 Weighted Base = 984
2009 Actual Base = 984
Overall Dealership SatisfactionAll Dealership Positions surveyed
Percentages represent very likely responses
50%52%
56%
66%59%
65%
74% 74%71%
61% 60%
53% 51%48%
0%
20%
40%
60%
80%
100%
AutoSoft Auto/Mate Arkona ACS R&R ADAM ADP
2009 Mean = 53%
2007 Mean = 55%
2005 Mean = 64%
2009 Mean
GOAL = 90% Satisfaction
Greater than mean Less than mean
Solids = 2009 DataStripes = 2007 Data
Equivalent to mean
Copyright © 2009, NADA All Rights Reserved. 14
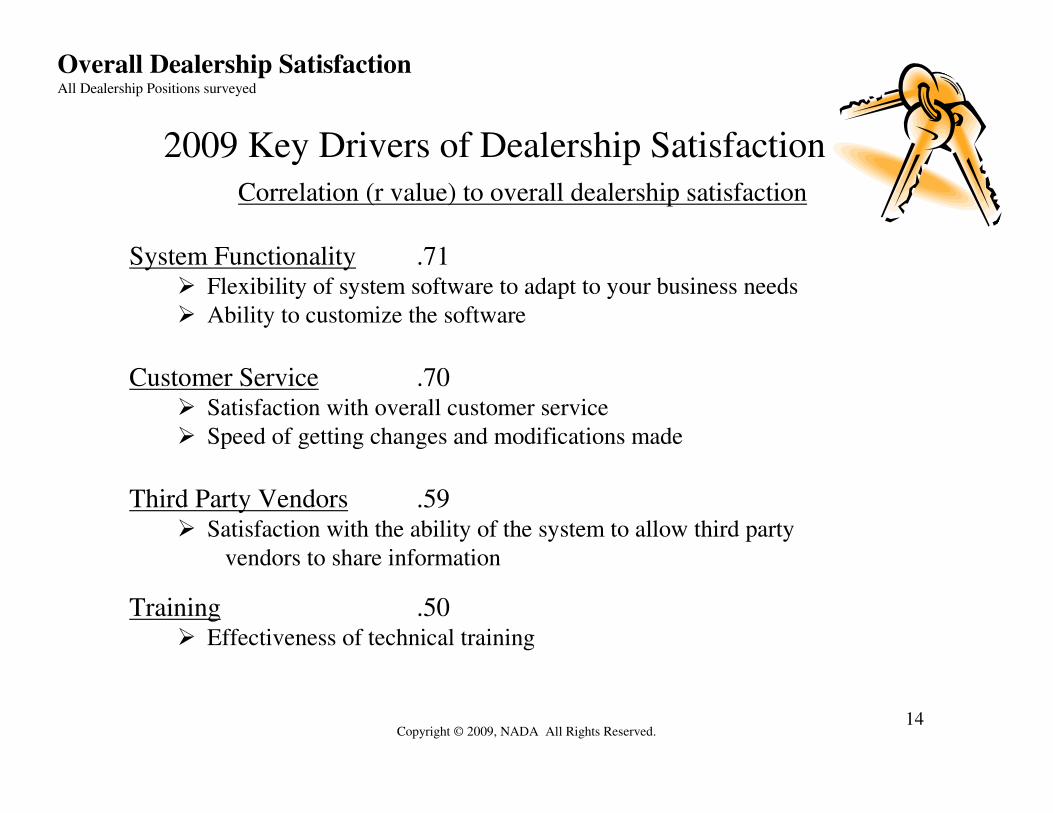
Correlation (r value) to overall dealership satisfaction
System Functionality .71� Flexibility of system software to adapt to your business needs
� Ability to customize the software
Customer Service .70� Satisfaction with overall customer service
� Speed of getting changes and modifications made
Third Party Vendors .59� Satisfaction with the ability of the system to allow third party
vendors to share information
Training .50� Effectiveness of technical training
2009 Key Drivers of Dealership Satisfaction
Overall Dealership SatisfactionAll Dealership Positions surveyed

II. System Functionality
1st

Copyright © 2009, NADA All Rights Reserved. 162009 Weighted Base = 984
2009 Actual Base = 984
System FunctionalityAll Dealership Positions surveyed
How satisfied are you with (your DSP vendor) in the flexibility
of the software to adapt to your business needs?
Q.6c
67%
72%
65%
20%
15%15%12%
10%12%
0%
20%
40%
60%
80%
100%
2005 2007 2009
Very & Somewhat
Satisfied
Neither
Very & Somewhat
Dissatisfied
Copyright © 2009, NADA All Rights Reserved. 17
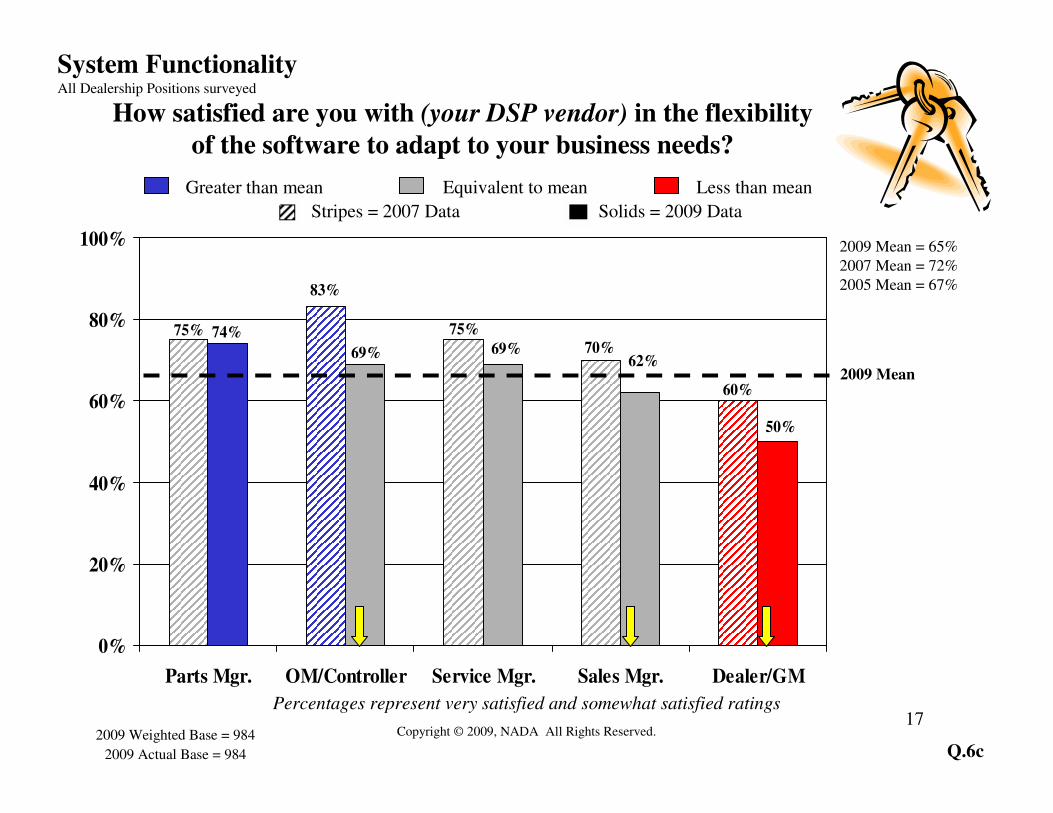
Percentages represent very satisfied and somewhat satisfied ratings
How satisfied are you with (your DSP vendor) in the flexibility
of the software to adapt to your business needs?
Q.6c
83%
60%
75%70%
75%74%
69% 69%62%
50%
0%
20%
40%
60%
80%
100%
Parts Mgr. OM/Controller Service Mgr. Sales Mgr. Dealer/GM
2009 Weighted Base = 984
2009 Actual Base = 984
System FunctionalityAll Dealership Positions surveyed
2009 Mean
2009 Mean = 65%
2007 Mean = 72%
2005 Mean = 67%
Greater than mean Less than mean
Solids = 2009 DataStripes = 2007 Data
Equivalent to mean

Copyright © 2009, NADA All Rights Reserved. 18
Percentages represent very satisfied and somewhat satisfied ratings
How satisfied are you with (your DSP vendor) in the flexibility
of the software to adapt to your business needs?
Q.6c
67%
74%
63%
87%
67%
85%
78% 78%
74% 72%
64% 62%
70%
77%
0%
20%
40%
60%
80%
100%
Auto/Mate AutoSoft Arkona ACS ADAM R&R ADP
2009 Weighted Base = 984
2009 Actual Base = 984
System FunctionalityAll Dealership Positions surveyed
2009 Mean = 65%
2007 Mean = 72%
2005 Mean = 67%
2009 Mean
Greater than mean Less than mean
Solids = 2009 DataStripes = 2007 Data
Equivalent to mean
Copyright © 2009, NADA All Rights Reserved. 19
Q.6d
2009 Weighted Base = 984
2009 Actual Base = 984
System FunctionalityAll Dealership Positions surveyed
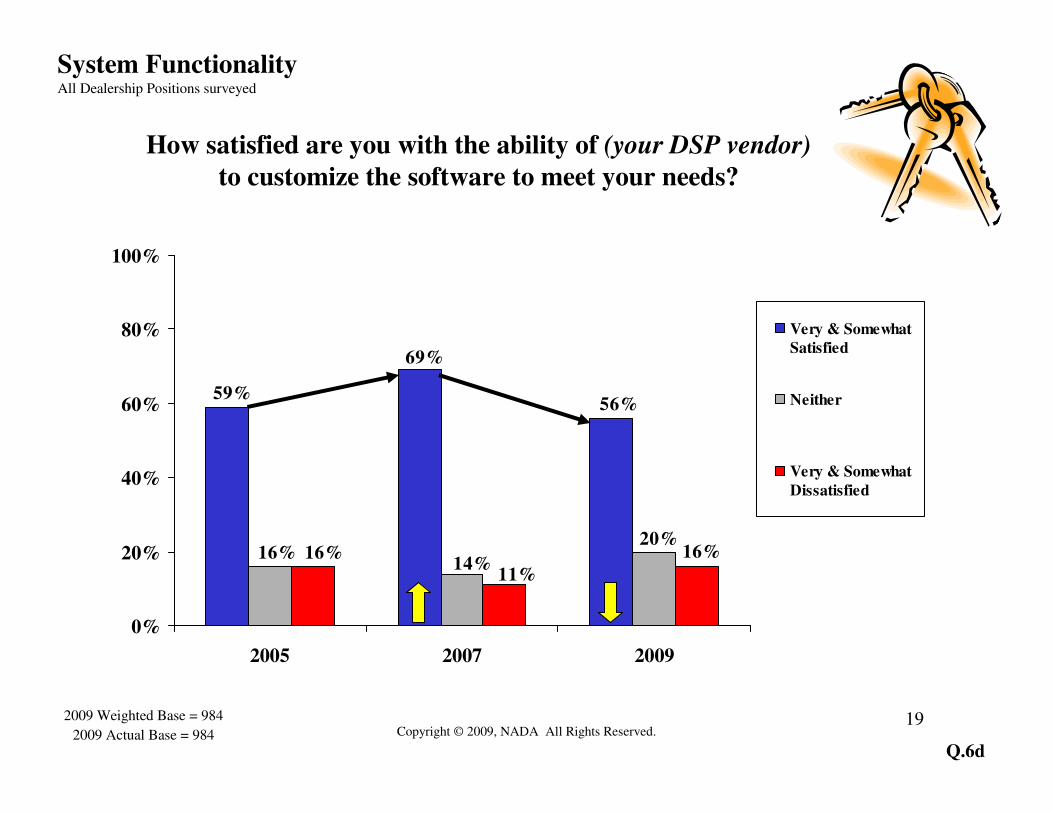
How satisfied are you with the ability of (your DSP vendor)
to customize the software to meet your needs?
56%
69%
59%
20%
14%16%
11%
16%16%
0%
20%
40%
60%
80%
100%
2005 2007 2009
Very & Somewhat
Satisfied
Neither
Very & Somewhat
Dissatisfied

Copyright © 2009, NADA All Rights Reserved. 20
Percentages represent very satisfied and somewhat satisfied ratings
How satisfied are you with the ability of (your DSP vendor)
to customize the software to meet your needs?
Q.6d
66%
61% 60% 58%
38%
57%
79%
66%
78%
71%
0%
20%
40%
60%
80%
100%
Parts Mgr. Service Mgr. Sales Mgr. OM/Controller Dealer/GM
2009 Weighted Base = 984
2009 Actual Base = 984
System FunctionalityAll Dealership Positions surveyed
2009 Mean
2009 Mean = 56%
2007 Mean = 69%
2005 Mean = 59%
Greater than mean Less than mean
Solids = 2009 DataStripes = 2007 Data
Equivalent to mean
Copyright © 2009, NADA All Rights Reserved. 21
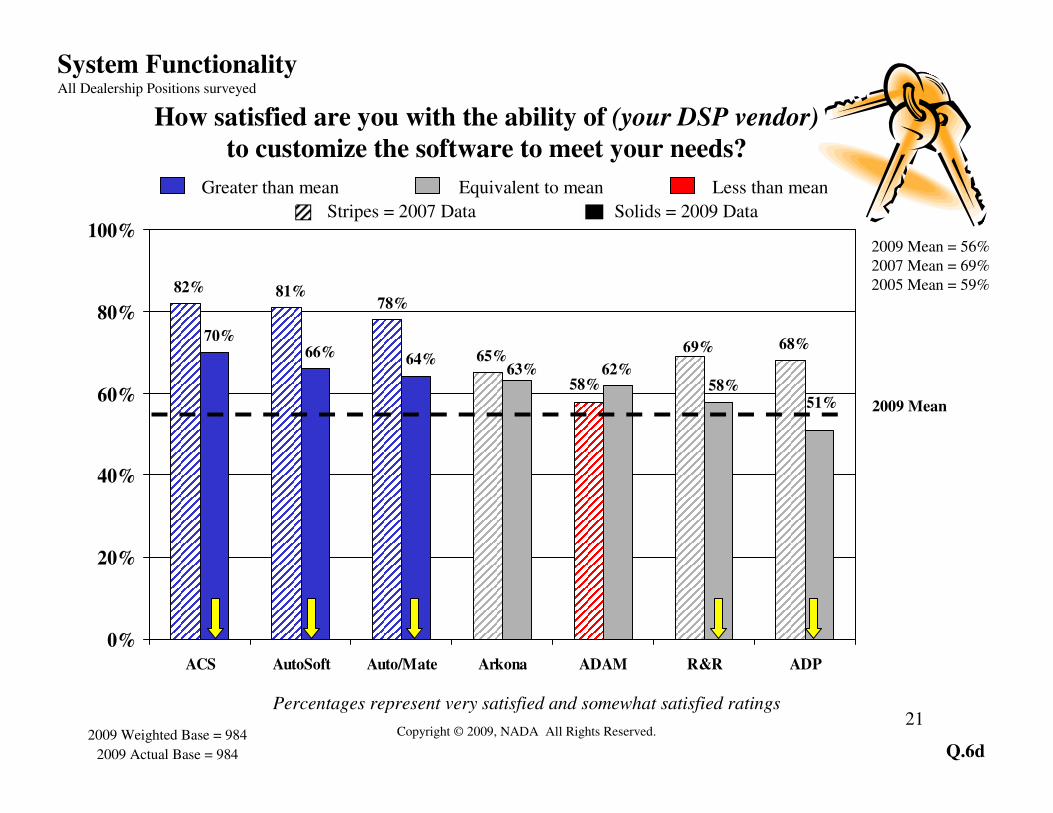
Percentages represent very satisfied and somewhat satisfied ratings
How satisfied are you with the ability of (your DSP vendor)
to customize the software to meet your needs?
Q.6d
62%
68%69%
58%
65%
78%81%82%
51%58%
63%64%66%
70%
0%
20%
40%
60%
80%
100%
ACS AutoSoft Auto/Mate Arkona ADAM R&R ADP
2009 Weighted Base = 984
2009 Actual Base = 984
System FunctionalityAll Dealership Positions surveyed
2009 Mean = 56%
2007 Mean = 69%
2005 Mean = 59%
2009 Mean
Greater than mean Less than mean
Solids = 2009 DataStripes = 2007 Data
Equivalent to mean

Copyright © 2009, NADA All Rights Reserved. 22
Q.6f
2009 Weighted Base = 984
2009 Actual Base = 984
System FunctionalityAll Dealership Positions surveyed
84%83%
9%10%
5%4%
0%
20%
40%
60%
80%
100%
2007 2009
Very & Somewhat
Satisfied
Neither
Very & Somewhat
Dissatisfied
How satisfied are you with the ability of
(your DSP vendor’s) system to store data?

Copyright © 2009, NADA All Rights Reserved. 23
Percentages represent very satisfied and somewhat satisfied ratings
Q.6f
86%
78%79%80%
90%
83%89%
83% 83%88%
0%
20%
40%
60%
80%
100%
Service Mgr. Parts Mgr. OM/Controller Sales Mgr. Dealer/GM
2009 Weighted Base = 984
2009 Actual Base = 984
System FunctionalityAll Dealership Positions surveyed
2009 Mean
2009 Mean = 84%
2007 Mean = 83%
How satisfied are you with the ability of
(your DSP vendor’s) system to store data?
Greater than mean Less than mean
Solids = 2009 DataStripes = 2007 Data
Equivalent to mean
Copyright © 2009, NADA All Rights Reserved. 24
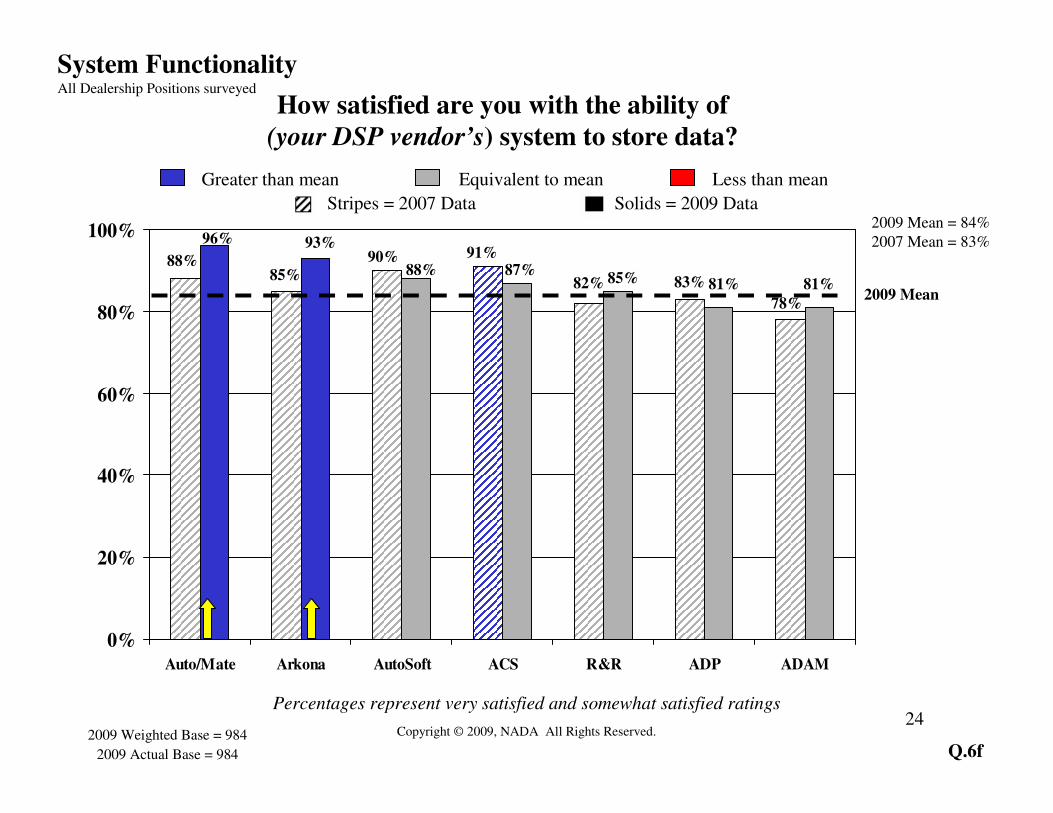
Percentages represent very satisfied and somewhat satisfied ratings
Q.6f
78%
83%82%
91%90%85%
88%
81%81%85%87%88%
93%96%
0%
20%
40%
60%
80%
100%
Auto/Mate Arkona AutoSoft ACS R&R ADP ADAM
2009 Weighted Base = 984
2009 Actual Base = 984
System FunctionalityAll Dealership Positions surveyed
2009 Mean = 84%
2007 Mean = 83%
2009 Mean
How satisfied are you with the ability of
(your DSP vendor’s) system to store data?
Greater than mean Less than mean
Solids = 2009 DataStripes = 2007 Data
Equivalent to mean

Copyright © 2009, NADA All Rights Reserved. 25
How satisfied are you with the speed of
(your DSP vendor’s) system?
Q.6e
75%79%
77%
13%
7%5%
16% 17%
8%
0%
20%
40%
60%
80%
100%
2005 2007 2009
Very & Somewhat
Satisfied
Neither
Very & Somewhat
Dissatisfied
2009 Weighted Base = 984
2009 Actual Base = 984
System FunctionalityAll Dealership Positions surveyed
Copyright © 2009, NADA All Rights Reserved. 26
Percentages represent very satisfied and somewhat satisfied ratings
How satisfied are you with the speed of
(your DSP vendor’s) system?
Q.6e
91%
76%
72%
79%
83%
70%
77%78%79%81%
0%
20%
40%
60%
80%
100%
Parts Mgr. Service Mgr. OM/Controller Sales Mgr. Dealer/GM
2009 Weighted Base = 984
2009 Actual Base = 984
System FunctionalityAll Dealership Positions surveyed
2009 Mean = 77%
2007 Mean = 79%
2005 Mean = 75%
2009 Mean
Greater than mean Less than mean
Solids = 2009 DataStripes = 2007 Data
Equivalent to mean

Copyright © 2009, NADA All Rights Reserved. 27
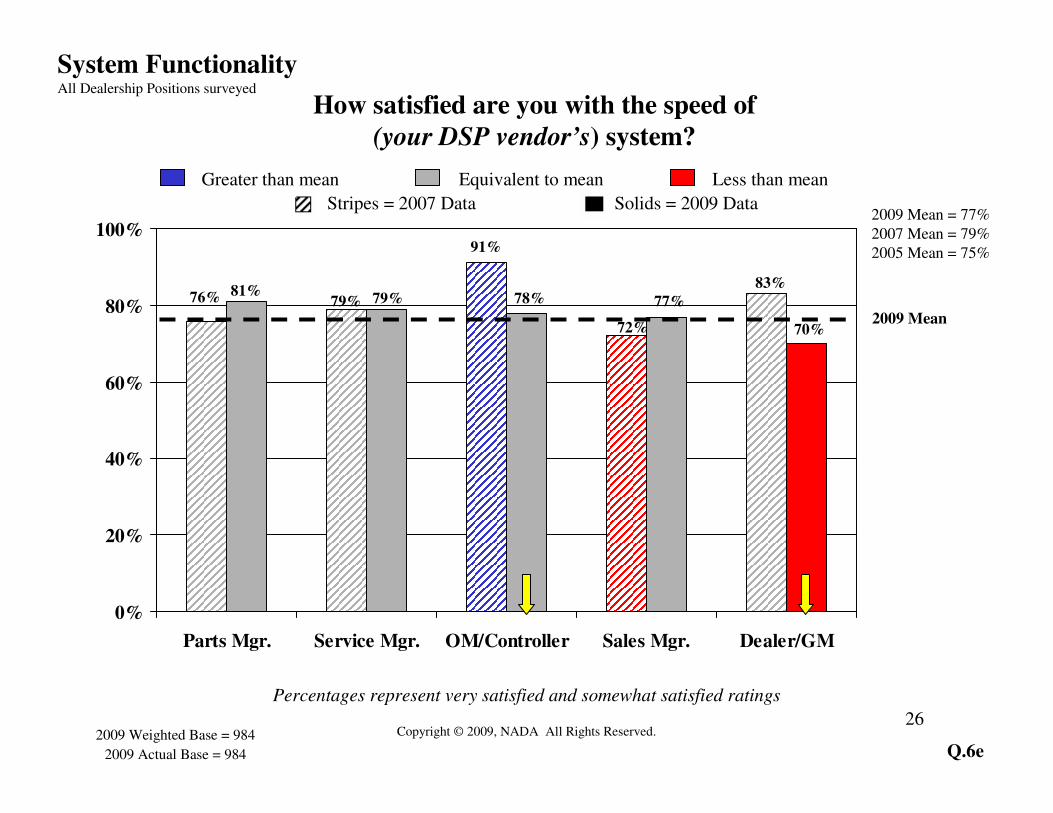
Percentages represent very satisfied and somewhat satisfied ratings
Q.6e
77%
88%
94%
88%
81% 75% 75%
68%
78%82%83%83%83%
88%
0%
20%
40%
60%
80%
100%
Auto/Mate ACS AutoSoft R&R Arkona ADAM ADP
2009 Weighted Base = 984
2009 Actual Base = 984
System FunctionalityAll Dealership Positions surveyed
2009 Mean = 77%
2007 Mean = 79%
2005 Mean = 75%
How satisfied are you with the speed of
(your DSP vendor’s) system?
2009 Mean
Greater than mean Less than mean
Solids = 2009 DataStripes = 2007 Data
Equivalent to mean

Copyright © 2009, NADA All Rights Reserved. 28
Q.6g
2009 Weighted Base = 984
2009 Actual Base = 984
System FunctionalityAll Dealership Positions surveyed
73%
79%
14%11%
4%5%
0%
20%
40%
60%
80%
100%
2007 2009
Very & Somewhat
Satisfied
Neither
Very & Somewhat
Dissatisfied
How satisfied are you with the amount of time
(your DSP vendor’s) system can store data?

Copyright © 2009, NADA All Rights Reserved. 29
Percentages represent very satisfied and somewhat satisfied ratings
Q.6g
74%74%
79%
87%83%
67%
70%75%75%
80%
0%
20%
40%
60%
80%
100%
Service Mgr. OM/Controller Parts Mgr. Dealer/GM Sales Mgr.
2009 Weighted Base = 984
2009 Actual Base = 984
System FunctionalityAll Dealership Positions surveyed
2009 Mean
2009 Mean = 73%
2007 Mean = 79%
How satisfied are you with the amount of time
(your DSP vendor’s) system can store data?
Greater than mean Less than mean
Solids = 2009 DataStripes = 2007 Data
Equivalent to mean

Copyright © 2009, NADA All Rights Reserved. 30
Percentages represent very satisfied and somewhat satisfied ratings
Q.6g
80%
76%
81%
75%
82%
91%
84%79%
71%72%
82%83%87%
94%
0%
20%
40%
60%
80%
100%
Auto/Mate Arkona ACS AutoSoft ADAM ADP R&R
2009 Weighted Base = 984
2009 Actual Base = 984
System FunctionalityAll Dealership Positions surveyed
2009 Mean = 73%
2007 Mean = 79%
2009 Mean
How satisfied are you with the amount of time
(your DSP vendor’s) system can store data?
Greater than mean Less than mean
Solids = 2009 DataStripes = 2007 Data
Equivalent to mean

Copyright © 2009, NADA All Rights Reserved. 31
Q.6b
2009 Weighted Base = 984
2009 Actual Base = 984
System FunctionalityAll Dealership Positions surveyed
How satisfied are you with (your DSP vendor) in the ability to integrate with
Internet-based DCS (Dealer Communication Systems) applications
(email and the Web)?
60%
72%
63%
15%14%14%
9% 10%11%
0%
20%
40%
60%
80%
100%
2005 2007 2009
Very & Somewhat
Satisfied
Neither
Very & Somewhat
Dissatisfied
Copyright © 2009, NADA All Rights Reserved. 32
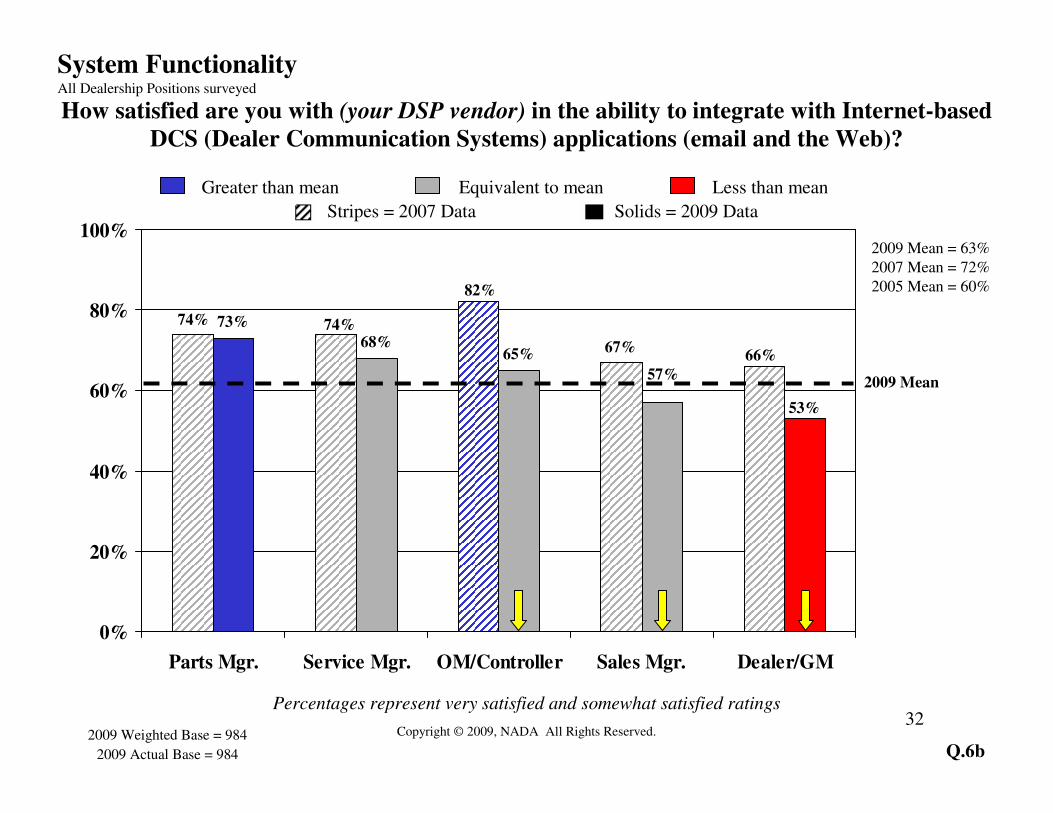
Percentages represent very satisfied and somewhat satisfied ratings
How satisfied are you with (your DSP vendor) in the ability to integrate with Internet-based
DCS (Dealer Communication Systems) applications (email and the Web)?
Q.6b
73%
68%65%
74% 74%
82%
67%66%
53%
57%
0%
20%
40%
60%
80%
100%
Parts Mgr. Service Mgr. OM/Controller Sales Mgr. Dealer/GM
2009 Weighted Base = 984
2009 Actual Base = 984
2009 Mean = 63%
2007 Mean = 72%
2005 Mean = 60%
2009 Mean
System FunctionalityAll Dealership Positions surveyed
Greater than mean Less than mean
Solids = 2009 DataStripes = 2007 Data
Equivalent to mean
Copyright © 2009, NADA All Rights Reserved. 33
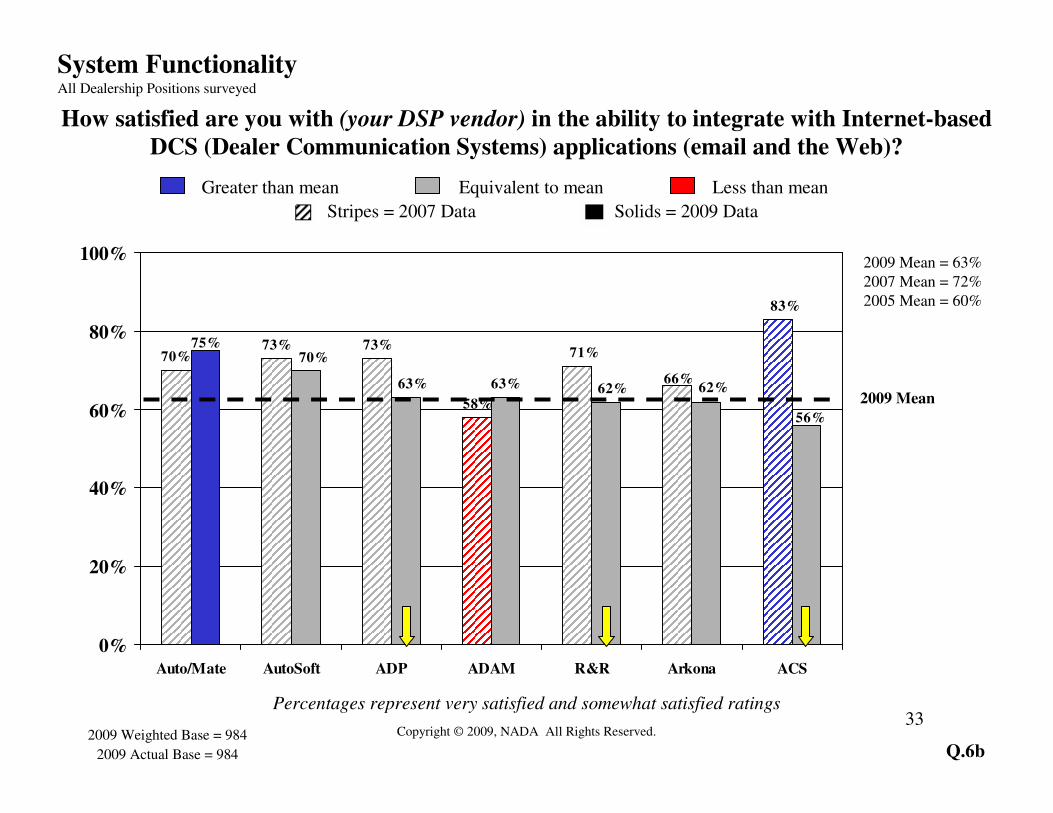
Percentages represent very satisfied and somewhat satisfied ratings
How satisfied are you with (your DSP vendor) in the ability to integrate with Internet-based
DCS (Dealer Communication Systems) applications (email and the Web)?
Q.6b
73% 73%
58%
63% 66%
71%70%
83%
56%
62%62%63%
70%75%
0%
20%
40%
60%
80%
100%
Auto/Mate AutoSoft ADP ADAM R&R Arkona ACS
2009 Weighted Base = 984
2009 Actual Base = 984
System FunctionalityAll Dealership Positions surveyed
2009 Mean = 63%
2007 Mean = 72%
2005 Mean = 60%
2009 Mean
Greater than mean Less than mean
Solids = 2009 DataStripes = 2007 Data
Equivalent to mean
Copyright © 2009, NADA All Rights Reserved. 34
Q.6a
2009 Weighted Base = 984
2009 Actual Base = 984
System FunctionalityAll Dealership Positions surveyed
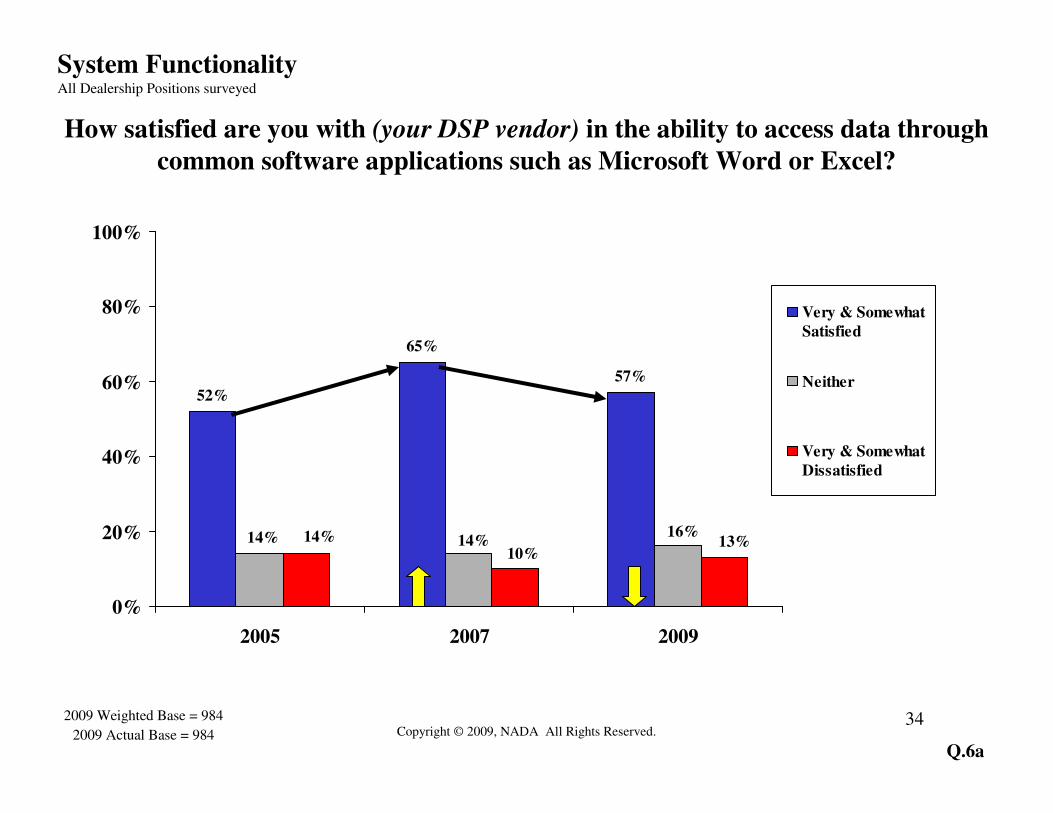
How satisfied are you with (your DSP vendor) in the ability to access data through
common software applications such as Microsoft Word or Excel?
52%
65%
57%
16%14%14% 13%
10%14%
0%
20%
40%
60%
80%
100%
2005 2007 2009
Very & Somewhat
Satisfied
Neither
Very & Somewhat
Dissatisfied

Copyright © 2009, NADA All Rights Reserved. 35
Percentages represent very satisfied and somewhat satisfied ratings
How satisfied are you with (your DSP vendor) in the ability to access data through
common software applications such as Microsoft Word or Excel?
Q.6a
62% 62%58%
80%
67%
71%
62%
51% 50%
54%
0%
20%
40%
60%
80%
100%
OM/Controller Parts Mgr. Service Mgr. Sales Mgr. Dealer/GM
2009 Weighted Base = 984
2009 Actual Base = 984
System FunctionalityAll Dealership Positions surveyed
2009 Mean = 57%
2007 Mean = 65%
2005 Mean = 52%
2009 Mean
Greater than mean Less than mean
Solids = 2009 DataStripes = 2007 Data
Equivalent to mean

Copyright © 2009, NADA All Rights Reserved. 36Percentages represent very satisfied and somewhat satisfied ratings
How satisfied are you with (your DSP vendor) in the ability to access data through
common software applications such as Microsoft Word or Excel?
Q.6a
64% 64%
75%
70%
75%
64%
50%53% 52%
56%57%
67%68%68%
0%
20%
40%
60%
80%
100%
ACS Auto/Mate AutoSoft ADP R&R ADAM Arkona
2009 Weighted Base = 984
2009 Actual Base = 984
System FunctionalityAll Dealership Positions surveyed
2009 Mean = 57%
2007 Mean = 65%
2005 Mean = 52%
2009 Mean
Greater than mean Less than mean
Solids = 2009 DataStripes = 2007 Data
Equivalent to mean

III. DSP Customer Service
Satisfaction 2nd

Copyright © 2009, NADA All Rights Reserved. 38
Overall, how satisfied are you with (your DSP vendor’s)
customer service department?
76%79%
75%
13%13% 13% 10%6%8%
0%
20%
40%
60%
80%
100%
2005 2007 2009
Very & Somewhat
Satisfied
Neither
Very & Somewhat
Dissatisfied
Q.5f2009 Weighted Base = 984
2009 Actual Base = 984
DSP Customer Service SatisfactionAll Dealership Positions surveyed
Copyright © 2009, NADA All Rights Reserved. 39
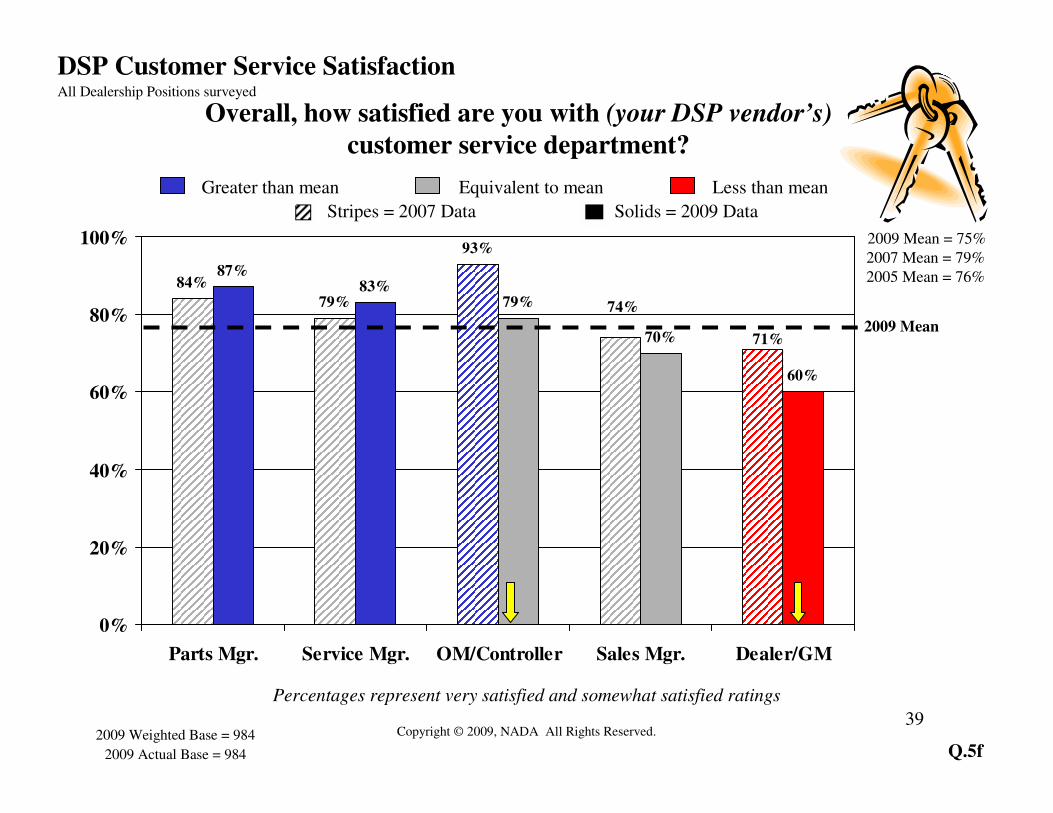
Percentages represent very satisfied and somewhat satisfied ratings
Overall, how satisfied are you with (your DSP vendor’s)
customer service department?
Q.5f
84%
79%
93%
83%79%
70%
60%
71%
74%
87%
0%
20%
40%
60%
80%
100%
Parts Mgr. Service Mgr. OM/Controller Sales Mgr. Dealer/GM
2009 Weighted Base = 984
2009 Actual Base = 984
DSP Customer Service SatisfactionAll Dealership Positions surveyed
2009 Mean
2009 Mean = 75%
2007 Mean = 79%
2005 Mean = 76%
Greater than mean Less than mean
Solids = 2009 DataStripes = 2007 Data
Equivalent to mean

Copyright © 2009, NADA All Rights Reserved. 40Percentages represent very satisfied and somewhat satisfied ratings
Overall, how satisfied are you with (your DSP vendor’s)
customer service department?
Q.5f
88%84%
81%
71%
85%
90%
82%78%
76%
87%
78% 77%
74% 70%
0%
20%
40%
60%
80%
100%
Auto/Mate AutoSoft ADAM R&R ACS Arkona ADP
2009 Weighted Base = 984
2009 Actual Base = 984
DSP Customer Service SatisfactionAll Dealership Positions surveyed
2009 Mean = 75%
2007 Mean = 79%
2005 Mean = 76%
2009 Mean
Greater than mean Less than mean
Solids = 2009 DataStripes = 2007 Data
Equivalent to mean

Copyright © 2009, NADA All Rights Reserved. 41
How satisfied are you with (your DSP vendor’s) customer service
department in regard to the speed of getting changes and
modifications made?
62%
70%62%
18%18%15% 13%11%
14%
0%
20%
40%
60%
80%
100%
2005 2007 2009
Very & Somewhat
Satisfied
Neither
Very & Somewhat
Dissatisfied
Q.5d2009 Weighted Base = 984
2009 Actual Base = 984
DSP Customer Service SatisfactionAll Dealership Positions surveyed

Copyright © 2009, NADA All Rights Reserved. 42
Percentages represent very satisfied and somewhat satisfied ratings
How satisfied are you with (your DSP vendor’s) customer service department
in regard to the speed of getting changes and modifications made?
Q.5d
77%
71%75%
73%
59%
52%57%
67%67%69%
0%
20%
40%
60%
80%
100%
OM/Controller Parts Mgr. Service Mgr. Sales Mgr. Dealer/GM
2009 Weighted Base = 984
2009 Actual Base = 984
DSP Customer Service SatisfactionAll Dealership Positions surveyed
2009 Mean
2009 Mean = 62%
2007 Mean = 70%
2005 Mean = 62%
Greater than mean Less than mean
Solids = 2009 DataStripes = 2007 Data
Equivalent to mean

Copyright © 2009, NADA All Rights Reserved. 43Percentages represent very satisfied and somewhat satisfied ratings
How satisfied are you with (your DSP vendor’s) customer service department
in regard to the speed of getting changes and modifications made?
Q.5d
67%
58%
81%
72%
66%
72%
82%79%
75% 75%
65%62% 62%
56%
0%
20%
40%
60%
80%
100%
AutoSoft Auto/Mate ADAM R&R ACS Arkona ADP
2009 Weighted Base = 984
2009 Actual Base = 984
DSP Customer Service Satisfaction All Dealership Positions surveyed
2009 Mean = 62%
2007 Mean = 70%
2005 Mean = 62%
2009 Mean
Greater than mean Less than mean
Solids = 2009 DataStripes = 2007 Data
Equivalent to mean

Copyright © 2009, NADA All Rights Reserved. 44
How satisfied are you with (your DSP vendor’s) customer service
department in regard to the maintenance of your daily business with
minimal interruptions?
81%84%
80%
11%12% 11%
5%3%5%
0%
20%
40%
60%
80%
100%
2005 2007 2009
Very & Somewhat
Satisfied
Neither
Very & Somewhat
Dissatisfied
Q.5a2009 Weighted Base = 984
2009 Actual Base = 984
DSP Customer Service SatisfactionAll Dealership Positions surveyed

Copyright © 2009, NADA All Rights Reserved. 45
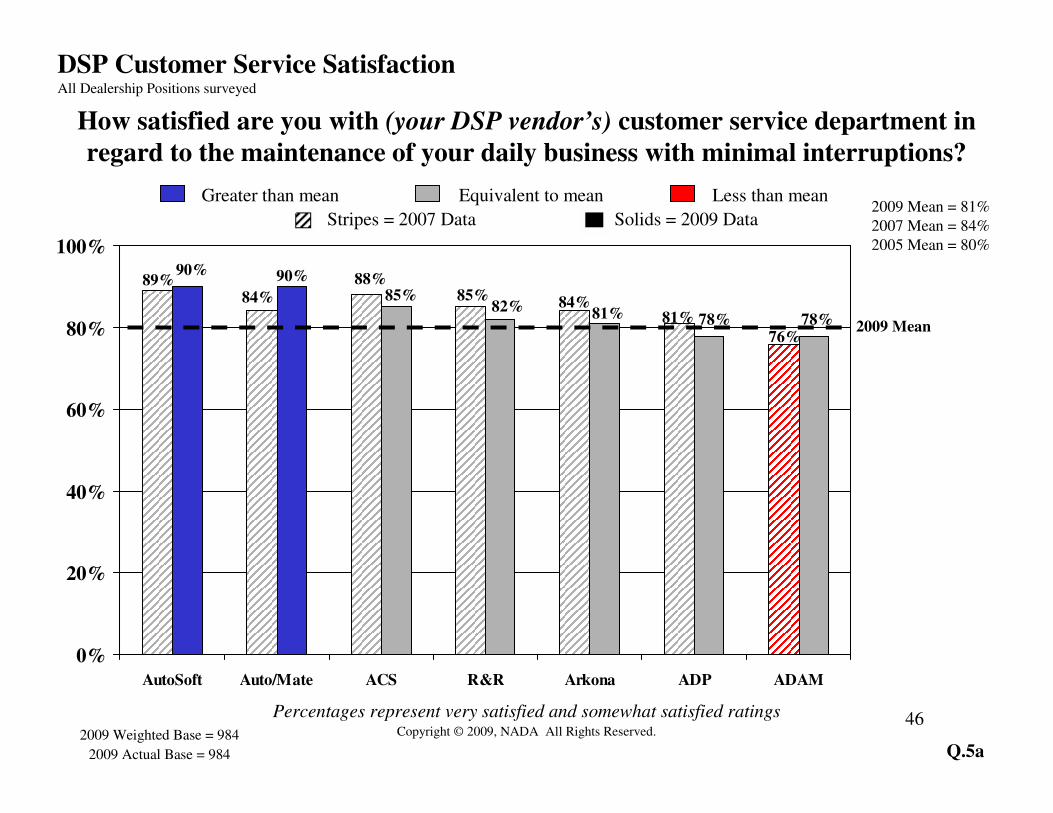
Percentages represent very satisfied and somewhat satisfied ratings
How satisfied are you with (your DSP vendor’s) customer service department in
regard to the maintenance of your daily business with minimal interruptions?
Q.5a
82%85%
94%
76%
87%
75%
81%82%82%
87%
0%
20%
40%
60%
80%
100%
Parts Mgr. OM/Controller Service Mgr. Sales Mgr. Dealer/GM
2009 Weighted Base = 984
2009 Actual Base = 984
DSP Customer Service SatisfactionAll Dealership Positions surveyed
2009 Mean
2009 Mean = 81%
2007 Mean = 84%
2005 Mean = 80%
Greater than mean Less than mean
Solids = 2009 DataStripes = 2007 Data
Equivalent to mean
Copyright © 2009, NADA All Rights Reserved. 46Percentages represent very satisfied and somewhat satisfied ratings
How satisfied are you with (your DSP vendor’s) customer service department in
regard to the maintenance of your daily business with minimal interruptions?
Q.5a
89%84%
88%85% 84%
81%
76%78%78%81%82%
85%
90%90%
0%
20%
40%
60%
80%
100%
AutoSoft Auto/Mate ACS R&R Arkona ADP ADAM
2009 Weighted Base = 984
2009 Actual Base = 984
DSP Customer Service Satisfaction All Dealership Positions surveyed
2009 Mean = 81%
2007 Mean = 84%
2005 Mean = 80%
2009 Mean
Greater than mean Less than mean
Solids = 2009 DataStripes = 2007 Data
Equivalent to mean

Copyright © 2009, NADA All Rights Reserved. 47
How satisfied are you with (your DSP vendor’s) customer service department in
regard to the availability of customer service representatives?
75%81%
72%
13%14%9% 9%
7%10%
0%
20%
40%
60%
80%
100%
2005 2007 2009
Very & Somewhat
Satisfied
Neither
Very & Somewhat
Dissatisfied
Q.5c2009 Weighted Base = 984
2009 Actual Base = 984
DSP Customer Service SatisfactionAll Dealership Positions surveyed

Copyright © 2009, NADA All Rights Reserved. 48
Percentages represent very satisfied and somewhat satisfied ratings
Q.5c
79%
86%90%
82%
72%
57%
77%77%81%84%
0%
20%
40%
60%
80%
100%
Service Mgr. Parts Mgr. OM/Controller Sales Mgr. Dealer/GM
2009 Weighted Base = 984
2009 Actual Base = 984
DSP Customer Service SatisfactionAll Dealership Positions surveyed
2009 Mean
2009 Mean = 75%
2007 Mean = 81%
2005 Mean = 72%
How satisfied are you with (your DSP vendor’s) customer service department in
regard to the availability of customer service representatives?
Greater than mean Less than mean
Solids = 2009 DataStripes = 2007 Data
Equivalent to mean

Copyright © 2009, NADA All Rights Reserved. 49
Percentages represent very satisfied and somewhat satisfied ratings
How satisfied are you with (your DSP vendor’s) customer service department in
regard to the availability of customer service representatives?
Q.5c
85%82%
90%87%
74%
80%
72%
86%
73%
84%
71%
76%81%81%
0%
20%
40%
60%
80%
100%
Auto/Mate ADAM ACS AutoSoft R&R Arkona ADP
2009 Weighted Base = 984
2009 Actual Base = 984
DSP Customer Service Satisfaction All Dealership Positions surveyed
2009 Mean = 75%
2007 Mean = 81%
2005 Mean = 72%
2009 Mean
Greater than mean Less than mean
Solids = 2009 DataStripes = 2007 Data
Equivalent to mean

Copyright © 2009, NADA All Rights Reserved. 50
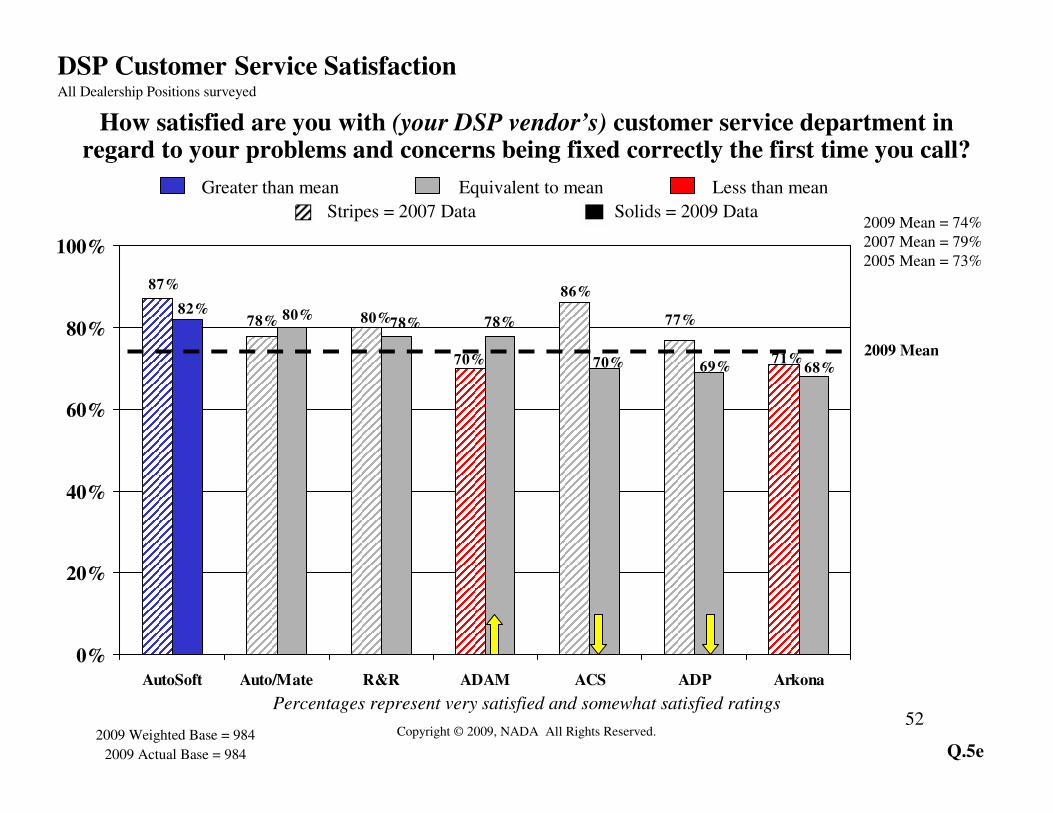
How satisfied are you with (your DSP vendor’s) customer service
department in regard to your problems and concerns being fixed
correctly the first time you call?
74%
79%
73%
12%14%
11% 11%7%9%
0%
20%
40%
60%
80%
100%
2005 2007 2009
Very & Somewhat
Satisfied
Neither
Very & Somewhat
Dissatisfied
Q.5e2009 Weighted Base = 984
2009 Actual Base = 984
DSP Customer Service SatisfactionAll Dealership Positions surveyed

Copyright © 2009, NADA All Rights Reserved. 51
Percentages represent very satisfied and somewhat satisfied ratings
How satisfied are you with (your DSP vendor’s) customer service department in regard to your problems and concerns being fixed correctly the first time you call?
Q.5e
92%
81%84%
70%
73%
64%
72%74%
77%84%
0%
20%
40%
60%
80%
100%
Parts Mgr. OM/Controller Service Mgr. Sales Mgr. Dealer/GM
2009 Weighted Base = 984
2009 Actual Base = 984
DSP Customer Service SatisfactionAll Dealership Positions surveyed
2009 Mean
2009 Mean = 74%
2007 Mean = 79%
2005 Mean = 73%
Greater than mean Less than mean
Solids = 2009 DataStripes = 2007 Data
Equivalent to mean
Copyright © 2009, NADA All Rights Reserved. 52
Percentages represent very satisfied and somewhat satisfied ratings
Q.5e
78% 77%
71%
86%
70%
80%78%
87%
68%69%70%
78%80%82%
0%
20%
40%
60%
80%
100%
AutoSoft Auto/Mate R&R ADAM ACS ADP Arkona
2009 Weighted Base = 984
2009 Actual Base = 984
DSP Customer Service Satisfaction All Dealership Positions surveyed
2009 Mean = 74%
2007 Mean = 79%
2005 Mean = 73%
2009 Mean
How satisfied are you with (your DSP vendor’s) customer service department in regard to your problems and concerns being fixed correctly the first time you call?
Greater than mean Less than mean
Solids = 2009 DataStripes = 2007 Data
Equivalent to mean
Copyright © 2009, NADA All Rights Reserved. 53
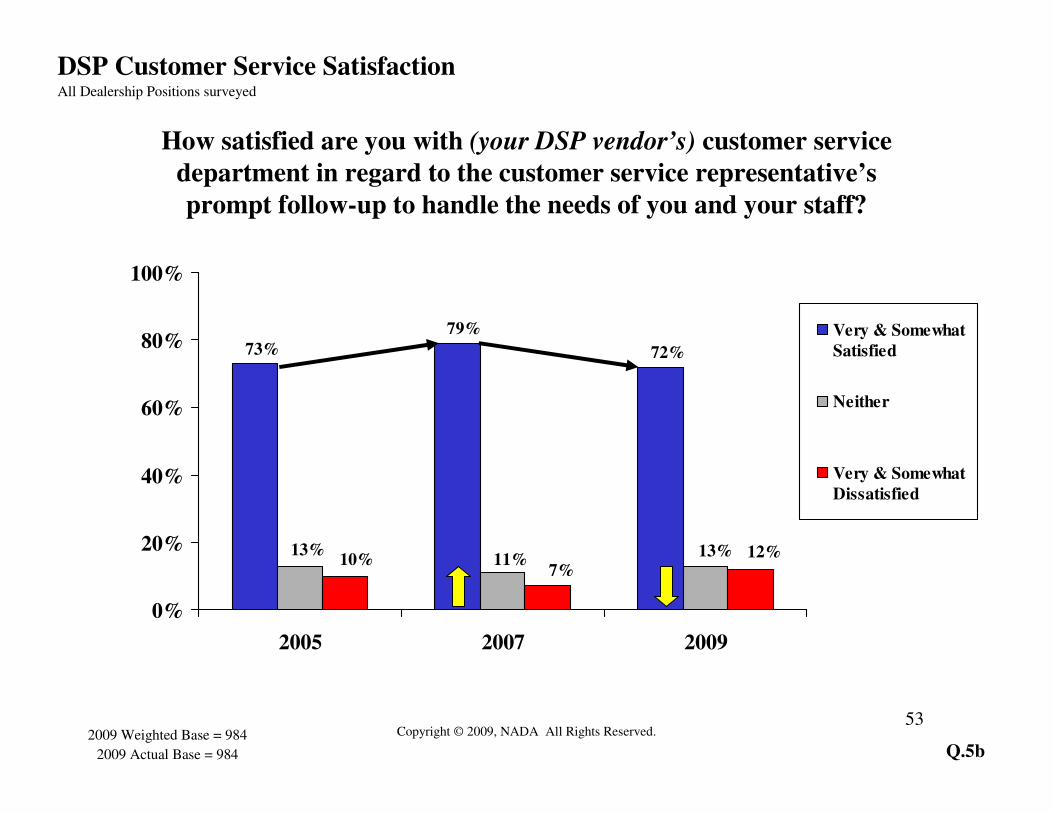
How satisfied are you with (your DSP vendor’s) customer service
department in regard to the customer service representative’s
prompt follow-up to handle the needs of you and your staff?
72%
79%
73%
13%13%11% 12%
7%10%
0%
20%
40%
60%
80%
100%
2005 2007 2009
Very & Somewhat
Satisfied
Neither
Very & Somewhat
Dissatisfied
Q.5b2009 Weighted Base = 984
2009 Actual Base = 984
DSP Customer Service SatisfactionAll Dealership Positions surveyed

Copyright © 2009, NADA All Rights Reserved. 54Percentages represent very satisfied and somewhat satisfied ratings
How satisfied are you with (your DSP vendor’s) customer service
department in regard to the customer service representative’s
prompt follow-up to handle the needs of you and your staff?
Q.5b
83% 84%
92%
67%
75%
57%
69%73%
80%84%
0%
20%
40%
60%
80%
100%
Service Mgr. Parts Mgr. OM/Controller Sales Mgr. Dealer/GM
2009 Weighted Base = 984
2009 Actual Base = 984
DSP Customer Service SatisfactionAll Dealership Positions surveyed
2009 Mean
2009 Mean = 72%
2007 Mean = 79%
2005 Mean = 73%
Greater than mean Less than mean
Solids = 2009 DataStripes = 2007 Data
Equivalent to mean

Copyright © 2009, NADA All Rights Reserved. 55Percentages represent very satisfied and somewhat satisfied ratings
How satisfied are you with (your DSP vendor’s) customer service
department in regard to the customer service representative’s
prompt follow-up to handle the needs of you and your staff?
Q.5b
79%83% 82%
78%
75%
80%82%
74%
87%83%
67%68%
74%76%
0%
20%
40%
60%
80%
100%
AutoSoft Auto/Mate ADAM ACS R&R ADP Arkona
2009 Weighted Base = 984
2009 Actual Base = 984
DSP Customer Service Satisfaction All Dealership Positions surveyed
2009 Mean = 72%
2007 Mean = 79%
2005 Mean = 73%
2009 Mean
Greater than mean Less than mean
Solids = 2009 DataStripes = 2007 Data
Equivalent to mean

IV. Third Party Vendors
3rd

Copyright © 2009, NADA All Rights Reserved. 57
Q.11
2009 Weighted Base = 984
2009 Actual Base = 984
Third Party VendorsAll Dealership Positions surveyed
57%
47%
18%23%
10%
17%
0%
20%
40%
60%
80%
100%
2007 2009
Very & Somewhat
Satisfied
Neither
Very & Somewhat
Dissatisfied
How satisfied are you with the ability of (your DSP vendor’s)
system to allow third party vendors to share information?

Copyright © 2009, NADA All Rights Reserved. 58
42%
48%46%
49%47%
59%
52%53%
62%59%
0%
20%
40%
60%
80%
100%
OM/Controller Service Mgr. Sales Mgr. Parts Mgr. Dealer/GM
Q.112009 Weighted Base = 984
2009 Actual Base = 984
Third Party Vendors All Dealership Positions surveyed
2009 Mean
Percentages represent very satisfied and somewhat satisfied ratings
How satisfied are you with the ability of (your DSP vendor’s)
system to allow third party vendors to share information?
2009 Mean = 57%
2007 Mean = 47%
Greater than mean Less than mean
Solids = 2009 DataStripes = 2007 Data
Equivalent to mean

Copyright © 2009, NADA All Rights Reserved. 59
47% 48%
39%
57%
67%
62%58%
41%
55%
52%
56%
53%
41%44%
0%
20%
40%
60%
80%
100%
Auto/Mate Arkona ADP R&R AutoSoft ACS ADAM
Q.112009 Weighted Base = 984
2009 Actual Base = 984
Third Party Vendors All Dealership Positions surveyed
Percentages represent very satisfied and somewhat satisfied ratings
2009 Mean
How satisfied are you with the ability of (your DSP vendor’s)
system to allow third party vendors to share information?
2009 Mean = 57%
2007 Mean = 47%
Greater than mean Less than mean
Solids = 2009 DataStripes = 2007 Data
Equivalent to mean

V. Vendor Training and
Education 4th
Copyright © 2009, NADA All Rights Reserved. 61
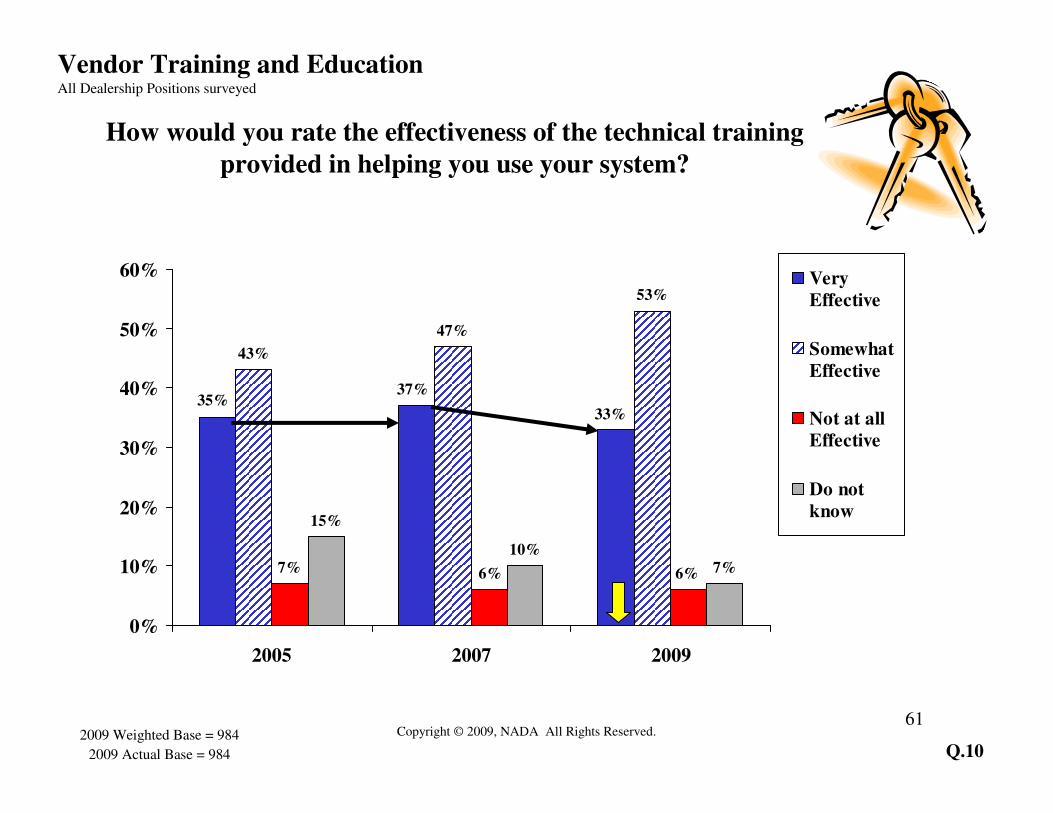
How would you rate the effectiveness of the technical training
provided in helping you use your system?
43%
47%
53%
15%
10%
7%
35%37%
33%
6%6%7%
0%
10%
20%
30%
40%
50%
60%
2005 2007 2009
Very
Effective
Somewhat
Effective
Not at all
Effective
Do not
know
Q.102009 Weighted Base = 984
2009 Actual Base = 984
Vendor Training and EducationAll Dealership Positions surveyed

Copyright © 2009, NADA All Rights Reserved. 62
How would you rate the effectiveness of the technical
training provided in helping you use your system?
Q.102009 Weighted Base = 984
2009 Actual Base = 984
Vendor Training and EducationAll Dealership Positions surveyed
Percentages represent very effective ratings
2009 Mean = 33%
2007 Mean = 37%
2005 Mean = 35%
47%
28%
36%36%
44%
24%
34%35%36%
39%
0%
20%
40%
60%
80%
100%
Parts Mgr. Sales Mgr. OM/Controller Service Mgr. Dealer/GM
2009 Mean
Greater than mean Less than mean
Solids = 2009 DataStripes = 2007 Data
Equivalent to mean

Copyright © 2009, NADA All Rights Reserved. 63
How would you rate the effectiveness of the technical
training provided in helping you use your system?
Q.102009 Weighted Base = 984
2009 Actual Base = 984
Vendor Training and EducationAll Dealership Positions surveyed
2009 Mean = 33%
2007 Mean = 37%
2005 Mean = 35%
Percentages represent very effective ratings
58%
46%
52%
35%
46%50%
35%
27%
36%
39%43%44%44%
54%
0%
20%
40%
60%
80%
100%
Auto/Mate AutoSoft ADAM ACS Arkona R&R ADP
2009 Mean
Greater than mean Less than mean
Solids = 2009 DataStripes = 2007 Data
Equivalent to mean

Copyright © 2009, NADA All Rights Reserved. 64
Q.9
2009 Weighted Base = 984
2009 Actual Base = 984
Vendor Training and Education All Dealership Positions surveyed
Considering all costs associated with training, i.e. travel, lost time on the
job, etc. vs. the benefits received, how cost effective would you say the
computer system training received from (your DSP vendor) is?
17%19%20%
28%30%30% 29%
33%
26%
9% 9% 7%
0%
10%
20%
30%
40%
50%
60%
2005 2007 2009
Very Cost
Effective
Cost
Effective
Somewhat
Cost
Effective
Not at all
Cost
Effective

Copyright © 2009, NADA All Rights Reserved. 65
Considering all costs associated with training, i.e. travel, lost time on
the job, etc. vs. the benefits received, how cost effective would you say
the computer system training received from (your DSP vendor) is?
15% 15%19%
38%
19% 17%
11%
16%22%
17%
0%
20%
40%
60%
80%
100%
OM/Controller Sales Mgr. Parts Mgr. Dealer/GM Service Mgr.
Q.92009 Weighted Base = 984
2009 Actual Base = 984
Vendor Training and EducationAll Dealership Positions surveyed
2009 Mean
2009 Mean = 17%
2007 Mean = 19%
2005 Mean = 20%
Percentages represent very cost effective ratings
Greater than mean Less than mean
Solids = 2009 DataStripes = 2007 Data
Equivalent to mean
Copyright © 2009, NADA All Rights Reserved. 66
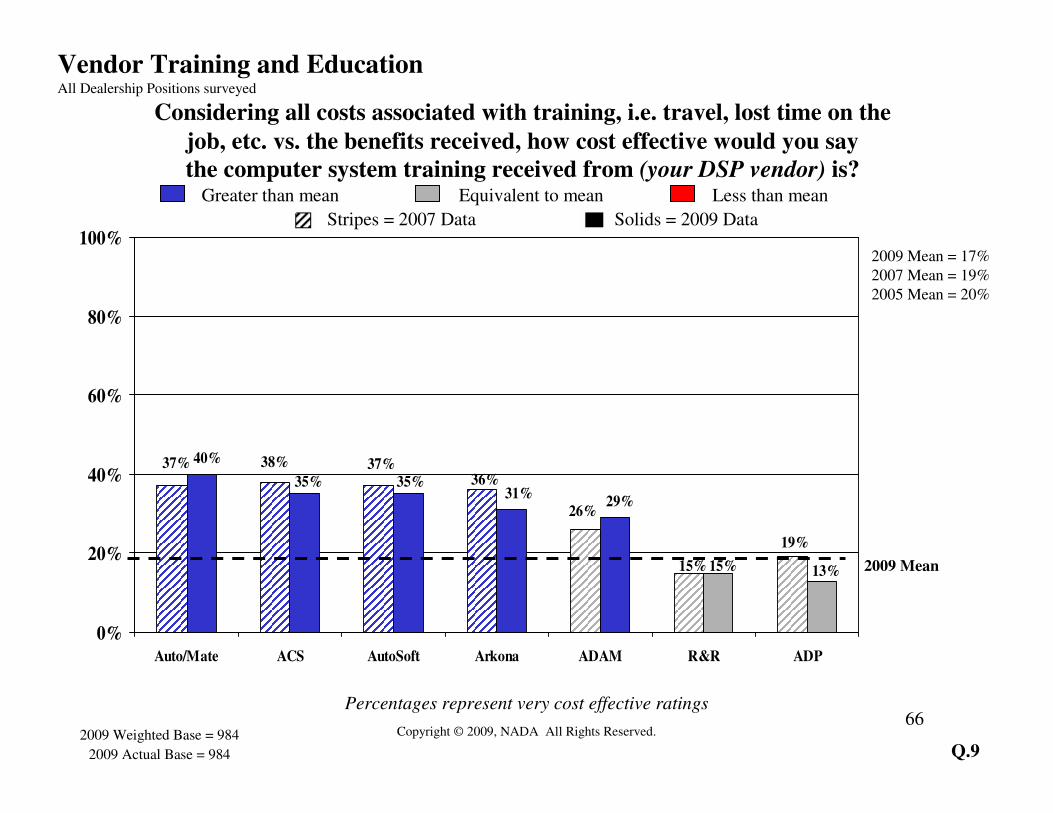
Percentages represent very cost effective ratings
Considering all costs associated with training, i.e. travel, lost time on the
job, etc. vs. the benefits received, how cost effective would you say
the computer system training received from (your DSP vendor) is?
Q.9
26%
19%
15%
36%37%38%37% 40%
35% 35%31%
29%
13%15%
0%
20%
40%
60%
80%
100%
Auto/Mate ACS AutoSoft Arkona ADAM R&R ADP
2009 Weighted Base = 984
2009 Actual Base = 984
Vendor Training and EducationAll Dealership Positions surveyed
2009 Mean = 17%
2007 Mean = 19%
2005 Mean = 20%
2009 Mean
Greater than mean Less than mean
Solids = 2009 DataStripes = 2007 Data
Equivalent to mean

Copyright © 2009, NADA All Rights Reserved. 67
What types of system training should (your DSP vendor) offer that would be most
convenient, as well as cost effective, for your dealership’s needs?
Q.8
61%
74%75%
82%
0%
20%
40%
60%
80%
100%
Web-based training
(self-study)
Web-based training
(interactive)
In-house training CD/DVD Tutorials
2009 Weighted Base = 984
2009 Actual Base = 984
Vendor Training and Education All Dealership Positions surveyed
2009 Respondents
Percentages represent yes responses