Embed Size (px)
Citation preview

NAEFS post-process
Yuejian Zhu and Bo Cui
Environmental Modeling Center
NOAA/NWS/NCEP

Index
• Current configurations
• Bias correction
• Statistical downscaling
• Evaluations
• Plan for inclusion of FNMOC ensemble
• Future plan (THORPEX proposal)
• References

NCEP CMC
Model GFS GEM
Initial uncertainty ETR EnKF
Model uncertainty/Stochastic Yes (Stochastic Pert) Yes (multi-physics)
Tropical storm Relocation None
Daily frequency 00,06,12 and 18UTC 00 and 12UTC
Resolution T190L28 (d0-d16)~70km (d0-d16) ~1.0degree
Control Yes Yes
Ensemble members 20 for each cycle 20 for each cycle
Forecast length 16 days (384 hours) 16 days (384 hours)
Post-process Bias correction
for ensemble mean
Bias correction
for each member
Last implementation February 23rd 2010 July 10th 2007
NAEFS Configuration
Updated: February 23rd 2010

Variables pgrba file Total 80 (28)
GHT Surface, 10, 50, 100, 200, 250, 500, 700, 850, 925, 1000hPa 11 (3)
TMP 2m, 2mMax, 2mMin, 10, 50, 100, 200, 250, 500, 700, 850, 925, 1000hPa 13 (3)
RH 2m, 10, 50, 100, 200, 250, 500, 700, 850, 925, 1000hPa 11 (3)
UGRD 10m, 10, 50, 100, 200, 250, 500, 700, 850, 925, 1000hPa 11 (3)
VGRD 10m, 10, 50, 100, 200, 250, 500, 700, 850, 925, 1000hPa 11 (3)
VVEL 850hPa 1 (1)
PRES Surface, PRMSL 2 (0)
PRCP (types) APCP, CRAIN, CSNOW, CFRZR, CICEP 5 (0)
FLUX (surface) LHTFL, SHTFL, DSWRF, DLWRF, USWRF, ULWRF 6 (6)
FLUX (top) ULWRF (OLR) 1 (1)
PWAT Total precipitable water at atmospheric column 1 (0)
TCDC Total cloud cover at atmospheric column 1 (0)
CAPE and CIN Convective available potential energy, Convective Inhibition 2 (1)
SOIL SOILW(0-10cm), WEASD(water equiv. of accum. snow depth),
SNOD(surface), TMP(0-10cm down)
4 (4)
Notes Surface GHT is only in analysis file and first pgrb file when the resolution changed.
25 of 28 new variables are from pgrbb files, 10, 50hPa RH and SNOD are new variables 28 new vars
NAEFS exchange parameters Last update: February 23rd 2010

Variables pgrba_bc file Total 49 (14)
GHT 10, 50, 100, 200, 250, 500, 700, 850, 925, 1000hPa 10 (3)
TMP 2m, 2mMax, 2mMin, 10, 50, 100, 200, 250, 500, 700, 850, 925,
1000hPa
13 (3)
UGRD 10m, 10, 50, 100, 200, 250, 500, 700, 850, 925, 1000hPa 11 (3)
VGRD 10m, 10, 50, 100, 200, 250, 500, 700, 850, 925, 1000hPa 11 (3)
VVEL 850hPa 1(1)
PRES Surface, PRMSL 2(0)
FLUX (top) ULWRF (toa - OLR) 1 (1)
14 new vars
Notes
NAEFS bias corrected parameters Last update: February 23rd 2010

Variables Domains Resolutions Total 4/8
Surface Pressure CONUS/Alaska 5km/6km 1/1
2-m temperature CONUS/Alaska 5km/6km 1/1
10-m U component CONUS/Alaska 5km/6km 1/1
10-m V component CONUS/Alaska 5km/6km 1/1
2-m maximum T Alaska 6km 0/1
2-m minimum T Alaska 6km 0/1
10-m wind speed Alaska 6km 0/1
10-m wind direction Alaska 6km 0/1
Note: Alaska products
is in real time parallel
Expect implementation:
Q4 FY2010
NAEFS downscaling parameters Last update: May 1st 2010
(NDGD resolutions)

NAEFS bias correction

NAEFS – bias correction Bias corrected NCEP/GEFS forecast
• Consider the same bias for all ensemble members
• Weight = 0.02 for Kaman filter (decaying) algorithm
Bias corrected NCEP/GFS forecast • Use the same algorithm as ensemble bias correction
• Up to 180 hours
Bias corrected CMC/GEFS forecast • Consider the different bias for each model (member)
• Use the same algorithm as ensemble bias correction
Combine bias corrected GFS and ensemble forecast • Dual resolution ensemble approach for short lead time
• GFS has higher weights at short lead time
NAEFS products based on bias correction • Combine NCEP/GEFS (20m) and CMC/GEFS (20m)
• Produce Ensemble mean, spread, mode, 10% 50%(median) and 90% probability forecast at 1*1 degree resolution • Climate anomaly (percentile) forecasts also generated for ensemble
mean

decaying averaging mean error = (1-w) * prior a.m.e + w * (f – a)
Bias Correction Method & Application
6.6%
3.3%
1.6%
For separated cycles, each lead time and individual grid point, a.m.e = averaging mean error
• Test different decaying weights.
0.25%, 0.5%, 1%, 2%, 5% and 10%, respectively • Decide to use 2% (~ 50 days) decaying accumulation bias estimation
Toth, Z., and Y. Zhu, 2001
Bias Correction Techniques – array of methods
Estimate/correct bias moment by moment
• Simple approach, implemented partially
• May be less applicable for extreme cases
Moment-based method at NCEP: apply adaptive (Kalman Filter type) algorithm

GFS/GEFS bias
correction based on an
accumulated bias by
using decaying average
weight (0.02) which is the
same as GEFS used
The absolute errors are
reduced after bias
correction for 2-meter
temperature
(The stats are accumulated
from 0.02 decaying
average)

Combined GFS and GEFS forecasts at first 180hr
GFS has more skill than ensemble
control for short lead time
Combined GFS and GEFS
Forecast has more skill (red)
than GEFS only (black)
Jun Du first introduced dual-resolution
to SREF, by using constant weight

RPSS Before/After Bias Correction (NCEP 500 mb Height)
Northern Hemisphere Southern Hemisphere
Tropics
1-6 day gain in skill due
to bias correction
RMS reduced for first week

NH500hPa NH1000hPa
NHT2M
All these stats show the best
values from probabilistic
distribution of joined ensemble
(NAEFS) for upper atmosphere
and near surface.
Green line is from NAEFS.


2-meter temperature 10/90 probability forecast verification
Northern Hemisphere, period of Dec. 2007 – Feb. 2008
0
10
20
30
40
50
60
70
80
90
100
24 48 72 96 120 144 168 192 216 240 264 288 312 336 360 384
Lead time (hours)
Pro
ba
bil
itie
s (p
ercen
t)
P10-expect P10-ncepraw P10-naefs
P90-expect P90-ncepraw P90-naefs
~40%
~80%

2-meter temperature 10/90 probability forecast verification
Northern Hemisphere, seasonal variation for NAEFS
0
10
20
30
40
50
60
70
80
90
100
24 48 72 96 120 144 168 192 216 240 264 288 312 336 360 384
Lead time (hours)
Prob
ab
ilit
ies
(percen
t)
P10 P10-dec P10-feb P90 P90-dec P90-feb
NAEFS final 10% and 90% probability forecast for Dec. 2007 and Feb 2008

NAEFS statistical downscaling
CONUS

NAEFS - Statistical downscaling
• Proxy for truth – RTMA at 5km resolution
– Variables (surface pressure, 2-m temperature, and 10-meter wind)
• Downscaling vector – Interpolate GDAS analysis to 5km resolution
– Compare difference between interpolated GDAS and RTMA
– Apply decaying weight to accumulate this difference – downscaling vector
• Downscaled forecast – Interpolate bias corrected 1*1 degree NAEFS to 5km resolution
– Add the downscaling vector to interpolated NAEFS forecast
• NAEFS products – CONUS – NDGD grid/resolution (5km)
• 4 variables (parameters)
• Ensemble spread, mean, mode, 10%, 50%(median) and 90% forecasts
– Alaska – NDGD grid/resolution (6km) • 8 variables (parameters)
• Ensemble spread, mean, mode, 10%, 50%(median) and 90% forecasts

Downscaling Method with Decaying Averaging Algorithm
Downscaling Vector5km (t0) = (1-w) * prior DV5km (t-1) + w * (GDAS5km(t 0) – RTMA5km(t0))
GDAS5km: GDAS 1x1 analysis interpolated to RTMA5km grids by bilinear interpolation
4 cycles, individual grid point, DV5km = Downscaling Vector on 5km grids
choose different weight: 0.5%, 1%, 2%, 5%, 10%
Downscaling Process
Downscaled Forecast5km(t) = Bias-corrected Forecast5km(t)– DV5km (t0)
True = high resolution analysis • Operational North American Real-Time Mesoscale Analysis (RTMA)
• 5x5 km National Digital Forecast Database (NDFD) grid (e.g. G. DiMego et al.)
• 4 variables available: surface pressure, T2m, 10m U and V
• Other data can also be used
Downscaling method: apply decaying averaging algorithm
Bias-corrected Forecast5km: interpolated to RTMA5km grids by bilinear interpolation
subtract DV5km from bias-corrected forecast5km valid at analysis time

00hr GEFS Ensemble Mean & Bias Before/After Downscaling 10%
2m Temperature 10m U Wind
Before
After
Before
After

T2M for CONUS
U10m for CONUS
Continuous Ranked Probability
Scores (CRPS) is to measure the
distance of truth from ensemble’s
distribution. These two stats show
which decaying weight is best to
CONUS region statistical down-
scaling

Statistical Downscaling Verification - Contribute by MDL
• 2-meter temperature only
• Period: July 20 – August 28 2007 (40 days)
• All verifications against RTMA
• NDFD: Official forecasts from previous day 12UTC
• GMOS: Gridded MOS forecasts from 00UTC
• GEFS: Bias corrected & downscaled 00UTC GEFS forecasts – Bias corrected NCEP GEFS ensemble mean only
• Significant improvements not assess yet from
– Dual resolution GEFS
– NAEFS combination (GEFS + CMC)
– Tuned downscaling method (0.3 coefficient instead of 0.1)

24-h GMOS
Forecast
12-h NDFD
Forecast
For CONUS:
GEFS(3.07) : NDFD(3.60)
17% impr. Over NDFD
GEFS(3.07) : GMOS(3.37)
10% impr. Over GMOS
24-h GEFS
Forecast

0
1
2
3
4
5
6
24 48 72 96 120 144 168
forecast hours
2-m temp. forecast errors
NDFD GMOS GEFS
40 day average absolute errors of 2-meter temperature (NDFD has 12hr advantage)
COUNS only – verified against RTMA

12hr 2m T forecast
Mean Absolute Error
w.r.t RTMA for CONUS
Average for September
GEFS raw forecast
NAEFS forecast
GEFS bias-corr. & down scaling fcst.

NCEP/GEFS raw forecast
NAEFS final products
4+ days gain from NAEFS
From Bias correction (NCEP, CMC)
Dual-resolution (NCEP only)
Down-scaling (NCEP, CMC)
Combination of NCEP and CMC

From Bias correction (NCEP, CMC)
Dual-resolution (NCEP only)
Down-scaling (NCEP, CMC)
Combination of NCEP and CMC
NAEFS final products
NCEP/GEFS raw forecast
8+ days gain

Overall temperature forecasts: Average over past 30 days: (20080929-20081028) MAE Bias >10 err <3 err off. rank Best G. 2nd G. Worst G.
1 12-hr 2.44 0.7 0.1% 67.3% 1 out of 7 NAM40 65.4% NAM12 60.1% NGM80 44.4%
2 24-hr 2.84 1.0 0.3% 59.1% 2 out of 7 NAM40 60.3% NAM12 56.9% SREF 47.0%
3 36-hr 2.94 0.8 0.3% 57.8% 1 out of 7 NAM40 55.9% NAM12 52.6% NGM80 44.0%
4 48-hr 3.36 1.6 2.1% 52.8% 1 out of 7 MOSGd 48.9% NAM40 48.3% NGM80 12.9%
5 60-hr 3.26 1.0 1.7% 54.8% 1 out of 6 MOSGd 50.1% NAM12 48.8% NAM40 6.2%
6 72-hr 3.35 1.3 2.1% 53.1% 1 out of 5 MOSGd 49.9% NAM12 49.5% SREF 44.0%
7 84-hr 3.80 0.6 4.7% 49.0% 1 out of 5 NAEFS 48.6% SREF 44.5% NAM12 2.6%
8 96-hr 3.96 0.7 4.0% 44.4% 2 out of 4 NAEFS 46.2% HPCGd 42.6% MOSGd 40.6%
9 108-hr 4.43 0.9 5.5% 38.5% 2 out of 3 NAEFS 41.7% MOSGd 37.7% MOSGd 37.7%
10 120-hr 4.57 1.0 5.9% 36.6% 2 out of 4 NAEFS 40.9% HPCGd 36.5% MOSGd 36.3%
11 132-hr 4.83 0.7 7.8% 34.7% 1 out of 3 NAEFS 34.5% MOSGd 34.4% MOSGd 34.4%
12 144-hr 4.83 0.5 7.4% 34.7% 3 out of 4 HPCGd 36.4% NAEFS 35.5% MOSGd 33.3%
13 156-hr 5.43 0.1 11.9% 30.3% 3 out of 3 NAEFS 32.1% MOSGd 30.8% MOSGd 30.8%
14 168-hr 5.74 0.3 14.4% 27.7% 2 out of 4 HPCGd 27.7% MOSGd 26.9% NAEFS 26.1
Minimum temperature forecast: Average over past 30 days: (20080929-20081028) 1 12-hr 3.17 -1.2 1.0% 53.4% 3 out of 7 NAEFS 59.7% SREF 57.1% NGM80 21.8%
2 24-hr 3.03 -0.9 0.6% 55.5% 2 out of 7 SREF 57.2% NAEFS 54.2% NGM80 24.9%
3 36-hr 3.25 -0.8 0.9% 51.6% 3 out of 7 NAEFS 54.2% SREF 53.9% NGM80 23.2%
4 48-hr 3.94 -1.1 2.9% 43.2% 3 out of 7 NAEFS 51.9% SREF 45.8% NGM80 6.2%
5 60-hr 4.30 -0.4 4.4% 39.1% 4 out of 6 NAEFS 49.2% SREF 43.0% NAM40 8.9%
6 72-hr 4.76 0.1 6.4% 33.7% 5 out of 5 NAEFS 42.9% SREF 40.1% NAM12 35.2%
7 84-hr 4.85 0.3 7.5% 34.7% 2 out of 6 NAEFS 40.0% MOSGd 33.4% NAM12 8.9%
8 96-hr 5.24 0.4 13.0% 33.1% 1 out of 3 NAEFS 32.7% MOSGd 29.9% MOSGd 29.9%
9 108-hr 5.11 0.8 12.8% 35.4% 1 out of 4 HPCGd 34.5% NAEFS 32.1% MOSGd 30.5%
10 120-hr 5.31 0.7 12.0% 31.9% 1 out of 3 MOSGd 31.6% NAEFS 24.8% NAEFS 24.8%
11 132-hr 4.97 0.7 9.9% 35.1% 2 out of 4 HPCGd 38.0% MOSGd 30.9% NAEFS 27.2%
12 144-hr 5.42 0.6 15.0% 35.0% 1 out of 3 MOSGd 31.3% NAEFS 29.0% NAEFS 29.0%
13 156-hr 5.40 0.5 14.9% 35.7% 1 out of 4 HPCGd 32.9% MOSGd 32.7% NAEFS 23.4%
14 168-hr 5.46 1.1 17.7% 38.1% 1 out of 3 MOSGd 35.6% NAEFS 28.4% NAEFS 28.4%
Official Guidance: NGM80, NAM40, SREF, NAM12, MOSGd, HPCGd, NAEFS
Contributed by Richard Grumm (WFO)

NAEFS statistical downscaling
Alaska

Statistical Down-Scaling for Alaska Downscaling NAEFS products has been implemented in NCEP by
• December 4th 2007 1200UTC
• CONUS, 4 variables ( surface pressure, 2m temperature and 10m u and v)
Apply statistical downscaling method to Alaska region
• Add new variables, wind speed/direction, maximum/minimum temperature
Statistical Down-Scaling Techniques for Alaska • Variable: surface pressure, 2-m temperature, 10-meter wind component
• work well using current operational technique for CONUS
• Variable: Tmax and Tmin
• Choose proper period definition in code/scripts
• Modification for definition changed July, 2009
• Variable: wind speed and direction
• Problem exist in utility “copygb” for wind direction
• Solution to avoid interpolation of wind speed
• Not bad, difficult for wind direction improvement
• Variable: 2m dew point temp and 2m relative humility
• How to improve methods, future inclusion
Alaska Verification • Next images show some verification for Tmax, Tmin, wind direction/speed
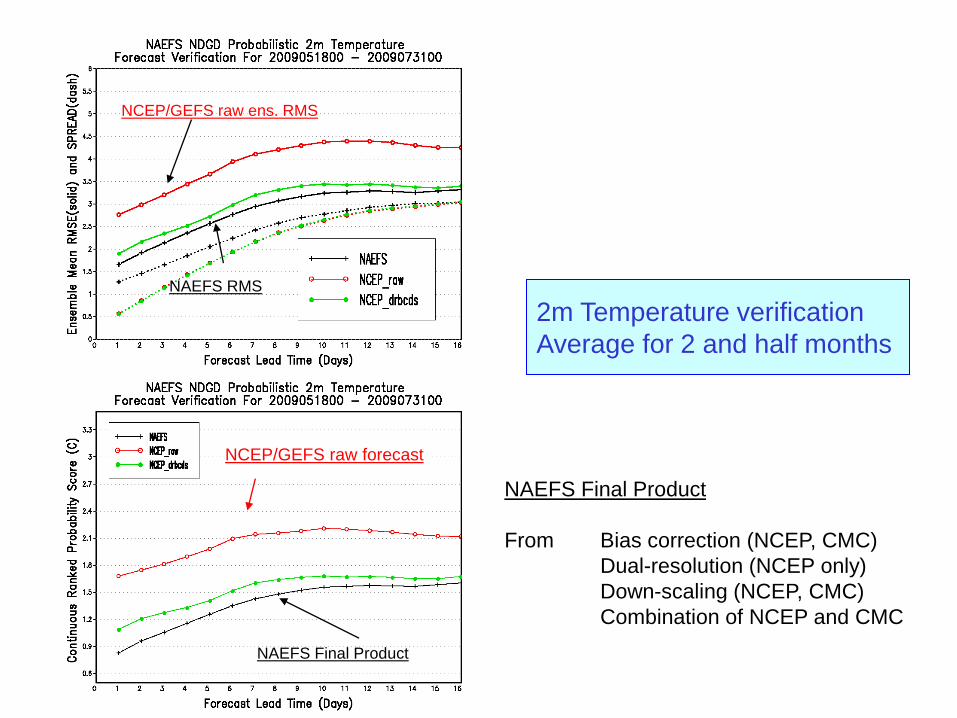
NCEP/GEFS raw forecast
NAEFS Final Product
NCEP/GEFS raw ens. RMS
NAEFS Final Product
From Bias correction (NCEP, CMC)
Dual-resolution (NCEP only)
Down-scaling (NCEP, CMC)
Combination of NCEP and CMC
2m Temperature verification
Average for 2 and half months
NAEFS RMS

Process to Downscale Tmax & Tmin for Alaska
Based on 1°×1° 6-hr bias corrected Tmax/Tmin and down-scaling vectors (DV)
for T2m at each 6-hr cycle
• Definition of Tmax/Tmin for Alaska region
Tmax period: 13UTC (5am-local) – 04UTC ( 8pm-local) – local daylight time
Tmin period: 01UTC (5pm-local) – 19UTC (11am-local) – local daylight time
• Definition of approximated period for Tmax/Tmin for giving initial cycle
• Mean DV of T2m for 6-hr period: weighted average of two instantaneous DVs
• Interpolating bias corr. 6-hr Tmax/Tmin (1°×1°) to 6km NDGD grid for
Alaska
Downscaling detailed process • Apply mean DV to each grid point, each ens. member, and each 6-hr lead-time period,
to produce down-scaled Tmax and Tmin for each 6-hr lead-time period
• Find out highest Tmax and lowest Tmin for approximated period
• For different grid points, different ens. members, highest Tmax could be in different 6-
hr period, the same for lowest Tmin
• Only one down-scaled Tmax and Tmin for every 24-hr. fcst, up to 384 hours
Calculate the Tmax/Tmin statistical outputs: mean, spread, mode, 10%, 50% and
90% based on above step
EFFECTIVE 1200UTC JULY 28 2009, DEFINITIONS OF MAX T AND MIN T FOR ALASKA REGION
CHANGE FROM: MAX T 7:00 AM - 7:00 PM LST, MIN T 7:00 PM - 8:00 AM LST
TO: MAX T 5:00 AM - 8:00 PM LST, MIN T 5:00 PM - 11:00 AM LST

Initial
00UTC
12UTC 06UTC 00UTC 18UTC 12UTC 06UTC 00UTC 18UTC 00UTC
Alaska Daylight Time : Tmax period: 13UTC (5am-local) – 04UTC ( 8pm-local) – local daylight time
Tmin period: 01UTC (5pm-local) –19UTC (11am-local) – local daylight time
00UTC temperature forecast at valid time
Tmax Tmax
Tmin Tmin
OUTPUT: Tmax: f18(no), f24(no), f30(no), f36(yes:12-36hrs), f42(no),f48(no), f54(no), f60(yes:36-60hrs), ……
(00UTC) Tmin: f06(no), f12(no), f18(no), f24(yes:0-24hrs), f30(no), f36(no), f42(no), f48(yes:24-48hrs), ……
Initial
06UTC
06UTC 00UTC 18UTC 12UTC 06UTC 00UTC 18UTC 12UTC 06UTC
06UTC temperature forecast at valid time
Tmax Tmax
Tmin Tmin
OUTPUT: Tmax: f12(no), f18(no), f24(no), f30(yes:06-30hrs), f36(no), f42(no), f48(no), f54(yes:30-54hrs), ……
(06UTC) Tmin: f24(no), f30(no), f36(no), f42(yes:18-42hrs), f48(no), f54(no), f60(no), f66(yes:42-66hrs), ……
Tmax and Tmin calculations for Alaska region ( 2009 )
Alaska Standard Time : Tmax period: 14UTC (5am-local) – 05UTC (8pm-local)
Tmin period: 02UTC (5pm-local) – 20UTC (11am-local)

NCEP Raw Ens. Tmax MAE
NCEP Raw Ens. Tmax Bias
NAEFS Tmax MAE
NAEFS Tmax Bias
NCEP Raw Ens. Tmin MAE
NAEFS Tmin MAE
NAEFS Tmin Bias
NCEP Raw Ens. Tmin Bias

NCEP/GEFS Raw Tmax CRPS
NAEFS Tmax CRPS
NCEP/GEFS Raw Tmin CRPS
NAEFS Tmin CRPS
NCEP Raw Tmax RMS
NAEFS Tmax RMS
NAEFS Tmin RMS
NCEP Raw Tmin RMS

Process to Statistically Downscale Wind Speed and Direction
Wind speed & direction calculation based on downscaled u10m & v10m
Downscaling process
No action for data on 1°, whole process based and completed on 6km grid u10m & v10m
Downscaling process
• Apply “copygb” utility to interpolate u10m & v10m for NCEP/CMC each ens. member
• Apply DV to produce down-scaled u10m & v10m for each member and compute its
wind speed & direction
• Combine NCEP/CMC 10m wind speed & direction to generate the mean, spread,
mode, 10%, 50% and 90% forecasts
No change for wind speed & direction calculation, no change for probabilistic wind
direction calculation

Divide (0,360) into 6 units, choose the closed 2 units where Wdir data (equal weight currently,
different weight by wind speed as a option ?) fall most
Rearrange the data to allow 2 units in the middle of the distribution
Set a 60 degree window, move the window through the 2 units, mode is the center of the
window with the most members
Calculate the average wind direction using 6 units data
Calculate probability 10%, 50% and 90%, mode and spread by using full data
Adjust wind direction phase in [0,360]
Probabilistic Wind Direction Calculation

10m U Bias 10m V Bias
10m Wind Direction Bias 10m Wind Speed Bias

NAEFS inclusion of FNMOC ensembles

Example of score cards for ensembles evaluation

Value-added by including FNMOC ensemble into NAEFS
T2m: Against analysis (NCEP’s evaluation, 1 of 4)
Raw NCEP
Raw NCEP ensemble has modest skill (3.4d)
0.5 CRPS skill

Raw NCEP
Stat. corr.
Raw NCEP ensemble has modest skill (3.4d)
Statistically corrected NCEP ensemble has improved skill (4.8d)
0.5 CRPS skill
Value-added by including FNMOC ensemble into NAEFS
T2m: Against analysis (NCEP’s evaluation, 2 of 4)

Raw NCEP
Stat. corr.
NAEFS
Combined NCEP – CMC (NAEFS) show further increase in skill (6.2d)
Raw NCEP ensemble has modest skill (3.4d)
Statistically corrected NCEP ensemble has improved skill (4.8d)
0.5 CRPS skill
Value-added by including FNMOC ensemble into NAEFS
T2m: Against analysis (NCEP’s evaluation, 3 of 4)
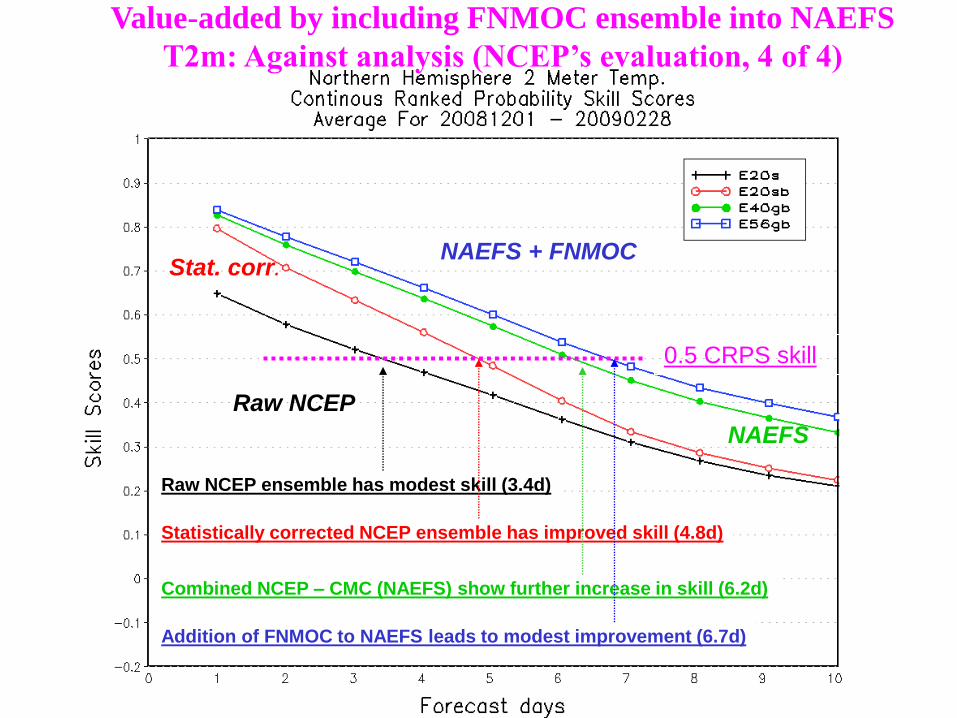
Raw NCEP
NAEFS + FNMOC Stat. corr.
NAEFS
Combined NCEP – CMC (NAEFS) show further increase in skill (6.2d)
Addition of FNMOC to NAEFS leads to modest improvement (6.7d)
Raw NCEP ensemble has modest skill (3.4d)
Statistically corrected NCEP ensemble has improved skill (4.8d)
0.5 CRPS skill
Value-added by including FNMOC ensemble into NAEFS
T2m: Against analysis (NCEP’s evaluation, 4 of 4)

NOAA THORPEX Proposal Report:
Extensions and Improvements to the NAEFS
Post-Processor at NCEP/EMC
Bo Cui1, Huiling Yuan2, Yuejian Zhu3, Paul Schultz2, Zoltan Toth2
1SAIC at Environmental Modeling Center, NCEP/NWS
2Earth System Research Laboratory, NOAA 3Environmental Modeling Center, NCEP/NWS
Acknowledgements
Jun Du, Malaquias Peña, Dingchen Hou EMC/NCEP/NWS/NOAA
Roman Krzysztofowicz University of Virginia
Richard Verret, Poulin Lewis CMC/MSC
David Michaud, Brent Gorden, Luke Lin NCO/NCEP/NWS/NOAA
Valery J. Dagostaro MDL/NWS/NOAA
May 6th 2010, NOAA THORPEX Principal Investigators Meeting

Bias corrected NCEP/CMC GEFS and GFS forecast (up to 180 hrs), same bias correction
algorithm
• Combine bias corrected GFS and NCEP GEFS ensemble forecasts
• Dual resolution ensemble approach for short lead time
• GFS has higher weights at short lead time
NAEFS products
• Combine NCEP/GEFS (20m) and CMC/GEFS (20m), FNMOC ens. will be in soon
• Produce Ensemble mean, spread, mode, 10% 50%(median) and 90% probability forecast at
1*1 degree resolution
• Climate anomaly (percentile) forecasts also generated for ens. mean
Statistical downscaling
• Use RTMA as reference - NDGD resolution (5km), CONUS only
• Generate mean, mode, 10%, 50%(median) and 90% probability forecasts
Current NCEP/EMC Statistical Post-Processing System

Development of Statistical Post-Processing for NAEFS
• Opportunities for improving the post-processor
– Utilization of additional input information
• More ensemble, high resolution control forecasts (hybrid?)
• Using reforecast information to improve week-2 forecast and precipitation
• Analysis field (such as RTMA and etc..)
– Improving calibration technique
• Calibration of higher moments (especially spread)
• Use of objective weighting in input fields combination
• Processing of additional variables with non-Gaussian distribution
– Improve downscaling methods
Future Configuration of EMC Ensemble Post-Processor

References:
• December 14 2007 implementation: http://www.emc.ncep.noaa.gov/gmb/yzhu/html/imp/200711_imp.html
• February 23 2010 implementation: http://www.emc.ncep.noaa.gov/gmb/yzhu/html/imp/201002_imp.html
• Q4 FY10 implementation: http://www.emc.ncep.noaa.gov/gmb/yzhu/html/imp/201004_imp.html
• Cui and et al. 2006: http://www.emc.ncep.noaa.gov/gmb/ens/papers/manuscript_thorpex_bocui.pdf
• Cui and et al. 2010 (draft for bias correction):
• Cui and et al. 2010 (draft for downscaling):

Background !!!

NAEFS Products - Summary Bias corrected GFS forecast
• Directory:/com/gens/para/gefs.yyyymmdd/cyc/pgrba_bc • Files: gegfs* (up to 180 hours)
NAEFS new products: (early run: NCEP/GEFS only) • Probabilistic forecasts at 1*1 degree resolution (global)
• Directory:/com/gens/para/gefs.yyyymmdd/cyc/pgrba_ bc
• Files: geavg*, gespr*,gemode*,ge10p*,ge50p*,ge90p* represent ensemble mean, spread, mode, 10%, 50% (median) and 90% probability forecast
• Anomaly forecast for ensemble mean at 1*1 degree resolution (global) • Directory:/com/gens/para/gefs.yyyymmdd/cyc/pgrba_an
• Files: geavg*
• At 5km resolution (down-scaling for CONUS only) • Directory:/com/gens/para/gefs.yyyymmdd/cyc/ndgd
• Files: geavg*,gemode*,ge10p*,ge50p* and ge90p*
NAEFS new products: (later run: combine NCEP and CMC’s ensemble) • Probabilistic forecast at 1*1 degree resolution (global)
• Directory:/com/gens/para/naefs.yyyymmdd/cyc/pgrba_bc
• Files: geavg*,gespr*,gemode*,ge10p*,ge50p* and ge90p*
• Anomaly forecast for ensemble mean at 1*1 degree resolution (global) • Directory:/com/gens/para/naefs.yyyymmdd/cyc/pgrba_an
• Files: geavg*
• At 5km resolution (down-scaling for CONUS only) • Directory:/com/gens/para/naefs.yyyymmdd/cyc/ndgd
• Files: geavg*,gemode*,ge10p*,ge50p* and ge90p*
• File: dvrtma.t00z.ndgd_conus (down-scaling vector)