Embed Size (px)
Citation preview
Equity-Based Insurance Guarantees Conference
Nov. 6-7, 2017
Baltimore, MD
NAIC VA Reserve and Capital Reform: Perspectives “at the Final Turn”
Aaron Sarfatti
Sponsored by
© Oliver Wyman
NAIC VA RESERVE AND CAPITAL REFORM PERSPECTIVES “AT THE FINAL TURN”
EBIG CONFERENCE (BALTIMORE) NOVEMBER 7, 2017 (0915 – 1000 HOURS)
Aaron Sarfatti, Partner [email protected]

CONFIDENTIALITY Our clients’ industries are extremely competitive, and the maintenance of confidentiality with respect to our clients’ plans and data is critical. Oliver Wyman rigorously applies internal confidentiality practices to protect the confidentiality of all client information.
Similarly, our industry is very competitive. We view our approaches and insights as proprietary and therefore look to our clients to protect our interests in our proposals, presentations, methodologies and analytical techniques. Under no circumstances should this material be shared with any third party without the prior written consent of Oliver Wyman.
© Oliver Wyman
2 © Oliver Wyman
• Provide background of the NAIC VA reserve and capital reform initiative
• Recap proposed revisions to AG43 and C3P2
• Selectively detail most salient (and controversial) topics for revision
Agenda
3 © Oliver Wyman
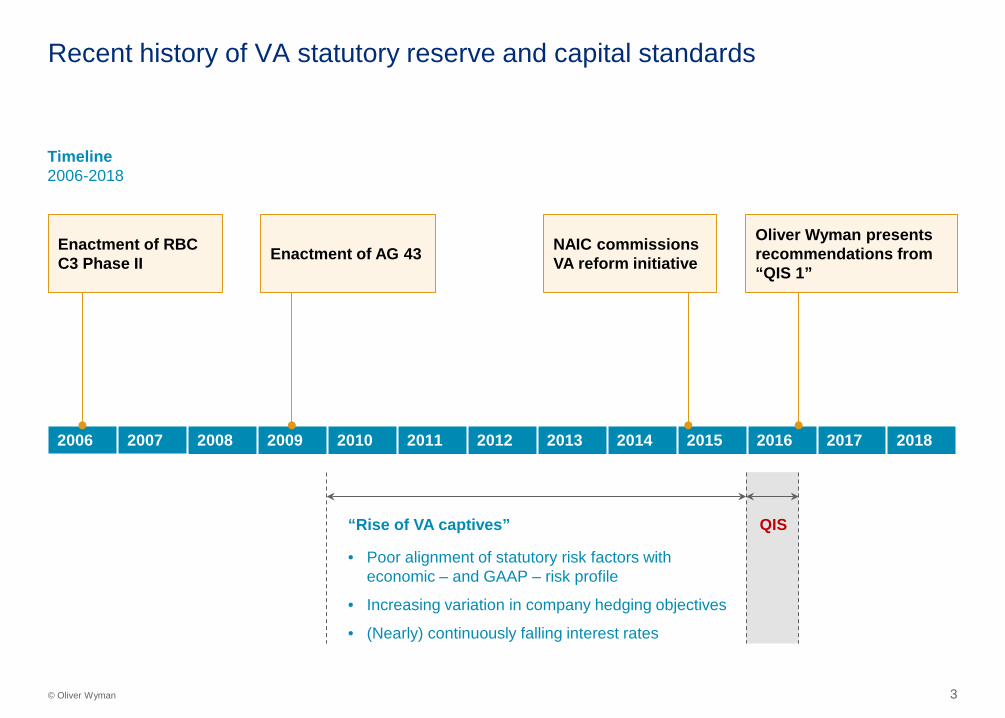
2006 2007 2008 2009 2010 2011 2012 2013 2014 2015 2016 2017 2018
Recent history of VA statutory reserve and capital standards
Enactment of RBC C3 Phase II
“Rise of VA captives”
• Poor alignment of statutory risk factors with economic – and GAAP – risk profile
• Increasing variation in company hedging objectives
• (Nearly) continuously falling interest rates
Timeline 2006-2018
Enactment of AG 43 NAIC commissions VA reform initiative
Oliver Wyman presents recommendations from “QIS 1”
QIS
4 © Oliver Wyman
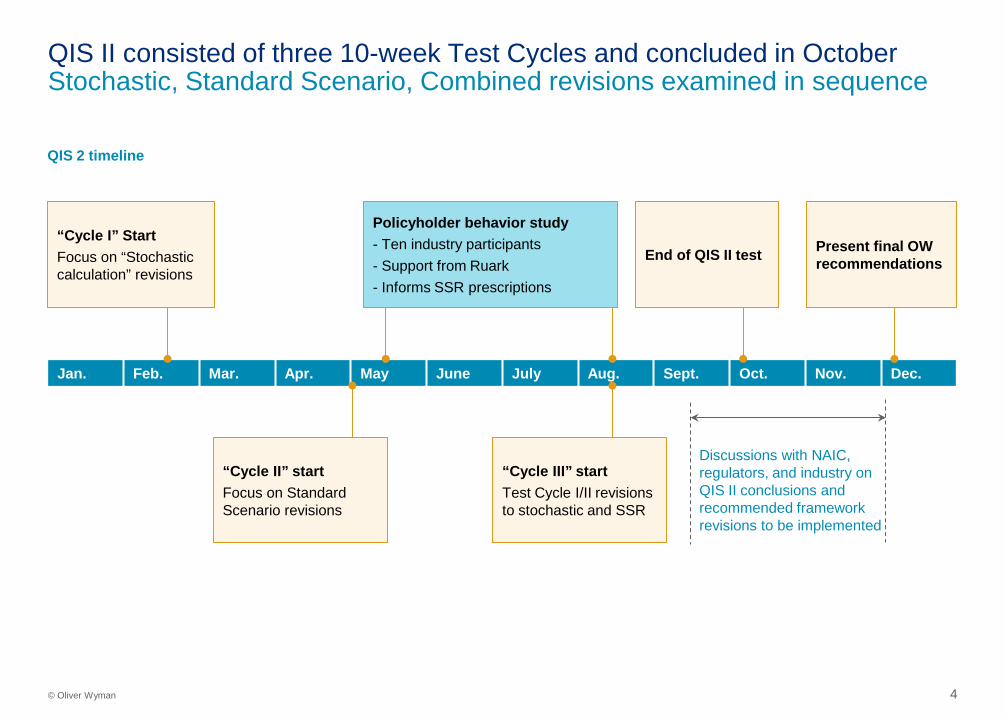
QIS II consisted of three 10-week Test Cycles and concluded in October Stochastic, Standard Scenario, Combined revisions examined in sequence
Jan. Feb. Mar. Apr. May June July Aug. Sept. Oct. Nov. Dec.
QIS 2 timeline
“Cycle I” Start Focus on “Stochastic calculation” revisions
“Cycle II” start Focus on Standard Scenario revisions
“Cycle III” start Test Cycle I/II revisions to stochastic and SSR
End of QIS II test
Discussions with NAIC, regulators, and industry on QIS II conclusions and recommended framework revisions to be implemented
Present final OW recommendations
Policyholder behavior study - Ten industry participants - Support from Ruark - Informs SSR prescriptions
5 © Oliver Wyman
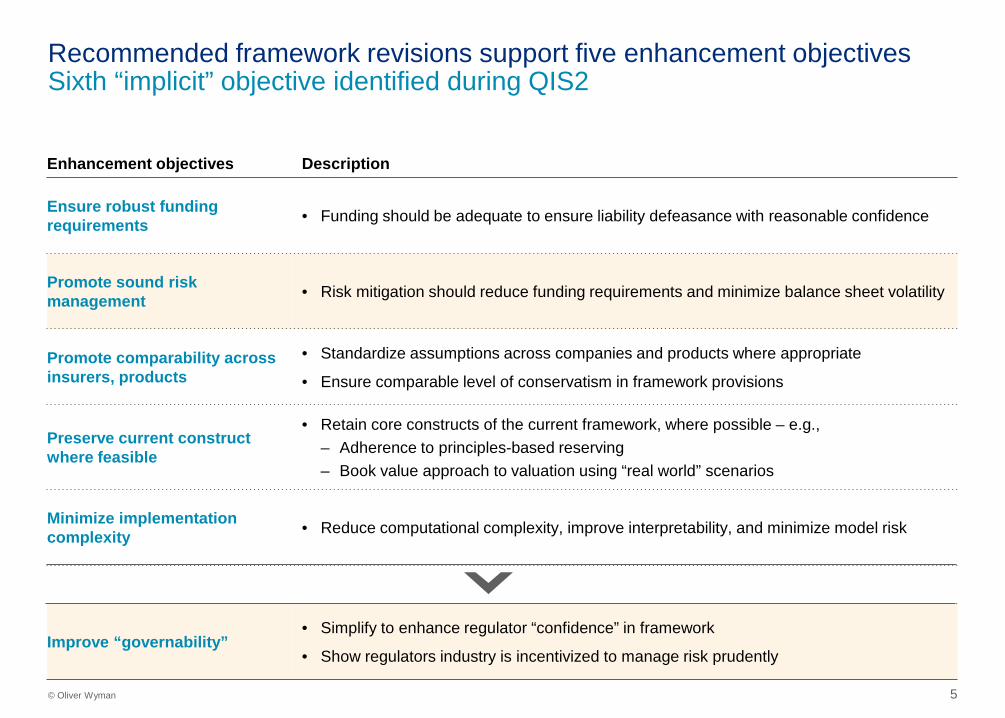
Recommended framework revisions support five enhancement objectives Sixth “implicit” objective identified during QIS2
Enhancement objectives Description
Ensure robust funding requirements • Funding should be adequate to ensure liability defeasance with reasonable confidence
Promote sound risk management • Risk mitigation should reduce funding requirements and minimize balance sheet volatility
Promote comparability across insurers, products
• Standardize assumptions across companies and products where appropriate
• Ensure comparable level of conservatism in framework provisions
Preserve current construct where feasible
• Retain core constructs of the current framework, where possible – e.g., – Adherence to principles-based reserving – Book value approach to valuation using “real world” scenarios
Minimize implementation complexity • Reduce computational complexity, improve interpretability, and minimize model risk
Improve “governability” • Simplify to enhance regulator “confidence” in framework
• Show regulators industry is incentivized to manage risk prudently
6 © Oliver Wyman
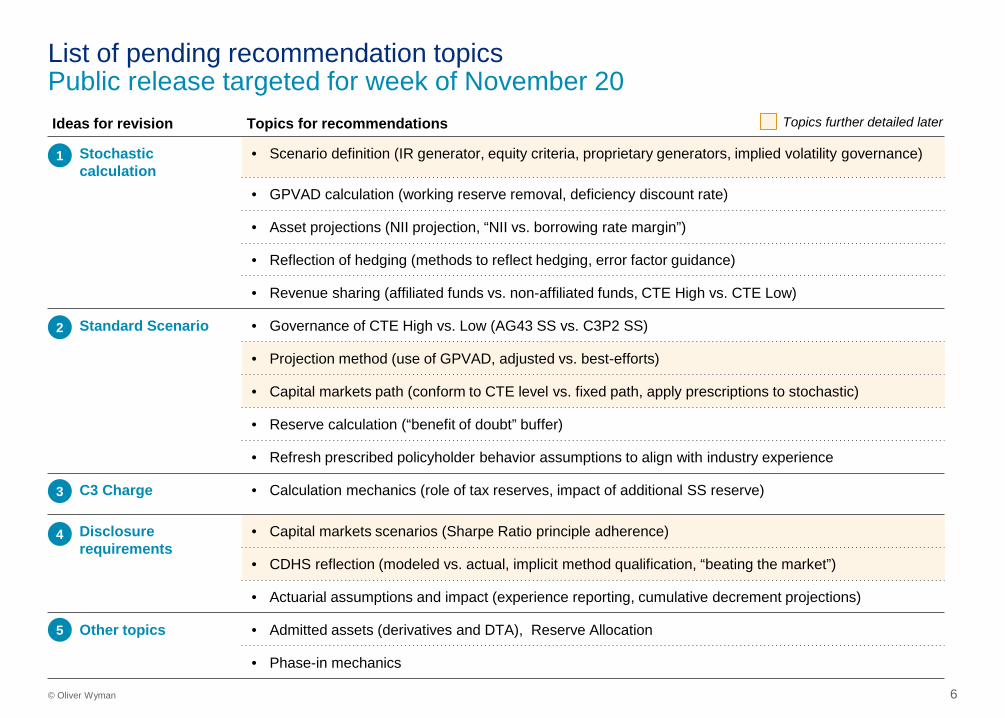
Ideas for revision Topics for recommendations
Stochastic calculation
• Scenario definition (IR generator, equity criteria, proprietary generators, implied volatility governance)
• GPVAD calculation (working reserve removal, deficiency discount rate)
• Asset projections (NII projection, “NII vs. borrowing rate margin”)
• Reflection of hedging (methods to reflect hedging, error factor guidance)
• Revenue sharing (affiliated funds vs. non-affiliated funds, CTE High vs. CTE Low)
Standard Scenario • Governance of CTE High vs. Low (AG43 SS vs. C3P2 SS)
• Projection method (use of GPVAD, adjusted vs. best-efforts)
• Capital markets path (conform to CTE level vs. fixed path, apply prescriptions to stochastic)
• Reserve calculation (“benefit of doubt” buffer)
• Refresh prescribed policyholder behavior assumptions to align with industry experience
C3 Charge • Calculation mechanics (role of tax reserves, impact of additional SS reserve)
Disclosure requirements
• Capital markets scenarios (Sharpe Ratio principle adherence)
• CDHS reflection (modeled vs. actual, implicit method qualification, “beating the market”)
• Actuarial assumptions and impact (experience reporting, cumulative decrement projections)
Other topics • Admitted assets (derivatives and DTA), Reserve Allocation
• Phase-in mechanics
List of pending recommendation topics Public release targeted for week of November 20
1
2
3
4
5
Topics further detailed later

Stochastic scenarios 1
9 © Oliver Wyman
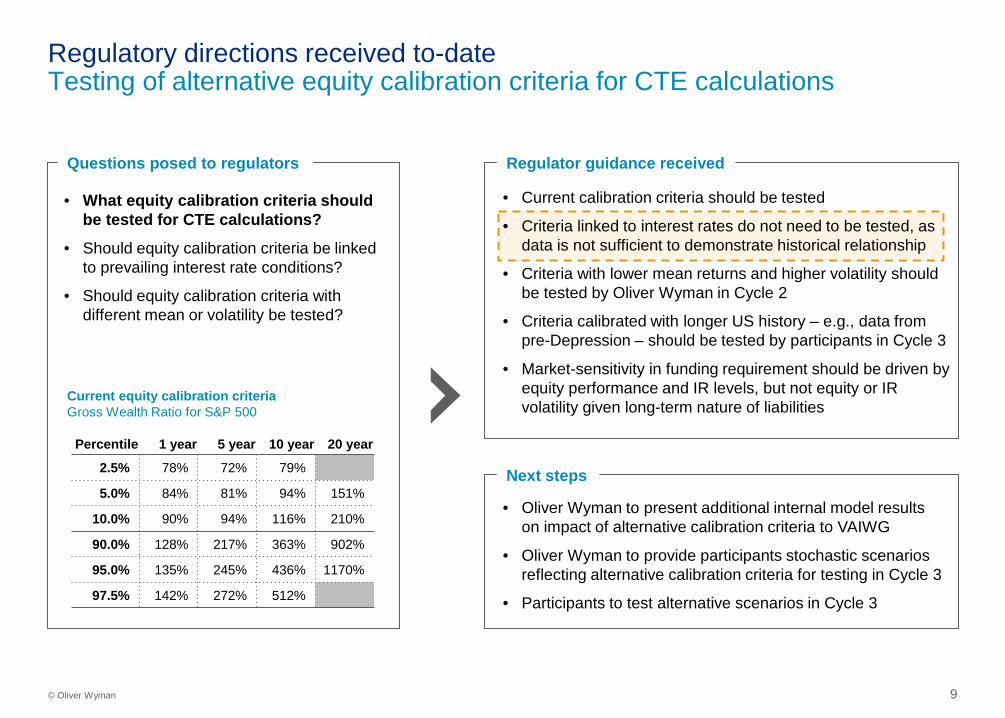
Regulatory directions received to-date Testing of alternative equity calibration criteria for CTE calculations
Questions posed to regulators
• What equity calibration criteria should be tested for CTE calculations?
• Should equity calibration criteria be linked to prevailing interest rate conditions?
• Should equity calibration criteria with different mean or volatility be tested?
Regulator guidance received
• Current calibration criteria should be tested
• Criteria linked to interest rates do not need to be tested, as data is not sufficient to demonstrate historical relationship
• Criteria with lower mean returns and higher volatility should be tested by Oliver Wyman in Cycle 2
• Criteria calibrated with longer US history – e.g., data from pre-Depression – should be tested by participants in Cycle 3
• Market-sensitivity in funding requirement should be driven by equity performance and IR levels, but not equity or IR volatility given long-term nature of liabilities
Next steps
• Oliver Wyman to present additional internal model results on impact of alternative calibration criteria to VAIWG
• Oliver Wyman to provide participants stochastic scenarios reflecting alternative calibration criteria for testing in Cycle 3
• Participants to test alternative scenarios in Cycle 3
Current equity calibration criteria Gross Wealth Ratio for S&P 500
Percentile 1 year 5 year 10 year 20 year
2.5% 78% 72% 79%
5.0% 84% 81% 94% 151%
10.0% 90% 94% 116% 210%
90.0% 128% 217% 363% 902%
95.0% 135% 245% 436% 1170%
97.5% 142% 272% 512%
10 © Oliver Wyman
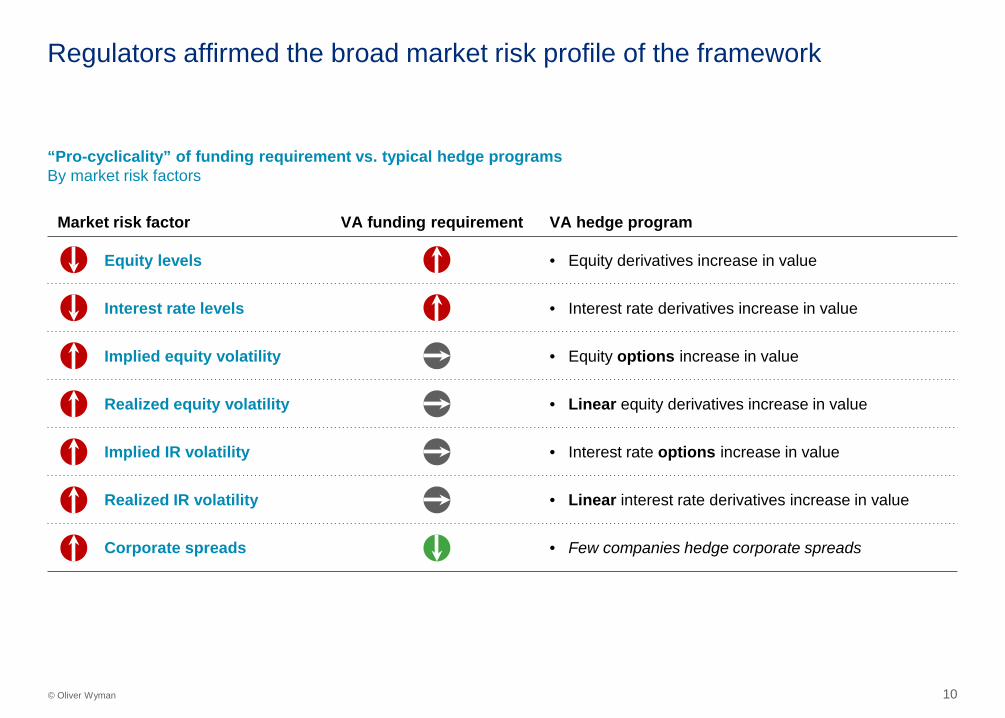
Regulators affirmed the broad market risk profile of the framework
Market risk factor VA funding requirement VA hedge program
Equity levels • Equity derivatives increase in value
Interest rate levels • Interest rate derivatives increase in value
Implied equity volatility • Equity options increase in value
Realized equity volatility • Linear equity derivatives increase in value
Implied IR volatility • Interest rate options increase in value
Realized IR volatility • Linear interest rate derivatives increase in value
Corporate spreads • Few companies hedge corporate spreads
“Pro-cyclicality” of funding requirement vs. typical hedge programs By market risk factors
11 © Oliver Wyman
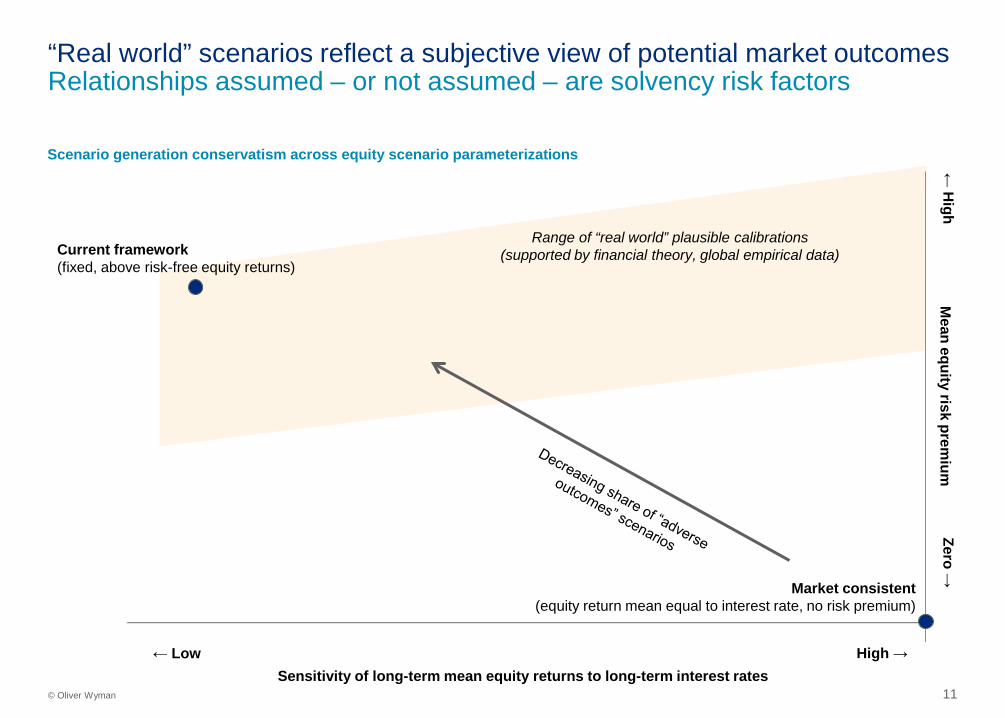
“Real world” scenarios reflect a subjective view of potential market outcomes Relationships assumed – or not assumed – are solvency risk factors
← H
igh
Scenario generation conservatism across equity scenario parameterizations
Zero →
← Low High → Sensitivity of long-term mean equity returns to long-term interest rates
Mean equity risk prem
ium
Market consistent (equity return mean equal to interest rate, no risk premium)
Range of “real world” plausible calibrations (supported by financial theory, global empirical data) Current framework
(fixed, above risk-free equity returns)
12 © Oliver Wyman
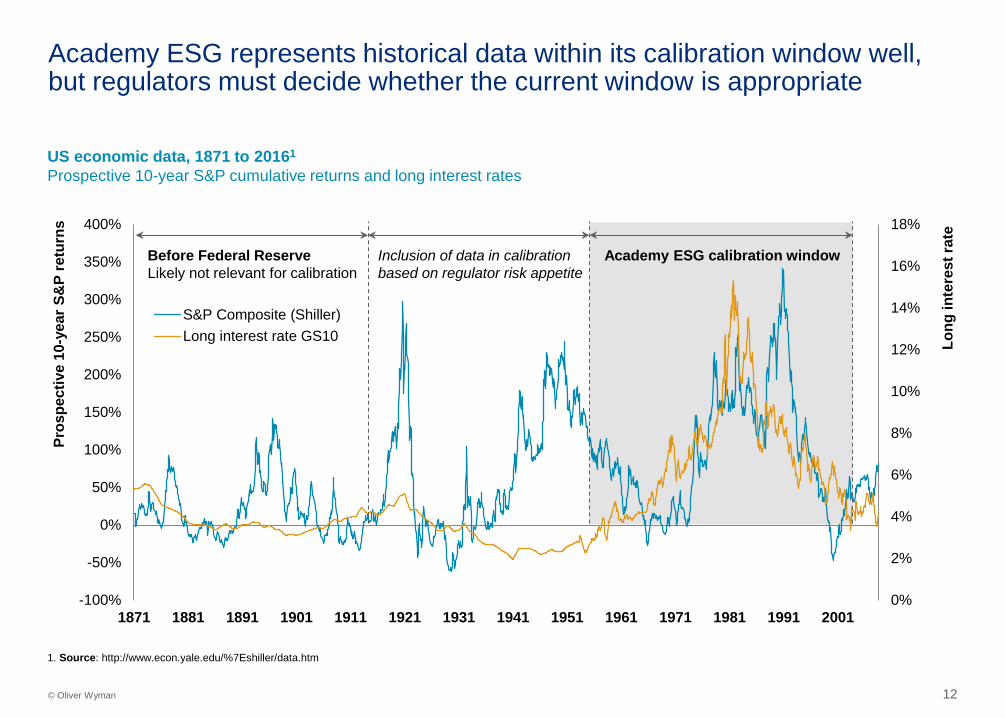
Academy ESG represents historical data within its calibration window well, but regulators must decide whether the current window is appropriate
0%
2%
4%
6%
8%
10%
12%
14%
16%
18%
-100%
-50%
0%
50%
100%
150%
200%
250%
300%
350%
400%
1871 1881 1891 1901 1911 1921 1931 1941 1951 1961 1971 1981 1991 2001
Long
inte
rest
rate
Pros
pect
ive
10-y
ear S
&P
retu
rns
S&P Composite (Shiller)Long interest rate GS10
US economic data, 1871 to 20161
Prospective 10-year S&P cumulative returns and long interest rates
Academy ESG calibration window Before Federal Reserve Likely not relevant for calibration
Inclusion of data in calibration based on regulator risk appetite
1. Source: http://www.econ.yale.edu/%7Eshiller/data.htm
13 © Oliver Wyman
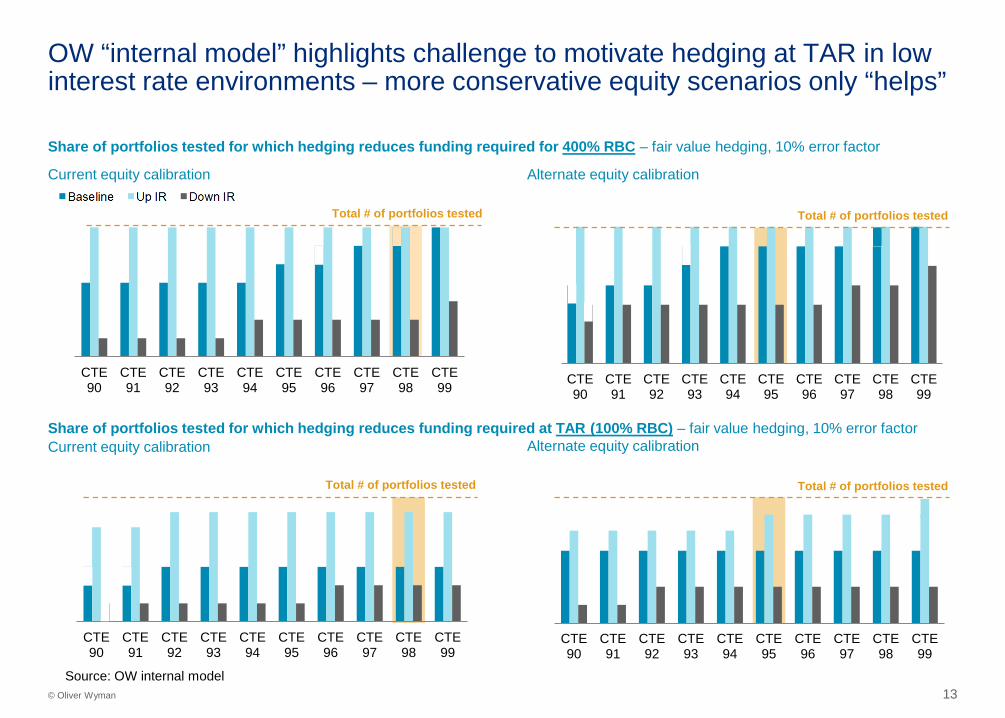
OW “internal model” highlights challenge to motivate hedging at TAR in low interest rate environments – more conservative equity scenarios only “helps”
Share of portfolios tested for which hedging reduces funding required for 400% RBC – fair value hedging, 10% error factor
CTE90
CTE91
CTE92
CTE93
CTE94
CTE95
CTE96
CTE97
CTE98
CTE99 CTE
90CTE91
CTE92
CTE93
CTE94
CTE95
CTE96
CTE97
CTE98
CTE99
Current equity calibration Alternate equity calibration
Share of portfolios tested for which hedging reduces funding required at TAR (100% RBC) – fair value hedging, 10% error factor Current equity calibration Alternate equity calibration
CTE90
CTE91
CTE92
CTE93
CTE94
CTE95
CTE96
CTE97
CTE98
CTE99
CTE90
CTE91
CTE92
CTE93
CTE94
CTE95
CTE96
CTE97
CTE98
CTE99
Total # of portfolios tested Total # of portfolios tested
Total # of portfolios tested Total # of portfolios tested
Source: OW internal model
14 © Oliver Wyman
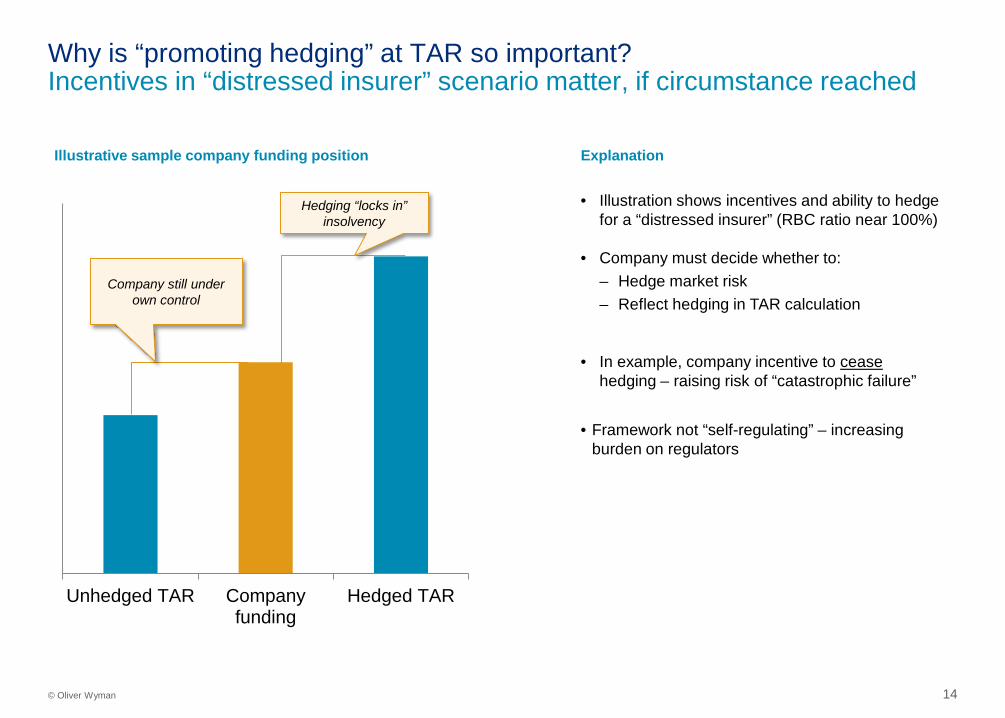
Why is “promoting hedging” at TAR so important? Incentives in “distressed insurer” scenario matter, if circumstance reached
Unhedged TAR Companyfunding
Hedged TAR
Hedging “locks in” insolvency
Company still under own control
Illustrative sample company funding position Explanation
• Illustration shows incentives and ability to hedge for a “distressed insurer” (RBC ratio near 100%)
• Company must decide whether to: – Hedge market risk – Reflect hedging in TAR calculation
• In example, company incentive to cease hedging – raising risk of “catastrophic failure”
• Framework not “self-regulating” – increasing burden on regulators
15 © Oliver Wyman
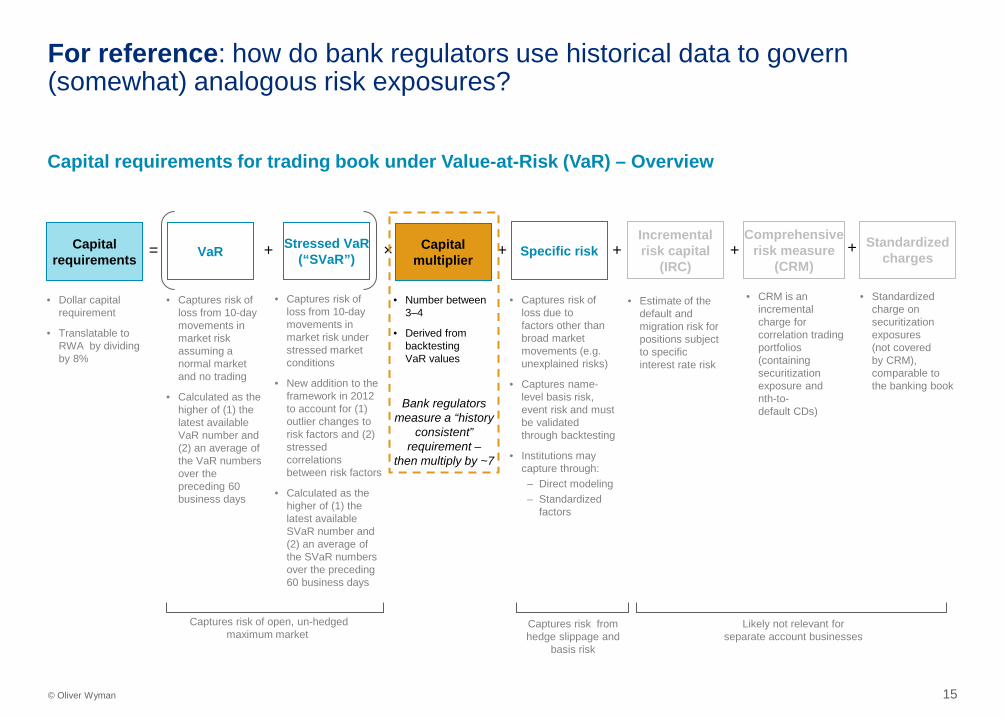
For reference: how do bank regulators use historical data to govern (somewhat) analogous risk exposures?
Capital requirements VaR Stressed VaR
(“SVaR”) Specific risk = + + ×
• Captures risk of loss from 10-day movements in market risk assuming a normal market and no trading
• Calculated as the higher of (1) the latest available VaR number and (2) an average of the VaR numbers over the preceding 60 business days
• Captures risk of loss from 10-day movements in market risk under stressed market conditions
• New addition to the framework in 2012 to account for (1) outlier changes to risk factors and (2) stressed correlations between risk factors
• Calculated as the higher of (1) the latest available SVaR number and (2) an average of the SVaR numbers over the preceding 60 business days
• Captures risk of loss due to factors other than broad market movements (e.g. unexplained risks)
• Captures name-level basis risk, event risk and must be validated through backtesting
• Institutions may capture through: – Direct modeling – Standardized
factors
• Dollar capital requirement
• Translatable to RWA by dividing by 8%
Captures risk of open, un-hedged maximum market
Captures risk from hedge slippage and
basis risk
+ Incremental risk capital
(IRC)
Comprehensive risk measure
(CRM)
Standardized charges + +
• CRM is an incremental charge for correlation trading portfolios (containing securitization exposure and nth-to-default CDs)
Capital multiplier
• Number between 3–4
• Derived from backtesting VaR values
• Estimate of the default and migration risk for positions subject to specific interest rate risk
• Standardized charge on securitization exposures (not covered by CRM), comparable to the banking book
Likely not relevant for separate account businesses
Capital requirements for trading book under Value-at-Risk (VaR) – Overview
Bank regulators measure a “history
consistent” requirement –
then multiply by ~7

Standard Scenario 2
17 © Oliver Wyman
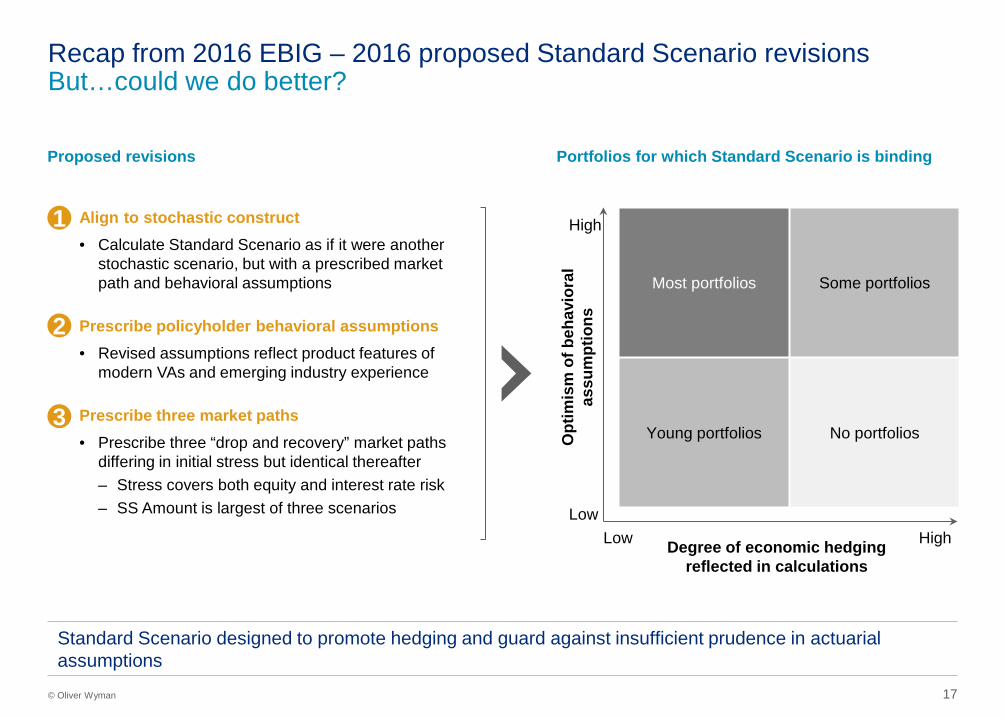
Recap from 2016 EBIG – 2016 proposed Standard Scenario revisions But…could we do better?
Proposed revisions Portfolios for which Standard Scenario is binding
Align to stochastic construct • Calculate Standard Scenario as if it were another
stochastic scenario, but with a prescribed market path and behavioral assumptions
Prescribe policyholder behavioral assumptions • Revised assumptions reflect product features of
modern VAs and emerging industry experience
Prescribe three market paths
• Prescribe three “drop and recovery” market paths differing in initial stress but identical thereafter – Stress covers both equity and interest rate risk – SS Amount is largest of three scenarios
1
2
3
Opt
imis
m o
f beh
avio
ral
assu
mpt
ions
Degree of economic hedging reflected in calculations
Most portfolios Some portfolios
Young portfolios No portfolios
Low High Low
High
Standard Scenario designed to promote hedging and guard against insufficient prudence in actuarial assumptions
18 © Oliver Wyman
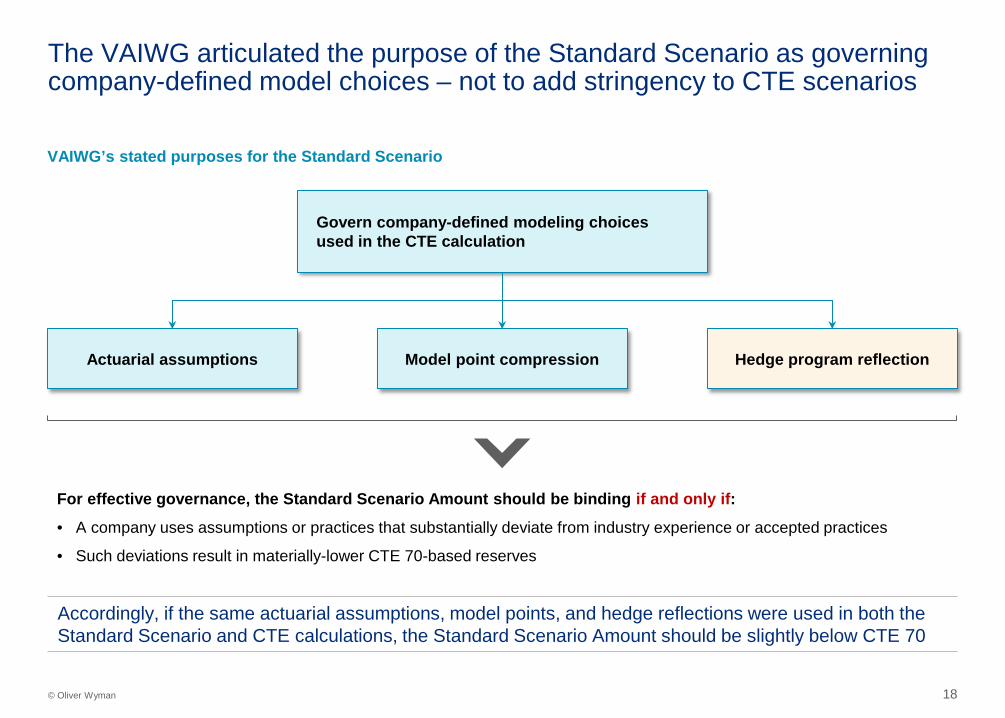
The VAIWG articulated the purpose of the Standard Scenario as governing company-defined model choices – not to add stringency to CTE scenarios
VAIWG’s stated purposes for the Standard Scenario
Actuarial assumptions Model point compression Hedge program reflection
For effective governance, the Standard Scenario Amount should be binding if and only if:
• A company uses assumptions or practices that substantially deviate from industry experience or accepted practices
• Such deviations result in materially-lower CTE 70-based reserves
Accordingly, if the same actuarial assumptions, model points, and hedge reflections were used in both the Standard Scenario and CTE calculations, the Standard Scenario Amount should be slightly below CTE 70
Govern company-defined modeling choices used in the CTE calculation
19 © Oliver Wyman
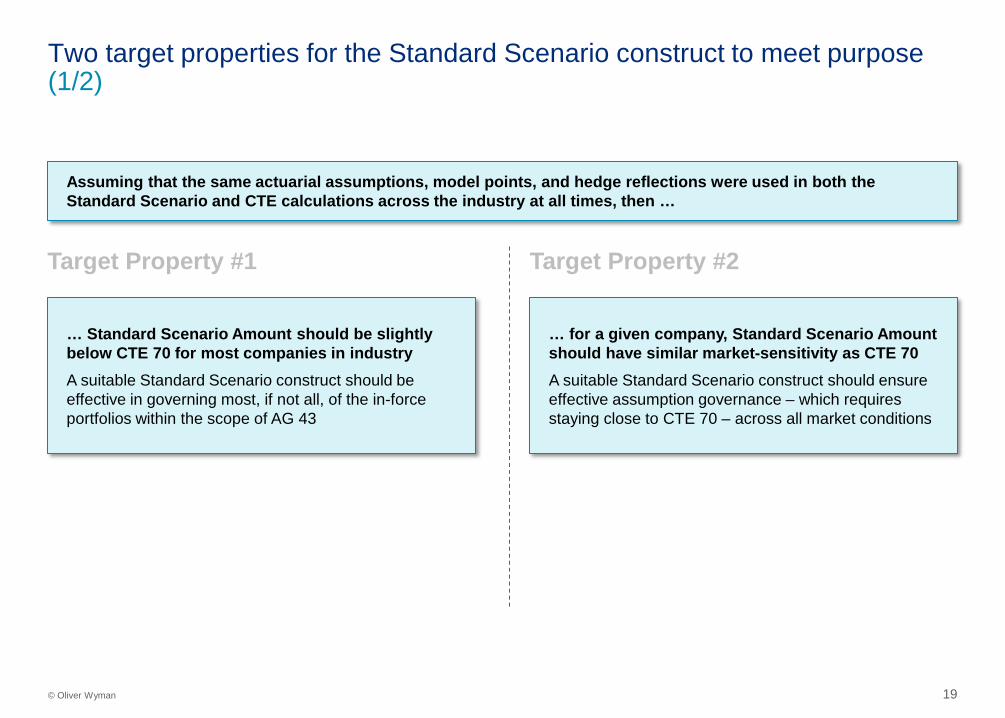
Two target properties for the Standard Scenario construct to meet purpose (1/2)
Target Property #1 Target Property #2
… Standard Scenario Amount should be slightly below CTE 70 for most companies in industry A suitable Standard Scenario construct should be effective in governing most, if not all, of the in-force portfolios within the scope of AG 43
… for a given company, Standard Scenario Amount should have similar market-sensitivity as CTE 70 A suitable Standard Scenario construct should ensure effective assumption governance – which requires staying close to CTE 70 – across all market conditions
Assuming that the same actuarial assumptions, model points, and hedge reflections were used in both the Standard Scenario and CTE calculations across the industry at all times, then …
20 © Oliver Wyman
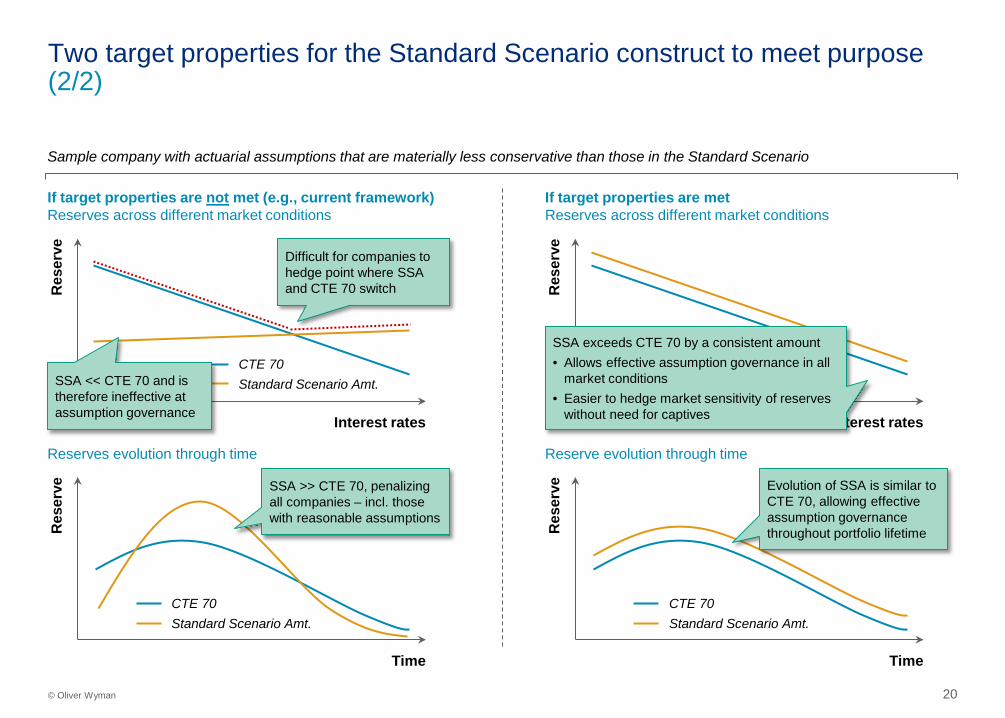
Two target properties for the Standard Scenario construct to meet purpose (2/2)
Res
erve
Time
CTE 70 Standard Scenario Amt.
SSA >> CTE 70, penalizing all companies – incl. those with reasonable assumptions
Res
erve
Time
CTE 70 Standard Scenario Amt.
Evolution of SSA is similar to CTE 70, allowing effective assumption governance throughout portfolio lifetime
Res
erve
Interest rates
CTE 70 Standard Scenario Amt.
Difficult for companies to hedge point where SSA and CTE 70 switch
SSA << CTE 70 and is therefore ineffective at assumption governance
Res
erve
Interest rates
SSA exceeds CTE 70 by a consistent amount • Allows effective assumption governance in all
market conditions • Easier to hedge market sensitivity of reserves
without need for captives
If target properties are not met (e.g., current framework) Reserves across different market conditions
If target properties are met Reserves across different market conditions
Reserves evolution through time Reserve evolution through time
Sample company with actuarial assumptions that are materially less conservative than those in the Standard Scenario
21 © Oliver Wyman
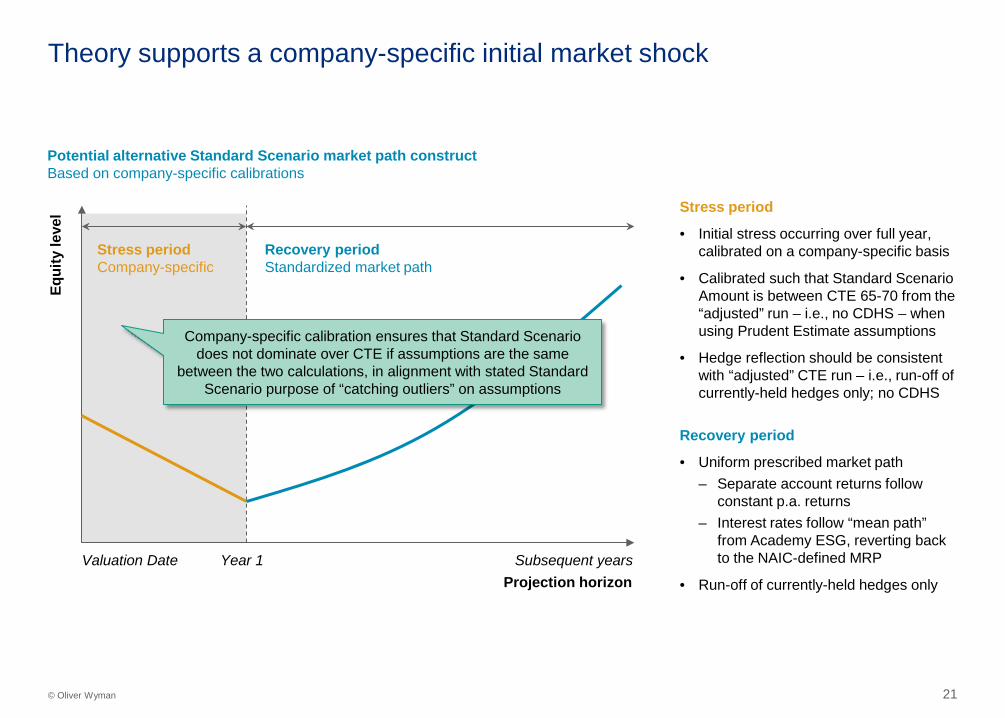
Theory supports a company-specific initial market shock
Potential alternative Standard Scenario market path construct Based on company-specific calibrations
Equi
ty le
vel
Projection horizon Valuation Date Subsequent years Year 1
Recovery period Standardized market path
Stress period Company-specific
Stress period
• Initial stress occurring over full year, calibrated on a company-specific basis
• Calibrated such that Standard Scenario Amount is between CTE 65-70 from the “adjusted” run – i.e., no CDHS – when using Prudent Estimate assumptions
• Hedge reflection should be consistent with “adjusted” CTE run – i.e., run-off of currently-held hedges only; no CDHS
Recovery period
• Uniform prescribed market path – Separate account returns follow
constant p.a. returns – Interest rates follow “mean path”
from Academy ESG, reverting back to the NAIC-defined MRP
• Run-off of currently-held hedges only
Company-specific calibration ensures that Standard Scenario does not dominate over CTE if assumptions are the same
between the two calculations, in alignment with stated Standard Scenario purpose of “catching outliers” on assumptions
22 © Oliver Wyman
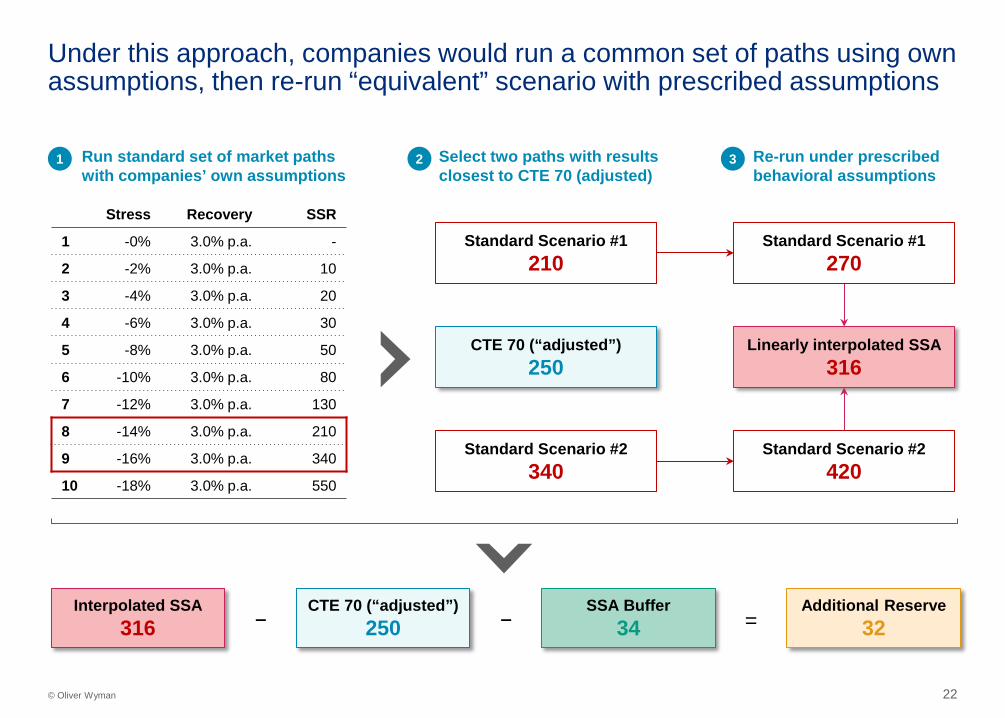
Under this approach, companies would run a common set of paths using own assumptions, then re-run “equivalent” scenario with prescribed assumptions
Additional Reserve 32
CTE 70 (“adjusted”) 250
Interpolated SSA 316
SSA Buffer 34
Stress Recovery SSR
1 -0% 3.0% p.a. -
2 -2% 3.0% p.a. 10
3 -4% 3.0% p.a. 20
4 -6% 3.0% p.a. 30
5 -8% 3.0% p.a. 50
6 -10% 3.0% p.a. 80
7 -12% 3.0% p.a. 130
8 -14% 3.0% p.a. 210
9 -16% 3.0% p.a. 340
10 -18% 3.0% p.a. 550
Run standard set of market paths with companies’ own assumptions
Select two paths with results closest to CTE 70 (adjusted)
CTE 70 (“adjusted”) 250
Standard Scenario #1 210
Re-run under prescribed behavioral assumptions
Standard Scenario #1 270
1 2 3
Standard Scenario #2 340
Standard Scenario #2 420
Linearly interpolated SSA 316
= − −
23 © Oliver Wyman
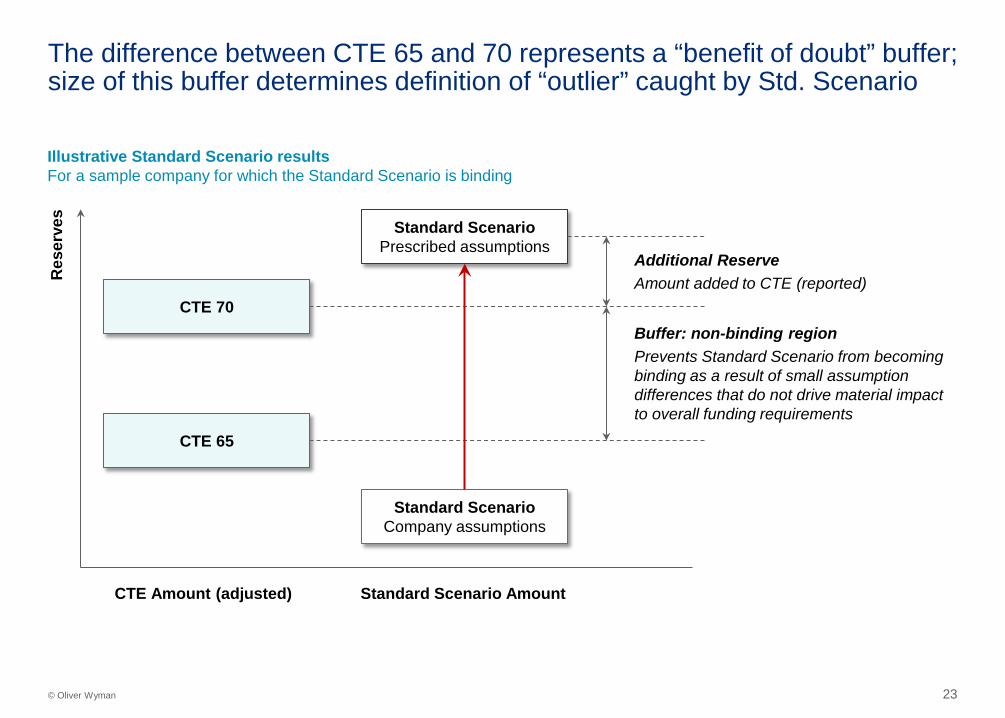
The difference between CTE 65 and 70 represents a “benefit of doubt” buffer; size of this buffer determines definition of “outlier” caught by Std. Scenario
Illustrative Standard Scenario results For a sample company for which the Standard Scenario is binding
Res
erve
s
CTE 70
CTE 65
Standard Scenario Company assumptions
CTE Amount (adjusted) Standard Scenario Amount
Standard Scenario Prescribed assumptions
Buffer: non-binding region Prevents Standard Scenario from becoming binding as a result of small assumption differences that do not drive material impact to overall funding requirements
Additional Reserve Amount added to CTE (reported)

Disclosures 3
25 © Oliver Wyman
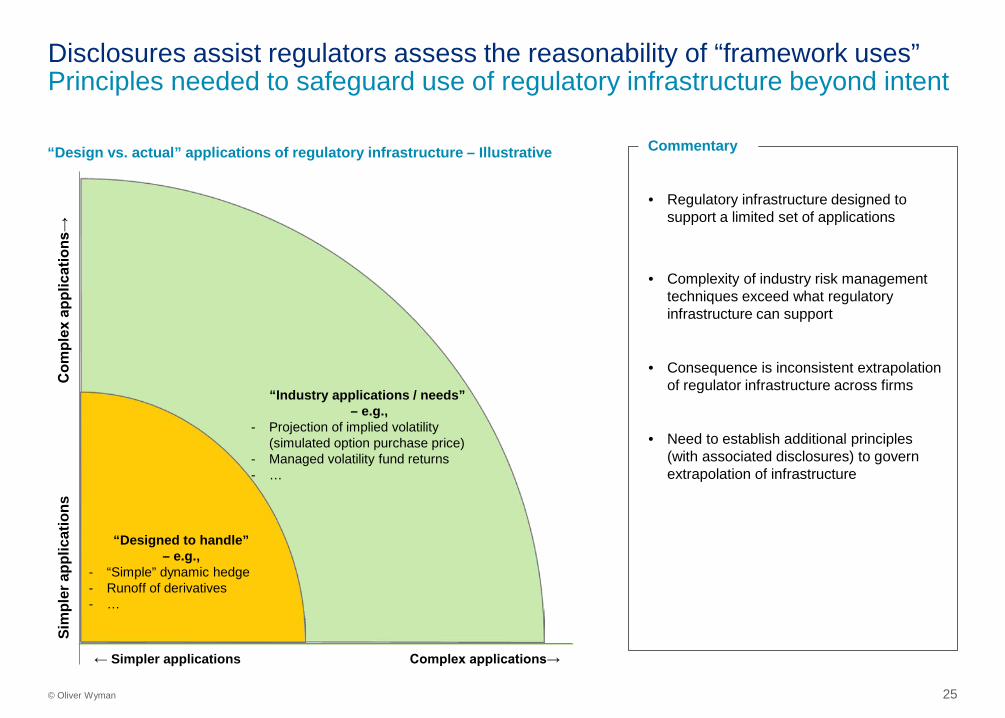
Disclosures assist regulators assess the reasonability of “framework uses” Principles needed to safeguard use of regulatory infrastructure beyond intent
Com
plex
app
licat
ions
→
Sim
pler
app
licat
ions
← Simpler applications Complex applications→
Commentary
• Regulatory infrastructure designed to support a limited set of applications
• Complexity of industry risk management techniques exceed what regulatory infrastructure can support
• Consequence is inconsistent extrapolation of regulator infrastructure across firms
• Need to establish additional principles (with associated disclosures) to govern extrapolation of infrastructure
“Design vs. actual” applications of regulatory infrastructure – Illustrative
“Designed to handle” – e.g.,
- “Simple” dynamic hedge - Runoff of derivatives - …
“Industry applications / needs” – e.g.,
- Projection of implied volatility (simulated option purchase price)
- Managed volatility fund returns - …
26 © Oliver Wyman
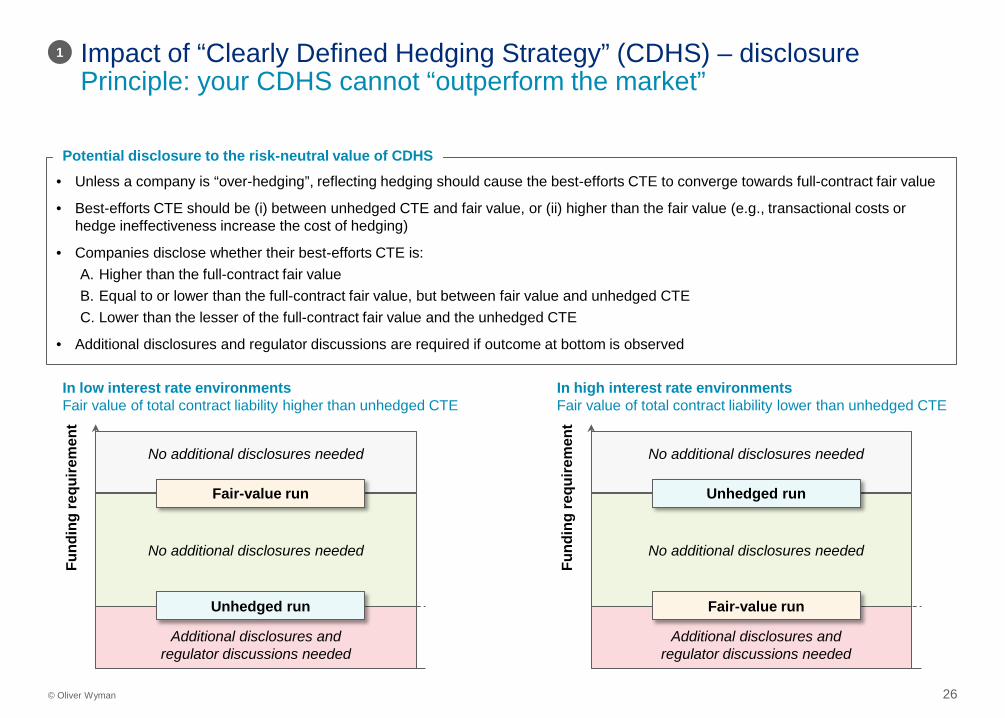
Impact of “Clearly Defined Hedging Strategy” (CDHS) – disclosure Principle: your CDHS cannot “outperform the market”
Fund
ing
requ
irem
ent
Fair-value run
Unhedged run
Fund
ing
requ
irem
ent
Unhedged run
Fair-value run
In low interest rate environments Fair value of total contract liability higher than unhedged CTE
In high interest rate environments Fair value of total contract liability lower than unhedged CTE
• Unless a company is “over-hedging”, reflecting hedging should cause the best-efforts CTE to converge towards full-contract fair value
• Best-efforts CTE should be (i) between unhedged CTE and fair value, or (ii) higher than the fair value (e.g., transactional costs or hedge ineffectiveness increase the cost of hedging)
• Companies disclose whether their best-efforts CTE is: A. Higher than the full-contract fair value B. Equal to or lower than the full-contract fair value, but between fair value and unhedged CTE C. Lower than the lesser of the full-contract fair value and the unhedged CTE
• Additional disclosures and regulator discussions are required if outcome at bottom is observed
Potential disclosure to the risk-neutral value of CDHS
1
No additional disclosures needed
Additional disclosures and regulator discussions needed
No additional disclosures needed
No additional disclosures needed
Additional disclosures and regulator discussions needed
No additional disclosures needed
27 © Oliver Wyman
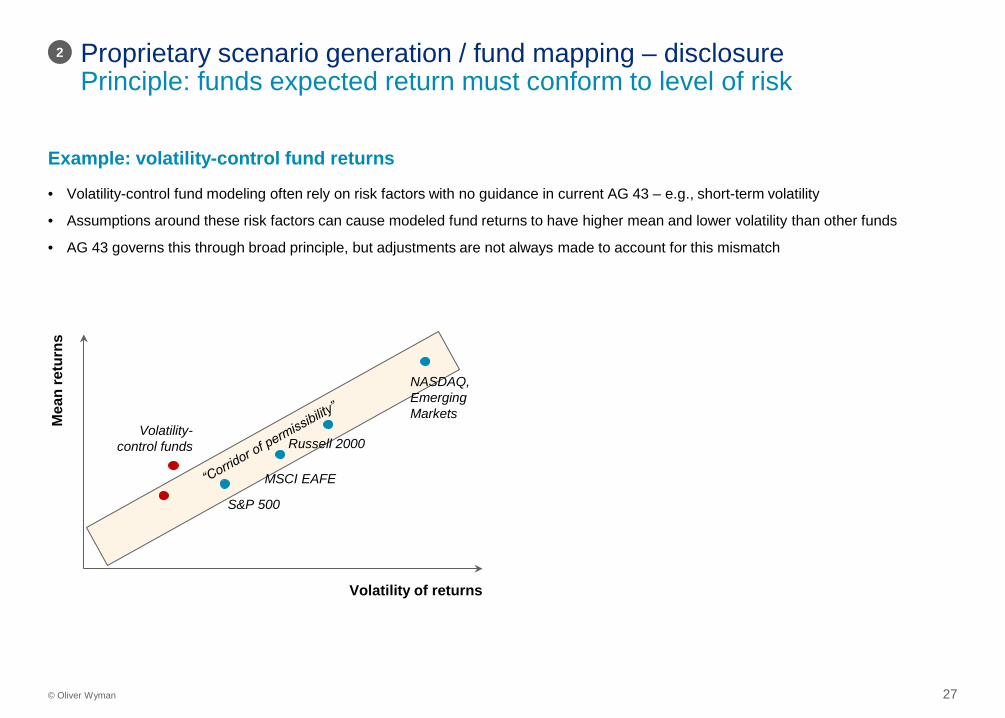
Example: volatility-control fund returns
Mea
n re
turn
s
Volatility of returns
NASDAQ, Emerging Markets
Russell 2000
MSCI EAFE
S&P 500
Volatility-control funds
• Volatility-control fund modeling often rely on risk factors with no guidance in current AG 43 – e.g., short-term volatility
• Assumptions around these risk factors can cause modeled fund returns to have higher mean and lower volatility than other funds
• AG 43 governs this through broad principle, but adjustments are not always made to account for this mismatch
Proprietary scenario generation / fund mapping – disclosure Principle: funds expected return must conform to level of risk
2
QUALIFICATIONS, ASSUMPTIONS AND LIMITING
CONDITIONS
This report is for the exclusive use of the Oliver Wyman client named herein. This report is not intended for general circulation or publication, nor is it to be reproduced, quoted or distributed for any purpose without the prior written permission of Oliver Wyman. There are no third party beneficiaries with respect to this report, and Oliver Wyman does not accept any liability to any third party.
Information furnished by others, upon which all or portions of this report are based, is believed to be reliable but has not been independently verified, unless otherwise expressly indicated. Public information and industry and statistical data are from sources we deem to be reliable; however, we make no representation as to the accuracy or completeness of such information. The findings contained in this report may contain predictions based on current data and historical trends. Any such predictions are subject to inherent risks and uncertainties. Oliver Wyman accepts no responsibility for actual results or future events.
The opinions expressed in this report are valid only for the purpose stated herein and as of the date of this report. No obligation is assumed to revise this report to reflect changes, events or conditions, which occur subsequent to the date hereof.
All decisions in connection with the implementation or use of advice or recommendations contained in this report are the sole responsibility of the client. This report does not represent investment advice nor does it provide an opinion regarding the fairness of any transaction to any and all parties.