Embed Size (px)
Citation preview
Getting StartedWelcome to the world of simple, fun, and profitable investing! For
more than a half-century, investors using methods like those appliedin this program have enjoyed uncommon success investing in com-mon stocks. You are about to join them. We believe you’ll discoverit’s easier than you thought possible. We’re sure you’ll find what youhave to know is not nearly as intimidating as you may have been ledto believe. In fact, you can learn much of it while you use this pro-gram. We hope you’ll find your experience as rewarding as othershave found theirs.
OverviewNAIC’s Take $tock 4 is a stock analysis software product so intu-
itive and easy to use it requires little instruction. We believe a simpleroad map identifying and describing the working parts of the programwill suffice for both Beginner and Advanced modes.
The main purpose of an automobile is transportation. The basics ofusing a car are simple: start it, shift into drive, step on the gas, steerit, and stop it. To drive to the store, you need not know what goes onunder the hood. Using Take $tock 4 is even easier. Enter the symbolor the name of a company that interests you, click on Retrieve, andbe greeted with a “First Impression”— an initial assessment of thecompany’s quality and price.
If you’re satisfied with that appraisal, you may continue on with the
NAIC’s
“Judgment Wizard”— a series of five steps each of which graphicallydisplays a key item of fundamental information about the company. Tomove through the steps, just select the appropriate answer to themultiple choice questions, based on what you see.
Once you have completed the required steps, Take $tock will applythe estimates and forecasts you have provided and do a thoroughevaluation of the company’s investment potential.
As with the automobile, there’s no need to know what goes onunder the hood. But that doesn’t mean there isn’t a whole lot going onthere.
The actual mechanisms used to analyze the quality of a companyand determine a reasonable price for its stock are those used bysome of the world’s most successful investors. As you can see whenyou choose to look under the hood (which you can), the analysis isbased on easy-to-understand logic and on sound, fundamental, ana-lytical principles.
The program implements a methodology based on that taught tosuccessful amateur investors for more than 50 years by the NationalAssociation of Investors Corporation (NAIC) and described in detail inInve$tWare chairman Ellis Traub’s book, Take Stock: A Roadmap toProfiting from Your First Walk Down Wall Street (Dearborn, 2000).Using this approach, you can easily accomplish the only two tasksrequired to successfully pick stocks: one, determine if a company isof high enough quality to merit your long-term interest; two, if it is,then determine a reasonable price to pay for its stock.
Page 2
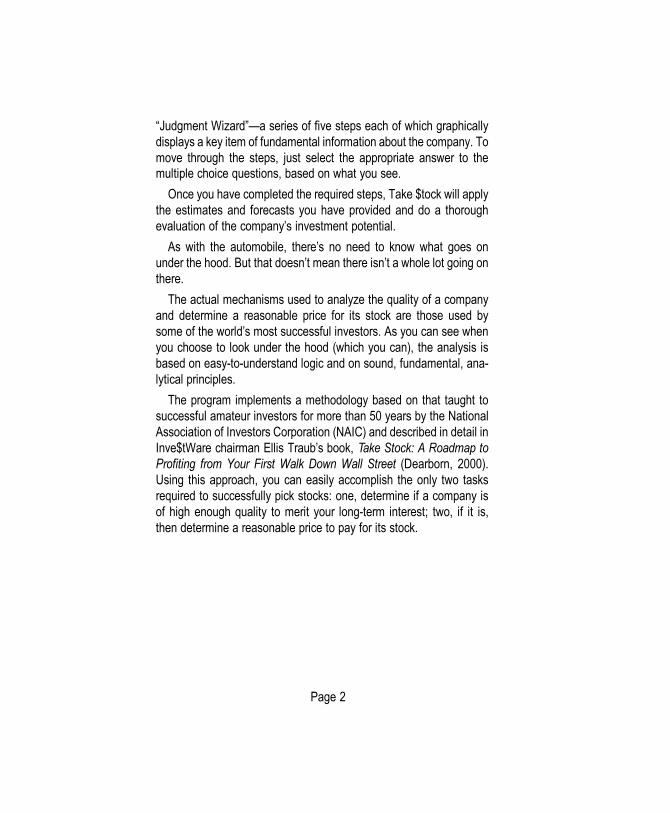
Let’s Analyze a CompanyStep 1. Enter either the company’s ticker symbol or its name in the
space provided. (If you can’t accurately remember the name orticker, click on the Find button and enter the beginning of thename.)
Enter the name, “Bed Bath and Beyond” in the spacelabeled Company Name at the top of the Navigation area.Note that, as soon as you type in a few letters, it will com-plete the name for you. If you know the ticker symbol, youcan enter it in the space above.
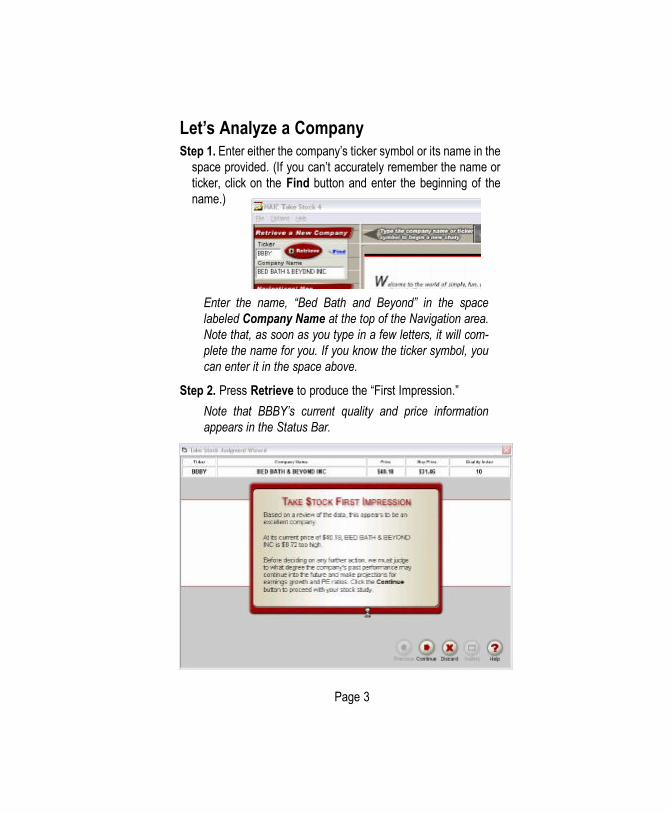
Step 2. Press Retrieve to produce the “First Impression.”Note that BBBY’s current quality and price informationappears in the Status Bar.
Page 3
Step 3. If the “First Impression” is favorable, click the “Continue”button at the bottom of the screen to proceed to the next screen.If not, click on the “Discard” button to abandon this study andbegin another.
BBBY is judged to be Excellent. Click on “Continue.”
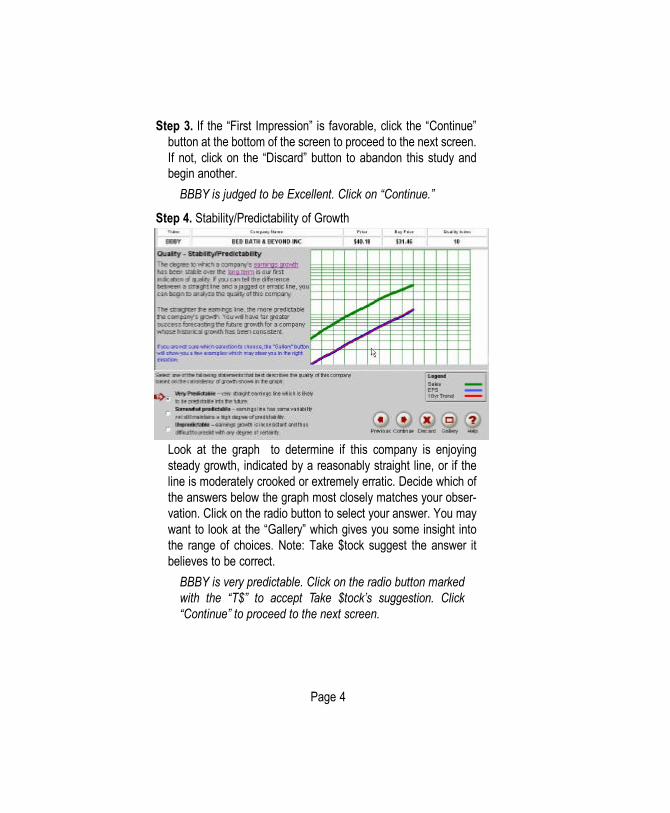
Step 4. Stability/Predictability of Growth
Look at the graph to determine if this company is enjoyingsteady growth, indicated by a reasonably straight line, or if theline is moderately crooked or extremely erratic. Decide which ofthe answers below the graph most closely matches your obser-vation. Click on the radio button to select your answer. You maywant to look at the “Gallery” which gives you some insight intothe range of choices. Note: Take $tock suggest the answer itbelieves to be correct.
BBBY is very predictable. Click on the radio button markedwith the “T$” to accept Take $tock’s suggestion. Click“Continue”to proceed to the next screen.
Page 4
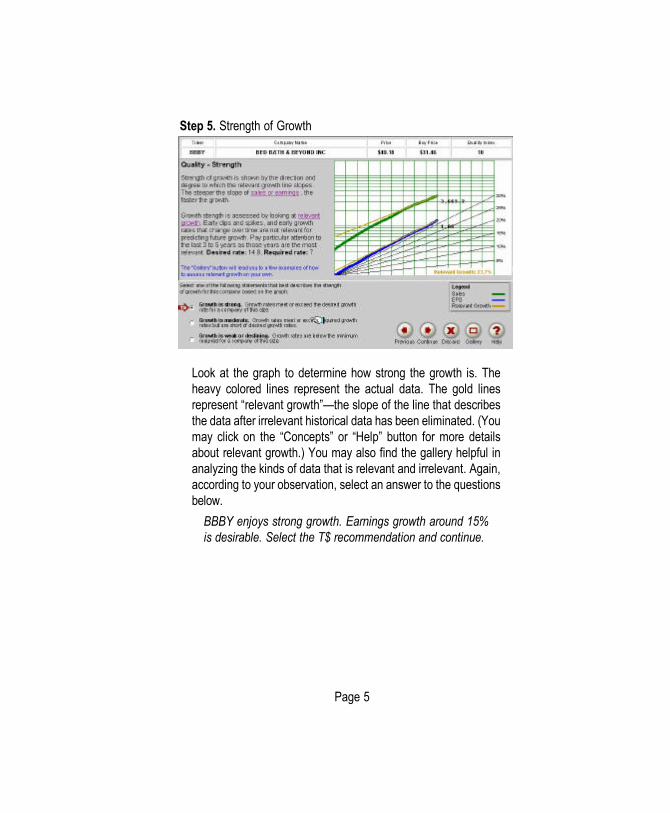
Step 5. Strength of Growth
Look at the graph to determine how strong the growth is. Theheavy colored lines represent the actual data. The gold linesrepresent “relevant growth”— the slope of the line that describesthe data after irrelevant historical data has been eliminated. (Youmay click on the “Concepts” or “Help” button for more detailsabout relevant growth.) You may also find the gallery helpful inanalyzing the kinds of data that is relevant and irrelevant. Again,according to your observation, select an answer to the questionsbelow.
BBBY enjoys strong growth. Earnings growth around 15%is desirable. Select the T$ recommendation and continue.
Page 5
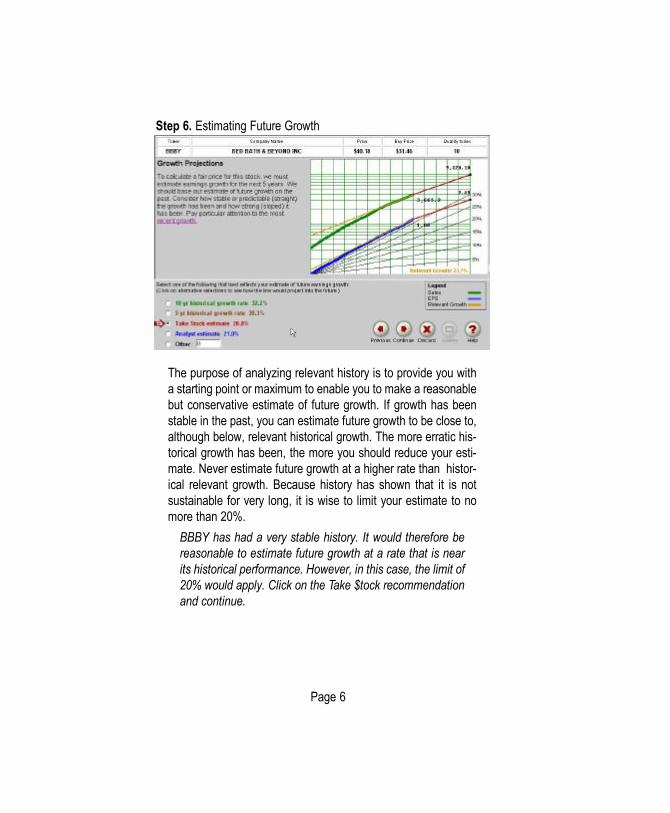
Step 6. Estimating Future Growth
The purpose of analyzing relevant history is to provide you witha starting point or maximum to enable you to make a reasonablebut conservative estimate of future growth. If growth has beenstable in the past, you can estimate future growth to be close to,although below, relevant historical growth. The more erratic his-torical growth has been, the more you should reduce your esti-mate. Never estimate future growth at a higher rate than histor-ical relevant growth. Because history has shown that it is notsustainable for very long, it is wise to limit your estimate to nomore than 20%.
BBBY has had a very stable history. It would therefore bereasonable to estimate future growth at a rate that is nearits historical performance. However, in this case, the limit of20% would apply. Click on the Take $tock recommendationand continue.
Page 6
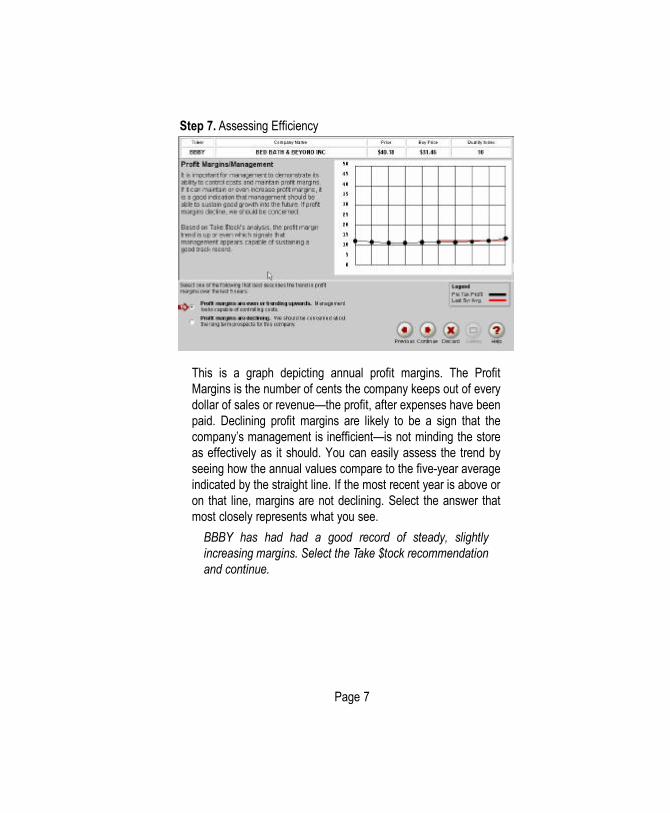
Step 7. Assessing Efficiency
This is a graph depicting annual profit margins. The ProfitMargins is the number of cents the company keeps out of everydollar of sales or revenue— the profit, after expenses have beenpaid. Declining profit margins are likely to be a sign that thecompany’s management is inefficient— is not minding the storeas effectively as it should. You can easily assess the trend byseeing how the annual values compare to the five-year averageindicated by the straight line. If the most recent year is above oron that line, margins are not declining. Select the answer thatmost closely represents what you see.
BBBY has had had a good record of steady, slightlyincreasing margins. Select the Take $tock recommendationand continue.
Page 7
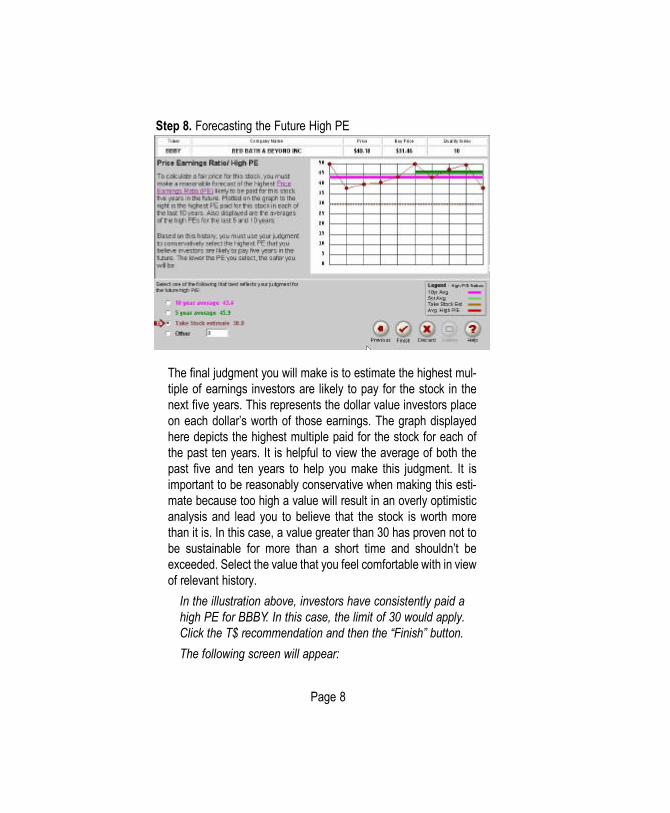
Step 8. Forecasting the Future High PE
The final judgment you will make is to estimate the highest mul-tiple of earnings investors are likely to pay for the stock in thenext five years. This represents the dollar value investors placeon each dollar’s worth of those earnings. The graph displayedhere depicts the highest multiple paid for the stock for each ofthe past ten years. It is helpful to view the average of both thepast five and ten years to help you make this judgment. It isimportant to be reasonably conservative when making this esti-mate because too high a value will result in an overly optimisticanalysis and lead you to believe that the stock is worth morethan it is. In this case, a value greater than 30 has proven not tobe sustainable for more than a short time and shouldn’t beexceeded. Select the value that you feel comfortable with in viewof relevant history.
In the illustration above, investors have consistently paid ahigh PE for BBBY. In this case, the limit of 30 would apply.Click the T$ recommendation and then the “Finish” button.The following screen will appear:
Page 8
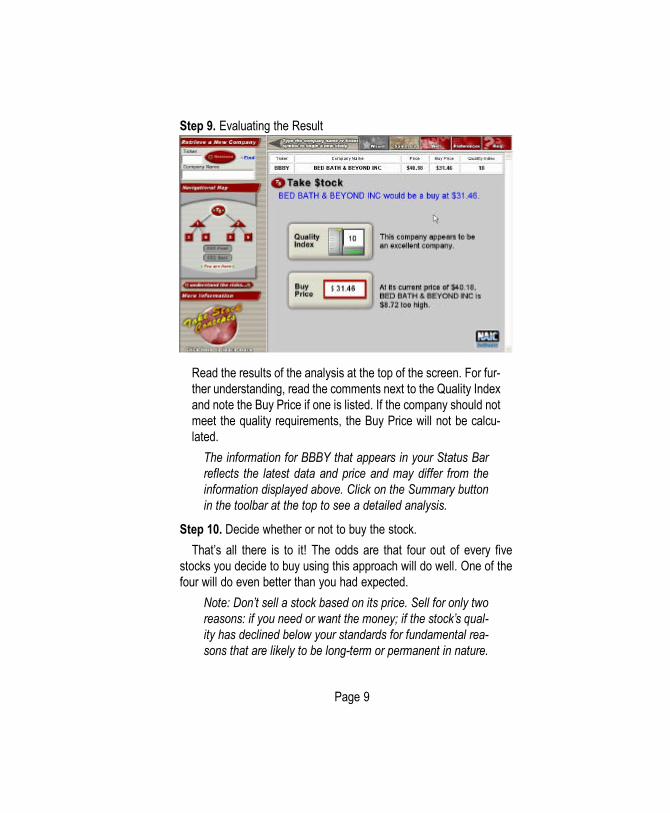
Step 9. Evaluating the Result
Read the results of the analysis at the top of the screen. For fur-ther understanding, read the comments next to the Quality Indexand note the Buy Price if one is listed. If the company should notmeet the quality requirements, the Buy Price will not be calcu-lated.
The information for BBBY that appears in your Status Barreflects the latest data and price and may differ from theinformation displayed above. Click on the Summary buttonin the toolbar at the top to see a detailed analysis.
Step 10. Decide whether or not to buy the stock.That’s all there is to it! The odds are that four out of every five
stocks you decide to buy using this approach will do well. One of thefour will do even better than you had expected.
Note: Don’t sell a stock based on its price. Sell for only tworeasons: if you need or want the money; if the stock’s qual-ity has declined below your standards for fundamental rea-sons that are likely to be long-term or permanent in nature.
Page 9
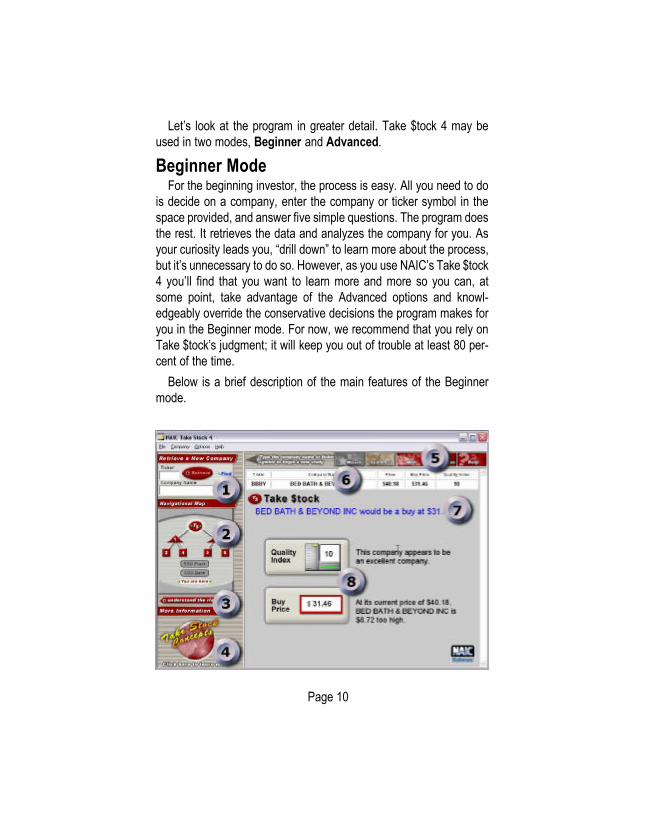
Let’s look at the program in greater detail. Take $tock 4 may beused in two modes, Beginner and Advanced.
Beginner ModeFor the beginning investor, the process is easy. All you need to do
is decide on a company, enter the company or ticker symbol in thespace provided, and answer five simple questions. The program doesthe rest. It retrieves the data and analyzes the company for you. Asyour curiosity leads you, “drill down” to learn more about the process,but it’s unnecessary to do so. However, as you use NAIC’s Take $tock4 you’ll find that you want to learn more and more so you can, atsome point, take advantage of the Advanced options and knowl-edgeably override the conservative decisions the program makes foryou in the Beginner mode. For now, we recommend that you rely onTake $tock’s judgment; it will keep you out of trouble at least 80 per-cent of the time.
Below is a brief description of the main features of the Beginnermode.
Page 10
Navigation AreaCompany Query
The area on the left side of the screen is the navigation area. In thespace labeled Retrieve a New Company at the top of the navigationarea, you’ll find a field where you can enter the ticker symbol for thecompany you want to analyze. If you don’t know the symbol, you canenter the name of the company in the space below it. Press theRetrieve button.
If you have entered the name correctly, it will complete your entryafter just a few letters. The ticker symbol and name of the companywill appear in the Status Bar .
If you’re unsuccessful, click on Find and enter what you believe tobe the name or ticker symbol in the space provided. A list of compa-nies will be created. Select the company you want, and it will appearin the Status Bar . Here you can also search by industry from thepull-down menu of listed industries.
Navigation Map The Navigational Map indicates where you are in the program.
When you begin, you will be in the first Take $tock 4 screen (T$). Ifyou drill down into the program to obtain additional information, yourlocation will be marked with green dots, and the screen number rep-resenting your position will be highlighted. You’ll notice the navigationmap is “live.” By clicking on any point, you can use the navigationmap to actually navigate directly to that screen.
Understand the risks… Click this button to view your responsibilities and the limits of
Inve$tWare’s liabilities when you use NAIC’s Take $tock 4 to help youmake investment decisions.
Page 11
Concepts Click the Concepts button for more information about the analysis
step you’re looking at. The Concepts button is context sensitive andclicking on it leads you to additional background material about theitems displayed on the current screen.
Toolbar The toolbar at the top of the analysis area has five buttons for the
beginning investor to use.Wizard
Click the Wizard button to return to the Judgment Wizardafter you have completed the steps contained in it and it isno longer on your screen. You may go back and review oredit your selections at any time.
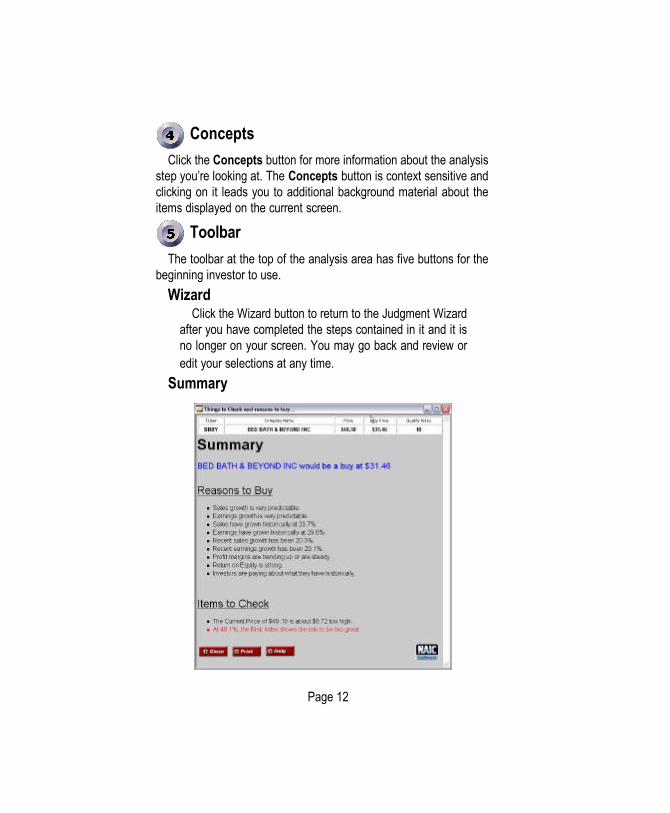
Summary
Page 12
Click the Summary button to view the pros and cons ofbuying the stock. The summary is divided into Reasons toBuy and Items to Check. Issues that would disqualify a com-pany from consideration are displayed in red. This summa-ry may be printed.
WebClick the Web button to display a pull-down menu of Web
addresses. You’ll be able to access all of the Market Guideinformation to supplement your data. You’ll find addresses forsites that provide additional information about the specificcompany— its description, competitors, supplemental finan-cial data, Home page— as well as Web sites of general inter-est such as Inve$tWare, NAIC, and Yahoo. This Web buttonis your key to research on the Internet. You should be able tofind the answers to any questions not provided within the pro-gram.
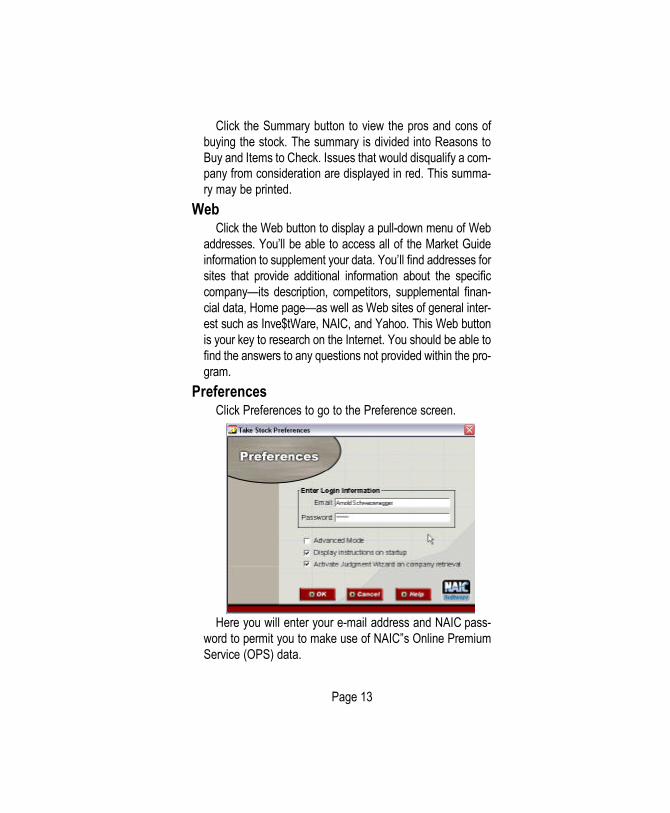
Preferences Click Preferences to go to the Preference screen.
Here you will enter your e-mail address and NAIC pass-word to permit you to make use of NAIC”s Online PremiumService (OPS) data.
Page 13

When you are ready to progress to Advanced mode, youmay do so by checking the appropriate box. If you use theAdvanced mode (described on page 16 below), you cantake advantage of additional options. The Advanced modeis recommended for experienced investors who fully under-stand the methodology and feel confident enough to changesome of the Take $tock 4 default values.
You may disable or enable the instruction screen thatappears at startup.
Finally, you may disable (or enable) the Judgment Wizardif you are comfortable accepting Take $tock’s default valuesfor the judgment items and wish to go directly to the analy-sis screen when entering a company name or ticker symbol.
HelpClick Help for assistance dealing with the mechanics of
running Take $tock. Wherever you are; you may also usethe F-1 key to access it. (Use the context-sensitive“Concepts” described above to learn more about the invest-ment methodology.)
Status Bar The Status Bar gives you an ongoing summary of key information.
It displays the ticker symbol, company name, current price, buy price,quality indicator, and mood indicator. (See descriptions below.)
Analysis Screen(s)Conclusion
The analysis area (beneath the status bar) displays the variousstages and components of the stock analysis. On the primary screen(shown above), you will find a statement that summarizes the con-clusions drawn from the analysis.
Page 14
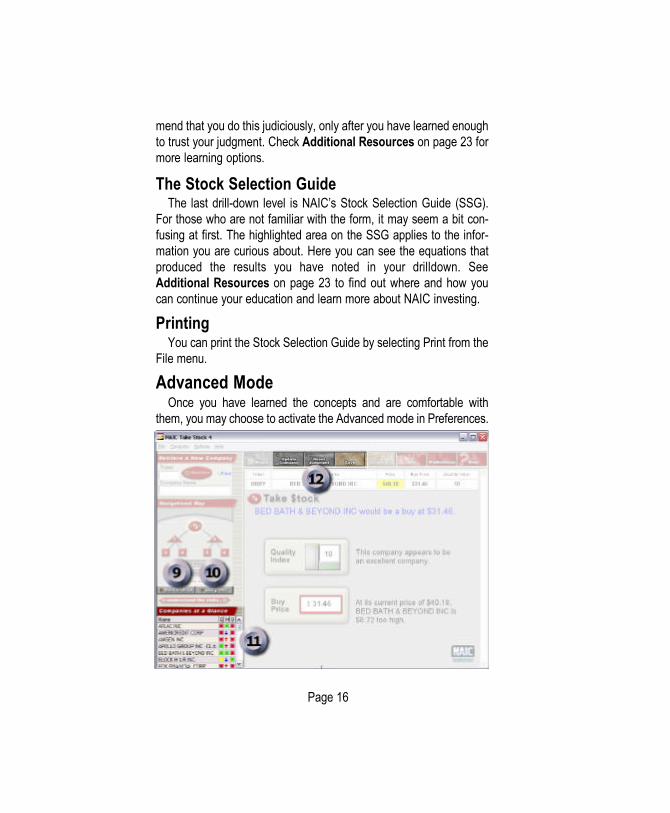
Indices Beneath this statement you will find two large buttons. The Quality
button contains a numerical Quality Index that grades the quality ofthe company on a scale of 1 to 10. If the Quality issues are satisfac-tory,m the Buy Price button displays the highest price at which youcan purchase the stock and obtain the desired return with reasonablerisk. These indicators give you an instant, visual assessment of thestatus of the stock. Both buttons are color-coded: Green is desire-able; Yellow is acceptable; and Red is unacceptable.
Drilling DownThe information provided by NAIC’s Take $tock 4 is all you need to
make the same decisions as those made by millions of successfulinvestors over the past half-century. However, you may wish to satis-fy your curiosity and look deeper into the reasons for the program’srejecting (or accepting) your choice. To do so, click on the large but-tons displayed on the screen. These will lead you to another screenwhere you can explore the reasons and learn why they are important.
Click on the Quality Index button. On the next screen checkthe information about BBBY’s growth and efficiency. Notehow the Navigation map indicates your location in the pro-gram.
You may continue to explore the Quality issues deeper into the pro-gram, finally coming to the Stock Selection Guide.
NAIC’s Take $tock 4 is programmed to make judgments abouteach of the items that contribute to its recommendations. Those judg-ments are conservative enough for you to be confident you will makefew mistakes when selecting a stock to buy. However, the time maycome when you want to be more aggressive. By learning why thejudgments were made, you can acquire the confidence to intelligent-ly override the program’s conservative default values to find morestocks that meet your standards. For obvious reasons, we recom-
Page 15
mend that you do this judiciously, only after you have learned enoughto trust your judgment. Check Additional Resources on page 23 formore learning options.
The Stock Selection GuideThe last drill-down level is NAIC’s Stock Selection Guide (SSG).
For those who are not familiar with the form, it may seem a bit con-fusing at first. The highlighted area on the SSG applies to the infor-mation you are curious about. Here you can see the equations thatproduced the results you have noted in your drilldown. SeeAdditional Resources on page 23 to find out where and how youcan continue your education and learn more about NAIC investing.
PrintingYou can print the Stock Selection Guide by selecting Print from the
File menu.
Advanced ModeOnce you have learned the concepts and are comfortable with
them, you may choose to activate the Advanced mode in Preferences.
Page 16
Doing so will make several changes in how you use NAIC”s Take$tock.
First, new buttons will appear on the Toolbar, and several changesand additions will appear in the Navigation area.
Second, you will be able to save the results of your stock study andcreate a watch list or portfolio of stocks to track. You may work withthese companies off-line if you wish, going on-line only to update dataand prices. Using the Maintenance screen, you can manage your listby ranking, updating, deleting, and evaluating the companies.
Finally, using the five Judgment screens, you will be able to overridethe default judgment values Take $tock 4 conservatively provides.
Let’s look at the advanced features in detail.
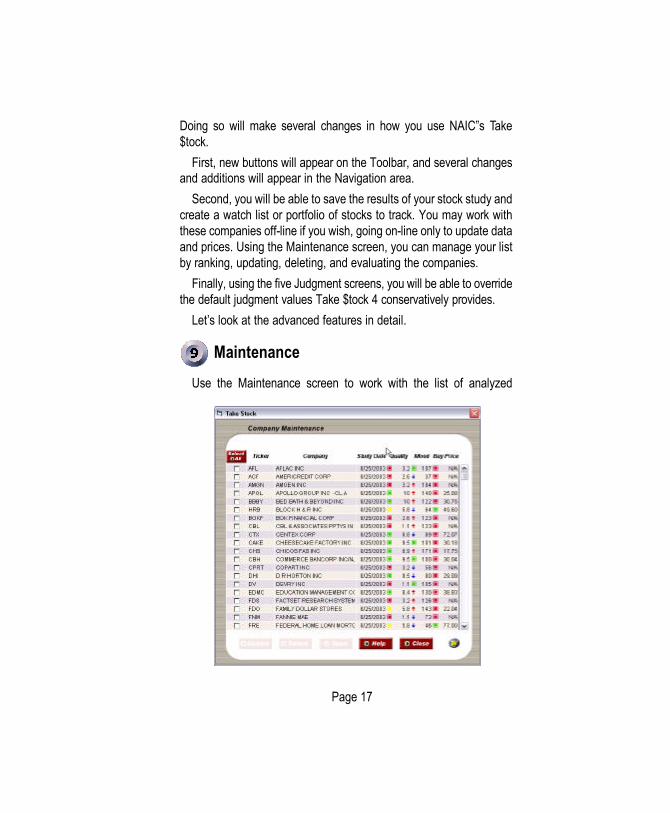
Maintenance
Use the Maintenance screen to work with the list of analyzed
Page 17
stocks you have saved. It’s best to save only those that have beenjudged to be of good quality and for which you are awaiting a suitableprice or those you already own.
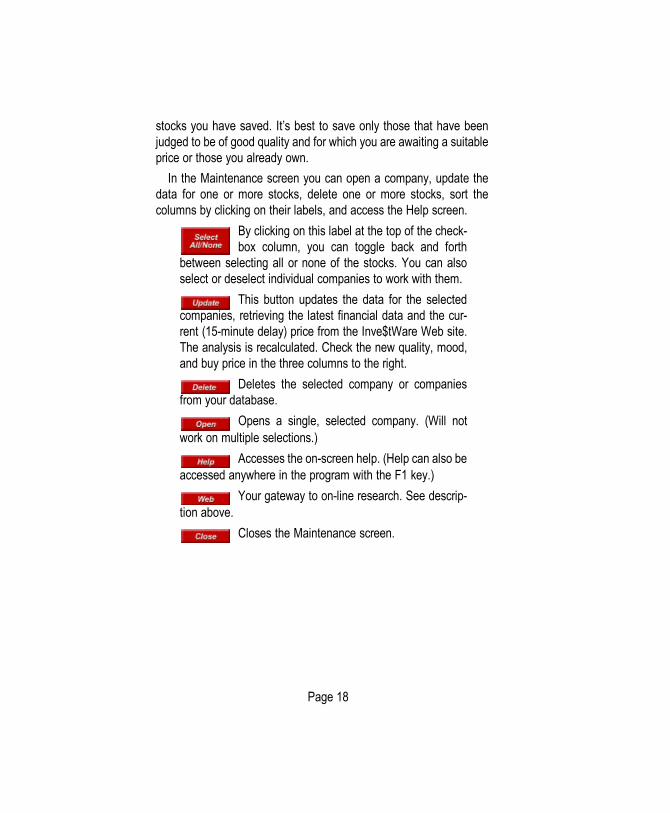
In the Maintenance screen you can open a company, update thedata for one or more stocks, delete one or more stocks, sort thecolumns by clicking on their labels, and access the Help screen.
By clicking on this label at the top of the check-box column, you can toggle back and forth
between selecting all or none of the stocks. You can alsoselect or deselect individual companies to work with them.
This button updates the data for the selectedcompanies, retrieving the latest financial data and the cur-rent (15-minute delay) price from the Inve$tWare Web site.The analysis is recalculated. Check the new quality, mood,and buy price in the three columns to the right.
Deletes the selected company or companiesfrom your database.
Opens a single, selected company. (Will notwork on multiple selections.)
Accesses the on-screen help. (Help can also beaccessed anywhere in the program with the F1 key.)
Your gateway to on-line research. See descrip-tion above.
Closes the Maintenance screen.
Page 18

Judgment The default values used by Take $tock 4 are intended to be con-
servative enough to keep you out of trouble most of the time. TheAdvanced mode gives you the ability to change those judgments ifyou believe you have good reason to do so. Caution: The moreaggressive your judgments, the more risk you invite. Do not makechanges simply to make a company appear more suitable. You canamend judgments in the following five areas:Growth
Estimates of future growth are the heart of this methodology andshould be based on relevant history. It’s often desirable to eliminateany unusual data from the past ten years.
Eliminate OutliersThe assessments of relevant historical sales and earn-
ings growth have already been made by Take $tock. Notethe data in the table above the graph. The data displayed
Page 19
there have been plotted on the first ten years of the chart.Click on the year above the data to remove that year’s datafrom the calculation of historical growth. It’s best to avoideliminating data that would cause an increase in the growthrate. Click either “Override” radio button at the bottom of thescreen to override the default values for historical growth.
Estimate Future GrowthIf you wish to override the default growth rates forecast-
ed by Take $tock, you can do so by entering your own esti-mates of future growth.
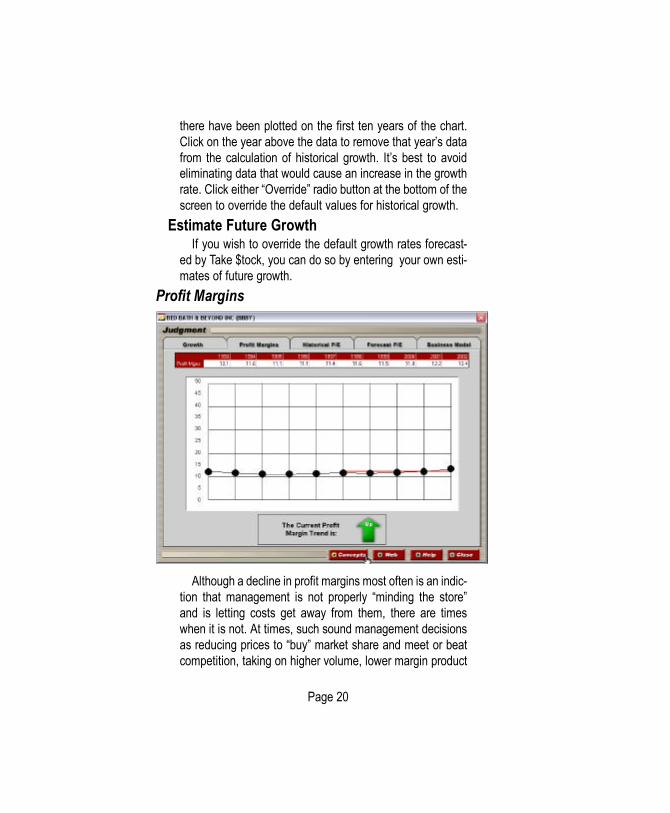
Profit Margins
Although a decline in profit margins most often is an indic-tion that management is not properly “minding the store”and is letting costs get away from them, there are timeswhen it is not. At times, such sound management decisionsas reducing prices to “buy” market share and meet or beatcompetition, taking on higher volume, lower margin product
Page 20
lines, and other such actions will result in a decline. Anexperienced investor will research these conditions whenapplicable and, may elect to disregard this factor by clickingin the “Ignore The Current Trend” check-box. This willchange the red “Down” arrow to yellow and permit calcula-tion of a buy price is all else is favorable.
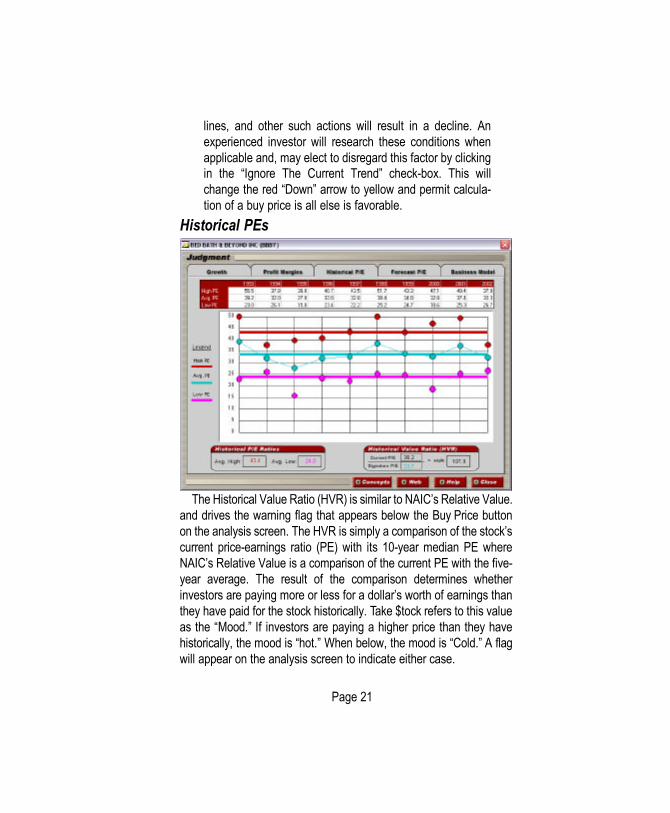
Historical PEs
The Historical Value Ratio (HVR) is similar to NAIC’s Relative Value.and drives the warning flag that appears below the Buy Price buttonon the analysis screen. The HVR is simply a comparison of the stock’scurrent price-earnings ratio (PE) with its 10-year median PE whereNAIC’s Relative Value is a comparison of the current PE with the five-year average. The result of the comparison determines whetherinvestors are paying more or less for a dollar’s worth of earnings thanthey have paid for the stock historically. Take $tock refers to this valueas the “Mood.” If investors are paying a higher price than they havehistorically, the mood is “hot.” When below, the mood is “Cold.” A flagwill appear on the analysis screen to indicate either case.
Page 21
Eliminate OutliersTo calculate a significant average, eliminate any unusual, irrelevant
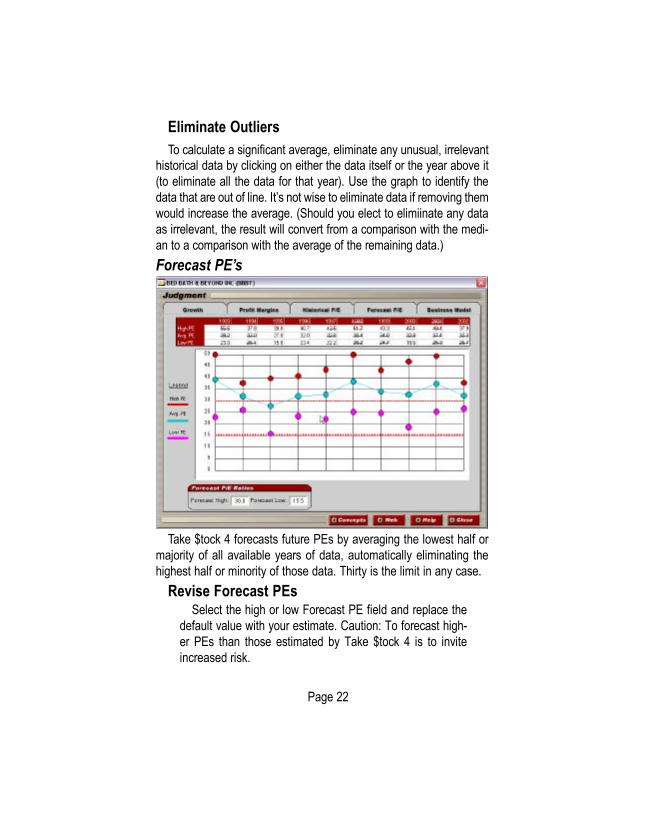
historical data by clicking on either the data itself or the year above it(to eliminate all the data for that year). Use the graph to identify thedata that are out of line. It’s not wise to eliminate data if removing themwould increase the average. (Should you elect to elimiinate any dataas irrelevant, the result will convert from a comparison with the medi-an to a comparison with the average of the remaining data.) Forecast PE’s
Take $tock 4 forecasts future PEs by averaging the lowest half ormajority of all available years of data, automatically eliminating thehighest half or minority of those data. Thirty is the limit in any case.
Revise Forecast PEsSelect the high or low Forecast PE field and replace the
default value with your estimate. Caution: To forecast high-er PEs than those estimated by Take $tock 4 is to inviteincreased risk.
Page 22
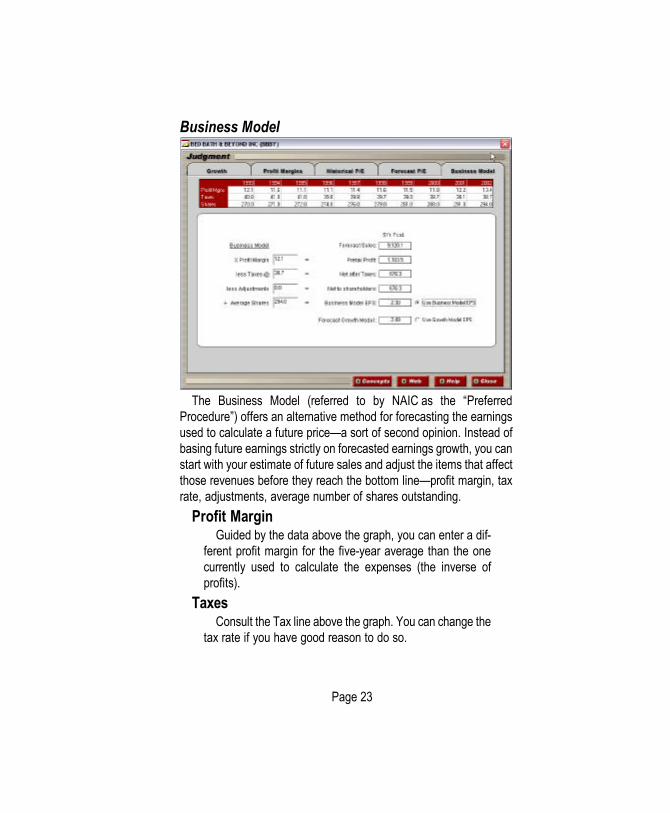
Business Model
The Business Model (referred to by NAIC as the “PreferredProcedure”) offers an alternative method for forecasting the earningsused to calculate a future price— a sort of second opinion. Instead ofbasing future earnings strictly on forecasted earnings growth, you canstart with your estimate of future sales and adjust the items that affectthose revenues before they reach the bottom line— profit margin, taxrate, adjustments, average number of shares outstanding.
Profit MarginGuided by the data above the graph, you can enter a dif-
ferent profit margin for the five-year average than the onecurrently used to calculate the expenses (the inverse ofprofits).
TaxesConsult the Tax line above the graph. You can change the
tax rate if you have good reason to do so.
Page 23
AdjustmentsData for adjustments— especially preferred dividends—
can be obtained from the Market Guide Web site accessedusing the Web button. Go to the Income Statement and lookfor the Adjustments section in the bottom half of the IncomeStatement screen.
Average SharesConsult the share data in the table above the chart for the
average number of shares outstanding. Use the data to helpyou decide if additional shares will be issued (sold). It’s bestnot to reduce the number of shares without good reason.
The resulting calculations will give you another estimate of futureearnings, which you can elect to use. To be conservative, we suggestyou use the lower of the two figures.
Companies at a Glance The companies you have saved in your database are displayed,
with colored symbols for their Quality, Mood, and Buy price, at thelower left side of your screen.
Click the company to open it. The company information will appearin the Status Bar and the initial screen will be displayed showing theQuality Index, Current Price, and Buy Price.
Advanced Toolbar In Advanced mode, three additional buttons are added to the
Toolbar.Update Company
Updates the data and price for the company you arestudying.
Page 24

Reset JudgmentResets all judgment items to the default values suggest-
ed by Take $tock. Save
Saves the company you have studied to your database.It will appear in the Companies at a Glance listing and in theMaintenance screen.
You are ready to use the Advanced mode for investment decisionswhen you are confident you understand the concepts well enough toventure beyond the judgments made automatically by Take $tock.
Page 25
Investing Our WayTo successfully invest in common stocks, you need to know just
two things. Is the company of high enough quality to merit your inter-est as a long-term investment? Is the stock selling at a reasonableprice? Technamental analysis— a graphical study of the company’sfundamentals to make it easier to see the fundamentals stressed asimportant by NAIC— is the safest, surest, and simplest way to answerboth questions.
The PedigreeThe straightforward methods for determining the answers to the
two questions above have been taught by NAIC volunteers for morethan fifty years. Recently, the approach has been discussed in detail,with few modifications, in Take Stock: A Roadmap to Profiting fromYour First Walk down Wall Street by Inve$tWare’s chairman, EllisTraub (Dearborn Trade, 2000). The Take $tock 4 software conserva-tively applies these principles and makes the same decisions youwould make if you applied them after learning how to do so.
Before computers, investors had to spend time learning beforethey could begin investing. Many found the learning process discour-aging and gave up. Others simply didn’t want to do the necessarywork the methodology entailed.
Now, using a computer and NAIC’s Take $tock 4, you can investfirst, and learn as you go along. The education provided by Take$tock 4 gives you the knowledge, expertise, and confidence to over-ride the program’s decisions and substitute your own, more aggres-sive judgments to widen the field of companies to consider. It alsoprepares you to better understand the education provided by thechapters and national organization at their eductional events.
Let’s look briefly at the rationale behind those principles.
Page 26
The Simple ConceptsBy purchasing shares of stock, you become an actual part owner
of the company, not just the purchaser of a piece of paper you maybe able to sell at a price higher than when you bought it.
The distinction is that you’ll rely on an increase in the actual valueof what you own to afford you the opportunity to sell it at a higherprice. Therefore, you will want to own shares of quality companiesthat are able to increase their earnings year after year. A well-runcompany should be able to double its earnings every five years (a 15percent average growth rate). Finding a quality company is the firststep.
If, and only if, the company you’re interested in meets your qualitystandards are you interested in the second step— determining a rea-sonable price for the stock.
For a good company to be a successful investment, its stock mustbe reasonably priced. As the company’s earnings double every fiveyears, its stock price can also be expected to double.
Finding high quality companies at a reasonable price is what Take$tock 4 will help you do. This is how:
Quality. Only two questions need to be answered to determine if acompany is a high quality, well-run company. Are its sales and earn-ings growing predictably and at a rate that could double your invest-ment in five years; and can management sustain that rate?
NAIC’s Take $tock 4 answers these questions for you. First, it ana-lyzes the company’s sales and earnings predictability and growthrates. Second, it analyzes profit margin and return-on-equity trends toevaluate management. The software identifies any area in which thecompany fails to meet the required and desired standards. If it doesnot meet those standards for quality, no price could be a bargain.
Price. On the other hand, no matter how good the company’s qual-ity, if its stock is overpriced, it is still a poor investment. NAIC’s Take$tock 4 evaluates the price by determining, among other things,
Page 27

whether the potential return is sufficient, and whether the risk at thatprice is reasonable.
From historical data, the program makes conservative estimates offuture earnings and PE ratios. Using these estimates, or estimatesyou have made having implemented the Judgment Wizard, the soft-ware determines a reasonable estimate for the highest and lowestprices the stock might be expected to reach within the next five years.Based on the current price of the stock, the program forecasts thepotential gain and loss and evaluates the potential risk and rewardinvolved in owning the stock.
Take $tock 4 also analyzes the historical multiples investors havebeen willing to pay for the stock and suggests things to watch for ifthe stock is currently out of favor or if it is selling at an inflated price.
In plain English, NAIC”s Take $tock 4 applies conservative guide-lines for making the buy/don’t buy decisions, and teaches the investorin simple terms exactly why those decisions are made.
Drilling down reveals additional details about each of the qualityand price criteria components. Using this information, the newinvestor can learn enough and develop sufficient confidence to takeadvantage of options the program offers the advanced user to over-ride the program’s default judgments and employ more flexible stan-dards when evaluating stocks.
Page 28
Portfolio Management: An Important WordThe first and most important step to becoming a successful investor
is to select and purchase quality companies at a reasonable price. Thesecond and final task is to monitor your portfolio. Because you havepurchased stock in high quality companies and plan to hold it for thelong term, following your portfolio requires little time and effort. Unlessyou need the money, there are only two reasons for selling any stock.
Defensive StrategyFirst, sell if the quality of the company declines— if its earnings or
sales growth declines significantly below your expectations— due to aserious problem beyond management’s control or something that willaffect the company for the long term. Use the Web sites listed in Take$tock 4 to research the reasons for the quality slip. If it turns out to bea short-term problem that any management faces from time to time,hold the stock, and give management a reasonable chance to correctthe problem. If it is a long-term serious problem, sell before the stockdamages you portfolio’s performance.
You can easily monitor your portfolio for such situations by usingthe Maintenance screen in Advanced mode.
1) Click on the label at the top of the Quality column to sort thecompanies by Quality Index. Click until they are ranked frombest quality to worst (greens at the top).
2) Click on the “Select All”button.3) Click on the “Update” button and watch as the program pro-
gressively updates the data for each company. 4) Those that have slipped will turn red or yellow. 5) Open each company that displays a lower-than-desired Quality
Index to check the details. Use the Web button to research thereasons for the company’s poor performance.
6) Replace with good quality companies those you believe will notreturn to satisfactory operation in a reasonable time
Page 29
Offensive StrategySecond, sell if you can do better with another stock of as good or
better quality. Look for overvalued stocks in your portfolio. 1) In Advanced mode, sort the Companies at a Glance to bring the
“Hot” companies to the top in the Mood column. 2) Starting at the top, click on each that is in your portfolio (they
should presumably display as green in the Quality column if theyhave survived your defensive review).
3) Click on Screen 5 and 6 in the Navigational Map to check thereturn you can expect from those stocks, and risk you will besubject to respectively.
4) When you encounter one whose return us insufficient or risk isexcessive, click on the Judgment screen to access the Growthscreen where you should update your estimate of earningsgrowth to a value closer to its actual growth. Update theForecast high PE in the same fashion.
5) Recheck return and risk to see if the overvalued state remains.6) Replace those that are still overvalued with companies of equal
or better quality and a better potential return.Using Take $tock 4 to select your stocks and holding them for the
long term (unless their operating record disappoints you or they’reovervalued) should produce four winners out of every five, and dou-ble your money every five years.
Page 30

Additional ResourcesIf you’re interested in additional education beyond the simple basicsNAIC’s Take $tock 4 offers, we recommend the following:
Take StockRead Take Stock: A Roadmap to Profiting from Your First Walk
Down Wall Street by Ellis Traub. This easy-to-understand bookdescribes in detail the concepts and methods that Take $tock 4 uses.This step-by-step methodology is applied in both the TechnamentalStock Study Worksheet and in the Stock Selection Guide©. TakeStock is available in your local bookstore or on Amazon.com at:
http://www.amazon.com/exec/obidos/ASIN/0793141494.
NAICJoin NAIC, a nonprofit, educational organization. Its thousands of
volunteers are happy to offer others, at low or no cost, the benefits ofthe investment education they have received. The organization offersa variety of services to amateur investors who invest successfullyusing this methodology.Local Chapters and Clubs
Across the nation more than 115 active NAIC chapters are ready tohelp investors learn this approach. The chapters support both indi-vidual investors and investment clubs. Check the Better InvestingWeb site (http://www.better-investing.org) for the chapter in your localarea (found on the right side of the Home page). Or call NAIC head-quarters, toll free, at (877) 275-6242. When you join NAIC, you will benotified of educational events taking place in your area. Regionaleducational events are also listed each month in the back of theBetter Investing magazine.
Networking On-LineParticipate in one of NAIC’s most valuable educational resources—
the on-line “I-Club,” or the CompuServe NAIC Forum. There you will
Page 31

find thousands of others just like you, asking and answering ques-tions. This is an excellent way to network and continue your learningexperiences. Point to http://www.better-investing.org and join I-Clubor http://forums.compuserve.com/vlforums/default.asp?SRV=NAICto sign up for the forum. Both are free of charge.
Page 32
Technical SupportQuestions about the investment methodology that
are not answered in this document or in the“Concepts” screens can best be answered by takingadvantage of the additional resources listed above.Take $tock is intended to be intuitive and user-friend-ly; but, if you have problems with the program itself,you may avail yourself of the resources listed below.Internet
Check Inve$tWare’s Web site at http://www.invest-ware.com for frequently asked questions about Take$tock 4. If you have a question or problem, probablyothers have had it, too. If the problem is universal,we’ll post it. E-Mail
Send a message to [email protected] should receive an answer within an hour; but inno case later than the same time on the next busi-ness day. Telephone
Call Inve$tWare support at (954) 723-9910