Embed Size (px)
DESCRIPTION
nalco
Citation preview
Corporate Presentation
National Aluminium Company Limited (A Govt. of India Enterprise)
February 2013

Corporate Presentation February 2013
Disclaimer
This presentation does not constitute or form part of any offer or invitation or inducement to sell or issue, or any solicitation of any offer to purchase or subscribe for, any securities of National Aluminium Company Limited (the “Company”), nor shall it or any part of it or the fact of its distribution form the basis of, or be relied on in connection with, any contract or commitment therefor.
This presentation may include statements which may constitute forward-looking statements. All statements that address expectations or projections about the future, including, but not limited to, statements about the strategy for growth, business development, market position, expenditures, and financial results, are forward looking statements. Forward looking statements are based on certain assumptions and expectations of future events. The Company cannot guarantee that these assumptions and expectations are accurate or will be realised. The actual results, performance or achievements, could thus differ materially from those projected in any such forward-looking statements. The Company assumes no responsibility to publicly amend, modify or revise any forward-looking statements, on the basis of any subsequent developments, information or events, or otherwise.
The information contained in these materials has not been independently verified. None of the Company, its Directors, Promoter or affiliates, nor any of its or their respective employees, advisers or representatives or any other person accepts any responsibility or liability whatsoever, whether arising in tort, contract or otherwise, for any errors, omissions or inaccuracies in such information or opinions or for any loss, cost or damage suffered or incurred howsoever arising, directly or indirectly, from any use of this document or its contents or otherwise in connection with this document, and makes no representation or warranty, express or implied, for the contents of this document including its accuracy, fairness, completeness or verification or for any other statement made or purported to be made by any of them, or on behalf of them, and nothing in this document or at this presentation shall be relied upon as a promise or representation in this respect, whether as to the past or the future. The information and opinions contained in this presentation are current, and if not stated otherwise, made as of the date of this presentation. The Company undertake no obligation to update or revise any information or the opinions expressed in this presentation as a result of new information, future events or otherwise. Any opinions expressed in this presentation are subject to change without notice. No part of the information provided herein is to be construed as a solicitation to make any financial investment and is provided for information only. Any person / party intending to provide finance / invest in the shares / businesses of the Company shall do so after seeking their own professional advice and after carrying out their own due diligence procedure to ensure that they are making an informed decision.
This presentation is strictly confidential and may not be copied or disseminated, in whole or in part, and in any manner or for any purpose. No person is authorised to give any information or to make any representation not contained in or inconsistent with this presentation and if given or made, such information or representation must not be relied upon as having been authorized by any person. Failure to comply with this restriction may constitute a violation of the applicable securities laws. This presentation is not intended for distribution or publication in the United States. Neither this document nor any part or copy of it may be distributed, directly or indirectly, in the United States. The distribution of this document in certain jurisdictions may be restricted by law and persons into whose possession this presentation comes should inform themselves about and observe any such restrictions. By participating in this presentation or by accepting any copy of the slides presented, you agree to be bound by the foregoing limitations. You further represent and agree that (i) you are located outside the United States and you are permitted under the laws of your jurisdiction to receive this presentation or (ii) you are located in the United States and are a "qualified institutional buyer" (as defined in Rule 144A under the Securities Act of 1933 (the "Securities Act")).
This presentation is not an offer to sell or a solicitation of any offer to buy the securities of the Company in the United States or in any other jurisdiction where such offer or sale would be unlawful. Securities may not be offered, sold, resold, pledged, delivered, distributed or transferred, directly or indirectly, into or within the United States absent registration under the Securities Act, except pursuant to an exemption from, or in a transaction not subject to, the registration requirements of the Securities Act and in compliance with any applicable securities laws of any state or other jurisdiction of the United States.
2

Corporate Presentation February 2013
Table of Contents
3
In this document upto Q3FY13 refers to the nine month period ended 31st December, 2012, and Q3 FY 13 refers to the three month period ended 31st December, 2012.
Overview of NALCO
Production & Sales
Aluminium – Domestic & Global Demand
Financials
Our Expansion Projects
Projects Completed & Under Construction
Projects Under Planning
1
2
3
4
5
6
7
Page #
4
9
13
16
19
22
27
Awards and Governance 8 32

Corporate Presentation February 2013
Overview of NALCO
1
Corporate Presentation February 2013
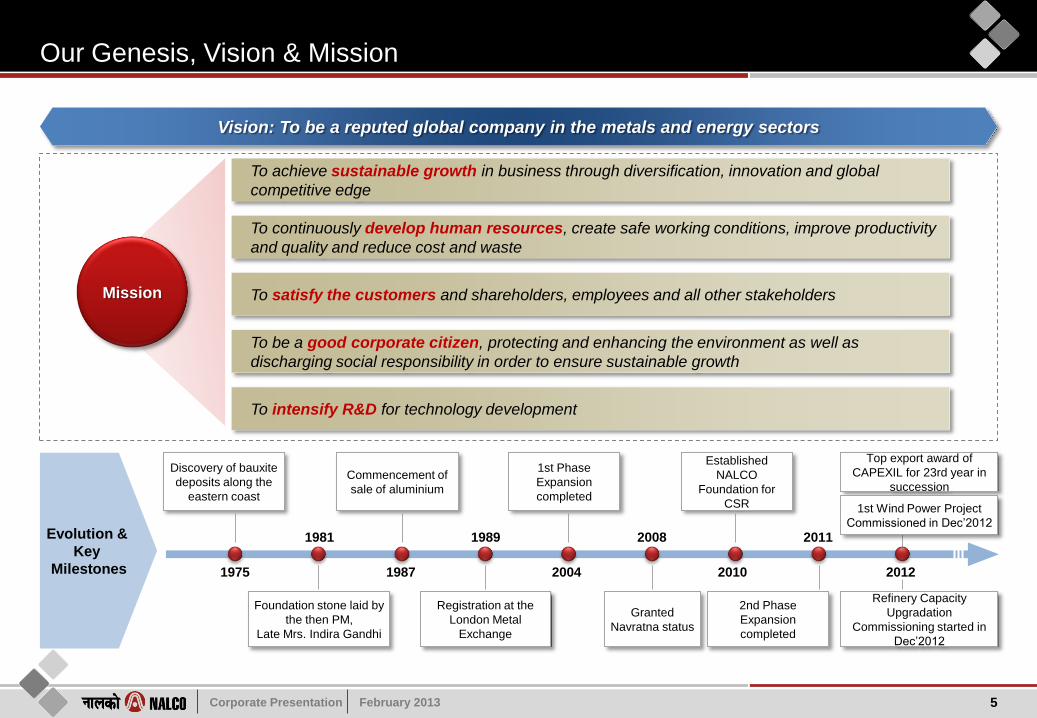
Our Genesis, Vision & Mission
5
Evolution &
Key
Milestones
Discovery of bauxite
deposits along the
eastern coast
Foundation stone laid by
the then PM,
Late Mrs. Indira Gandhi
Registration at the
London Metal
Exchange
1st Phase
Expansion
completed
Granted
Navratna status
Established
NALCO
Foundation for
CSR
2nd Phase
Expansion
completed
Commencement of
sale of aluminium
Top export award of
CAPEXIL for 23rd year in
succession
1975
1981
1987
1989
2004
2008 2011
2010 2012
Refinery Capacity
Upgradation
Commissioning started in
Dec’2012
1st Wind Power Project
Commissioned in Dec’2012
Vision: To be a reputed global company in the metals and energy sectors
To achieve sustainable growth in business through diversification, innovation and global
competitive edge
To continuously develop human resources, create safe working conditions, improve productivity
and quality and reduce cost and waste
To satisfy the customers and shareholders, employees and all other stakeholders
To be a good corporate citizen, protecting and enhancing the environment as well as
discharging social responsibility in order to ensure sustainable growth
To intensify R&D for technology development
Mission
Corporate Presentation February 2013
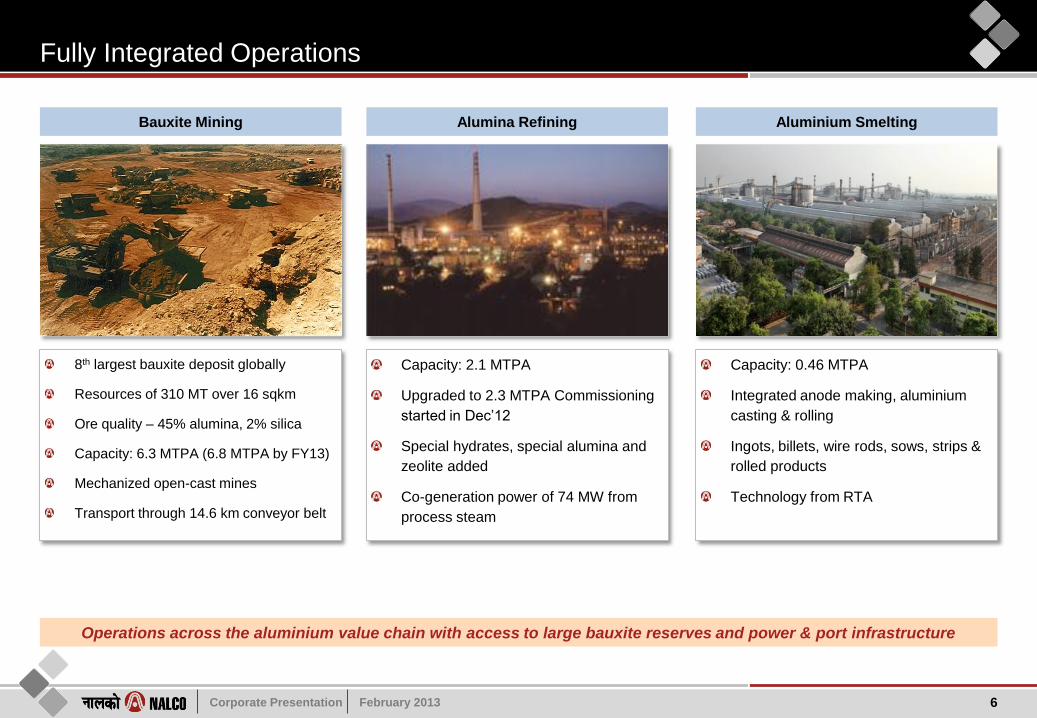
Fully Integrated Operations
6
8th largest bauxite deposit globally
Resources of 310 MT over 16 sqkm
Ore quality – 45% alumina, 2% silica
Capacity: 6.3 MTPA (6.8 MTPA by FY13)
Mechanized open-cast mines
Transport through 14.6 km conveyor belt
Capacity: 2.1 MTPA
Upgraded to 2.3 MTPA Commissioning
started in Dec’12
Special hydrates, special alumina and
zeolite added
Co-generation power of 74 MW from
process steam
Capacity: 0.46 MTPA
Integrated anode making, aluminium
casting & rolling
Ingots, billets, wire rods, sows, strips &
rolled products
Technology from RTA
Operations across the aluminium value chain with access to large bauxite reserves and power & port infrastructure
Bauxite Mining Alumina Refining Aluminium Smelting

Corporate Presentation February 2013
Fully Integrated Operations
7
Operations across the aluminium value chain with access to large bauxite reserves and power & port infrastructure
Capacity: 1,200 MW
High PLF
Zero effluent discharge
Advanced electro-static precipitator for
pollution control
Captive Thermal Power Plant
Capacity: 50.4 MW Wind Power Project
in Gandikota, A.P.
Power Purchase Agreement (PPA) was
signed by NALCO with APSPDCL
(DISCOM) on 22.12.2012.
Commissioned in Dec’2012
Wind Power Project-I
Capacity to handle ships up to 40,000
DWT
Export of alumina & import of caustic
soda
Mechanized mobile ship loader
Mechanized storage and handling
facility
Port Facilities
Corporate Presentation February 2013
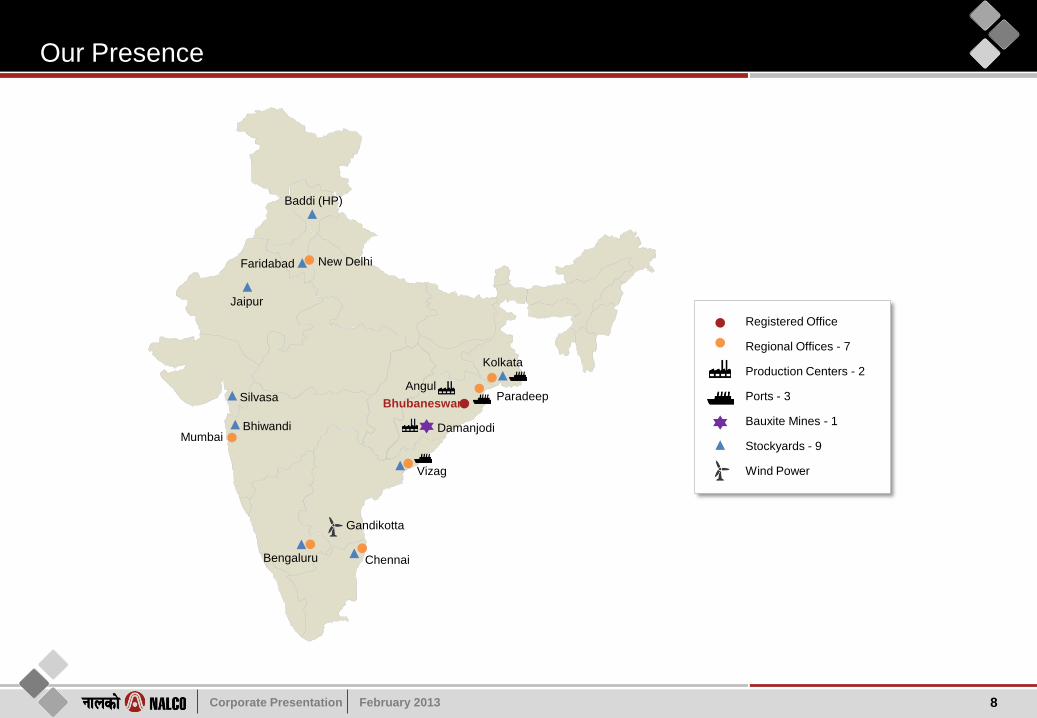
Our Presence
8
Bhubaneswar
Chennai Bengaluru
Bhiwandi
Silvasa
Jaipur
Faridabad
Baddi (HP)
Kolkata
Vizag
Paradeep
New Delhi
Angul
Damanjodi
Gandikotta
Registered Office
Regional Offices - 7
Production Centers - 2
Ports - 3
Bauxite Mines - 1
Stockyards - 9
Wind Power
Mumbai

Corporate Presentation February 2013
Production & Sales
2
Corporate Presentation February 2013
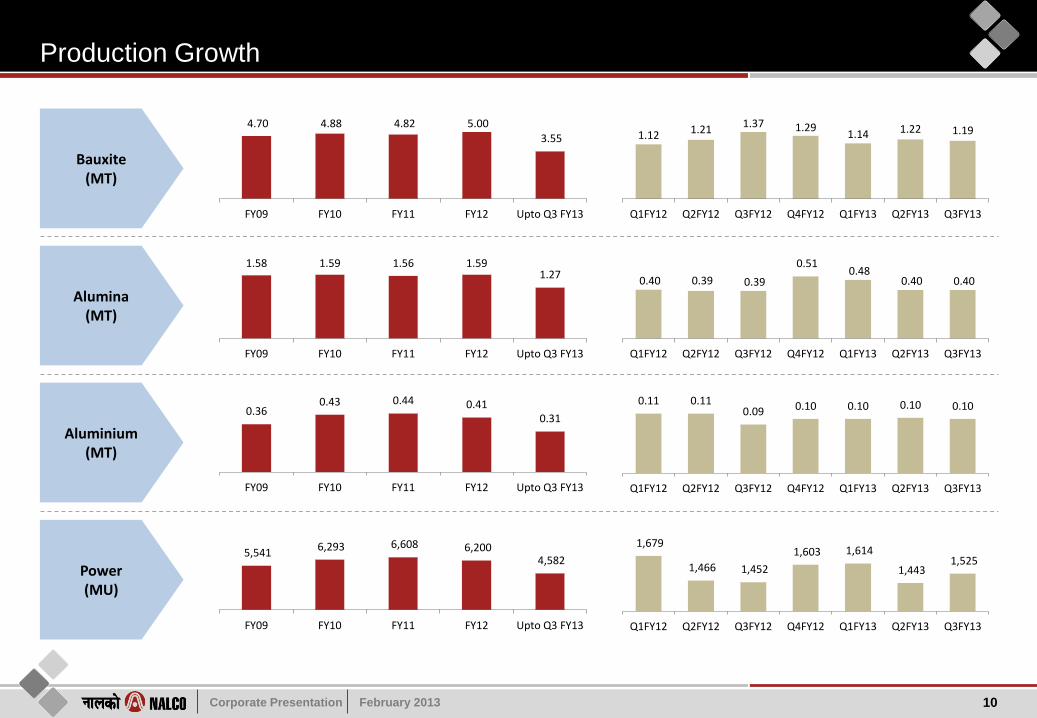
Production Growth
10
Bauxite (MT)
Alumina (MT)
Aluminium (MT)
Power (MU)
4.70 4.88 4.82 5.00 3.55
FY09 FY10 FY11 FY12 Upto Q3 FY13
1.12 1.21 1.37 1.29
1.14 1.22 1.19
Q1FY12 Q2FY12 Q3FY12 Q4FY12 Q1FY13 Q2FY13 Q3FY13
1.58 1.59 1.56 1.59 1.27
FY09 FY10 FY11 FY12 Upto Q3 FY13
0.40 0.39 0.39
0.51 0.48
0.40 0.40
Q1FY12 Q2FY12 Q3FY12 Q4FY12 Q1FY13 Q2FY13 Q3FY13
0.36 0.43 0.44 0.41
0.31
FY09 FY10 FY11 FY12 Upto Q3 FY13
0.11 0.11 0.09 0.10 0.10 0.10 0.10
Q1FY12 Q2FY12 Q3FY12 Q4FY12 Q1FY13 Q2FY13 Q3FY13
5,541 6,293 6,608 6,200
4,582
FY09 FY10 FY11 FY12 Upto Q3 FY13
1,679
1,466 1,452
1,603 1,614
1,443 1,525
Q1FY12 Q2FY12 Q3FY12 Q4FY12 Q1FY13 Q2FY13 Q3FY13
Corporate Presentation February 2013
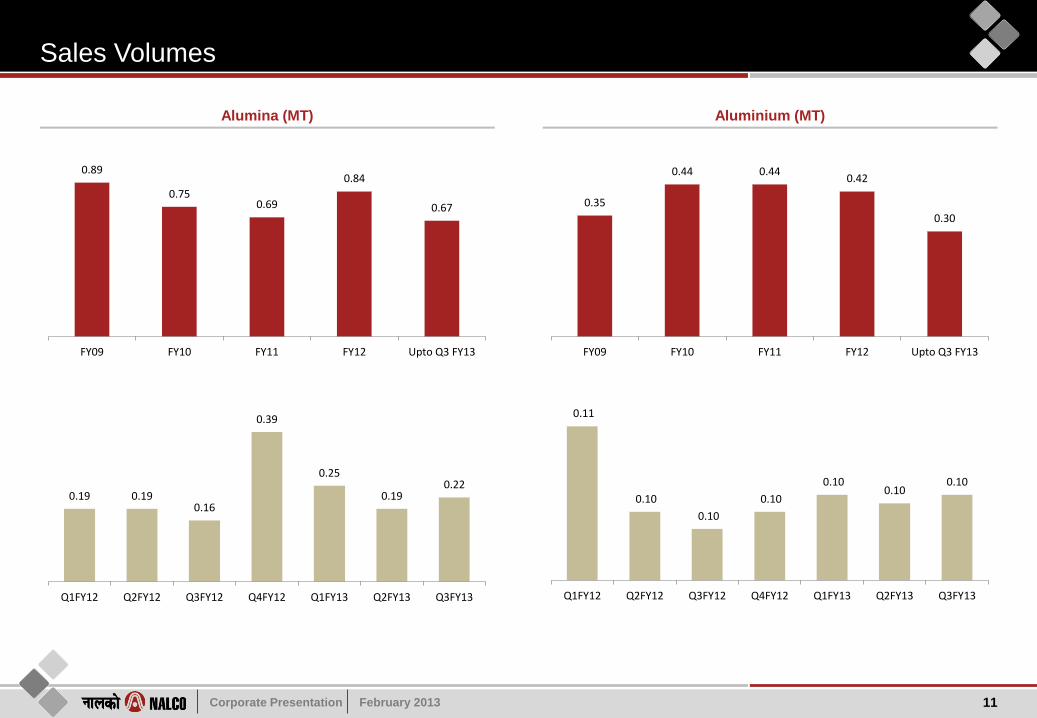
Sales Volumes
11
Alumina (MT)
Aluminium (MT)
0.89
0.75 0.69
0.84
0.67
FY09 FY10 FY11 FY12 Upto Q3 FY13
0.35
0.44 0.44 0.42
0.30
FY09 FY10 FY11 FY12 Upto Q3 FY13
0.19 0.19 0.16
0.39
0.25
0.19 0.22
Q1FY12 Q2FY12 Q3FY12 Q4FY12 Q1FY13 Q2FY13 Q3FY13
0.11
0.10
0.10
0.10
0.10 0.10
0.10
Q1FY12 Q2FY12 Q3FY12 Q4FY12 Q1FY13 Q2FY13 Q3FY13
Corporate Presentation February 2013
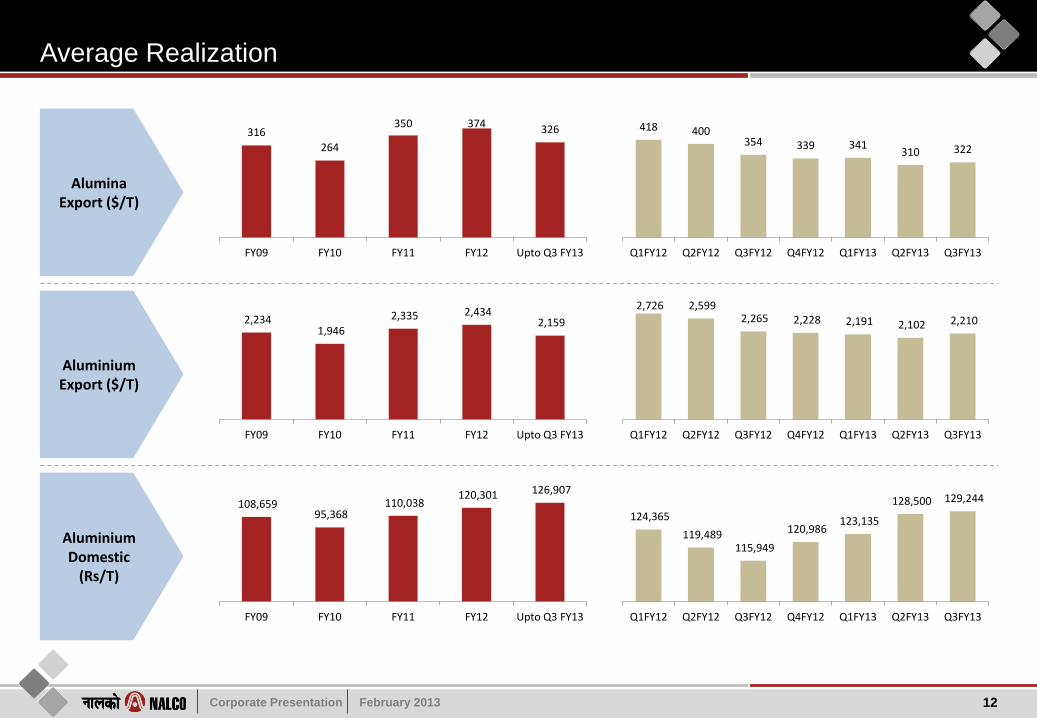
Average Realization
12
Alumina Export ($/T)
Aluminium Export ($/T)
Aluminium Domestic
(Rs/T)
316
264
350 374 326
FY09 FY10 FY11 FY12 Upto Q3 FY13
418 400 354 339 341
310 322
Q1FY12 Q2FY12 Q3FY12 Q4FY12 Q1FY13 Q2FY13 Q3FY13
2,234 1,946
2,335 2,434 2,159
FY09 FY10 FY11 FY12 Upto Q3 FY13
2,726 2,599 2,265 2,228 2,191 2,102 2,210
Q1FY12 Q2FY12 Q3FY12 Q4FY12 Q1FY13 Q2FY13 Q3FY13
108,659 95,368
110,038 120,301 126,907
FY09 FY10 FY11 FY12 Upto Q3 FY13
124,365
119,489 115,949
120,986 123,135
128,500 129,244
Q1FY12 Q2FY12 Q3FY12 Q4FY12 Q1FY13 Q2FY13 Q3FY13

Corporate Presentation February 2013
Aluminium – Domestic & Global Demand
3

Corporate Presentation February 2013
India Demand Outlook
14
Consumption Pattern(1)
Consumer appliance market expected to see significant upsides
on account of rapid urbanization and growth in the economy
India is one of the world’s largest auto markets
While power and construction are seeing short term headwinds,
given the “deficits” – they are likely to see continuing investments
Drivers for End Use
Per Capita Consumptions (Kg)(2)
Share of Major Primary Producers (FY 12)
Transport 28%
Construction 20%
Packaging 18%
Electrical 11%
Consumer Durables
6%
Machinery & Equipment
9%
Other 8%
World
Transport 15%
Construction 13%
Packaging 4%
Electrical 48%
Consumer Durables
7%
Machinery & Equipment
7%
Other 6%
India
1.8
6.8
16.7 16.7
22.3 26.2 27.6
38.2
8
IN BRZ CHN CNDA USA ITLY JAP GER Wrld Avg.
(1) Source: EAA, US GS, INDIASTATS, CRU (2) Source: IMF, Industry Estimates
NALCO 25%
HINDALCO 35%
VEDANTA 40%

Corporate Presentation February 2013
Global supply-demand scenario
2009 2010 2011 2012
Global Primary Aluminum Prodn. 37.67 41.94 45.61 47.07
Global Primary Aluminum Demand 34.31 40.96 44.92 46.61
Net Surplus/-Deficit 3.36 0.97 0.69 0.45
15
Aluminum Supply/Demand (MT)(1)
LME Trend
(1) World Bureau of Metal Statistics
2,584
2,227
1,866
2,257 2,318
40.2
45.8
47.1
45.6
48.0
FY08 FY09 FY10 FY11 FY12
Avg. LME (USD) Avg. USD/INR

Corporate Presentation February 2013
Financials
4
Corporate Presentation February 2013
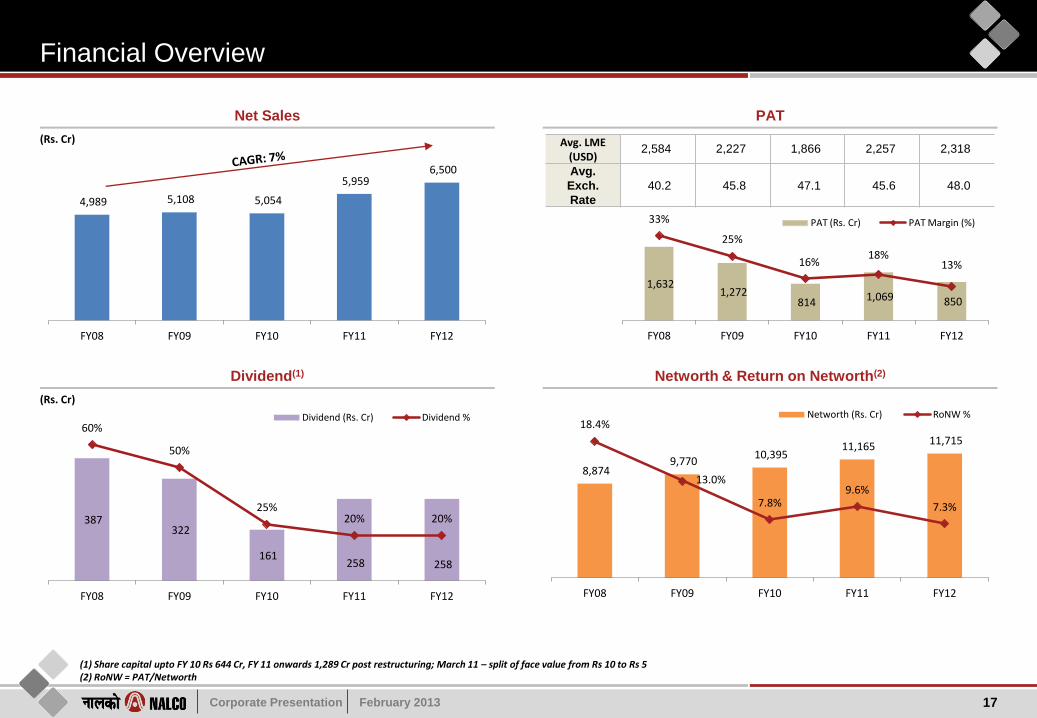
Financial Overview
17
Net Sales
Dividend(1)
PAT
Networth & Return on Networth(2)
(1) Share capital upto FY 10 Rs 644 Cr, FY 11 onwards 1,289 Cr post restructuring; March 11 – split of face value from Rs 10 to Rs 5 (2) RoNW = PAT/Networth
4,989 5,108 5,054
5,959 6,500
FY08 FY09 FY10 FY11 FY12
1,632 1,272
814 1,069 850
33%
25%
16% 18%
13%
FY08 FY09 FY10 FY11 FY12
PAT (Rs. Cr) PAT Margin (%)
387 322
161 258 258
60%
50%
25% 20% 20%
FY08 FY09 FY10 FY11 FY12
Dividend (Rs. Cr) Dividend %
(Rs. Cr)
(Rs. Cr)
8,874 9,770
10,395 11,165 11,715
18.4%
13.0%
7.8% 9.6%
7.3%
FY08 FY09 FY10 FY11 FY12
Networth (Rs. Cr) RoNW %
Avg. LME (USD)
2,584 2,227 1,866 2,257 2,318
Avg.
Exch.
Rate
40.2 45.8 47.1 45.6 48.0
Corporate Presentation February 2013
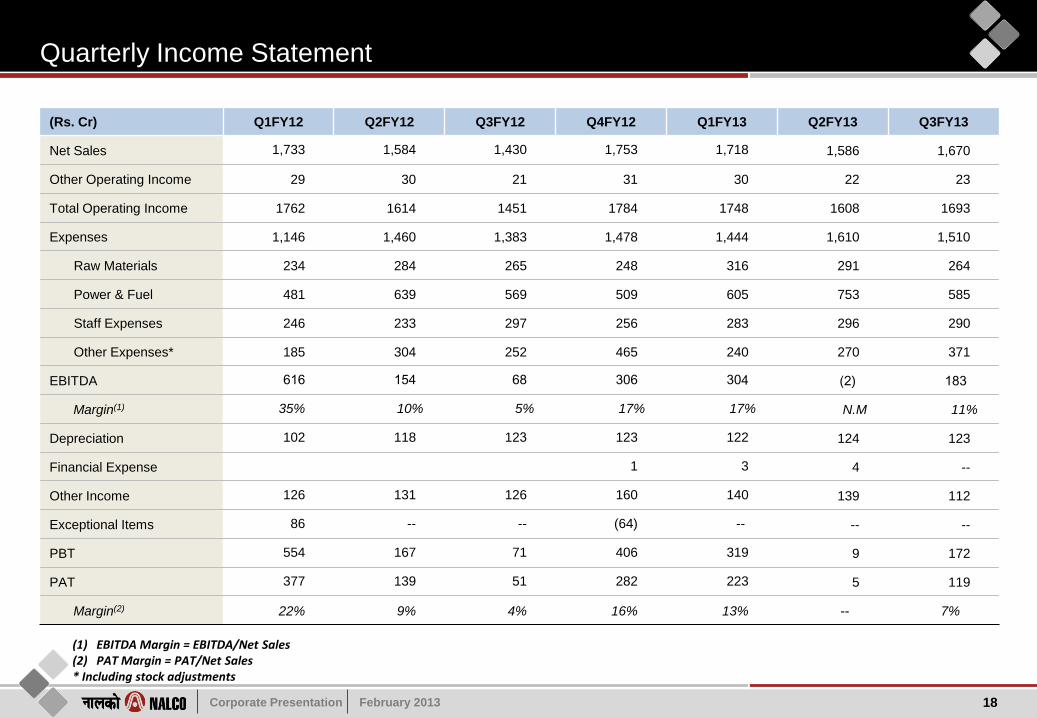
Quarterly Income Statement
18
(1) EBITDA Margin = EBITDA/Net Sales (2) PAT Margin = PAT/Net Sales * Including stock adjustments
(Rs. Cr) Q1FY12 Q2FY12 Q3FY12 Q4FY12 Q1FY13 Q2FY13 Q3FY13
Net Sales 1,733 1,584 1,430 1,753 1,718 1,586 1,670
Other Operating Income 29 30 21 31 30 22 23
Total Operating Income 1762 1614 1451 1784 1748 1608 1693
Expenses 1,146 1,460 1,383 1,478 1,444 1,610 1,510
Raw Materials 234 284 265 248 316 291 264
Power & Fuel 481 639 569 509 605 753 585
Staff Expenses 246 233 297 256 283 296 290
Other Expenses* 185 304 252 465 240 270 371
EBITDA 616 154 68 306 304 (2) 183
Margin(1) 35% 10% 5% 17% 17% N.M 11%
Depreciation 102 118 123 123 122 124 123
Financial Expense 1 3 4 --
Other Income 126 131 126 160 140 139 112
Exceptional Items 86 -- -- (64) -- -- --
PBT 554 167 71 406 319 9 172
PAT 377 139 51 282 223 5 119
Margin(2) 22% 9% 4% 16% 13% -- 7%

Corporate Presentation February 2013
Our Expansion Projects
5
Corporate Presentation February 2013
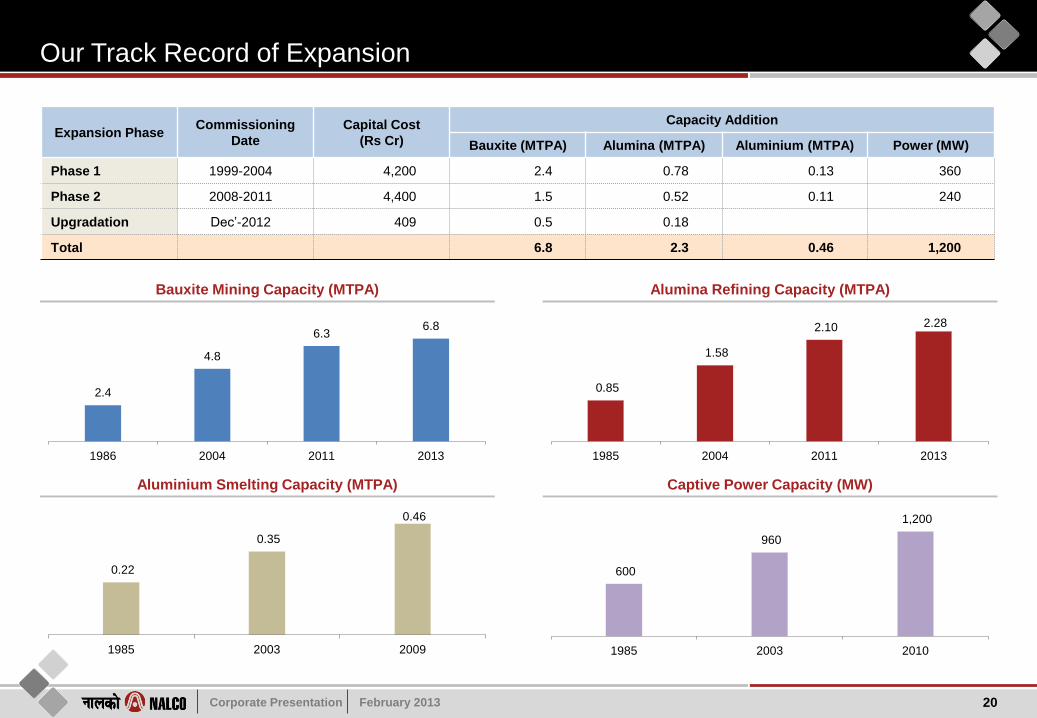
Our Track Record of Expansion
2.4
4.8
6.3 6.8
1986 2004 2011 2013
20
Bauxite Mining Capacity (MTPA)
Aluminium Smelting Capacity (MTPA)
0.85
1.58
2.10 2.28
1985 2004 2011 2013
Alumina Refining Capacity (MTPA)
Captive Power Capacity (MW)
0.22
0.35
0.46
1985 2003 2009
600
960
1,200
1985 2003 2010
Expansion Phase Commissioning
Date
Capital Cost
(Rs Cr)
Capacity Addition
Bauxite (MTPA) Alumina (MTPA) Aluminium (MTPA) Power (MW)
Phase 1 1999-2004 4,200 2.4 0.78 0.13 360
Phase 2 2008-2011 4,400 1.5 0.52 0.11 240
Upgradation Dec’-2012 409 0.5 0.18
Total 6.8 2.3 0.46 1,200
Corporate Presentation February 2013
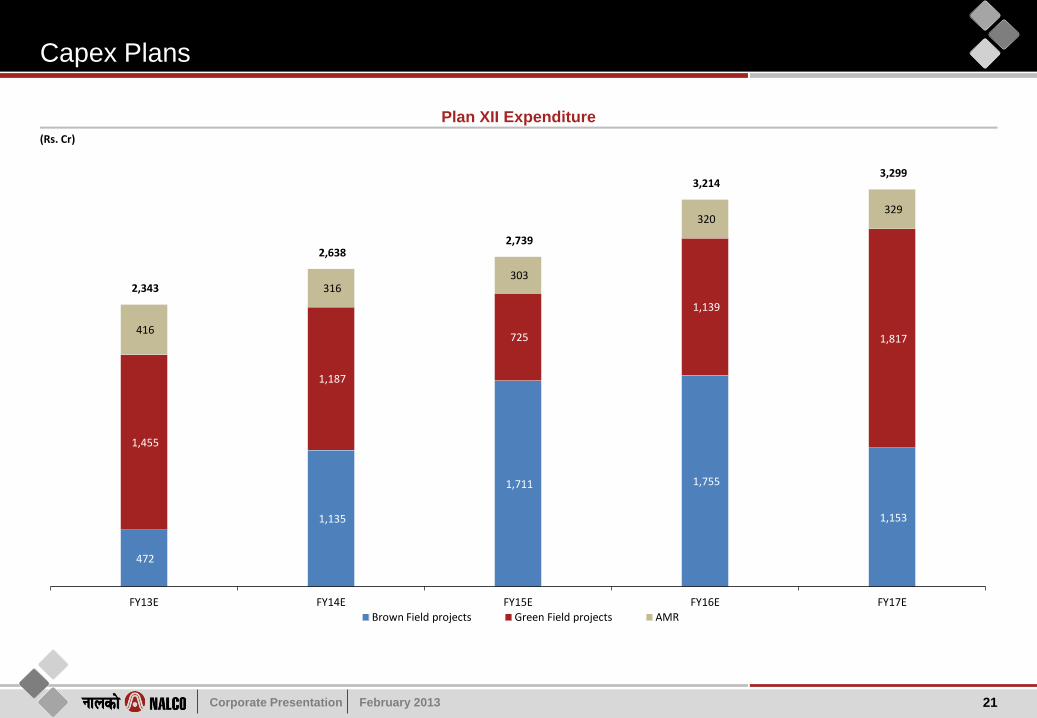
Capex Plans
21
Plan XII Expenditure
472
1,135
1,711 1,755
1,153
1,455
1,187
725
1,139
1,817 416
316 303
320 329
2,343
2,638 2,739
3,214 3,299
FY13E FY14E FY15E FY16E FY17E
Brown Field projects Green Field projects AMR
(Rs. Cr)
Corporate Presentation February 2013
Projects Completed & Under Construction
6
Corporate Presentation February 2013
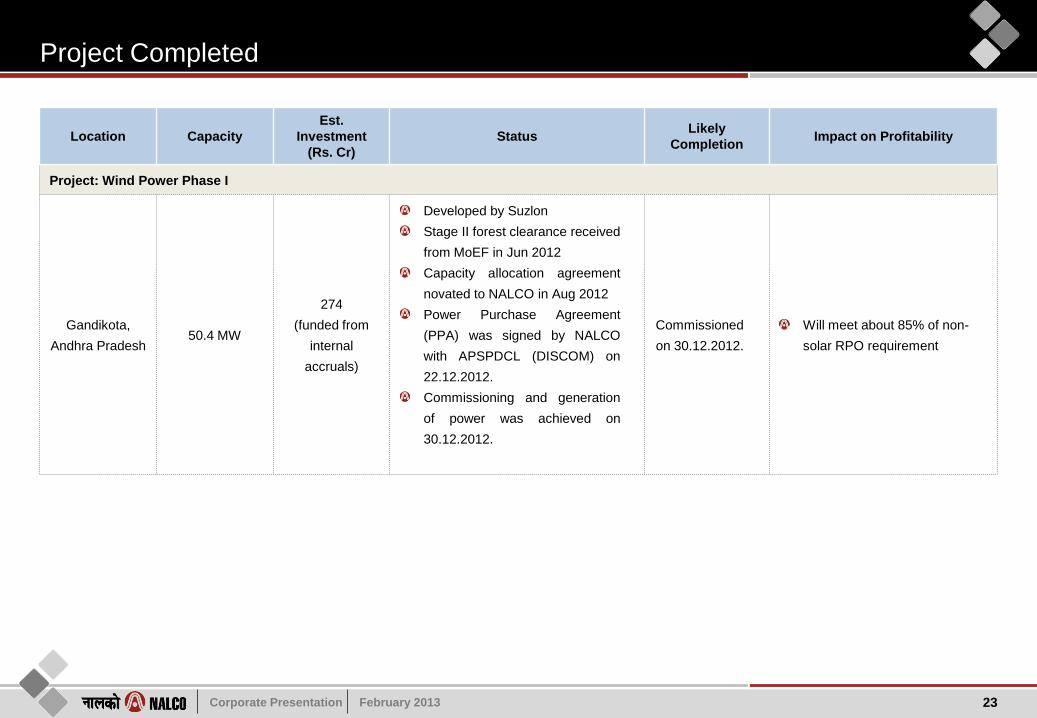
Project Completed
Location Capacity
Est.
Investment
(Rs. Cr)
Status Likely
Completion Impact on Profitability
Project: Wind Power Phase I
Gandikota,
Andhra Pradesh 50.4 MW
274
(funded from
internal
accruals)
Developed by Suzlon
Stage II forest clearance received
from MoEF in Jun 2012
Capacity allocation agreement
novated to NALCO in Aug 2012
Power Purchase Agreement
(PPA) was signed by NALCO
with APSPDCL (DISCOM) on
22.12.2012.
Commissioning and generation
of power was achieved on
30.12.2012.
Commissioned
on 30.12.2012.
Will meet about 85% of non-
solar RPO requirement
23
Corporate Presentation February 2013
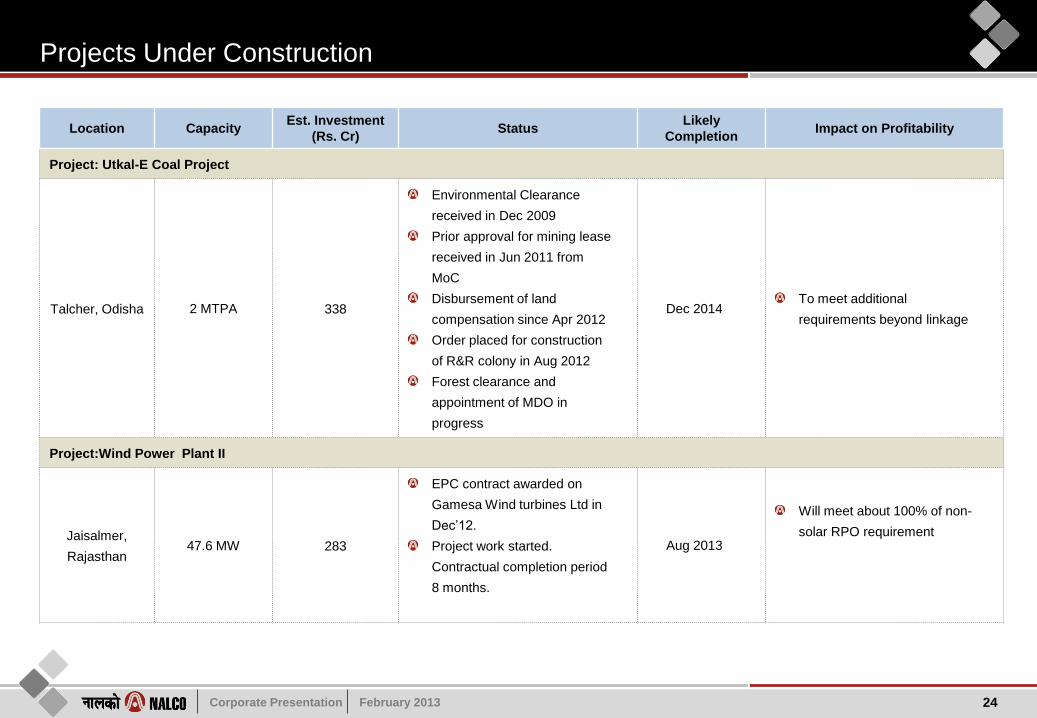
Projects Under Construction
Location Capacity Est. Investment
(Rs. Cr) Status
Likely
Completion Impact on Profitability
Project: Utkal-E Coal Project
Talcher, Odisha 2 MTPA 338
Environmental Clearance
received in Dec 2009
Prior approval for mining lease
received in Jun 2011 from
MoC
Disbursement of land
compensation since Apr 2012
Order placed for construction
of R&R colony in Aug 2012
Forest clearance and
appointment of MDO in
progress
Dec 2014 To meet additional
requirements beyond linkage
Project:Wind Power Plant II
Jaisalmer,
Rajasthan 47.6 MW 283
EPC contract awarded on
Gamesa Wind turbines Ltd in
Dec’12.
Project work started.
Contractual completion period
8 months.
Aug 2013
Will meet about 100% of non-
solar RPO requirement
24
Corporate Presentation February 2013
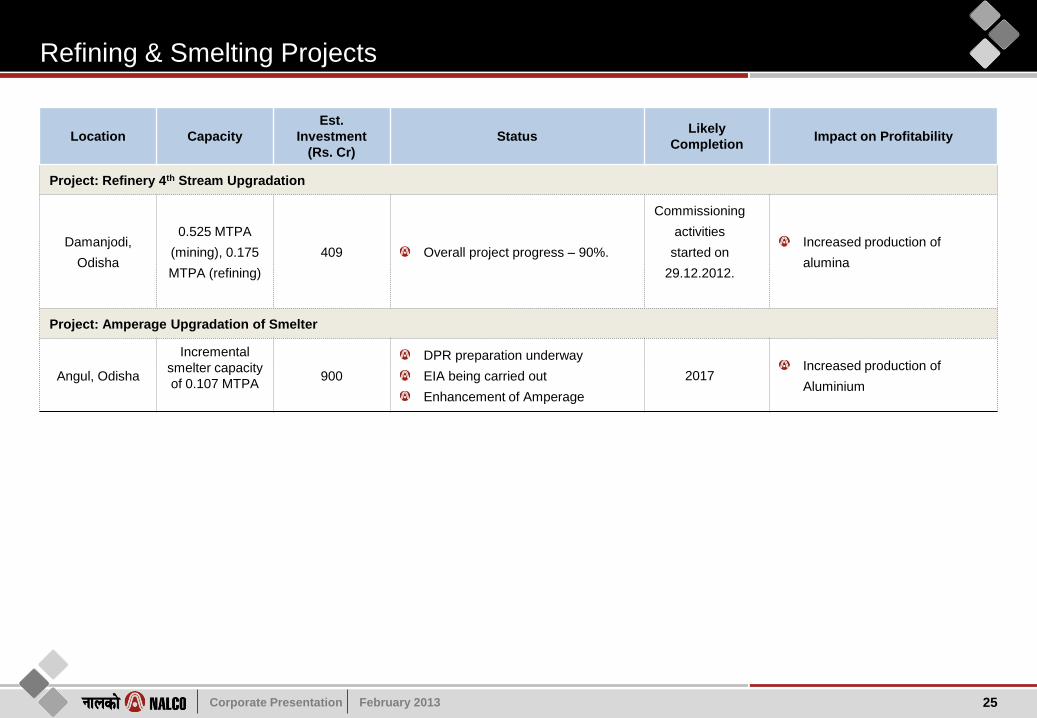
Refining & Smelting Projects
Location Capacity
Est.
Investment
(Rs. Cr)
Status Likely
Completion Impact on Profitability
Project: Refinery 4th Stream Upgradation
Damanjodi,
Odisha
0.525 MTPA
(mining), 0.175
MTPA (refining)
409 Overall project progress – 90%.
Commissioning
activities
started on
29.12.2012.
Increased production of
alumina
Project: Amperage Upgradation of Smelter
Angul, Odisha
Incremental
smelter capacity
of 0.107 MTPA
900
DPR preparation underway
EIA being carried out
Enhancement of Amperage
2017 Increased production of
Aluminium
25
Corporate Presentation February 2013
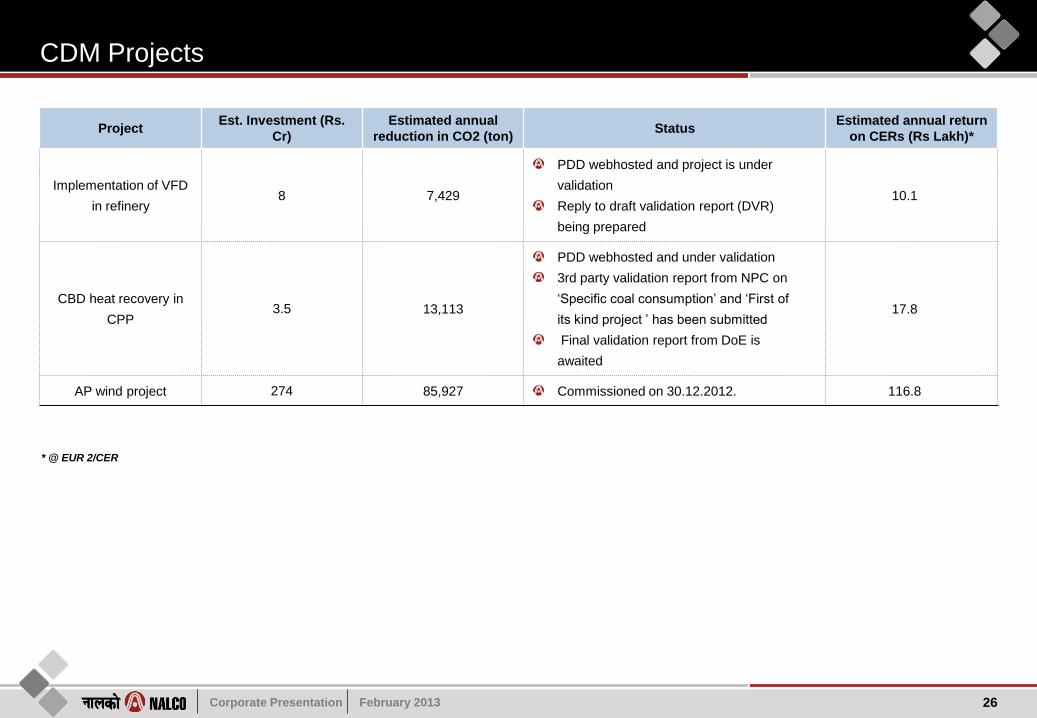
CDM Projects
26
Project Est. Investment (Rs.
Cr)
Estimated annual
reduction in CO2 (ton) Status
Estimated annual return
on CERs (Rs Lakh)*
Implementation of VFD
in refinery 8 7,429
PDD webhosted and project is under
validation
Reply to draft validation report (DVR)
being prepared
10.1
CBD heat recovery in
CPP 3.5 13,113
PDD webhosted and under validation
3rd party validation report from NPC on
‘Specific coal consumption’ and ‘First of
its kind project ’ has been submitted
Final validation report from DoE is
awaited
17.8
AP wind project 274 85,927 Commissioned on 30.12.2012. 116.8
* @ EUR 2/CER

Corporate Presentation February 2013
Projects Under Planning
7
Corporate Presentation February 2013
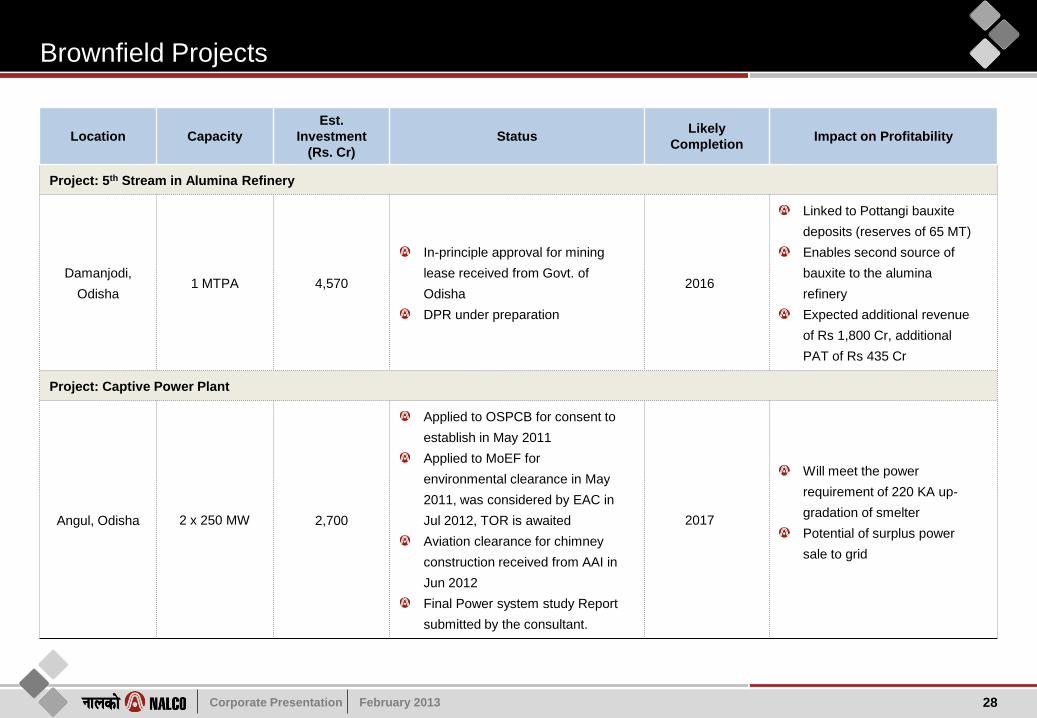
Brownfield Projects
28
Location Capacity
Est.
Investment
(Rs. Cr)
Status Likely
Completion Impact on Profitability
Project: 5th Stream in Alumina Refinery
Damanjodi,
Odisha 1 MTPA 4,570
In-principle approval for mining
lease received from Govt. of
Odisha
DPR under preparation
2016
Linked to Pottangi bauxite
deposits (reserves of 65 MT)
Enables second source of
bauxite to the alumina
refinery
Expected additional revenue
of Rs 1,800 Cr, additional
PAT of Rs 435 Cr
Project: Captive Power Plant
Angul, Odisha 2 x 250 MW 2,700
Applied to OSPCB for consent to
establish in May 2011
Applied to MoEF for
environmental clearance in May
2011, was considered by EAC in
Jul 2012, TOR is awaited
Aviation clearance for chimney
construction received from AAI in
Jun 2012
Final Power system study Report
submitted by the consultant.
2017
Will meet the power
requirement of 220 KA up-
gradation of smelter
Potential of surplus power
sale to grid
Corporate Presentation February 2013
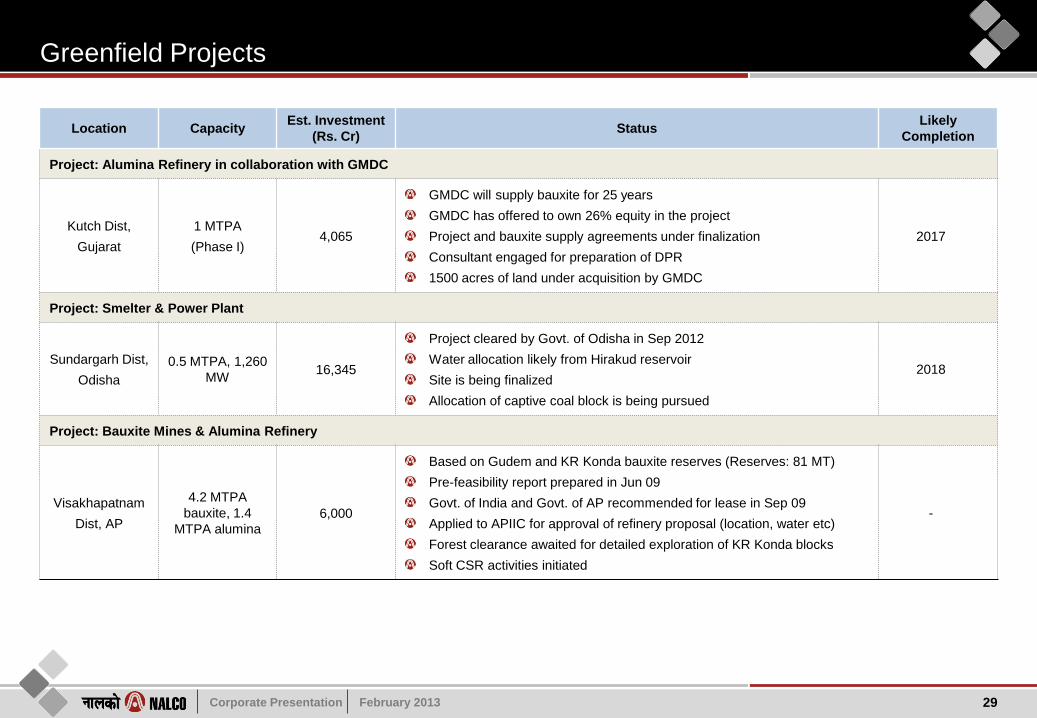
Greenfield Projects
29
Location Capacity Est. Investment
(Rs. Cr) Status
Likely
Completion
Project: Alumina Refinery in collaboration with GMDC
Kutch Dist,
Gujarat
1 MTPA
(Phase I) 4,065
GMDC will supply bauxite for 25 years
GMDC has offered to own 26% equity in the project
Project and bauxite supply agreements under finalization
Consultant engaged for preparation of DPR
1500 acres of land under acquisition by GMDC
2017
Project: Smelter & Power Plant
Sundargarh Dist,
Odisha
0.5 MTPA, 1,260
MW 16,345
Project cleared by Govt. of Odisha in Sep 2012
Water allocation likely from Hirakud reservoir
Site is being finalized
Allocation of captive coal block is being pursued
2018
Project: Bauxite Mines & Alumina Refinery
Visakhapatnam
Dist, AP
4.2 MTPA
bauxite, 1.4
MTPA alumina
6,000
Based on Gudem and KR Konda bauxite reserves (Reserves: 81 MT)
Pre-feasibility report prepared in Jun 09
Govt. of India and Govt. of AP recommended for lease in Sep 09
Applied to APIIC for approval of refinery proposal (location, water etc)
Forest clearance awaited for detailed exploration of KR Konda blocks
Soft CSR activities initiated
-

Corporate Presentation February 2013
Vertical Integration Projects
30
Location Capacity Est. Investment
(Rs. Cr) Status
Likely
Completion
Project: Caustic Soda plant in collaboration with GACL
Dahej, Gujarat 0.2 MTPA 600-800
MoU signed with Gujarat Alkalis and Chemicals Ltd (GACL)
DPR being prepared by GACL
Critical factors are availability of salt (main raw material) and disposal of
chlorine (toxic by-product)
Favourable factors are availability of salt & ethylene and well-developed
market for chlorine in Gujarat
2016
Project: Aluminium Conductor plant in collaboration with PGCIL
To be firmed up 0.55 MTPA 200
MOU signed with PGCIL in Oct 2011
NALCO to supply aluminium and PGCIL to source conductors from the
JV at mutually agreed price
Feasibility report under preparation
-

Corporate Presentation February 2013
Diversification Projects (Power)
31
Location Capacity Est. Investment
(Rs. Cr) Status
Likely
Completion
Project: Nuclear Power in collaboration with NPCIL
Kakkarpar,
Gujarat 2 x 700 MW
11,459
(NALCO’s 49%
share of equity:
1,685)
JV incorporated in Mar 12
Initial equity investment of 26% (Rs 894 Cr) approved by the Board, to
be enhanced to 49% upon approval of GoI through CCS
Approval of CCS is awaited for 1st tranche of equity contribution.
2016
Project: Solar Power
To be firmed up 15 MW 150
Feasibility report prepared
Selection of suitable site is underway
Power generation will meet future solar RPO
2015
Project: Wind Power Plant III
Odisha
Capacity and investment would be
ascertained in the feasibility report.
Wind data validation done by C-WET.
Consultant engaged for preparation of Techno Economic Feasibility
Report (TEFR).
Power evacuation arrangement /infrastructure and statutory compliances
being reviewed.
2014
Project: IPP (UMPP) in consortium
To be firmed up 4,000 MW 20,000
Participating in consortium as a lead partner
Discussions held with interested CPSEs for consortium bidding for
UMPPs
RFQ submitted for UMPP Odisha & will be submitted for UMPP
Chhattisgrah (Due Date 3rd April’13).
-

Corporate Presentation February 2013
Awards & Governance
8

Corporate Presentation February 2013
Recent Awards
33
Non-ferrous Best Performance Award:2011-12” in the category of large integrated plants, instituted by the Indian Institute
of Metals.
2012
PSE Excellence Award for CSR initiatives by Govt. of India 2011
National Energy Conservation Award 2011, 2010
Top Export Award of CAPEXIL 1998-2011
Best Listed CPSE Award by Govt. of India 2010
EEPC (Eastern Region)’s Gold Award as Top Exporter in Large Enterprise category 2010
Think Odisha Leadership Award for the Education Initiative in Tribal Belt of Koraput organized by the Times of India
Group 2012
Dun & Bradstreet’s Best PSU Award in Non-Ferrous Metal Category
2012
IPE- CSR Corporate Governance Award. 2012

Corporate Presentation February 2013
CSR Initiatives
Started allocating 0.5% of net profit every year for periphery
development activities since FY99
Doubled to 1.0% of net profit since FY03
Further increased to 2.0% of net profit since FY11 (equally split
between periphery development & CSR)
Allocation:
40% - Damanjodi area where mines & refinery are located
40% - Angul area where smelter & power plants are located
20% - Other areas
34
CSR Policy
Set up by the Board in Jul 2010 for CSR activities, to be funded
to the extent of 1.0% of net profit
Focused on development of villages located within 15 km of
NALCO’s Mines & Plants in Damanjodi and Angul including
proposed mining areas such as Pottangi (Koraput) and Gudem &
KR Konda (Visakhapatnam & East Godavari districts of AP)
361 tribal & non-tribal children from periphery villages have been
sponsored for education in reputed institutions
Skill development initiatives
NALCO Foundation
Rehabilitation & Periphery Development Advisory Committees
(RPDACs), at Koraput and Angul headed by concerned RDCs,
with local representatives decide all policy and project matters
NALCO has contributed Rs 158 Cr since inception for rural roads,
education, healthcare, water supply, community development,
social welfare and environment
4 schools (DPS and Saraswati Vidya Mandir) are being run at
both complexes since 1983-84, in which nearly half of the
students belong to periphery villages
Periphery Development Expenditure
Shifted away from the earlier donor-based approach
Ensuring participation of the primary stakeholders at the
grassroots in the decision making process
Broad methodology:
Need assessment & baseline survey
Project identification
Selection of implementing agencies
Monitoring and evaluation
Social auditing by independent bodies
Documentation of experience
Project-based Accountability Approach
Corporate Presentation February 2013
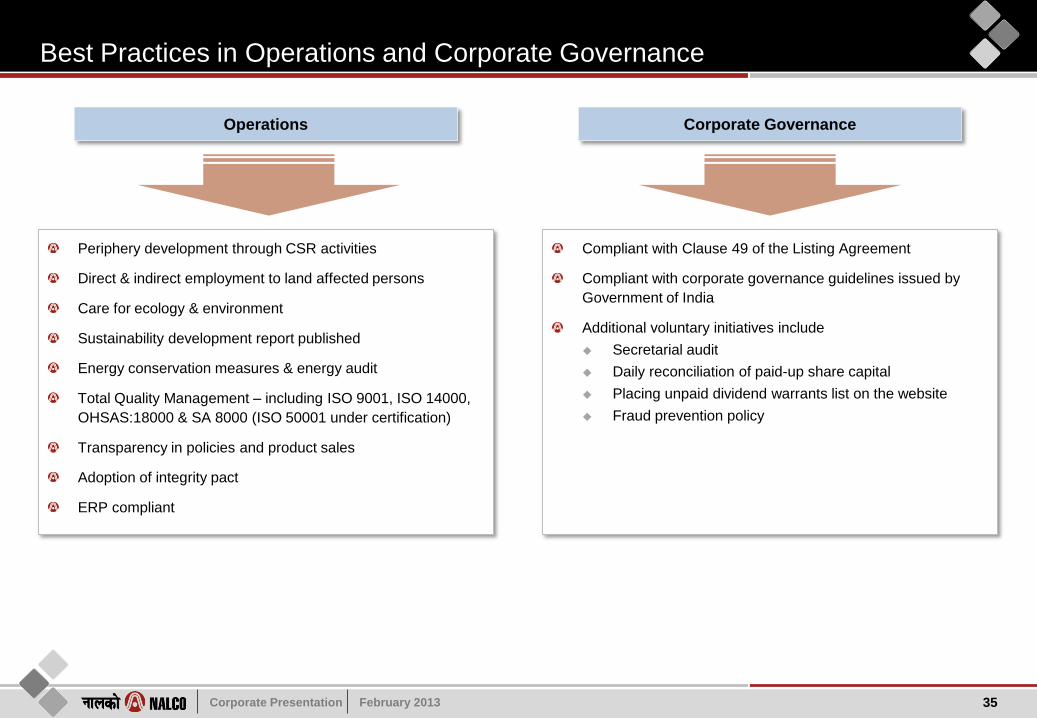
Best Practices in Operations and Corporate Governance
35
Periphery development through CSR activities
Direct & indirect employment to land affected persons
Care for ecology & environment
Sustainability development report published
Energy conservation measures & energy audit
Total Quality Management – including ISO 9001, ISO 14000,
OHSAS:18000 & SA 8000 (ISO 50001 under certification)
Transparency in policies and product sales
Adoption of integrity pact
ERP compliant
Operations Corporate Governance
Compliant with Clause 49 of the Listing Agreement
Compliant with corporate governance guidelines issued by
Government of India
Additional voluntary initiatives include
Secretarial audit
Daily reconciliation of paid-up share capital
Placing unpaid dividend warrants list on the website
Fraud prevention policy

Corporate Presentation February 2013
Thank You


![Presentation on Aluminum Park at Anugul-Odisha by NALCO[1]](https://img.pdfslide.net/doc/110x75/577ce72e1a28abf103948453/presentation-on-aluminum-park-at-anugul-odisha-by-nalco1.jpg)