Embed Size (px)
Citation preview
NANO STRUCTURAL METAL COMPOSITES: SYNTHESIS, STRUCTURAL
AND THERMAL CHARACTERIZATION
A THESIS SUBMITTED TO THE GRADUATE SCHOOL OF NATURAL AND APPLIED SCIENCES
OF MIDDLE EAST TECHNICAL UNIVERSITY
BY
KADİR KALELİ
IN PARTIAL FULFILLMENT OF THE REQUIREMENTS FOR
THE DEGREE OF MASTER OF SCIENCE IN
CHEMISTRY
JULY 2008
Approval of the thesis
NANO STRUCTURAL METAL COMPOSITES: SYNTHESIS,
STRUCTURAL AND THERMAL CHARACTERIZATION
submitted by KADİR KALELİ in partial fulfillment of the requirements for the degree of Master of Science in Chemistry Department, Middle East Technical University by,
Prof. Dr. Canan Özgen Dean, Graduate School of Natural and Applied Sciences Prof. Dr. Ahmet M. Önal Head of Department, Chemistry Prof. Dr. H. Ceyhan Kayran Supervisor, Chemistry Dept., METU
Prof. Dr. Jale Hacaloğlu Co-Supervisor, Chemistry Dept., METU
Examining Committee Members:
Prof. Dr. Zuhal KÜÇÜKYAVUZ Chemistry Dept., METU Prof. Dr. H. Ceyhan KAYRAN Chemistry Dept., METU Prof. Dr. Jale HACALOĞLU Chemistry Dept., METU Assist. Prof. Dr. Ayşen YILMAZ Chemistry Dept., METU Assoc. Prof. Dr. Göknur BAYRAM Chemical Engineering Dept., METU Date:

iii
I hereby declare that all information in this document has been obtained and presented in accordance with academic rules and ethical conduct. I also declare that, as required by these rules and conduct, I have fully cited and referenced all material and results that are not original to this work. Name, Last Name : KADİR KALELİ
Signature :
iv
ABSTRACT
NANO STRUCTURAL METAL COMPOSITES: SYNTHESIS,
STRUCTURAL AND THERMAL CHARACTERIZATION
Kaleli, Kadir
M.S., Department of Chemistry
Supervisor: Prof. Dr. Ceyhan Kayran
Co-Supervisor: Prof. Dr. Jale Hacaloğlu
July 2008, 63 pages
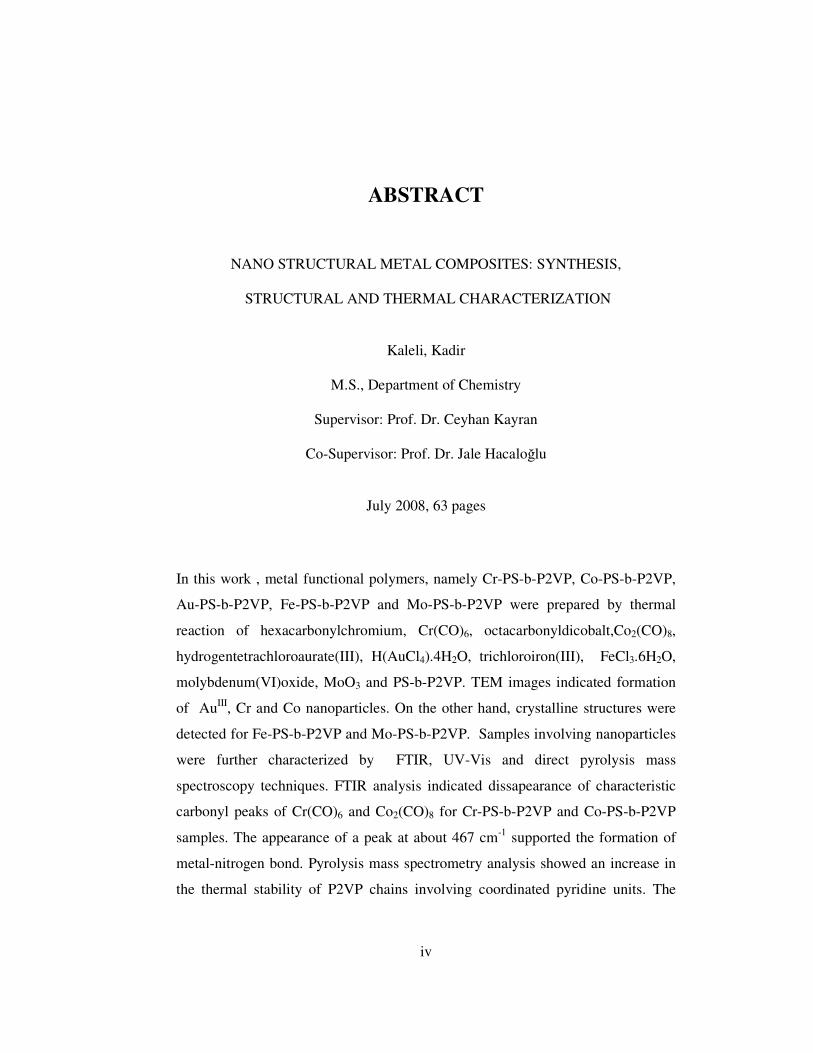
In this work , metal functional polymers, namely Cr-PS-b-P2VP, Co-PS-b-P2VP,
Au-PS-b-P2VP, Fe-PS-b-P2VP and Mo-PS-b-P2VP were prepared by thermal
reaction of hexacarbonylchromium, Cr(CO)6, octacarbonyldicobalt,Co2(CO)8,
hydrogentetrachloroaurate(III), H(AuCl4).4H2O, trichloroiron(III), FeCl3.6H2O,
molybdenum(VI)oxide, MoO3 and PS-b-P2VP. TEM images indicated formation
of AuIII, Cr and Co nanoparticles. On the other hand, crystalline structures were
detected for Fe-PS-b-P2VP and Mo-PS-b-P2VP. Samples involving nanoparticles
were further characterized by FTIR, UV-Vis and direct pyrolysis mass
spectroscopy techniques. FTIR analysis indicated dissapearance of characteristic
carbonyl peaks of Cr(CO)6 and Co2(CO)8 for Cr-PS-b-P2VP and Co-PS-b-P2VP
samples. The appearance of a peak at about 467 cm-1 supported the formation of
metal-nitrogen bond. Pyrolysis mass spectrometry analysis showed an increase in
the thermal stability of P2VP chains involving coordinated pyridine units. The

v
thermal stability of these chains increased in the order Co< Cr <Au3+ indicating
stronger coordination in the same order.
Keywords: Organometallic Polymer, Nano Structural Metal Composite, Pyrolysis

vi
ÖZ
NANO YAPILI METALİK KOMPOZİTLER: SENTEZİ, YAPISAL VE ISIL
KARAKTERİZASYONU
Kaleli, Kadir
Yüksek Lisans, Kimya Bölümü
Tez Yöneticisi: Prof. Dr. H. Ceyhan Kayran
Tez Yönetici Yardımcısı: Prof. Dr. Jale Hacaloğlu
Temmuz 2008, 63 sayfa
Bu çalışmada, hekzakarbonilkrom, Cr(CO)6, oktakarbonildikobalt, Co2(CO)8,
hidrojentetrakloroaltın(III), H(AuCl4).4H2O, triklorodemir(III), FeCl3.6H2O,
molibden(VI)oksit, MoO3 ve PS-b-P2VP’in ısıl tepkimesiyle Cr-PS-b-P2VP, Co-
PS-b-P2VP, Au-PS-b-P2VP, Fe-PS-b-P2VP ve Mo-PS-b-P2VP adlı metal
fonksiyonel polimerler hazırlanmıştır. TEM görüntüleri AuIII, Cr ve Co nano
parçacıklarının oluştuğunu göstermiştir. Diğer yandan Fe-PS-b-P2VP ve Mo-PS-b-
P2VP’in kristal yapıda olduğu tespit edilmiştir. Nano parçacık içeren örnekler
ayrıca FTIR, UV-Vis ve direkt piroliz kütle spektroskopi teknikleri kullanılarak
karakterize edilmiştir. FTIR analizi Cr-PS-b-P2VP ve Co-PS-b-P2VP
örneklerindeki Cr(CO)6 ve Co2(CO)8’e ait karakteristik karbonil piklerinin
kaybolduğunu ve metal-azot bağının oluştuğunu destekleyen 467 cm-1 dolayında
yeni bir pik ortaya çıktığını göstermiştir. Piroliz kütle spektrometre analizi
koordine piridin birimleri içeren P2VP zincirlerinin ısıl dengelerindeki artışı

vii
göstermiştir. Bu zincirlerin termal kararlılıkları Co< Cr <Au3+ sırasında
artmaktadır. Bu da metal bağının gücünün de aynı sırayla arttığını göstermektedir.
Anahtar Kelimeler: Organometalik Polimer, Nano Yapılı Metal Kompozit, Piroliz

viii
Dedicated to my family and my fiancée . . .
ix
ACKNOWLEDGEMENTS
I would like to express my profound gratitude to my advisor, Prof. Dr. Ceyhan
Kayran, and my co-advisor Prof. Dr. Jale Hacaloğlu for their guidance, support
and patience during the course of this research as well as their unique imagination
and great experience that I have benefited from. I wish to express my sincere
appreciation to Mehmet Zahmakıran, Önder Metin and Yusuf Nur for their support
and guidance to improve my skills during my study at Middle East Technical
University.
I would like to thank Asst. Prof. Dr. Tamer Uyar (INANO/Denmark) for the TEM
analysis in the thesis.
TUBITAK (106T656) is also gratefully acknowleged for the financial support.
I am obliged to each and every member of C-205 Laboratory, Aysegül Elmacı
from Mass Spectrometry Laboratory for the great atmosphere in the laboratory and
for friendship and finally of course every member of SCL for the great atmosphere
in and out of the laboratory and for breakfast and lunch every weekday and etc…
I was extraordinarily fortunate in having such a wonderful mother, Nermin Kaleli,
a father, Levent Kaleli and a brother, Gökay Kaleli. I could never have succeeded
all of this without their support.
Words fail me to express my appreciation to my lovely fiancée Ceyda İhtiyar
whose dedication, love and persistent confidence in me, has taken the load off my
shoulder. I would also thank her family for accepting me as a member of the
family, warmly.

x
TABLE OF CONTENTS
ABSTRACT…………………………………………………..………….….....iv
ÖZ…………………………………………………………………….…..……vi
ACKNOWLEDGEMENTS………………………………….………….……..ix
TABLE OF CONTENTS………………………………………...….………….x
LIST OF TABLES……………………………………………………………xiii
LIST OF FIGURES……………………………………….……..……............xiv
LIST OF SCHEMES…………………………………………………………xvii
CHAPTER
1 INTRODUCTION ................................................................................. …..1
2 BONDING………………………………………………………………........8
2.1. Metal Carbonyl Bonding…………………………………………….......8
2.2. Metal Halide Bonding………………………………………………….11
2.3. Metal Pyridine Bonding………………………………………………..12
3 EXPERIMENTAL…………………………………………………………..14
3.1. Basic Techniques……………………………………………………....14
3.2. Chemicals……………………………………………………………...16
3.3. Synthesis of the Complexes…………………………………………...17
xi
3.3.1. Synthesis of Cobalt Polystyrene-block-Poly2vinylpyridine
(Co-PS-b-P2VP)………………………………………………..18
3.3.2. Synthesis of Chromium Polystyrene-block-Poly2vinylpyridine
(Cr-PS-b-P2VP)………………………………………………...19
3.3.3. Synthesis of Gold Polystyrene-block-Poly2vinylpyridine
(Au-PS-b-P2VP)………….…………………………………….19
3.3.4. Synthesis of Iron Polystyrene-block-Poly2vinylpyridine
(Fe-PS-b-P2VP)……………….………………………………..19
3.3.2. Synthesis of Molybdenum Polystyrene-block-Poly2vinylpyridine
(Mo-PS-b-P2VP)……………………………………………….20
3.4. Characterizations..………..…………………………………………...20
3.4.1. Transmission Electron Microscope (TEM)………………….....20
3.4.2. UV-Vis Spectra………………………………………………...20
3.4.3. Infrared Spectra……...…………………………………………20
3.4.4. Pyrolysis Mass Spectra………………………………………...21
4 RESULTS AND DISCUSSION…………………………………………...22
4.1. Transmission Electron Microsocope (TEM) Analysis………………...22
4.2. UV-Vis Characterization……………………………………………....26
4.2.1. Chromiumpolystyrene-block-poly(2-vinylpyridine)…………....26
4.2.2. Cobaltpolystyrene-block-poly(2-vinylpyridine)…….....……......27
4.2.3. Goldpolystyrene-block-poly(2-vinylpyridine)…………….........28
xii
4.3. FTIR Characterization………………………………………..……....30
4.3.1. Chromiumpolystyrene-block-poly(2-vinylpyridine)……..…….31
4.3.2. Cobaltpolystyrene-block-poly(2-vinylpyridine)….…………….32
4.3.3. Goldpolystyrene-block-poly(2-vinylpyridine)….……………...34
4.4. Direct Pyrolysis Mass Spectrometry Characterization……………….35
4.4.1. Polystyrene-block-poly(2-vinylpyridine)……………...……....35
4.4.2. Chromiumpolystyrene-block-poly(2-vinylpyridine)…………..41
4.4.3. Cobaltpolystyrene-block-poly(2-vinylpyridine)…………...…..49
4.4.4. Goldpolystyrene-block-poly(2-vinylpyridine)………………...54
5 CONCLUSION…………………………………………………………...59
REFERENCES………………………………………………………………..61
xiii
LIST OF TABLES
Table 3.1. The Reactants Used During the Formation of Nanoparticles.........18
Table 4.1. Size of Nanoparticles……………………………………………..23
Table 4.2. Series of Fragments Generated During the Pyrolysis of
Polystyrene-block-Poly(2-vinylpyridine)………………………..37
Table 4.3. Relative Intensities and the Assignments for the Intense and/or
Characteristic Peaks in the Pyrolysis Mass Spectra of PS-b-P2VP
Recorded at the Given Temperatures …………………………....40
Table 4.4. Relative Intensities and the Assignments for the Intense and
Characteristic Peaks of Cr-PS-bP2VP…………………………...43
Table 4.5. Relative Intensities and the Assignments for the Intense and
Characteristic Peaks of Co-PS-bP2VP…………………………..51
Table 4.6. Relative Intensities and the Assignments for the Intense and
Characteristic Peaks of Au-PS-bP2VP……...…………………...56
xiv
LIST OF FIGURES
FIGURES
Figure 1.1. Influence of the Block Copolymer Composition as the Relative
Volume Fraction (φblue) of One Block (blue) on the Bulk
Morphology for a Constant Polymer Volume…………………..... 3
Figure 1.2. Coordination of PS-b-P2VP to the Transition Metal through
Pyridine Nitrogen Atom………………………………………….7
Figure 2.1. Molecular Orbital Description of Metal Carbonyl Interaction……9
Figure 2.2. Competition for π-bonding in Metal Carbonyl
Derivatives…………………………………………………….....10
Figure 2.3. Metal Halide Bonding…………………………………….……..12
Figure 2 4. The Open Structure of
Poly(styrene)-block-Poly(2-vinylpyridine)……………………....13
Figure 2.5. Metal-Pyridine Bonding Model……………………………….....13
Figure 3.1. Nitrogen and Argon Gas Purification System…………………...15
Figure 3.2. Standard Schlenk Tube…………………………………………..16
Figure 3.3. The Apparatus Used During the Thermal Reaction……………..17
Figure 4.1. TEM Images of Cr-PS-b-P2VP…………………………………23
Figure 4.2. TEM Images of Co-PS-b-P2VP…………………………………24
Figure 4.3. TEM Images of Au-PS-b-P2VP…………………………………24
Figure 4.4. TEM Image of Fe-PS-b-P2VP……………….….……………....25
xv
Figure 4.5. TEM Images of Mo-PS-b-P2VP………………..……………...25
Figure 4.6. UV-Vis spectra of Cr-PS-b-P2VP, Cr(CO)6 and
PS-b-P2VP……………………………………………………...27
Figure 4.7. UV-Vis spectra of Co-PS-b-P2VP, Co2(CO)8 and
PS-b-P2VP………………………………………………………28
Figure 4.8. UV-Vis spectra of Au-PS-b-P2VP, H(AuCl4).4H2O and
PS-b-P2VP……………………………………………………….29
Figure 4.9. FTIR Spectra of PS-b-P2VP and Cr-PS-b-P2VP……………......32
Figure 4.10. The Structure of Co2(CO)8……………….……………………..33
Figure 4.11. FTIR Spectra of PS-b-P2VP and Co-PS-b-P2VP………………33
Figure 4.12. FTIR Spectra of PS-b-P2VP and Au-PS-b-P2VP…………........35
Figure 4.13. The TIC Curve and the Pyrolysis Mass Spectra Recorded at Peak
Maximum and at the Shoulder for PS-b-P2VP………………....38
Figure 4.14. Single Ion Evolution Profiles of Some Selected Characteristic
Products of PS-b-P2VP………………………………………...39
Figure 4.15. The TIC Curve and the Pyrolysis Mass Spectra Recorded at Peak
Maximum and at the Shoulder for Cr-Ps-b-P2VP……………...42
Figure 4.16. Single Ion Evolution Profiles of Some Selected Characteristic
Products of Cr-PS-b-P2VP……………………………………..46
Figure 4.17. The TIC Curve and the Pyrolysis Mass Spectra Recorded at Peak
Maximum and at the Shoulder for Co-PS-b-P2VP……………50
Figure 4.18. Single Ion Evolution Profiles of Some Selected Characteristic
Products of Co-PS-b-P2VP……………………………………52

xvi
Figure 4.19. The TIC Curve and the Pyrolysis Mass Spectra Recorded at Peak
Maximum and at the Shoulder for Au-Ps-b-P2VP……………55
Figure 4.20. Single Ion Evolution Profiles of Some Selected Characteristic
Products of Au-PS-b-P2VP…………………………………...58
xvii
LIST OF SCHEMES
Scheme 1.1. Preparation of Metal-Polymer Composites…………………….4
Scheme 4.1. Thermal Decomposition of Metal-Functional P2VP Chains....48

xviii

1
CHAPTER 1
INTRODUCTION
Substances that are containing direct metal carbon bonds are known as
organometallic compounds. The variety of the organic moiety in such compounds
is practically infinite, ranging from alkyl substituents to alkenes, alkynes,
carbonyls, and aromatic and heterocyclic compounds. Among these, metal
carbonyl complexes have remained one of the most important classes of
organometallic compounds with their unusual physical properties [1].
Transition metal-organic ligand complexes are the primary components of the
backbones of main-chain organometallic polymers [2]. Great interest is being
expressed in the production of the polymer composites containing inclusions of
metals, the dimensions of which are comparable to those of macromolecules.
Nanodimensional systems show unusual physicochemical properties much
different from similar properties of substances found in blocklike or
microheterogeneous states. In metal nanoparticles, variations occur in the
parameters of the crystal lattice, in atomic dynamics, and in the thermal, electrical,
and magnetic properties. These make nanocomposites to be used as selective and
effective catalysts, and as sensors and selective membranes for devices with
nonlinear optical features. Also, metal containing modifiers in the nanodispersed
form are used to increase the refractoriness of polymeric materials and their
resistance to thermooxidative aging and to improve the mechanical properties of
them [3].
2
Two or more homogenous polymer fragments, joined together by covalent bonds
to form more complex macromolecules are defined as block copolymers. Di-, tri-,
or multiblock copolymers are linear and multiarm, starblock, or graft copolymers
are nonlinear [4].
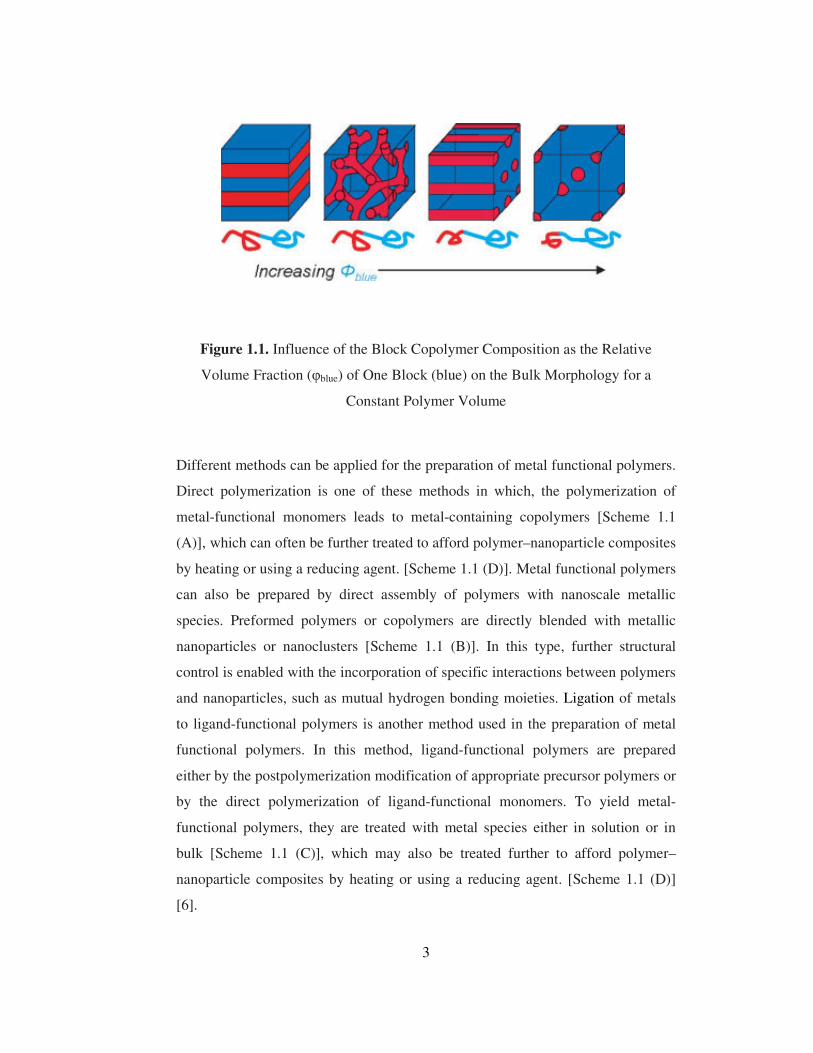
Block copolymers have the desirable feature that their morphology can be
systematically controlled by varying the number of blocks, their lengths, and their
chemical compositions [5]. Multiblock copolymers have been experimentally
observed and theoretically predicted to assemble into well-defined morphologies
[6]. Diblock copolymers can prefer different morphologies such as, cubic arrays of
spheres, hexagonal arrays of cylinders, bicontinuous cubic phases, or lamellar,
depending on the relative block lengths [5]. For example, for a diblock copolymer
chain of constant volume, if the relative volume of one block is increased at the
expense of the other, the preferred morphology tends to shift from lamellar
arrangements to morphologies that have greater amounts of curvature at the block–
block interface. A typical progression of morphologies from lamellar to gyroid to
hexagonally arranged cylinders to cubically ordered spheres is illustrated in Figure
1.1 [6]. Triblock copolymers that are composed of three blocks can prefer even
more complex structures, such as helical strands surrounding cylinders embedded
in a continuous matrix [5].
3
Figure 1.1. Influence of the Block Copolymer Composition as the Relative
Volume Fraction (φblue) of One Block (blue) on the Bulk Morphology for a
Constant Polymer Volume
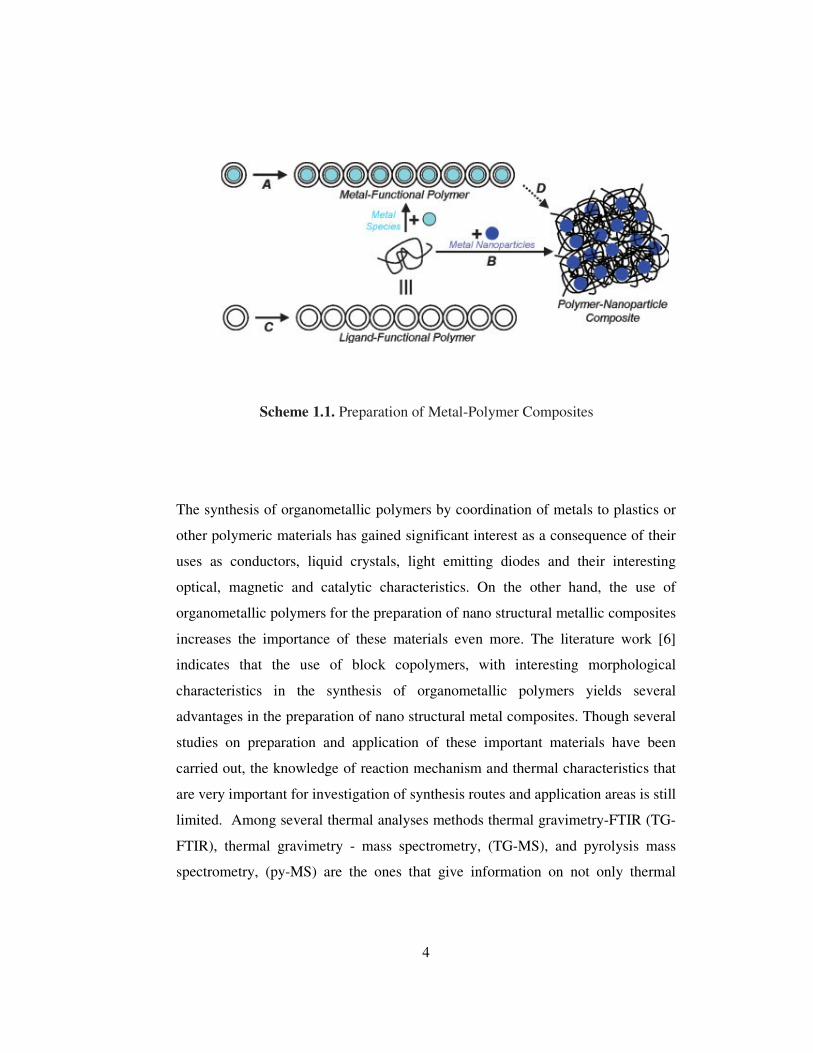
Different methods can be applied for the preparation of metal functional polymers.
Direct polymerization is one of these methods in which, the polymerization of
metal-functional monomers leads to metal-containing copolymers [Scheme 1.1
(A)], which can often be further treated to afford polymer–nanoparticle composites
by heating or using a reducing agent. [Scheme 1.1 (D)]. Metal functional polymers
can also be prepared by direct assembly of polymers with nanoscale metallic
species. Preformed polymers or copolymers are directly blended with metallic
nanoparticles or nanoclusters [Scheme 1.1 (B)]. In this type, further structural
control is enabled with the incorporation of specific interactions between polymers
and nanoparticles, such as mutual hydrogen bonding moieties. Ligation of metals
to ligand-functional polymers is another method used in the preparation of metal
functional polymers. In this method, ligand-functional polymers are prepared
either by the postpolymerization modification of appropriate precursor polymers or
by the direct polymerization of ligand-functional monomers. To yield metal-
functional polymers, they are treated with metal species either in solution or in
bulk [Scheme 1.1 (C)], which may also be treated further to afford polymer–
nanoparticle composites by heating or using a reducing agent. [Scheme 1.1 (D)]
[6].
4
Scheme 1.1. Preparation of Metal-Polymer Composites
The synthesis of organometallic polymers by coordination of metals to plastics or
other polymeric materials has gained significant interest as a consequence of their
uses as conductors, liquid crystals, light emitting diodes and their interesting
optical, magnetic and catalytic characteristics. On the other hand, the use of
organometallic polymers for the preparation of nano structural metallic composites
increases the importance of these materials even more. The literature work [6]
indicates that the use of block copolymers, with interesting morphological
characteristics in the synthesis of organometallic polymers yields several
advantages in the preparation of nano structural metal composites. Though several
studies on preparation and application of these important materials have been
carried out, the knowledge of reaction mechanism and thermal characteristics that
are very important for investigation of synthesis routes and application areas is still
limited. Among several thermal analyses methods thermal gravimetry-FTIR (TG-
FTIR), thermal gravimetry - mass spectrometry, (TG-MS), and pyrolysis mass
spectrometry, (py-MS) are the ones that give information on not only thermal
5
stability but also on thermal degradation products. Among these the ones using
mass spectrometer as a detector are more sensitive.
Pyrolysis is the chemical decomposition of a material in an inert atmosphere or in
vacuum. It causes molecules to cleave at their weakest points to produce smaller,
volatile fragments. Pyrolysis mass spectrometry (Py-MS) techniques can be
regarded as most powerful analytical methods for thermal analysis of polymers. In
these techniques, a pyrolysis system is coupled to a mass spectrometer to separate
and identify pyrolysis products by ionizing, separating and measuring ions
according to their mass-to- charge ratio (m/z). Pyrolysis mass spectrometry is an
important technique in understanding structure and thermal behavior of polymers.
Structural characterization of inorganic, organic, and bioorganic compounds can
be achieved by using mass spectrometry technique [7,8]. There are two different
types of pyrolysis-MS techniques; pyrolysis GC-MS and direct pyrolysis – MS,
(DP-MS).
Although TGA-MS and pyrolysis GC-MS techniques are significantly sensitive, as
only stable thermal degradation products can be detected, information on thermal
decomposition mechanisms is limited. On the other hand, DP-MS technique offers
several advantages. The high vacuum inside the mass spectrometer favors
vaporization and thus allows the analysis of higher molecular mass pyrolyzates.
Furthermore, as the high vacuum system rapidly removes the degradation products
from the heating zone, secondary reactions and condensation reactions are
avoided. In addition, the rapid detection system of the mass spectrometers allows
detection of unstable thermal degradation products. Thus, thermal stability,
degradation products and decomposition mechanism, which in turn can be used for
structural characteristics of the compound under investigation, can be determined
[9-14]. However, pyrolysis mass spectra of polymers are usually very complex, as
thermal degradation products further dissociate in the mass spectrometer during
ionization. Furthermore, all fragments with the same mass to charge ratio make
contributions to the intensities of the same peaks in the mass spectrum. Thus,
interpretation of the spectra is quite difficult. In this technique variation of total ion
6
yield as a function of temperature, the total ion current (TIC) curve is recorded in
real time. Presence of more than one peak in the TIC curve indicates presence of
either a multi-component sample or units with different thermal stabilities. On the
other hand, scanning single ion current pyrograms allows separation of
decomposition products as a function of volality and/or thermal stability. Thus, in
case of direct pyrolysis MS analyses not only the detection of a peak, but also the
variation of its intensity as a function of temperature, i.e. its evolution profile, is
important. The trends in evolution profiles can be used to determine the source of
the product, or the mechanism of thermal degradation.
Therefore, in this work, synthesis of organometallic polymers, nano structural
metal composites and investigation of reaction mechanism and thermal
characteristics have been aimed. Although the synthesis of organometallic
polymers are known from literature [15-18], the use of pyrolysis mass
spectrometry for the characterization of both block copolymer and the metal-
polymers and also the formation of chromium nanoparticles using ligand
functional polymer and organometallic complex have been performed for the first
time in this thesis.
For this purpose, firstly, poly(styrene)-block-poly(vinyl-2-pyridine), (PS-b-P2VP),
and octacarbonyldicobalt, Co2(CO)8, were chosen as target reactants. The thermal
reaction of Co2(CO)8 with PS-b-P2VP leads to the formation of organometallic
polymer in which copolymer coordinates to the metal through nitrogen atom of the
pyridine ring (Fig 1.2) which then degrades to form nano particles. Later on,
several organometallic polymers have been prepared by thermal reaction of
trichloroiron(III), FeCl3.6H2O, molybdenum(VI)oxide, MoO3,
hexacarbonylchromium, Cr(CO)6, hydrogentetrachloroaurate(III), H(AuCl4).4H2O,
and PS-b-P2VP.

7
N Mx
y
Figure.1.2. Coordination of PS-b-P2VP to the Transition Metal through Pyridine
Nitrogen Atom
8
CHAPTER 2
BONDING
2.1. Metal Carbonyl Bonding
One of the most commonly encountered ligand in organo-transition metal
chemistry is carbonmonoxide. It forms complexes with metals and these
complexes are known as metal carbonyls. Its primary mode of attachment to metal
atom is through the carbon atom [19].
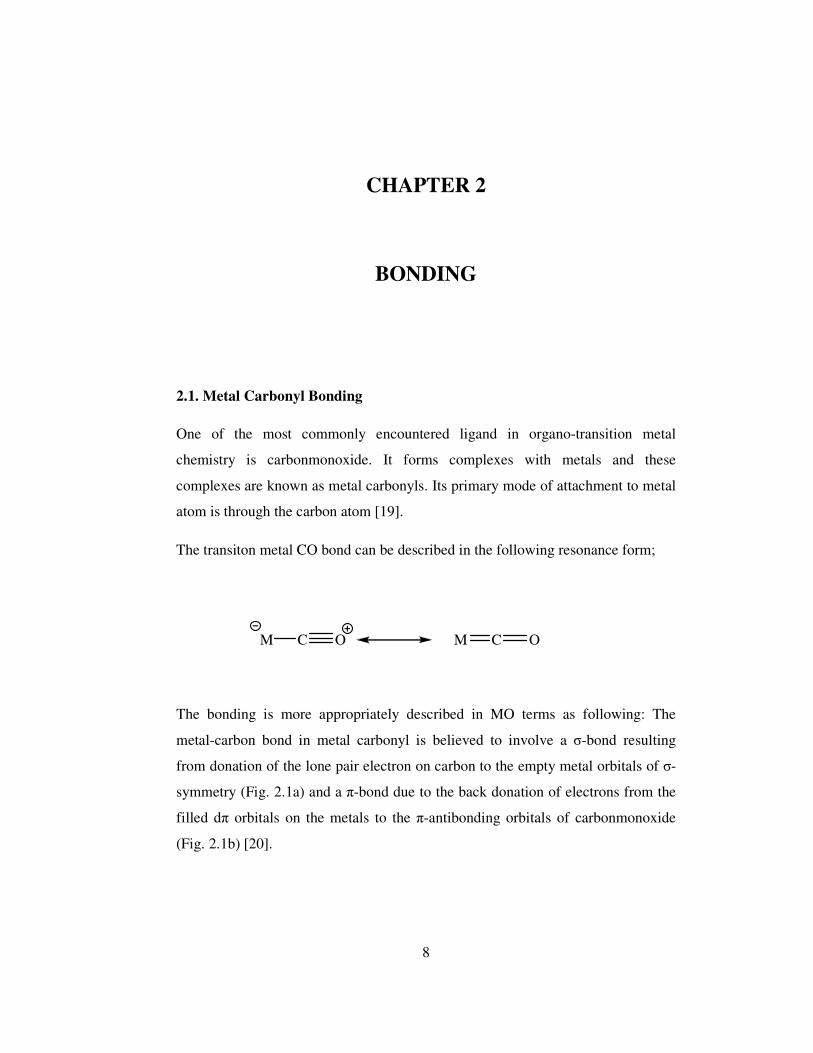
The transiton metal CO bond can be described in the following resonance form;
M C O M C O
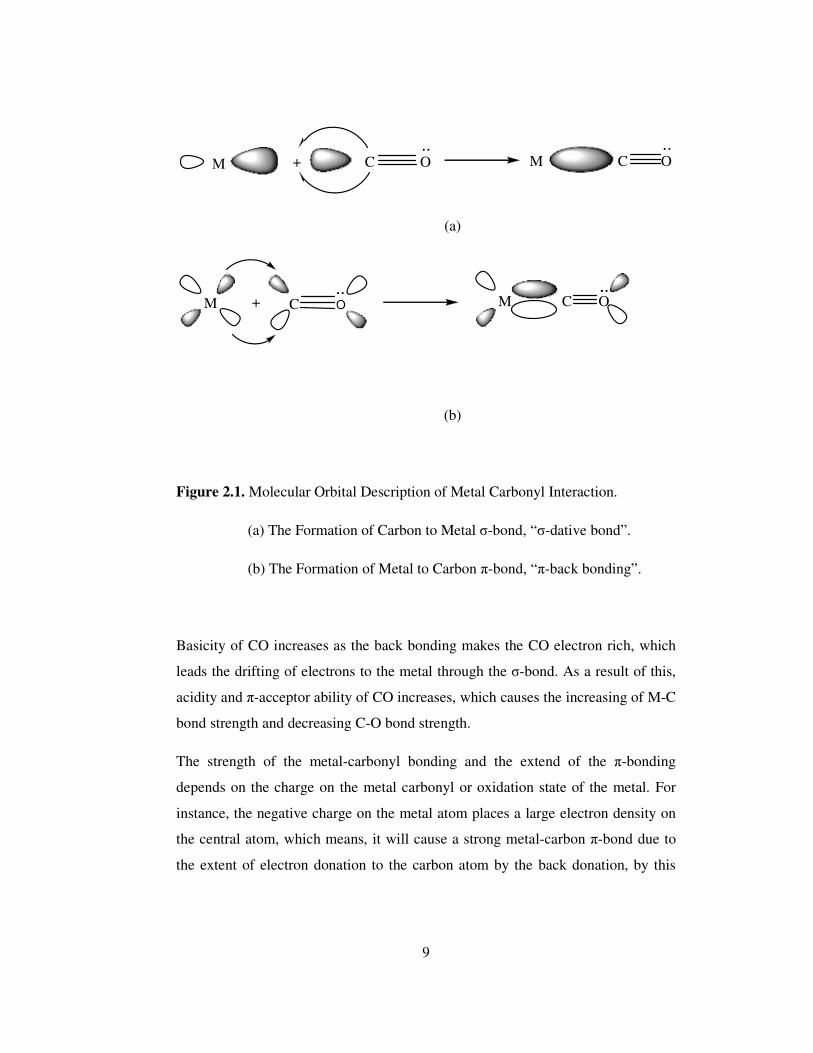
The bonding is more appropriately described in MO terms as following: The
metal-carbon bond in metal carbonyl is believed to involve a σ-bond resulting
from donation of the lone pair electron on carbon to the empty metal orbitals of σ-
symmetry (Fig. 2.1a) and a π-bond due to the back donation of electrons from the
filled dπ orbitals on the metals to the π-antibonding orbitals of carbonmonoxide
(Fig. 2.1b) [20].
9
M + OC M C O
(a)
M + C O M C O
(b)
Figure 2.1. Molecular Orbital Description of Metal Carbonyl Interaction.
(a) The Formation of Carbon to Metal σ-bond, “σ-dative bond”.
(b) The Formation of Metal to Carbon π-bond, “π-back bonding”.
Basicity of CO increases as the back bonding makes the CO electron rich, which
leads the drifting of electrons to the metal through the σ-bond. As a result of this,
acidity and π-acceptor ability of CO increases, which causes the increasing of M-C
bond strength and decreasing C-O bond strength.
The strength of the metal-carbonyl bonding and the extend of the π-bonding
depends on the charge on the metal carbonyl or oxidation state of the metal. For
instance, the negative charge on the metal atom places a large electron density on
the central atom, which means, it will cause a strong metal-carbon π-bond due to
the extent of electron donation to the carbon atom by the back donation, by this
10
way metal-carbon bonding will be shorter, while the carbon-oxygen bond becomes
longer and weaker which directly effects the carbonyl stretching frequency.
O C M C O
(a)
O C M L
(b)
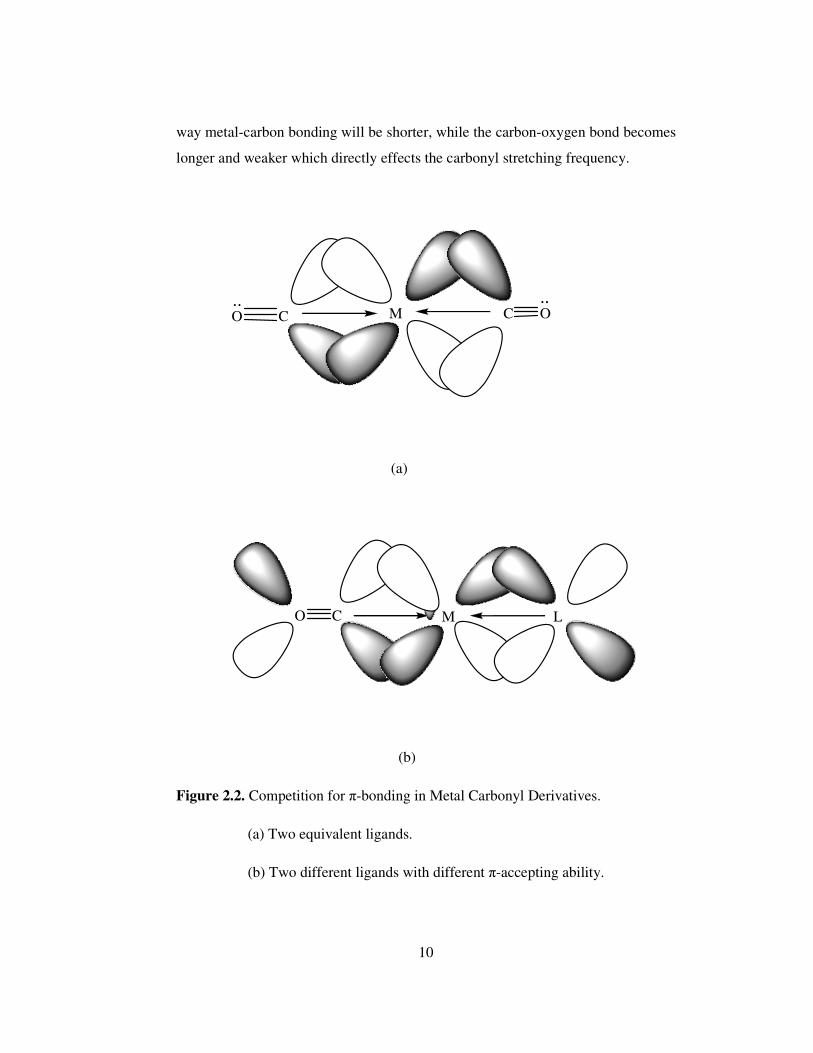
Figure 2.2. Competition for π-bonding in Metal Carbonyl Derivatives.
(a) Two equivalent ligands.
(b) Two different ligands with different π-accepting ability.
11
Not only carbonyl groups, but also other ligands have also an effect on the M-C
and C-O bonds. Considering the two hypothetical molecules illustrated in Figure
2.2., in the OC-M-CO system both carbonyls compete equally for electron density
from the metal, and so the π-bonds are equivalent. However, if L is a poor π-
bonding ligand, it will not be able to compete successfully with the extremely
good π-backbonding, ligand CO. Hence, the electron density will tend to drain off
from the metal to the carbon monoxide, resulting a strong π-bond between M-C,
and a weak one between M-L [21]. Consequently, the increase in the strength of
the M-C bond weakens C-O bond and decreases carbonyl stretching frequency.
2.2. Metal Halide Bonding
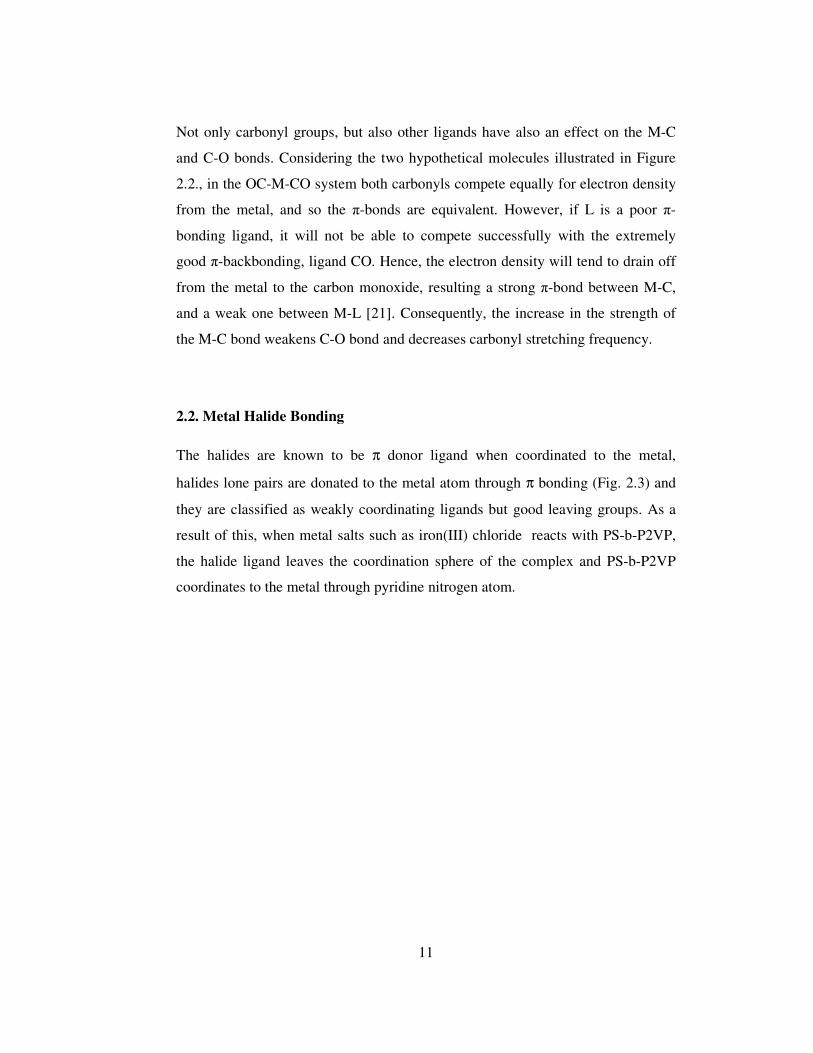
The halides are known to be π donor ligand when coordinated to the metal,
halides lone pairs are donated to the metal atom through π bonding (Fig. 2.3) and
they are classified as weakly coordinating ligands but good leaving groups. As a
result of this, when metal salts such as iron(III) chloride reacts with PS-b-P2VP,
the halide ligand leaves the coordination sphere of the complex and PS-b-P2VP
coordinates to the metal through pyridine nitrogen atom.
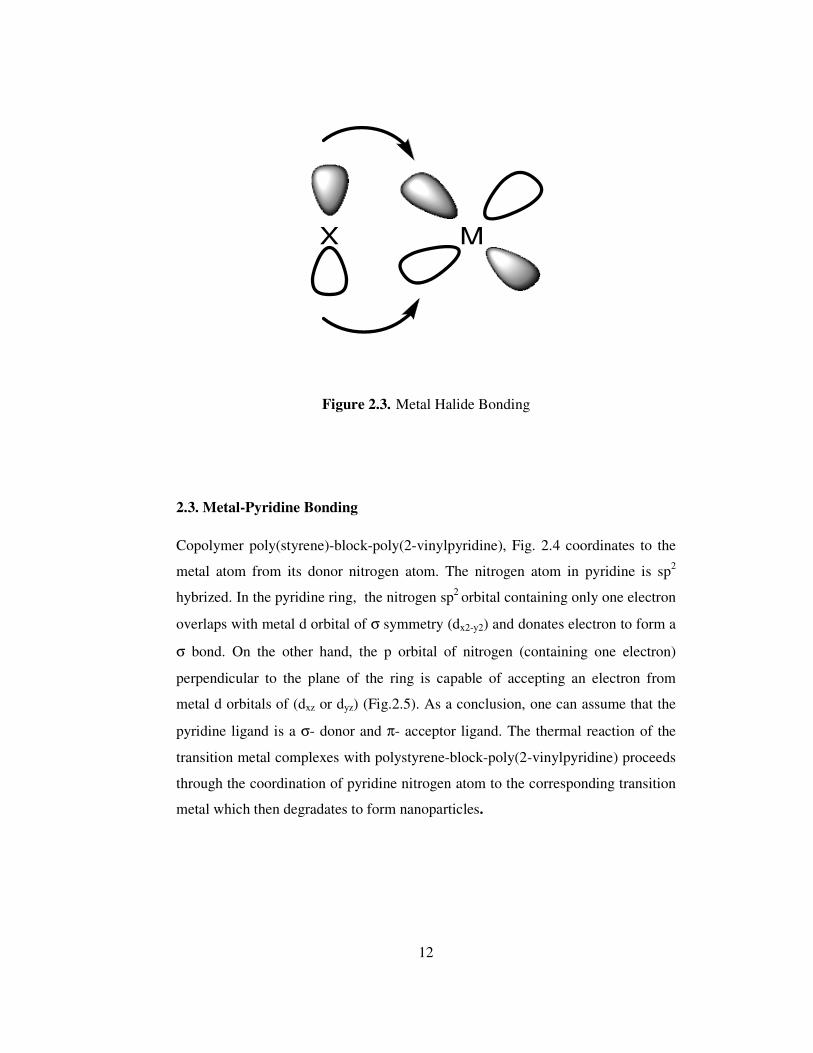
12
MX
Figure 2.3. Metal Halide Bonding
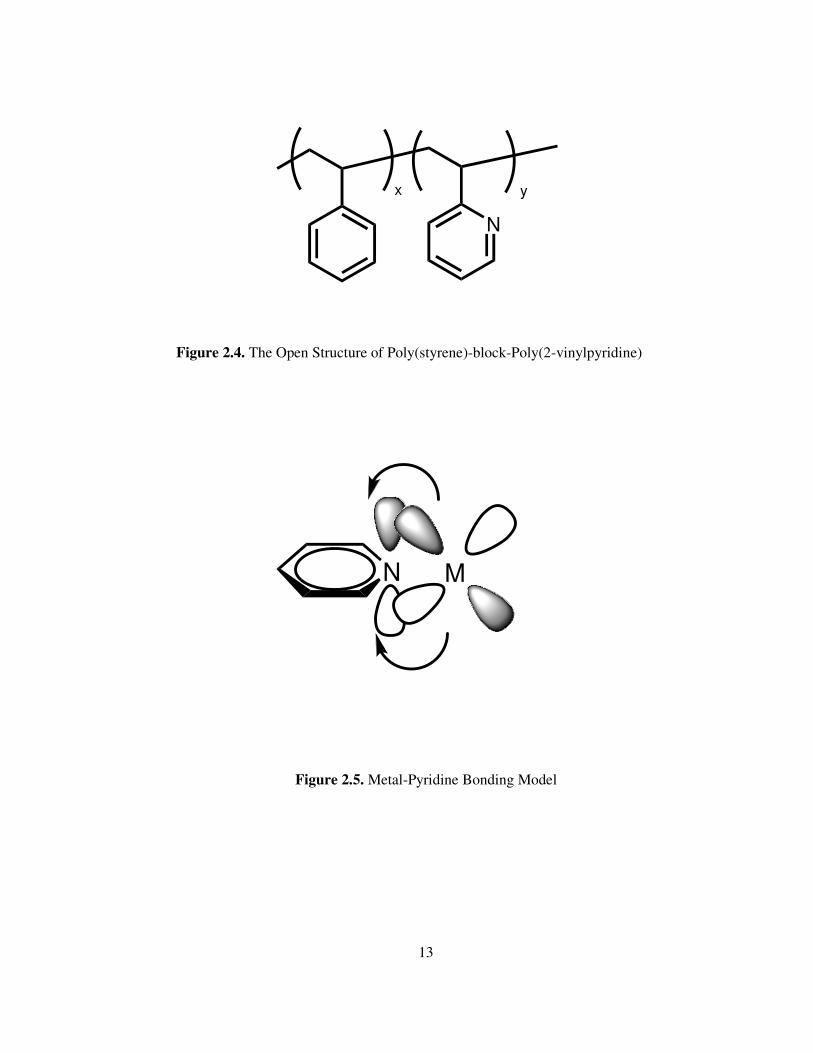
2.3. Metal-Pyridine Bonding
Copolymer poly(styrene)-block-poly(2-vinylpyridine), Fig. 2.4 coordinates to the
metal atom from its donor nitrogen atom. The nitrogen atom in pyridine is sp2
hybrized. In the pyridine ring, the nitrogen sp2 orbital containing only one electron
overlaps with metal d orbital of σ symmetry (dx2-y2) and donates electron to form a
σ bond. On the other hand, the p orbital of nitrogen (containing one electron)
perpendicular to the plane of the ring is capable of accepting an electron from
metal d orbitals of (dxz or dyz) (Fig.2.5). As a conclusion, one can assume that the
pyridine ligand is a σ- donor and π- acceptor ligand. The thermal reaction of the
transition metal complexes with polystyrene-block-poly(2-vinylpyridine) proceeds
through the coordination of pyridine nitrogen atom to the corresponding transition
metal which then degradates to form nanoparticles.
13
N
x y
Figure 2.4. The Open Structure of Poly(styrene)-block-Poly(2-vinylpyridine)
N M
Figure 2.5. Metal-Pyridine Bonding Model
14
CHAPTER 3
EXPERIMENTAL
3.1. Basic Techniques
Most of the organometallic compounds are air sensitive and may decompose
unless handled properly. Oxidation occurs at a significant rate at room temperature
in many cases. Due to their sensitivity to oxygen and water, handling of
organometallic compounds and all their reactions should be carried out under dry,
deoxygenated nitrogen or argon atmosphere or under vacuum. Organometallic
complexes may be handled almost as easily as ordinary compounds, if the
reactions are carried out in the absence of oxygen, for example under dry and
deoxygenated nitrogen gas atmosphere. For the preparation of deoxygenated
nitrogen, nitrogen gas is allowed to pass through diphosphorus pentoxide (P2O5),
then deoxygenated by using a catalyst and finally through dried molecular sieves
to remove its moisture before using in the reaction medium. In general, the
catalyst, copper(I)oxide should be heated to 120oC using an electrical resistance,
and hydrogen gas should be passed through the system from time to time to
regenerate the catalyst (Fig.3.1).
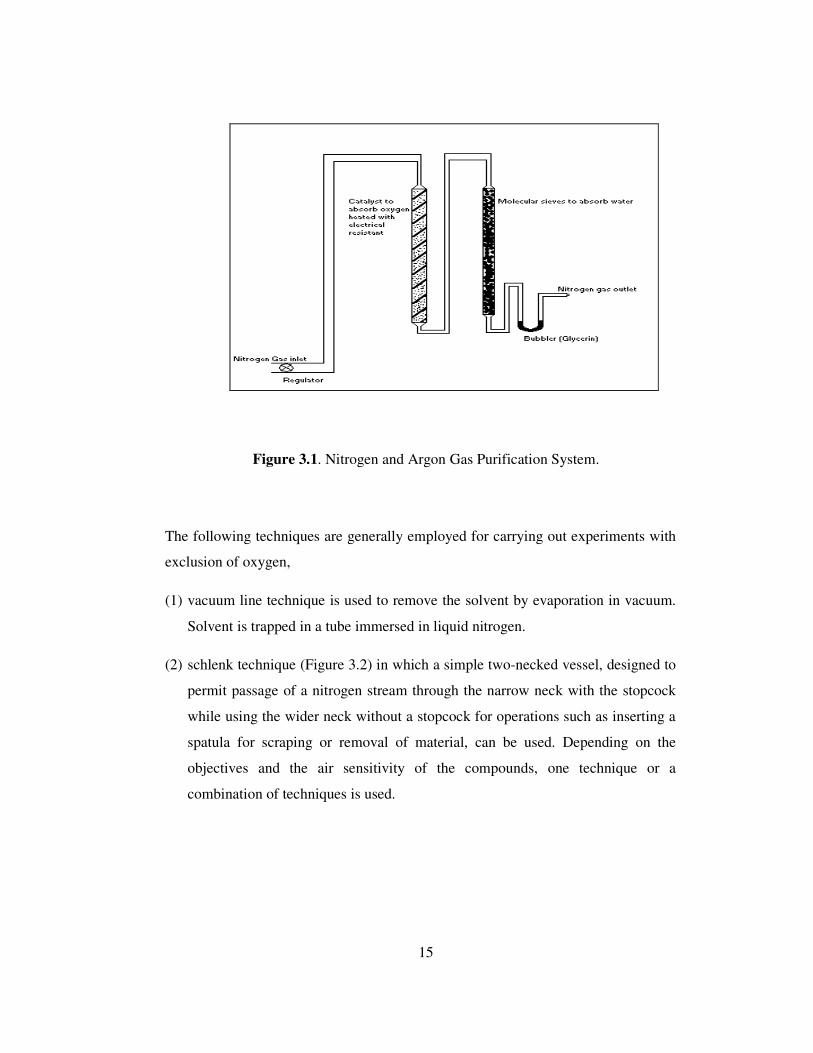
15
Figure 3.1. Nitrogen and Argon Gas Purification System.
The following techniques are generally employed for carrying out experiments with
exclusion of oxygen,
(1) vacuum line technique is used to remove the solvent by evaporation in vacuum.
Solvent is trapped in a tube immersed in liquid nitrogen.
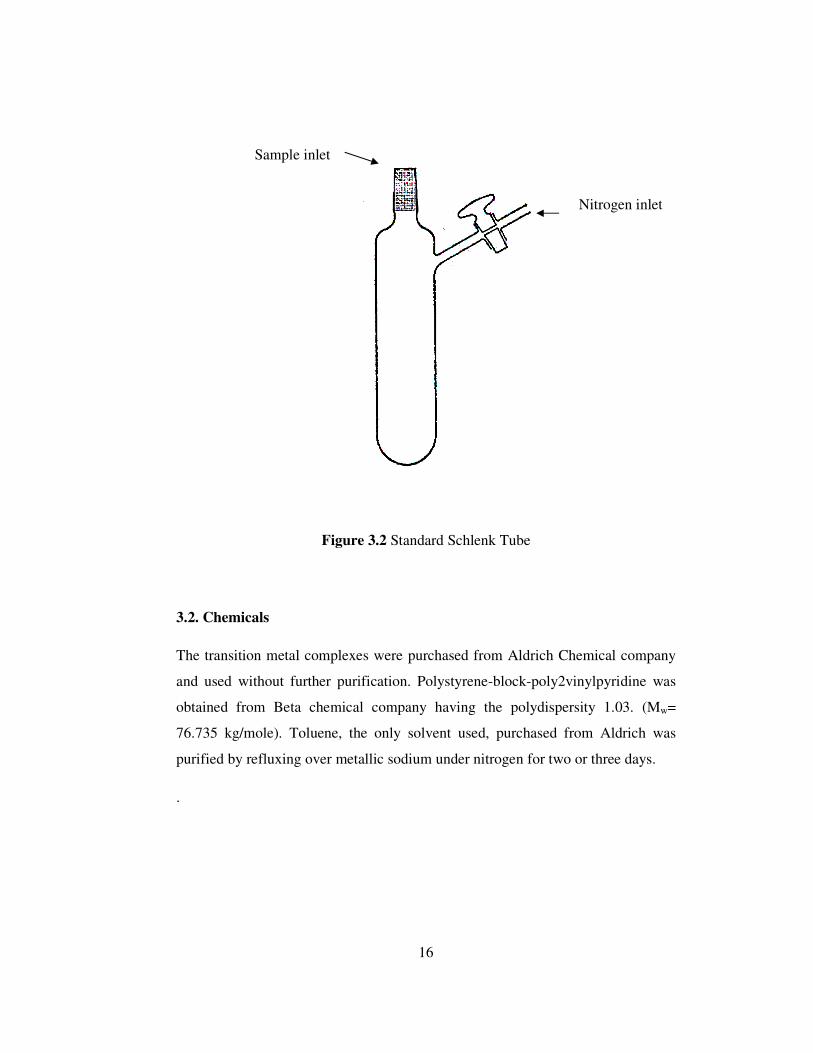
(2) schlenk technique (Figure 3.2) in which a simple two-necked vessel, designed to
permit passage of a nitrogen stream through the narrow neck with the stopcock
while using the wider neck without a stopcock for operations such as inserting a
spatula for scraping or removal of material, can be used. Depending on the
objectives and the air sensitivity of the compounds, one technique or a
combination of techniques is used.
16
Figure 3.2 Standard Schlenk Tube
3.2. Chemicals
The transition metal complexes were purchased from Aldrich Chemical company
and used without further purification. Polystyrene-block-poly2vinylpyridine was
obtained from Beta chemical company having the polydispersity 1.03. (Mw=
76.735 kg/mole). Toluene, the only solvent used, purchased from Aldrich was
purified by refluxing over metallic sodium under nitrogen for two or three days.
.
Sample inlet
Nitrogen inlet

17
3.3. Synthesis of the Complexes
All the complexes were synthesized applying the same procedure known from
literature with some modifications [22]. Table 3.1 lists the transition metal
complexes and the products obtained by thermal reaction of metal complexes with
polystyrene-block-poly(2-vinylpyridine). In this study, the thermal reaction
between the transition metal complexes and PS-b-P2VP were performed by using
two necked flask as shown in Fig. 3.3 with a nitrogen connection. All reactions
were performed in a glow box under deoxygenated nitrogen atmosphere as
Co2(CO)8 is very sensitive to oxygen and quickly decomposes. Actually, all the
other transition metal complexes, namely FeCl3.6H2O, MoO3, Cr(CO)6 and
H(AuCl4).4H2O are not as sensitive as Co2(CO)8 to oxygen yet, all experiments
were again performed in glow box to achieve identical experimental conditions.
The deoxygenation of nitrogen was done using the system shown in Fig 3.1.
Figure. 3.3. The Apparatus Used During the Thermal Reaction.
18
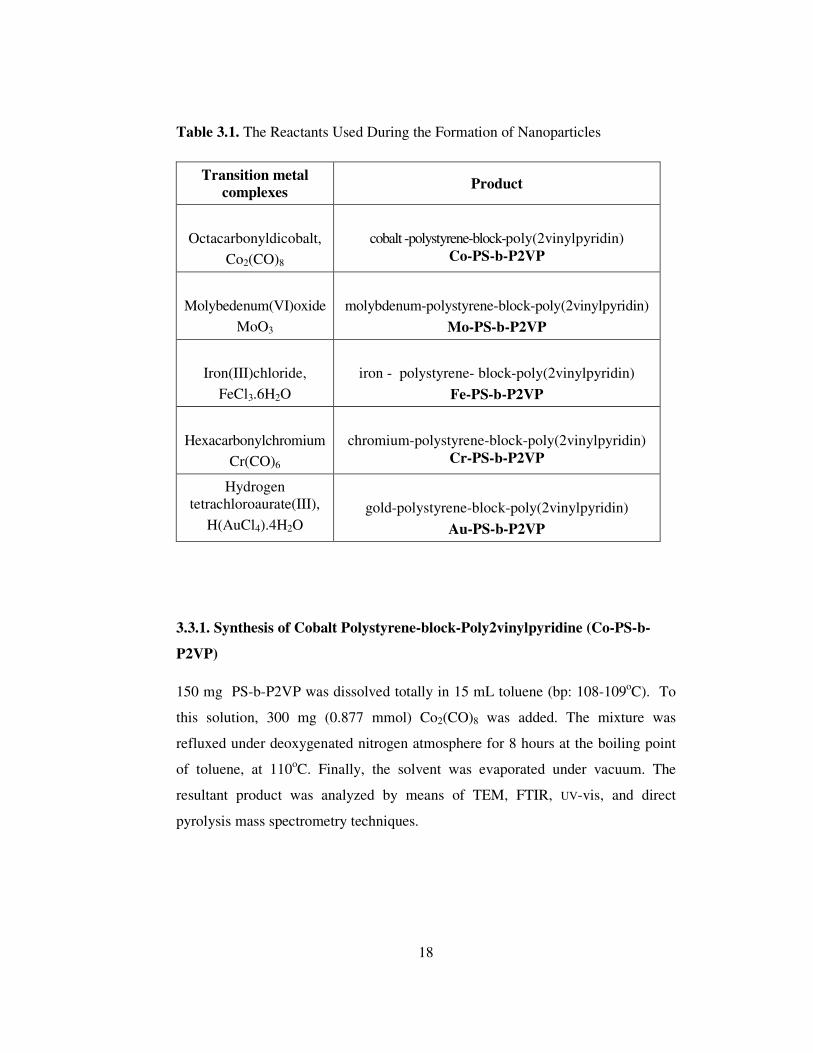
Table 3.1. The Reactants Used During the Formation of Nanoparticles
Transition metal complexes
Product
Octacarbonyldicobalt,
Co2(CO)8
cobalt -polystyrene-block-poly(2vinylpyridin) Co-PS-b-P2VP
Molybedenum(VI)oxide
MoO3
molybdenum-polystyrene-block-poly(2vinylpyridin)
Mo-PS-b-P2VP
Iron(III)chloride,
FeCl3.6H2O
iron - polystyrene- block-poly(2vinylpyridin)
Fe-PS-b-P2VP
Hexacarbonylchromium
Cr(CO)6
chromium-polystyrene-block-poly(2vinylpyridin) Cr-PS-b-P2VP
Hydrogen tetrachloroaurate(III),
H(AuCl4).4H2O
gold-polystyrene-block-poly(2vinylpyridin)
Au-PS-b-P2VP
3.3.1. Synthesis of Cobalt Polystyrene-block-Poly2vinylpyridine (Co-PS-b-
P2VP)
150 mg PS-b-P2VP was dissolved totally in 15 mL toluene (bp: 108-109oC). To
this solution, 300 mg (0.877 mmol) Co2(CO)8 was added. The mixture was
refluxed under deoxygenated nitrogen atmosphere for 8 hours at the boiling point
of toluene, at 110oC. Finally, the solvent was evaporated under vacuum. The
resultant product was analyzed by means of TEM, FTIR, UV-vis, and direct
pyrolysis mass spectrometry techniques.
19
3.3.2. Synthesis of Chromium Polystyrene-block-Poly2vinylpyridine (Cr-PS-
b-P2VP)
300 mg (1.363 mmol) Cr(CO)6 was added to a solution prepared by dissolving 150
mg PS-b-P2VP in 15 mL toluene. The mixture was refluxed for 8 hours at 110oC
under nitrogen atmosphere. The color of the solution turned to dark violet
indicating the coordination of metal to nitrogen. Finally, the solvent was
evaporated under vacuum. The resultant product was analyzed by means of TEM,
FTIR, UV-vis, and direct pyrolysis mass spectrometry techniques.
3.3.3. Synthesis of Gold Polystyrene-block-Poly2vinylpyridine (Au-PS-b-
P2VP)
150 mg PS-b-P2VP was totally dissolved in 15 mL toluene. To this solution 300
mg (0.728 mmol) H(AuCl4).4H2O was added. The mixture was refluxed for 8
hours at 110oC under nitrogen atmosphere. Finally, the solvent was evaporated
under vacuum. The resultant residue was analyzed by means of TEM, FTIR, UV-
vis, and direct pyrolysis mass spectrometry techniques.
3.3.4. Synthesis of Iron Polystyrene-block-Poly2vinylpyridine (Fe-PS-b-P2VP)
300 mg (1.109 mmol) FeCl3.6H2O was added to a solution prepared by dissolving
150 mg PS-b-P2VP in 15 mL toluene. After refluxing the mixture for 8 hours at
110oC, the solvent was evaporated under vacuum and the resultant product was
analyzed by means of TEM.

20
3.3.5. Synthesis of Molybdenum Polystyrene-block-Poly2vinylpyridine (Mo-
PS-b-P2VP)
300 mg (2.084 mmol) MoO3 was added to a solution prepared by dissolving 150
mg PS-b-P2VP in 15 mL toluene. Mixture was refluxed under nitrogen
atmosphere for 8 hours at about 110oC. As mentioned before, the solvent was
evaporated under vacuum. The resultant product was analyzed by means of TEM.
3.4. Characterizations
3.4.1. Transmission Electron Microscope (TEM)
Transmission electron microscope (TEM) imaging of the nanoparticles was
carried out with a Philips CM20 instrument at a 200kV.
The nanoparticles were dispersed on the carbon-coated cupper grid from their
diluted suspension of toluene. The synthesis of the metal nanoparticles were
approved by TEM.
3.4.2. UV-Vis Spectra
The electronic absoption spectra of the samples were recorded on a Varian Cary
100 Bio UV-Vis Spectrophotometer with the concentrations about 1.2 x 10⁻⁵ M.
3.4.3. Infrared Spectra
FTIR analysis of the samples were performed by dropping a drop of samples on
KBr pellet using Nicolet 510 FTIR Spectrometer.
21
3.4.4. Direct Pyrolysis Mass Spectrometry
Direct pyrolysis mass spectrometry (DPMS) system consisting a Waters Quattro
Micro GC tandem mass spectrometer with an EI ion source and a mass range of
10-1500 Da was coupled a direct insertion probe (Tmax = 650oC). In each
experiment, the temperature was kept constant at 50oC for the first five minutes to
remove any absorbed water and then increased to 650oC at a heating rate of
10oC/min, and kept constant for an additional 5 minutes at 650oC. 0.010 mg
samples were pyrolyzed in the quartz sample vials. Pyrolysis experiments were
repeated at least twice to ensure reproducibility. 4200 mass spectra were obtained
for each nano structural metal composite.
22
CHAPTER 4
RESULTS AND DISCUSSION
The characterization of the metal-functional polymers were first achieved by
transmission electron microscope, TEM. For the samples involving metal
nanostructures, characterizations were also performed by UV-visible, FTIR and
direct pyrolysis mass spectrometry techniques.
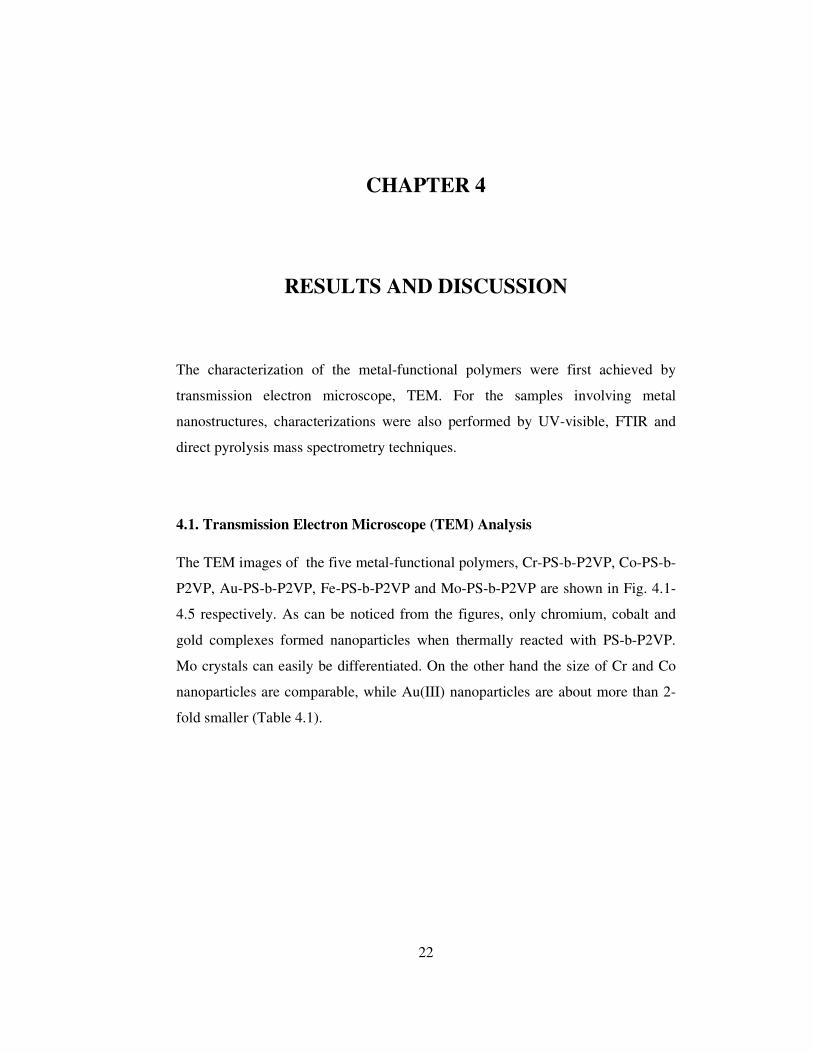
4.1. Transmission Electron Microscope (TEM) Analysis
The TEM images of the five metal-functional polymers, Cr-PS-b-P2VP, Co-PS-b-
P2VP, Au-PS-b-P2VP, Fe-PS-b-P2VP and Mo-PS-b-P2VP are shown in Fig. 4.1-
4.5 respectively. As can be noticed from the figures, only chromium, cobalt and
gold complexes formed nanoparticles when thermally reacted with PS-b-P2VP.
Mo crystals can easily be differentiated. On the other hand the size of Cr and Co
nanoparticles are comparable, while Au(III) nanoparticles are about more than 2-
fold smaller (Table 4.1).
23
Table 4.1. Size of Nanoparticles
Name of Nanoparticle Size of Nanoparticle (nm)
Chromium 20
Cobalt 20
Gold(III) 10
Figure 4.1. TEM Images of Cr-PS-b-P2VP
24
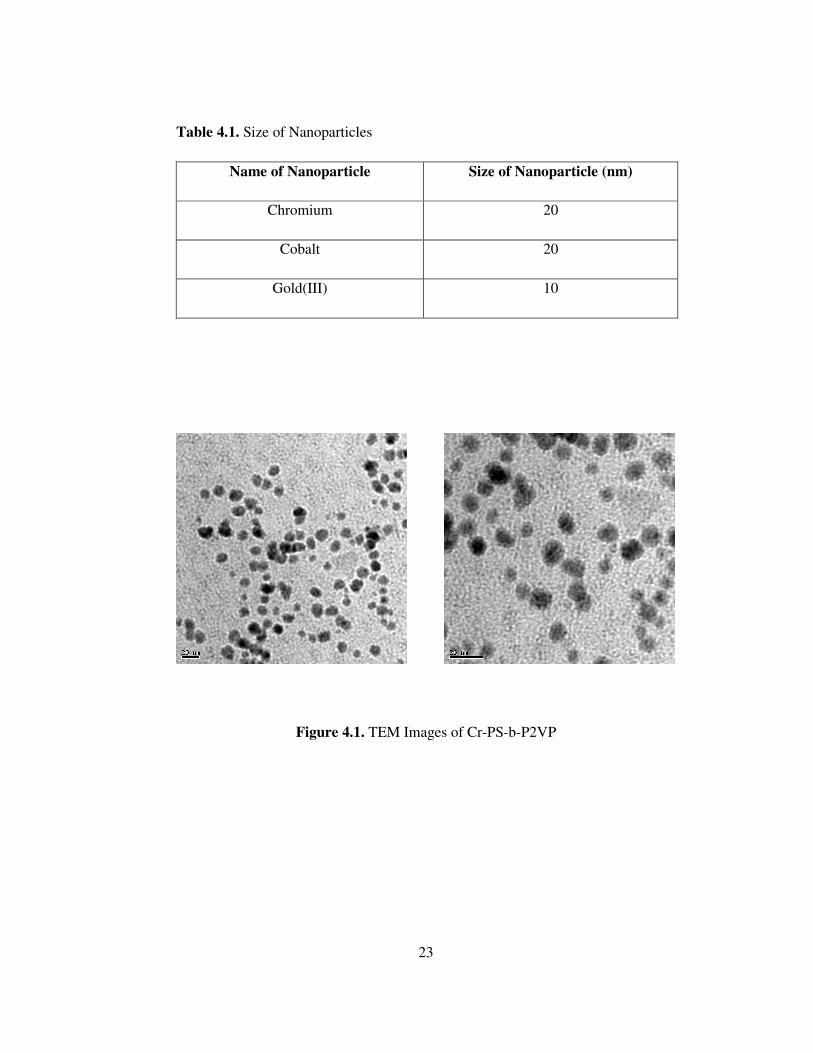
Figure 4.2. TEM Images of Co-PS-b-P2VP
Figure 4.3. TEM Images of Au-PS-b-P2VP
25
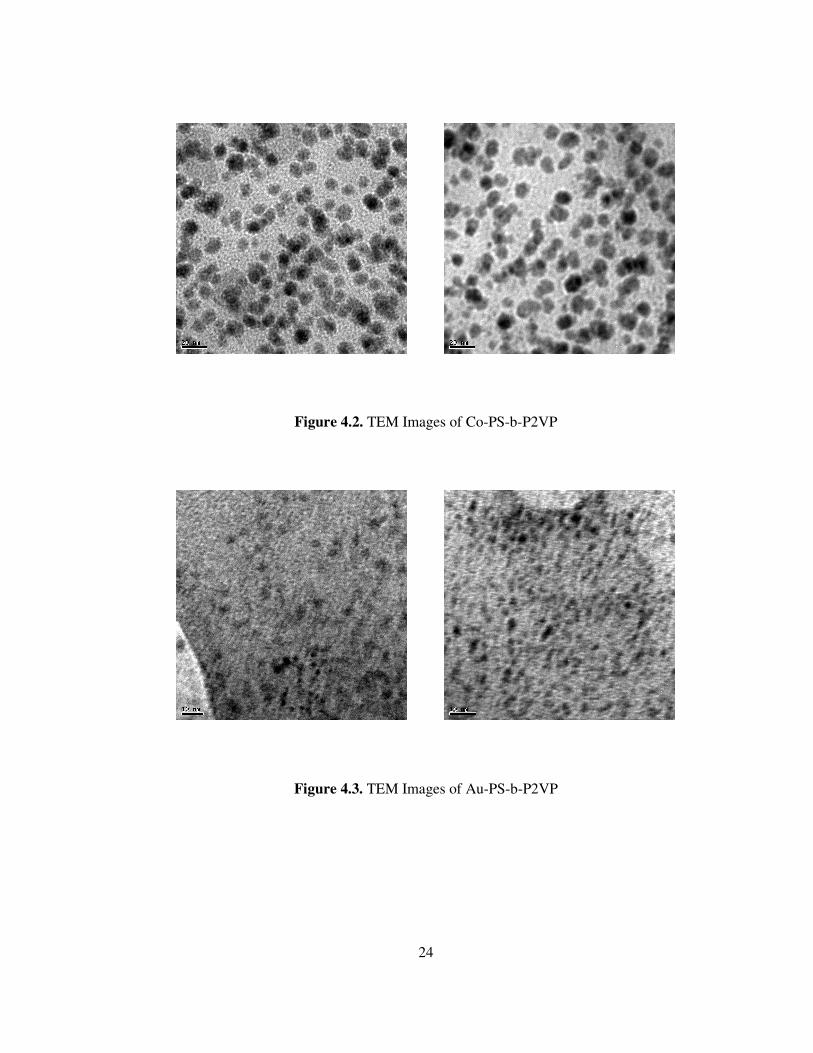
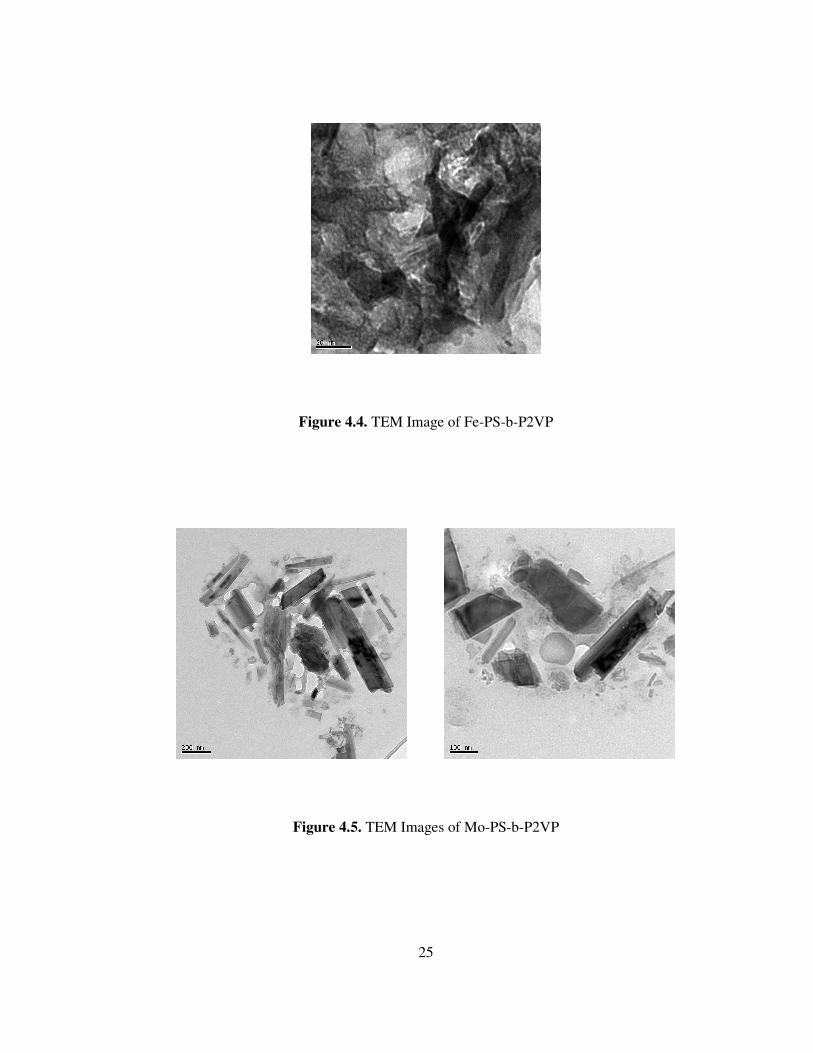
Figure 4.4. TEM Image of Fe-PS-b-P2VP
Figure 4.5. TEM Images of Mo-PS-b-P2VP

26
4.2 UV-Vis Characterization
4.2.1 Chromiumpolystyrene-block-poly(2-vinylpyridine)
Chromium nano particles are formed from the thermolysis of low spin Cr(CO)6
complex with PS-b-P2VP. The UV-vis spectrum of the copolymer PS-b-P2VP
shows an π→π* transition band at around 295 nm due to pyridine and benzene
ring. The starting organometallic complex Cr(CO)6 involves an excellent π
acceptor ligand, carbonyl, (having low lying π*), thus, the UV-vis spectrum of the
electron rich chromium atom shows a very strong absorption band at around 295-
300 nm, due to metal to ligand charge transfer transition (MLCT).
In the UV-vis spectrum of the product Cr-PS-b-P2VP, the broad shoulder appeared
at around 330 nm is attributed to a MLCT transition from chromium atom to π*
orbital of pyridine group. A weak absorption band is also observed at around 440
nm originating from ligand field transition (d-d transition) (Fig. 4.6).

27
Figure 4.6. UV-Vis spectra of Cr-PS-b-P2VP, Cr(CO)6, PS-b-P2VP
4.2.2 Cobaltpolystyrene-block-poly(2-vinylpyridine)
Cobalt nano particles are formed from the thermolysis of low spin Co2(CO)8
complex with PS-b-P2VP. Co2(CO)8 shows a very intense absorption peak at
around 295 nm resulting from a MLCT transition from cobalt metal to π* orbital of
carbonyl group as observed in the case of chromium. For this complex, a broad
middle intense band is also present as a shoulder at around 360 nm and may be
associated with a spin forbidden MLCT transition.
The absorption spectrum of Co-PS-b-P2VP shows a very broad band. Some other
absorptions bands arising from spin forbidden MLCT transitions and ligand field
(LF) transition may be overlapped by this broad band (Fig. 4.7).

28
Figure 4.7. UV-Vis spectera of Co-PS-b-P2VP, Co2(CO)8 and PS-b-P2VP
4.2.3 Goldpolystyrene-block-poly(2-vinylpyridine)
Au(III) with its d8 electronic configuration forms a variety of square-planar
complexes. Since AuIII is an oxidizing agent, low-energy LMCT transitions are
quite important. However, for this complex, MLCT transitions do not exist due to
the lack of reducing properties of Au(III). As in the case of most of the electronic
spectra of various halide compounds of gold [23-27], it is difficult to make
complete assignments of absorption peaks due to the complications caused by the
appearance of LMCT and less intense LF bands in the same energy range. UV-vis
spectrum of the square planar tetrachloroaurate(III) complex exhibits LMCT
transitions at around 295 nm. A broad shoulder appears at around 410 nm may be
29
attributed to spin forbidden LMCT transition. The less intense d-d transition may
be under this broad LMCT band.
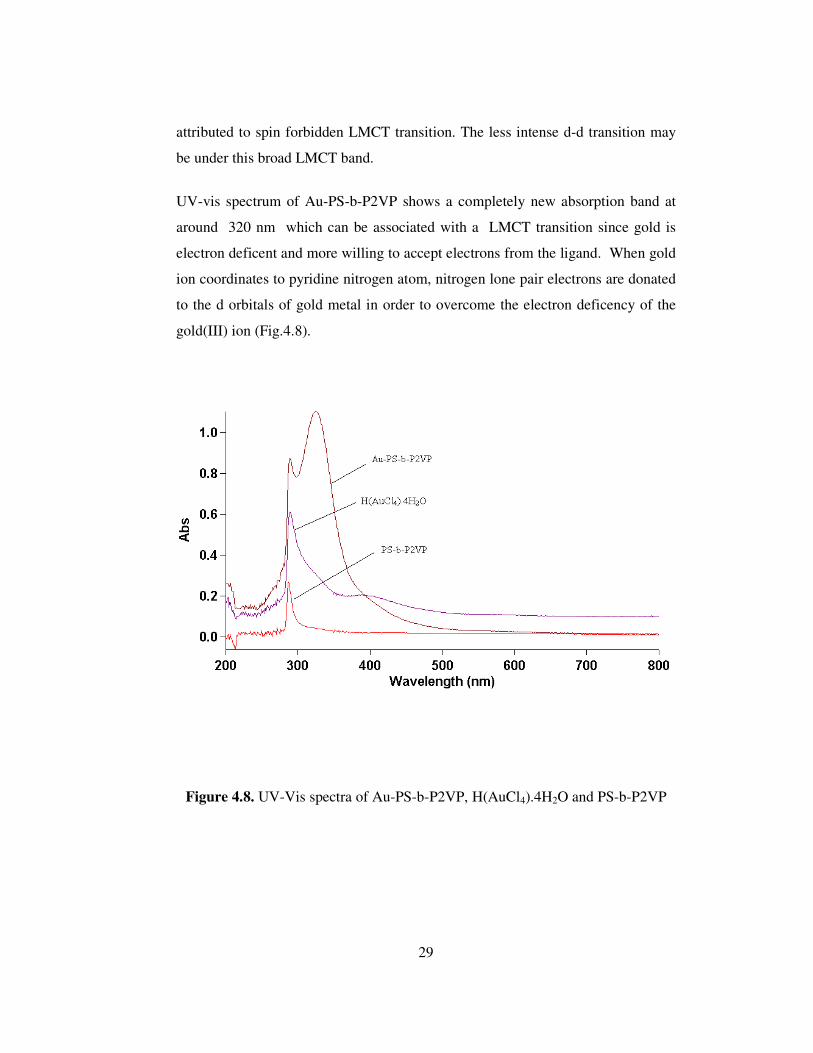
UV-vis spectrum of Au-PS-b-P2VP shows a completely new absorption band at
around 320 nm which can be associated with a LMCT transition since gold is
electron deficent and more willing to accept electrons from the ligand. When gold
ion coordinates to pyridine nitrogen atom, nitrogen lone pair electrons are donated
to the d orbitals of gold metal in order to overcome the electron deficency of the
gold(III) ion (Fig.4.8).
Figure 4.8. UV-Vis spectra of Au-PS-b-P2VP, H(AuCl4).4H2O and PS-b-P2VP
30
4.3 FTIR Characterization
The formation of metal nanoparticles by reacting organometallic precursors in
solutions of copolymer aggregates is known from literature [28-31]. It is known
that aggregations were generated upon formation of metal nanoparticles by
reactions of organometallic precursors with copolymers in solutions. These have
included solutions of block copolymers [32,33] and surfactants [34]. In the
literature studies, in all systems, the coordinating species consisted of pendent
moieties that were polar than the solvent system employed for particle formation
[35]. The hypothesis was that the metal precursors coordinates with an electron-
rich segment of the copolymer (Fig. 1.2) and, upon heating the copolymers
displace the precursor ligands (e.g. carbon monoxide, halides etc) to afford metal
nanoparticles encased in copolymer sheath. It is reasoned that this could result
from diffusion of the metal precursor into the core of a copolymer micelle where
coordination and then reaction takes place. The same strategy was used in the
present work. The organometallic precursors reacted thermally with PS-b-P2VP
for 8 hours for the generation of metal nanoparticles. The nanoparticle formation
starts by the coordination of the electron-rich segment of the copolymer that is 2-
vinylpyridine, to the metal atom with the exclusion of the ligands. As a result, by
the coordination of pyridine nitrogen to the metal atom or ion, the pyridine
stretching and bending modes should be affected.
The FTIR spectrum of polystyrene-b-poly2-vinylpyridine (PS-b-P2VP), shows the
characteristic absorption peaks of P2VP blocks at around 1594, 1472, 1431, 991,
and 546 cm-1 for the C-H pyridine ring stretching mode and 750 cm-1 for the C-H
pyridine bending mode. Polystyrene block of the copolymer gives absorption
peaks at around 2500-3000 cm-1 due to C-H groups of phenyl ring. Several peaks
in the range 1500-2500 cm-1 are assigned to C-C stretching modes of the aromatic
rings, benzene and pyridine.
31
4.3.1 Chromiumpolystyrene-block-poly(2-vinylpyridine)
Actually, the most valuable information obtained from FTIR spectrum of Cr-PS-b-
P2VP is the disappearence of the very intense absorption peak of carbonyl ligand
of hexacarbonylchromium complex at around 2000 cm-1. The metal vibrations
have been observed in the range 500-200 cm-1 in the coordination complexes
involving metal nitrogen bonds [36]. Thus, the new absorption peak appeared at
around 464 cm-1 is attributed N-Cr stretching due to coordination of the pyridine
nitrogen to the chromium metal. Significant changes were detected in the FTIR
spectrum of Cr-PS-b-P2VP compared to that of the copolymer (Fig. 4.9). The
relative intensities of the absorption peaks, in the range of 1590-600 cm-1,
especially, the ones at around 1594 cm-1 1472 and 1431 cm-1 due to the pyridine
strecthing and bending modes are decreased significantly. Furthermore, significant
decreases in the intensity of the peaks present in 1500-2500 cm-1 range (where
peaks due to C-C and C=C bond stretchings of the aromatic rings, both pyridine
and styrene) are also detected upon coordination of the chromium metal to the
pyridine nitrogen. On the other hand, the absorption peaks due to C-H stretching
modes at around 2500-3000 cm-1 seemed to be not affected much.

32
1590 - 600
Figure 4.9. FTIR Spectra of PS-b-P2VP and Cr-PS-b-P2VP
4.3.2 Cobaltpolystyrene-block-poly(2-vinylpyridine)
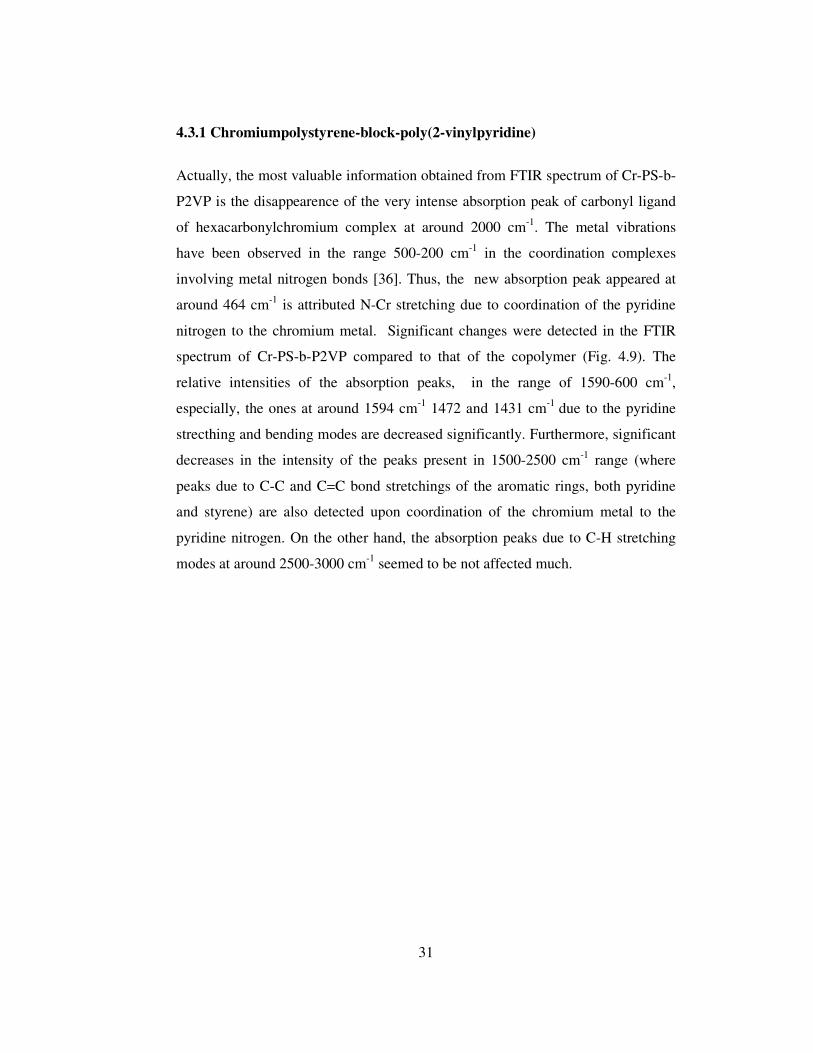
The starting material, bimetallic cobalt complex has two types of carbonyl groups,
namely, terminal and bridging. Having a C2v symmetry, three absorption peaks for
the terminal CO groups (νCO : 2023, 2041, 2071 cm-1 ) and one absorption peak for
the two collinear bridging carbonyl groups (νCO: 1847 cm-1) are expected.
(Fig.4.10). For the Co-PS-b-P2VP, the overlap of bridging carbonyl stretching
peaks with characteristic polystyrene peaks is expected. Thus, in order to
investigate the displacement of CO ligands by pyridines, the changes in the peaks
associated with terminal carbonyl groups (2023, 2041, 2071 cm-1) are analyzed. It
can clearly be seen from Fig 4.10 that, the FTIR spectrum of the cobalt-functional
polymer does not show any peak that can be attributed to absorption of terminal
carbonyl groups confirming displacement of carbonyl groups completely. The new
absorption peak appeared at around 467 cm-1 is again associated with N-metal
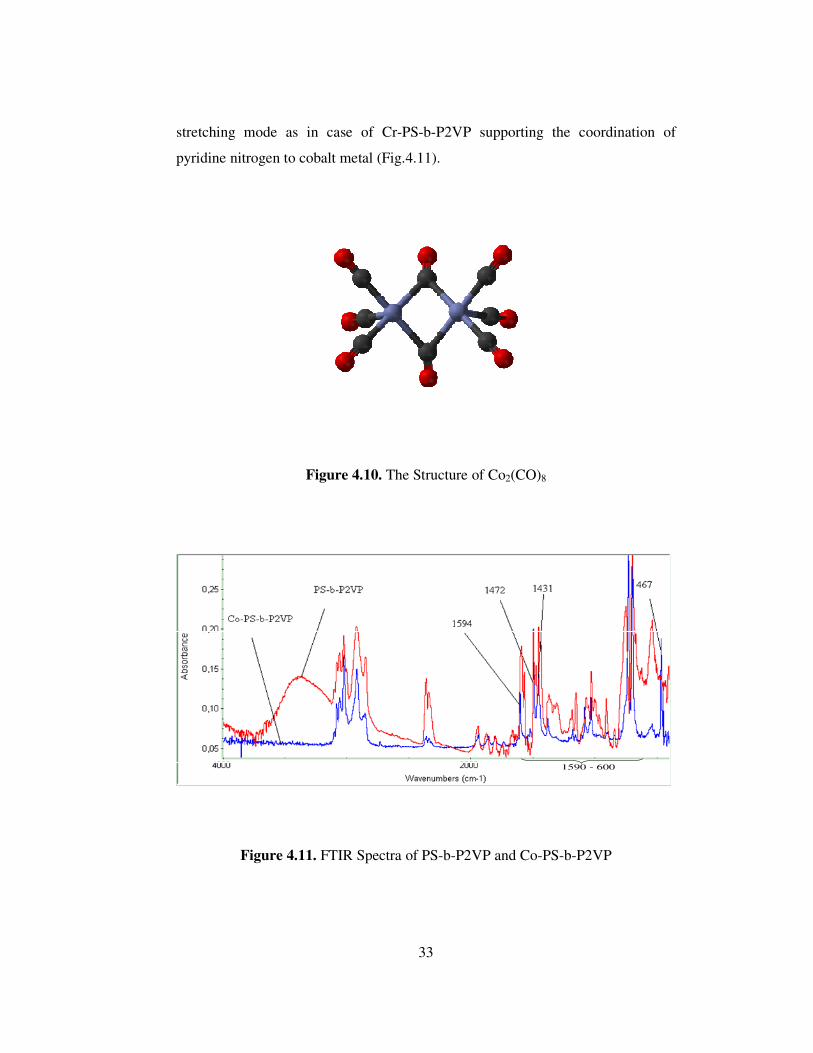
33
stretching mode as in case of Cr-PS-b-P2VP supporting the coordination of
pyridine nitrogen to cobalt metal (Fig.4.11).
Figure 4.10. The Structure of Co2(CO)8
1590 - 600
Figure 4.11. FTIR Spectra of PS-b-P2VP and Co-PS-b-P2VP
34
Similarly, the intensity of the absorption peaks in the range of 1590-600 cm-1 due
to the pyridine stretching and bending modes drastically decrease as a result of the
coordination of pyridine nitrogen to the cobalt metal.
4.3.3 Goldpolystyrene-block-poly(2-vinylpyridine)
The coordination of pyridine nitrogen to the gold(III) ion has been confirmed
again by the changes in the intensities of the absorption peaks as in the cases of
Cr-PS-b-P2VP and Co-PS-b-P2VP. Worthwhile changes are observed, especially
in the range of 1590-600 cm-1, where pyridine stretching and bending modes were
observed, indicating the coordination of the pyridine nitrogen to the gold ion. As in
the cases of Cr and Co samples mentioned before, the new absorption peak
appeared at around 467 cm-1 supports the coordination of pyridine nitrogen to the
gold ion but different from chromium and cobalt complexes, gold(III) ion is
electron deficient and pyridine nitrogen donates its lone pair to the gold(III) ion
through σ bonding (Fig. 4.12).

35
1590 - 600
Figure 4.12. FTIR spectra of PS-b-P2VP and Au-PS-b-P2VP
4.4 Direct Pyrolysis Mass Spectrometry Characterization
As discussed before analysis of pyrolysis mass spectra of even homopolymers are
quite complicated. In our case, as the samples under investigation, involving
metals and block copolymers, having a quite complex structure should be expected
to yield very complex pyrolysis mass spectra. Thus, in order to have a better
understanding, pyrolysis mass spectra of the metal-functional copolymers were
compared with those of the homopolymers, namely polystyrene and poly(2-
vinylpyridine) and the copolymer, polystyrene-block-poly(2-vinylpyridine).
4.4.1 Polystyrene-block-poly(2-vinylpyridine)
Thermal decomposition of poly(2-vinyl pyridine) occurs by opposing reactions
[37].
36
a. Depolymerization yielding mainly monomer
b. Loss of pyridine
c. Proton transfer to N atom yielding unsaturated linkages on the polymer
backbone which in turn increases thermal stability.
It is known that the thermal degradation of PS takes place by a free-radical chain
reaction, depolymerization, yielding mainly the styrene monomer and low
molecular weight oligomers [38-41].
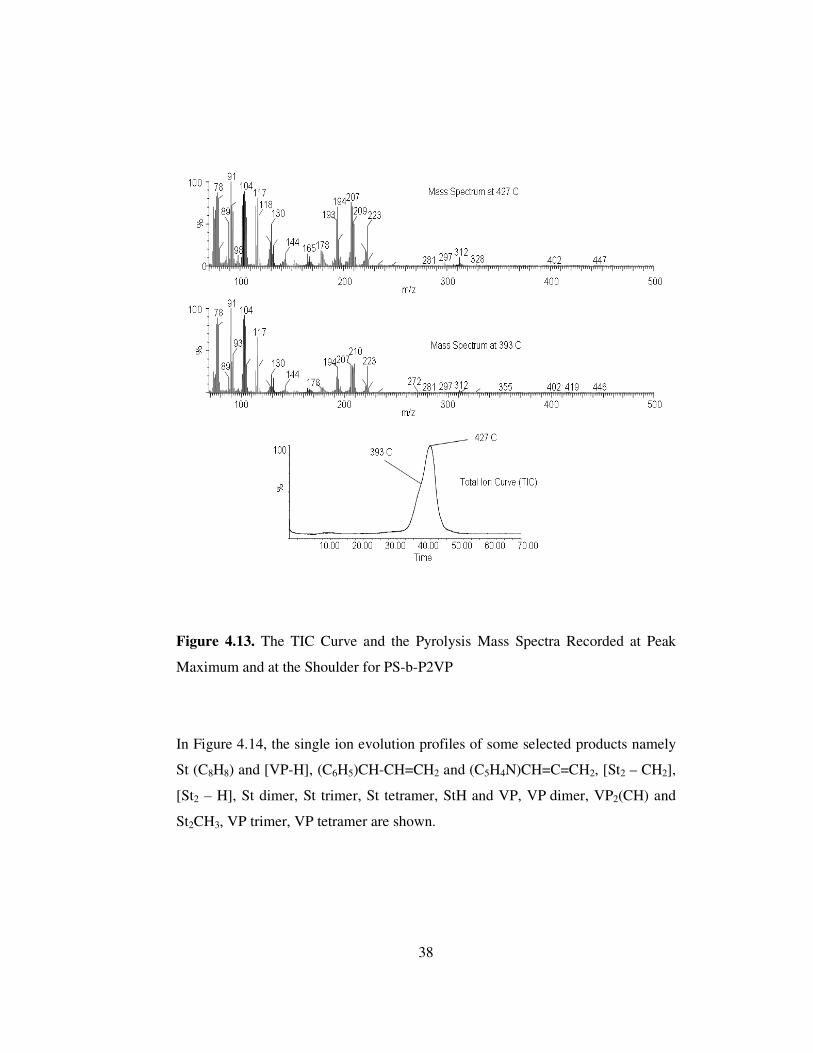
In Figure 4.13, total ion current (the variation of total ion yield as a function of
temperature), (TIC) curve and the pyrolysis mass spectra at the peak maximum, at
427oC and at the shoulder, at 393oC, recorded during the pyrolysis of polystyrene-
block-poly(2-vinylpyridine) are shown. A weak peak with maximum around
110oC was also detected. Analyses of mass spectra indicated that the low
temperature peak at 110oC was due to evolution of the solvent, toluene adsorbed
on the sample. Above 350oC, generation of series of fragments such as Mx, [Mx-
CH2], [Mx-CH], MxCH, MxCH2, MxC≡CH, MxCH=CH2 where M is either C6H5 or
C5H4N and x =1, 2, 3, or 4 were observed. Peaks due to fragments stabilized by
hydrogen exchange reactions were also detected [37]. In Table 4.2 the series of
fragments detected and their m/z values are summarized.

37
Table 4.2. Series of Fragments Generated During the Pyrolysis of Polystyrene-
block-Poly(2-vinylpyridine)
M X
Styrene 2-vinyl pyridine
1 2 3 4 1 2 3 4
Mx, 104 208 312 416 105 210 315 420
[Mx-CH2] 194 298 402 196 301 406
[Mx-CH] 91 193 297 401 92 195 300 405
MxCH 117 221 325 429 118 223 328 433
MxCH2 118 222 326 430 119 224 329 434
MxC≡CH 129 233 337 447 130 235 340 445
MxCH=CH2 131 235 339 443 132 237 342 447
For the copolymer, the base peak was at m/z=91 Da due to C7H7, and the most
intense peaks were due to styrene (St) and vinylpyridine (VP) monomers and low
mass oligomers in accordance with the literature results [37]. The relative
intensities and the assignments made for the intense and characteristic peaks
detected during the pyrolysis of the copolymer are collected in Table 4.3.
38
Figure 4.13. The TIC Curve and the Pyrolysis Mass Spectra Recorded at Peak
Maximum and at the Shoulder for PS-b-P2VP
In Figure 4.14, the single ion evolution profiles of some selected products namely
St (C8H8) and [VP-H], (C6H5)CH-CH=CH2 and (C5H4N)CH=C=CH2, [St2 – CH2],
[St2 – H], St dimer, St trimer, St tetramer, StH and VP, VP dimer, VP2(CH) and
St2CH3, VP trimer, VP tetramer are shown.

39
Figure 4.14. Single Ion Evolution Profiles of Some Selected Characteristic
Products of PS-b-P2VP
Pyrolysis mass spectrometry data showed that both of the components degraded
independently. Thermal stability of poly(2-vinyl pyridine) blocks were lower than
that of polystyrene blocks. The yields of thermal degradation products of P2VP
and PS were maximized at around 418, and 427°C respectively. Evolution profiles

40
of protonated oligomers of P2VP showed maxima at slightly higher temperatures
compared to corresponding oligomers, around 421°C.
Table 4.3. Relative Intensities and the Assignments for the Intense and/or
Characteristic Peaks in the Pyrolysis Mass Spectra of PS-b-P2VP
Recorded at the Given Temperatures.
m/z 418oC 427oC PS-b-P2VP Assignment 91 1000 1000 C7H7, C6H5N
92 693 673 C7H8, C6NH6
104 882 848 St, C8H8, [VP-H]
105 764 727 StH, VP
116 223 272 (C6H5)CH=C=CH2,
117 790 746 (C6H5)CH-CH=CH2, (C5H4N)CH=C=CH2
118 587 539 (C5H4N)CH-CH=CH2, StCH2
129 249 334 StC≡CH
130 477 460 PVC≡CH
165 136 154 C13H8,
178 166 201 C15H11
179 155 187 C15H12
194 687 702 [St2 – CH2]
195 296 261 [St2 – CH], [VP2 – CH3]
207 739 729 [St2 – H]
208 689 679 St dimer
209 518 411 St2H, [VP2 – H]
210 517 335 VP dimer
211 98 75 VP2H
221 175 182 St(C6H5)CH-CH=CH2 , VP(C5H4N)C=C=CH2
223 6.2 325 VP2(CH) St2CH3
312 94 122 St trimer 315 7.3 6.7 VP trimer
316 6.9 6.9 VP3H
416 2.4 1.8 St tetramer,
419 0.7 0.4 [VP4 – H]
420 0.6 0.4 VP tetramer
41
4.4.2. Chromiumpolystyrene-block-poly(2-vinylpyridine)
In Figure 4.15, the TIC curve and the pyrolysis mass spectra recorded at the peaks
present in the TIC curve are shown. Again, the low temperature peak around
110oC was due to evolution of solvent. The high temperature peaks showed
maxima were at 415oC and 484oC indicating a significant increase in thermal
stability compared to the copolymer. The relative intensities and the assignments
made for the intense and/or characteristic peaks are collected in Table 4.4.
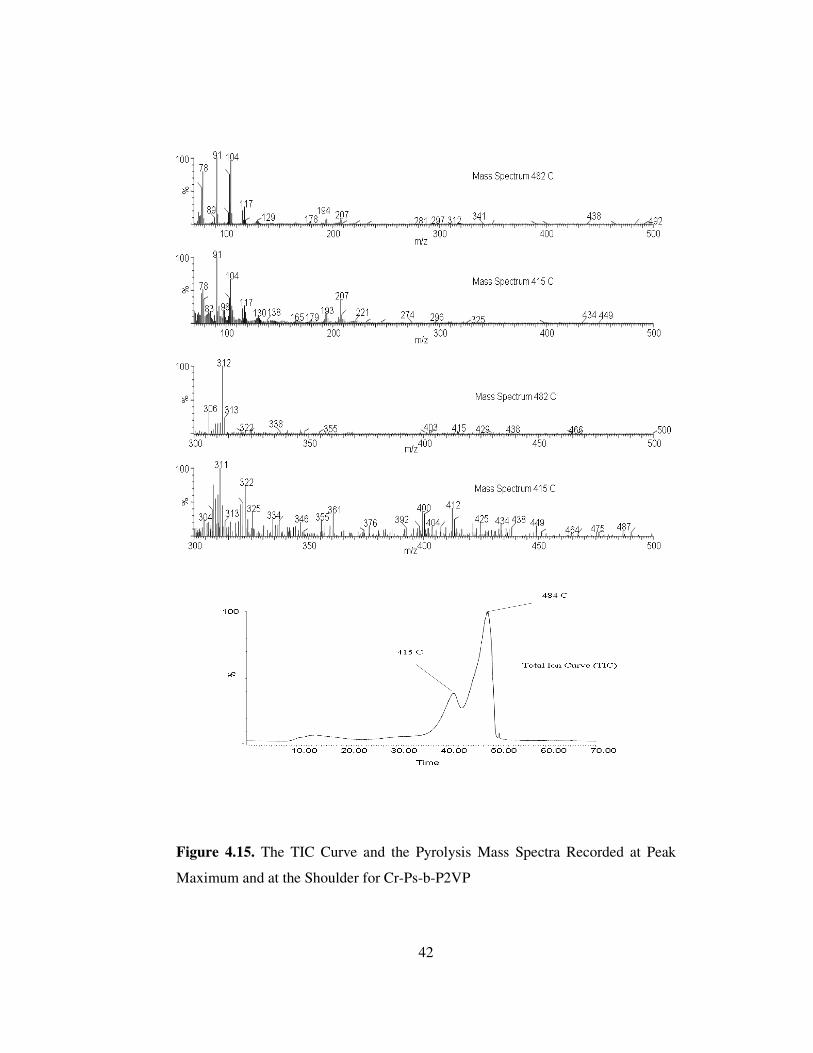
42
Figure 4.15. The TIC Curve and the Pyrolysis Mass Spectra Recorded at Peak
Maximum and at the Shoulder for Cr-Ps-b-P2VP

43
Table 4.4. Relative Intensities and the Assignments for the Intense and/or
Characteristic Peaks of Cr-PS-b-P2VP
m/z 408oC 414oC 482oC 491oC Cr-PS-b-P2VP Assignment
78 988 1000 829 890 C6H7, C5H5N
91 546 750 1000 1000 C7H7, C6NH5
104 797 904 232 894 St, C8H8, [VP-H]
105 506 486 879 696 StH, VP
106 1000 919 116 87 VPH
117 434 428 700 474 (C6H5)CH-CH=CH2, (C5H4N)CHCCH2
118 370 323 331 253 (C5H4N)CH-CH=CH2, StCH2
129 30 34 552 430 StC≡CH
130 366 335 131 93 PVC≡CH, StC=CH2
131 107 103 81 64 StCH=CH2
132 183 165 14 11 PVCH=CH2 , HStCH=CH2
165 31 38 160 125 C13H10,
194 160 152 506 355 [St2 – CH2]
207 492 481 645 524 [St2 – H]
208 210 201 329 220 St2 dimer, C16H16
210 28 184 10 7 VP2 dimer
211 156 149 5.7 4.7 VP2H
221 262 233 97 69 St(C6H5)CH-CH=CH2
223 371 309 6.9 4.4 VP2(CH) St2CH3
233 30 27 28 18 St2C≡CH
235 23 23 5.9 5.8 PV2C≡CH, St2CH=CH2
267 3.6 3.5 2.4 2.3 C21H15
281 9 10 3.7 6.8 C22H17
298 11 14 14 14 [St3 – CH2]
306 3.2 3.8 37 36 C24H18
312 18 18 80 1.8 St3 trimer, C24H24
315 12 14 1.1 3.0 VP3 trimer
316 51 48 1.6 2.3 VP3H
328 61 52 1.2 1.4 VP2(C5H4N)CH-CH=CH2
355 1.3 1.3 1.7 0.2 VP3C3H4, C27H31
401 1.1 1.3 5.2 5.4 [St4 – CH], C31H29
429 3.5 3.1 2.3 2.4 C33H33
496 0.1 0.1 0.2 0.2 C38H40
506 0.4 0.1 0.3 0.0 C39H38
44
The changes in the appearance of the TIC curve with multiple peaks were quite
significant. In general, the presence of more than one peak in the TIC curve and/or
in the evolution profiles indicates the presence of units with different thermal
stabilities. In general, the yields of products gradually decreased as the mass of the
fragment increased. However, significant changes in the relative intensities of the
product peaks compared to the copolymer were recorded. The relative intensities
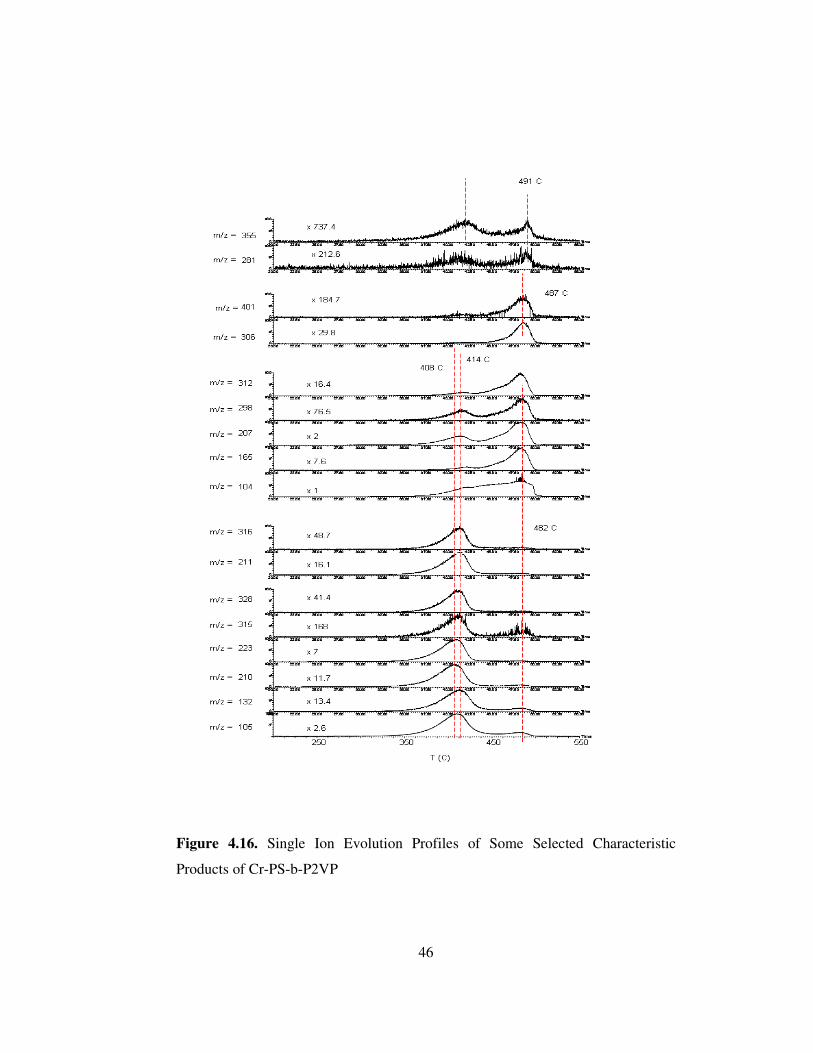
of P2VP dimer peak decreased about three folds. In Figure 4.16 single ion
evolution profiles of some selected characteristic products are shown.
The products can be grouped considering the similarities in their evolution
profiles. P2VP based products such as monomer (m/z=105), dimer (m/z=210),
trimer (m/z=315) and tetramer (m/z=420) showed two peaks in their single ion
pyrograms with maxima at around 408 and 483°C, the first being more intense and
the second being quite weak. The protonated oligomers of P2VP, mainly due to
H-transfer to N atom in the pyridine ring, reached maximum yield at slightly
higher temperatures as in the case of pure copolymer at around 414°C. The high
temperature peak was almost absent in the single ion pyrograms of the protonated
oligomers. Series of products VPxCH, VPxC2H and VPxC2H3 also showed similar
evolution profiles indicating random cleavages along the main chain and loss of
pyridine units.
Two peaks were also present in the single ion evolution profiles of PS based
products with maxima at around 414 and 483°C, but, now, the second peak was
more intense. Furthermore, a shoulder around 458°C was present. Again, series of
products such as Stx, StxCH, StxC2H and StxC2H3 showed similar trends in their
evolution profiles. In general, for both components, the products generated by
random cleavages of main chain were more intense. The peaks due to products
generated by loss of C5H4N groups were more intense than the corresponding
ones due to loss of C6H5 groups.
Most of these products were also detected during the pyrolysis of the pure
copolymer, however, it is clear that significant changes both in the trends observed
45
in the evolution profiles and in the relative yields have occured. In the case of the
copolymer, VP oligomers and protoned oligomers reached maximum yields at
around 411 and 418°C respectively, whereas, PS based products maximized at
around 428°C. For Cr-functional copolymer, in general, the relative intensities of
oligomers decreased, and almost all products showed two peaks in their evolution
profiles. For both components the low temperature peak with maximum at around
408-415°C may be attributed to decomposition of units retaining the thermal
characteristics of the starting copolymer. However, presence of high temperature
peak with maximum at 483°C in the evolution profiles of both components
indicated existance of chains having significantly higher thermal stability. Another
point that should be noticed was the relative yields of these peaks. For P2VP based
products the low temperature peak was significantly more intense, whereas for PS
based products an opposite trend was observed, the high temperature peak was
noticeably more intense. These observations indicated that the presence of Cr
metal affected thermal stability of both components of the copolymer.
Two set of products with m/z values 306, 401, 506 etc and 281, 355, 429, 496 etc
also showed similar evolution profiles at high temperatures. These peaks were
either totally absent or very weak in the pyrolysis mass spectra of the copolymer
and the corresponding products showed identical evolution profiles with other PS
or P2VP based products. Thus, it can be concluded that these products were
mainly generated in the presence of Cr. Among these, the products with m/z values
306, 401 and 506 showed a single peak with maximum at 487°C . The others with
m/z values 281, 355, 429 and 496 showed two maxima at 418 and 491°C (Fig.
4.16).
46
Figure 4.16. Single Ion Evolution Profiles of Some Selected Characteristic
Products of Cr-PS-b-P2VP
47
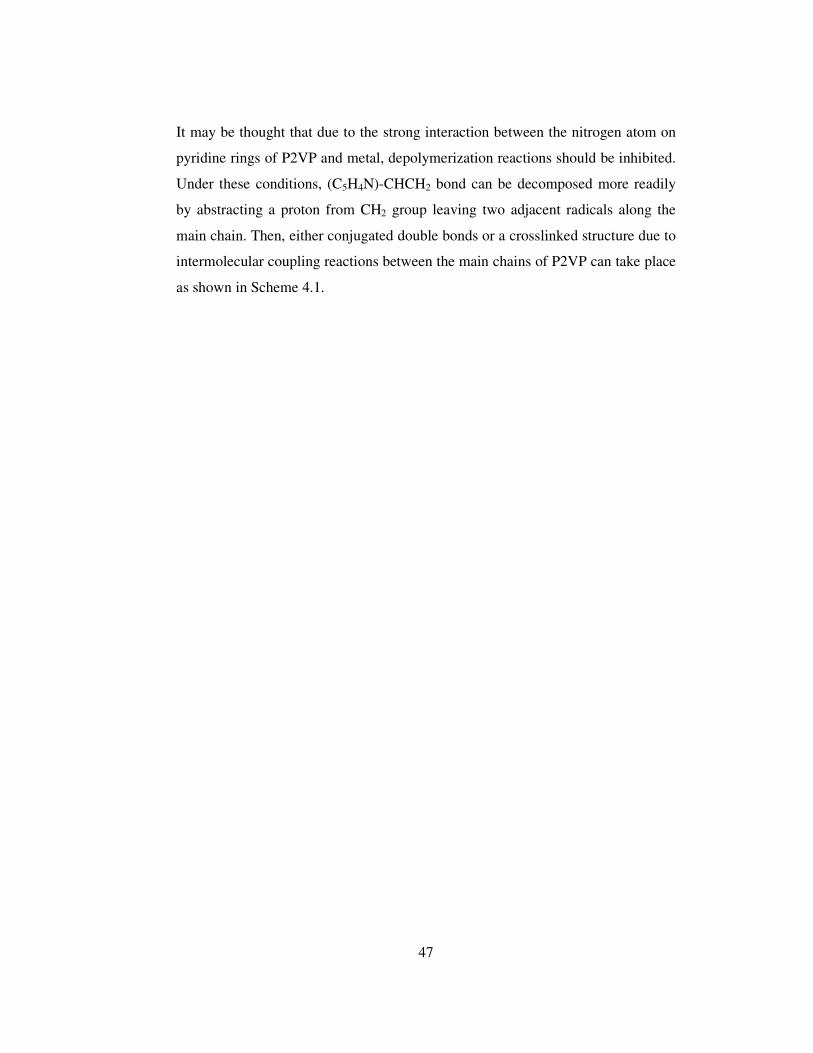
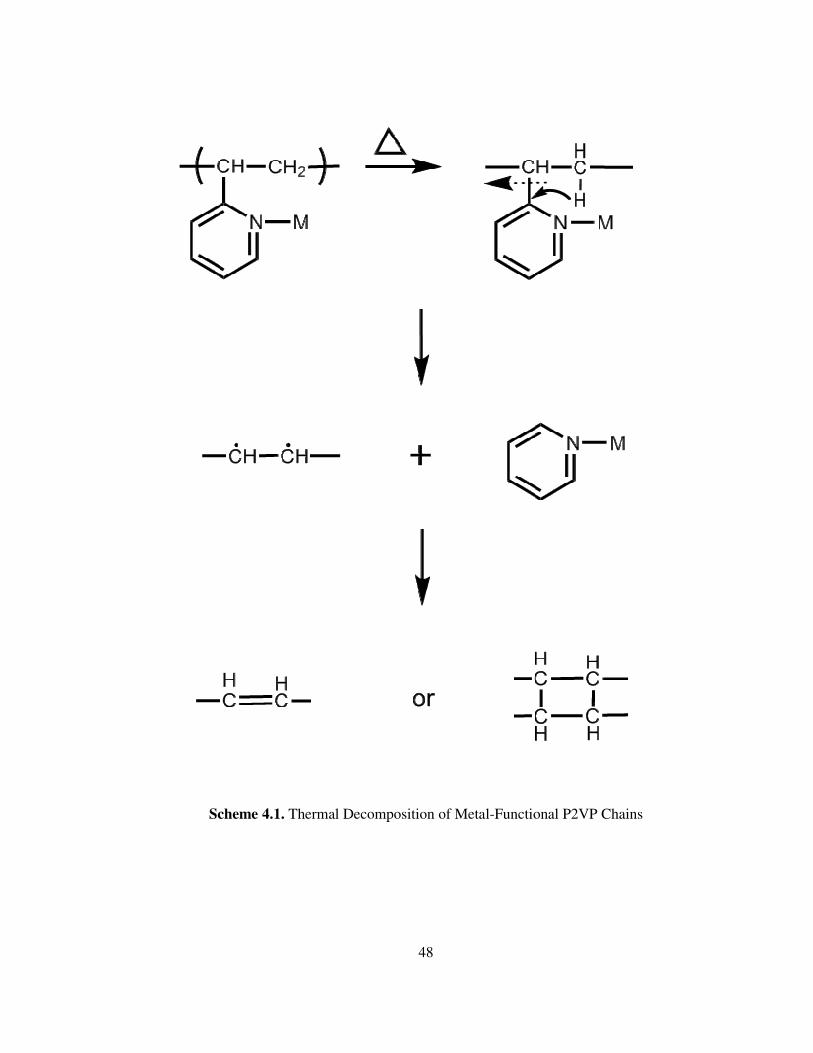
It may be thought that due to the strong interaction between the nitrogen atom on
pyridine rings of P2VP and metal, depolymerization reactions should be inhibited.
Under these conditions, (C5H4N)-CHCH2 bond can be decomposed more readily
by abstracting a proton from CH2 group leaving two adjacent radicals along the
main chain. Then, either conjugated double bonds or a crosslinked structure due to
intermolecular coupling reactions between the main chains of P2VP can take place
as shown in Scheme 4.1.
48
Scheme 4.1. Thermal Decomposition of Metal-Functional P2VP Chains

49
Decomposition of a conjugated double bonded system would yield series of
(C2H2)x fragments and products involving H deficiency at high temperatures in
accordance with present results. Then, contributions of (C2H2)x fragments
(generated by the degradation of conjugated or crosslinked structures formed after
the cleavage of metal-pyridine units) to some of the characteristic peaks of PS
based products can be expected. Thus, it can be concluded that thermal
decomposition of units involving metal-pyridine coordination through nitrogen
occurred through the reaction pathways given in Scheme 4.1, explaining the
significant decrease in the yield of P2VP based products. It can further be
concluded that, the high temperature evolutions detected in the evolution profiles
of PS based products were mainly due to the decomposition of conjugated or
crosslinked structures generated at early stages.
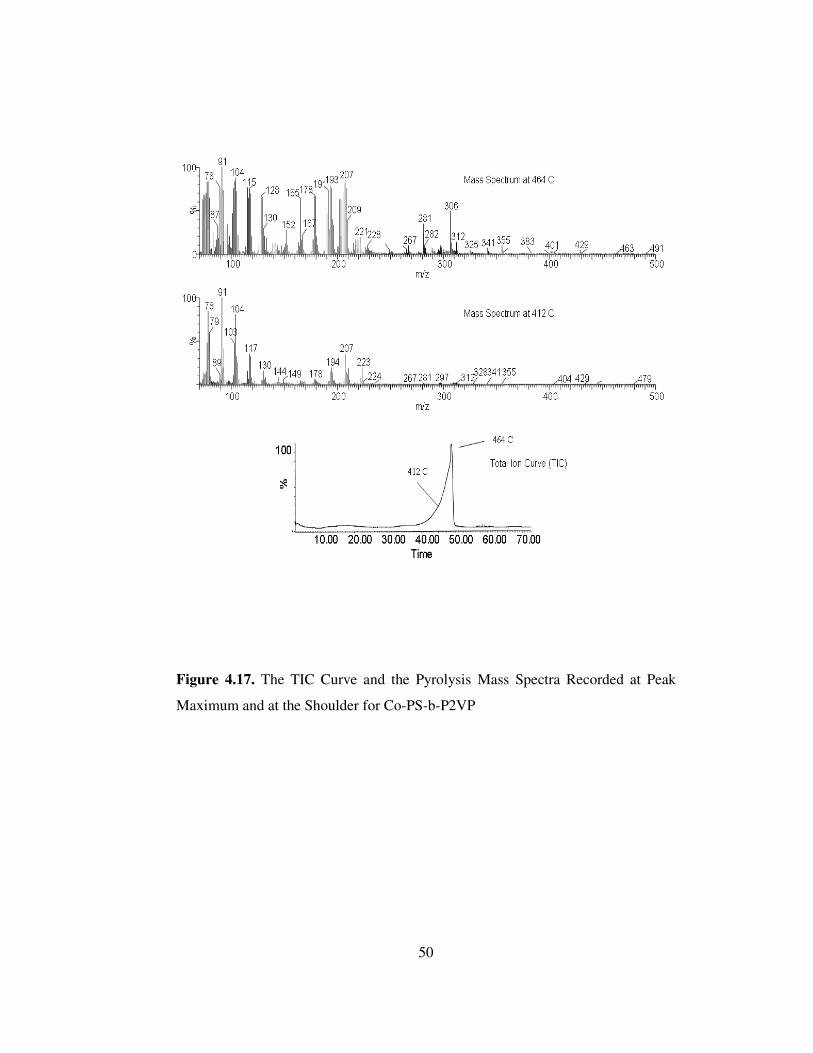
4.4.3 Cobaltpolystyrene-block-poly(2-vinylpyridine)
In Figure 4.17, the TIC curve and the pyrolysis mass spectra at the peak maximum,
at 464oC and at the shoulder, at 412oC recorded during the pyrolysis of Co-
functional copolymer are shown [37]. Again evolution of solvent was detected
around 110oC. The evolution of thermal degradation products shifted to high
temperatures compared to the copolymer indicated a significant increase in
thermal stability. The relative intensities and the assignments made for the intense
and/or characteristic peaks are collected in Table 4.5. Pyrolysis mass spectra
recorded around 464oC showed significant changes in the oligomer peak
intensities. But, the more important point was the presence of peaks that were
absent or very weak in the pyrolysis mass spectra of PS-b-P2VP.
In Figure 4.18 single ion evolution profiles of some selected characteristic
products are shown. As can be noticed from the figure, the trends observed in the
evolution profiles and relative intensities of both P2VP and PS of the copolymer
based products changed significantly.
50
Figure 4.17. The TIC Curve and the Pyrolysis Mass Spectra Recorded at Peak
Maximum and at the Shoulder for Co-PS-b-P2VP
51
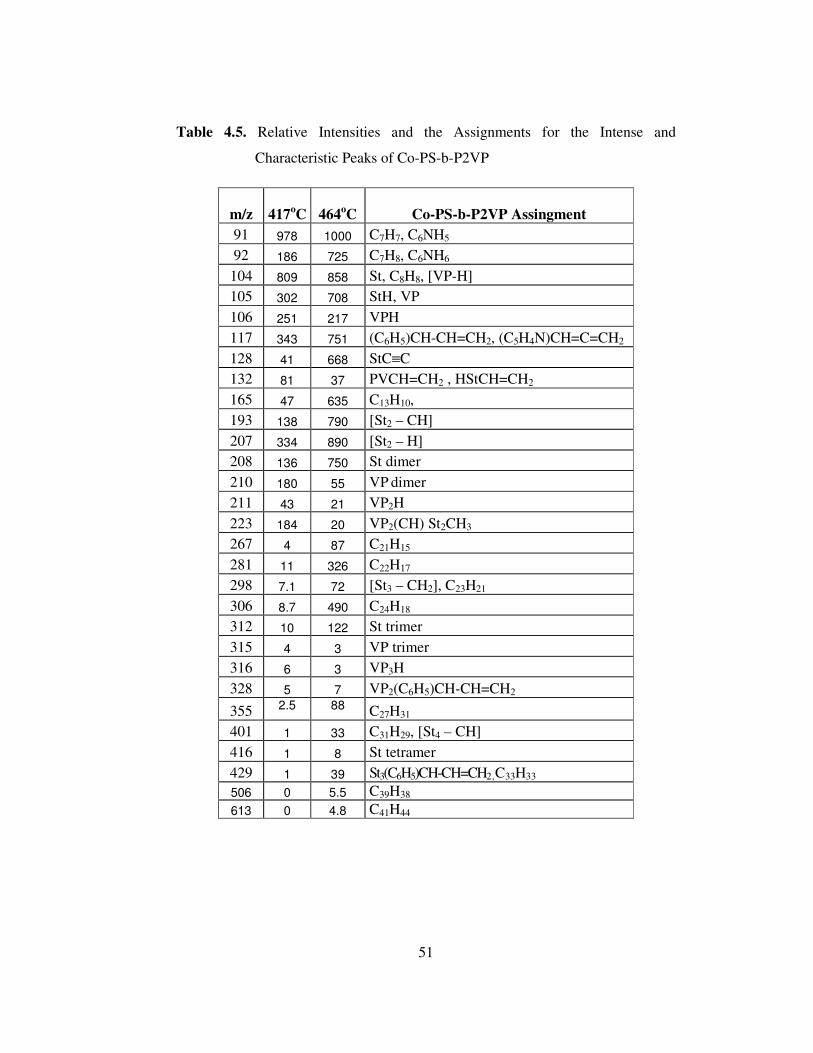
Table 4.5. Relative Intensities and the Assignments for the Intense and
Characteristic Peaks of Co-PS-b-P2VP
m/z
417oC 464oC Co-PS-b-P2VP Assingment 91 978 1000 C7H7, C6NH5
92 186 725 C7H8, C6NH6
104 809 858 St, C8H8, [VP-H]
105 302 708 StH, VP
106 251 217 VPH
117 343 751 (C6H5)CH-CH=CH2, (C5H4N)CH=C=CH2
128 41 668 StC≡C
132 81 37 PVCH=CH2 , HStCH=CH2
165 47 635 C13H10,
193 138 790 [St2 – CH]
207 334 890 [St2 – H]
208 136 750 St dimer
210 180 55 VP dimer
211 43 21 VP2H
223 184 20 VP2(CH) St2CH3
267 4 87 C21H15
281 11 326 C22H17
298 7.1 72 [St3 – CH2], C23H21
306 8.7 490 C24H18
312 10 122 St trimer
315 4 3 VP trimer
316 6 3 VP3H
328 5 7 VP2(C6H5)CH-CH=CH2
355 2.5 88 C27H31
401 1 33 C31H29, [St4 – CH]
416 1 8 St tetramer
429 1 39 St3(C6H5)CH-CH=CH2 , C33H33 506 0 5.5 C39H38
613 0 4.8 C41H44
52
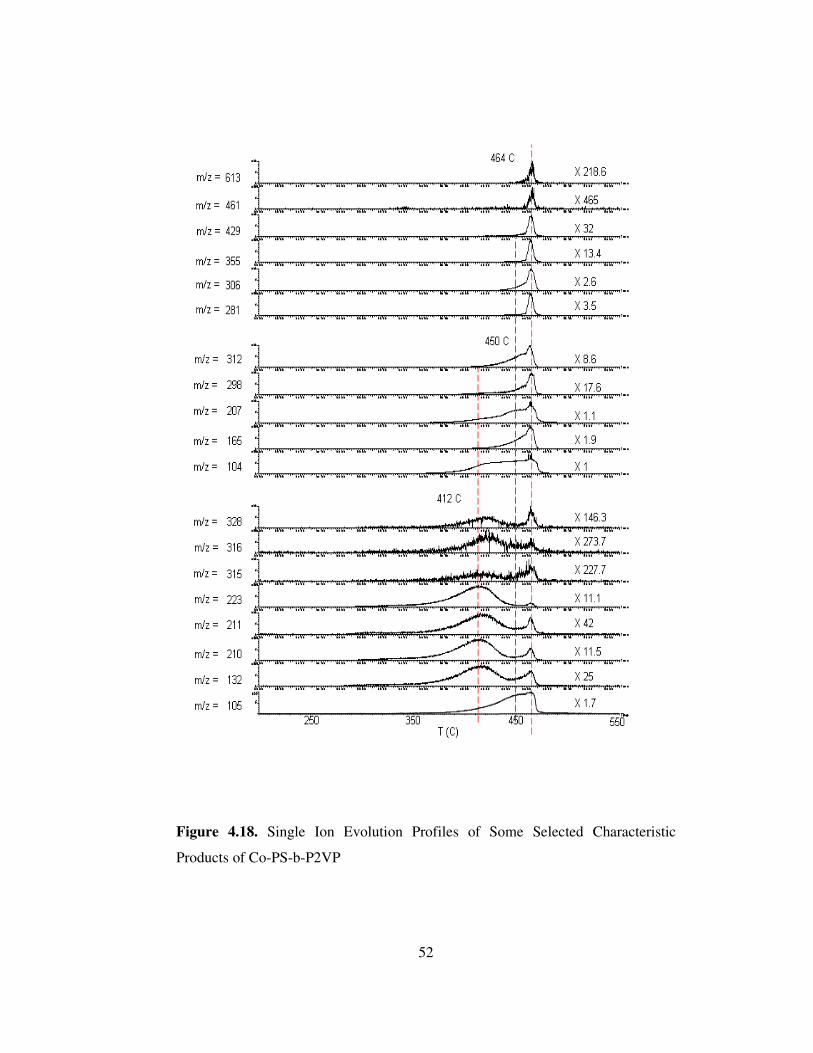
Figure 4.18. Single Ion Evolution Profiles of Some Selected Characteristic
Products of Co-PS-b-P2VP
53
Evolution profiles of P2VP based products were sharpened and shifted slightly to
high temperatures. The relative intensities of both oligomer and protonated
oligomer peaks were decreased. The decrease was more significant for the
protonated oligomers. Furthermore, a high temperature peak appeared in the single
ion evolution profiles of P2VP based products. The two peak maxima were at
412oC and 464oC indicating that the increase in thermal stability was lower than
that was observed for Cr functional copolymer.
The trends observed in the evolution profiles of both P2VP and PS based products
indicated presence of new interactions affecting the thermal stability. The two
distinct decomposition ranges observed for P2VP block can directly be associated
with presence of P2VP chains with noticeably different thermal stabilities. The
changes in the relative yields of the products, especially the great diminish in the
protonated oligomer yields, indicated that thermal decomposition mechanism has
been changed; the proton transfer to nitrogen atom was inhibited. These findings
confirmed the coordination of nitrogen atom of the pyridine ring to the metal, Co.
However, detection of P2VP based products around 412ºC, in the range P2VP
decomposition was observed for the PS-b-P2VP pointed out the presence of
unreacted vinyl pyridine units.
Significant shifts of evolution profiles of PS based products to high temperatures
were also noted. Inspection of single ion evolution profiles of PS based products
indicated again an increase in thermal stability. Furthermore, almost all products
showed a sharp peak around 464ºC in their evolution profiles. Yet, PS based
products were also generated at lower temperatures and showed either a peak or a
shoulder at lower temperatures around 450ºC. However, products with m/z values
267, 281, 306, 325, 355, 429, 461, 613 showed only a single and sharp peak with a
maximum at 464ºC. Thus, it can be concluded that again, as in the case of Cr –
functional copolymer, the sharp high temperature peaks present in the evolution
profiles of P2VP and PS based products were mainly due to the decomposition of
the chains involving conjugated double bonds and/or crosslinked structure
54
generated along the P2VP backbone upon cleavage of pyridine units coordinated
to metal.
The products that can readily be attributed to decomposition of chains involving
conjugated double bonds and/or crosslinked structure occurred in a narrow
temperature range around 464ºC, lower than the corresponding temperature range
(480-490ºC) recorded during the pyrolysis of Cr- functional copolymer, indicating
again an increase in thermal stability compared that of the copolymer but this
increase was less than that was observed for the Cr analogue.
4.4.4 Goldpolystyrene-block-poly(2-vinylpyridine)
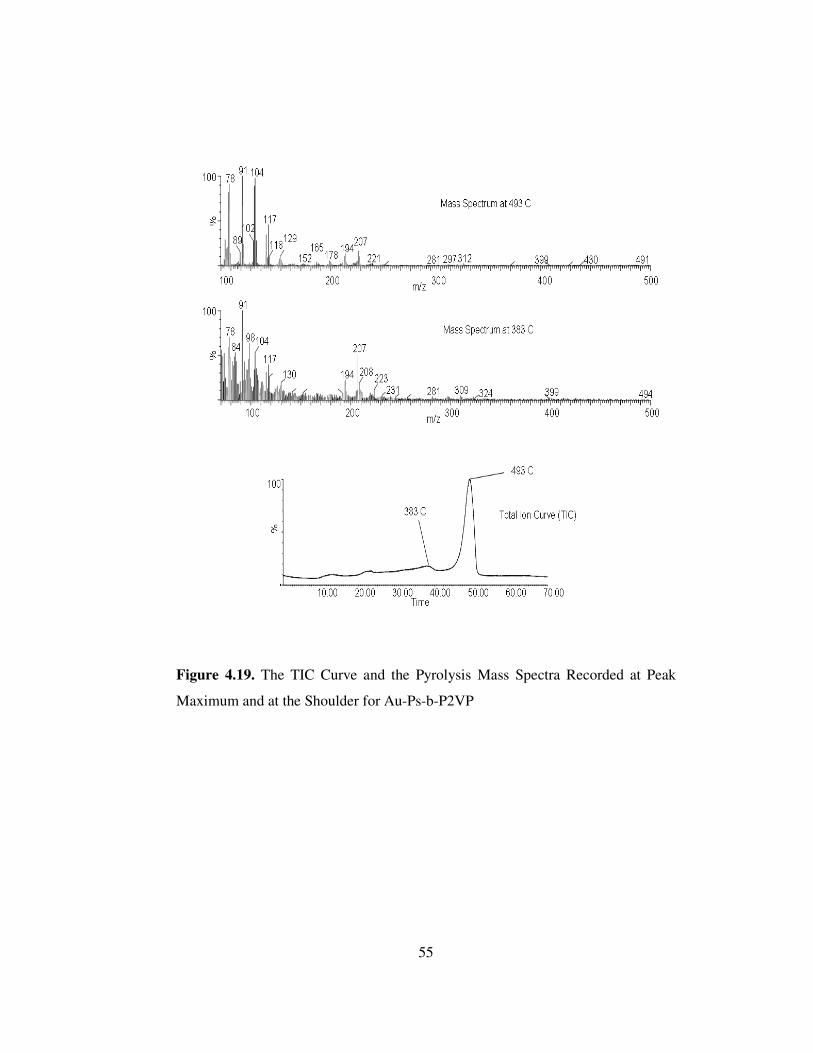
Pyrolysis mass spectrometry analysis of Au-polystyrene-block-poly(2-
vinylpyridine) yielded a TIC curve showing a relatively sharp peak with a
maximum at 494oC and weak peaks at around 110, 230 and 383oC. Again, the
110oC peak was associated with evolution of the solvent. On the other hand strong
HCl evolution was observed around 230oC. Products due to the thermal
decomposition of copolymer were recorded around 383 and 494oC. In Figure 4.18,
the TIC curve and the pyrolysis mass spectra recorded at 383 and 494oC are
shown. Detection of thermal degradation products at relatively high temperatures
indicated again a significant increase in thermal stability. The relative intensities
and the assignments made for the intense and/or characteristic peaks are collected
in Table 4.6.
55
Figure 4.19. The TIC Curve and the Pyrolysis Mass Spectra Recorded at Peak
Maximum and at the Shoulder for Au-Ps-b-P2VP
56
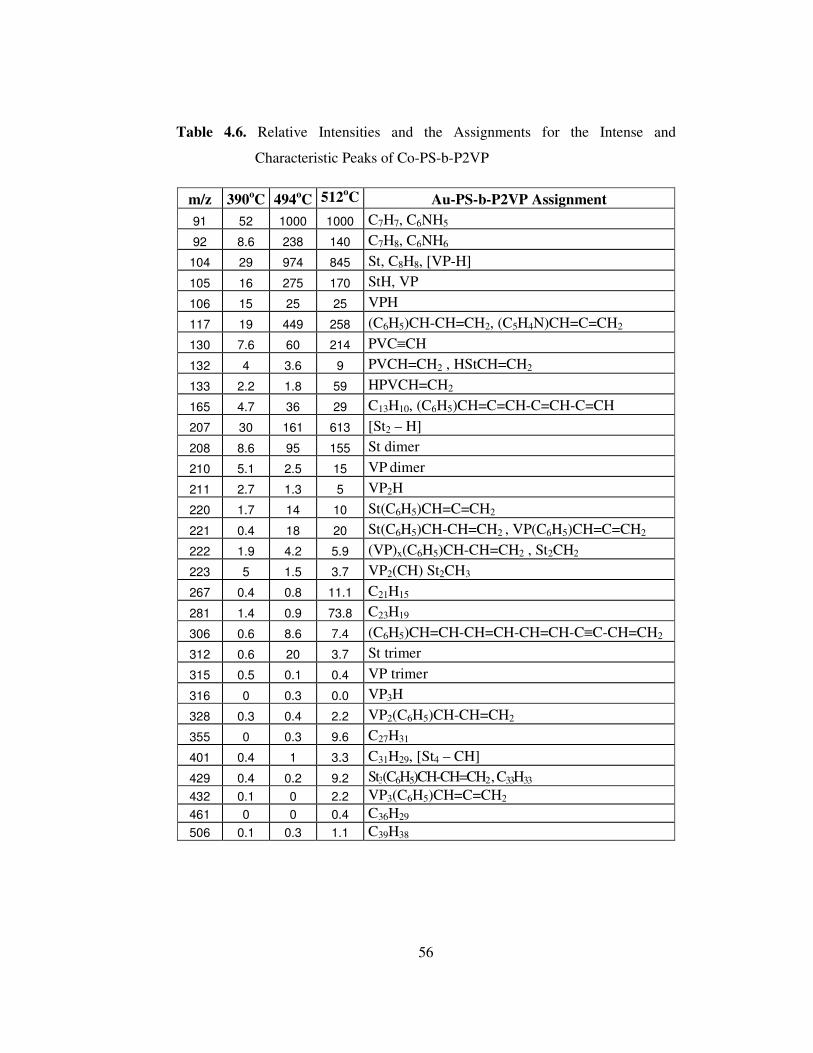
Table 4.6. Relative Intensities and the Assignments for the Intense and
Characteristic Peaks of Co-PS-b-P2VP
m/z 390oC 494oC 512oC Au-PS-b-P2VP Assignment
91 52 1000 1000 C7H7, C6NH5
92 8.6 238 140 C7H8, C6NH6
104 29 974 845 St, C8H8, [VP-H]
105 16 275 170 StH, VP
106 15 25 25 VPH
117 19 449 258 (C6H5)CH-CH=CH2, (C5H4N)CH=C=CH2
130 7.6 60 214 PVC≡CH
132 4 3.6 9 PVCH=CH2 , HStCH=CH2
133 2.2 1.8 59 HPVCH=CH2
165 4.7 36 29 C13H10, (C6H5)CH=C=CH-C=CH-C=CH
207 30 161 613 [St2 – H]
208 8.6 95 155 St dimer
210 5.1 2.5 15 VP dimer
211 2.7 1.3 5 VP2H
220 1.7 14 10 St(C6H5)CH=C=CH2
221 0.4 18 20 St(C6H5)CH-CH=CH2 , VP(C6H5)CH=C=CH2
222 1.9 4.2 5.9 (VP)x(C6H5)CH-CH=CH2 , St2CH2
223 5 1.5 3.7 VP2(CH) St2CH3
267 0.4 0.8 11.1 C21H15
281 1.4 0.9 73.8 C23H19
306 0.6 8.6 7.4 (C6H5)CH=CH-CH=CH-CH=CH-C≡C-CH=CH2
312 0.6 20 3.7 St trimer
315 0.5 0.1 0.4 VP trimer
316 0 0.3 0.0 VP3H
328 0.3 0.4 2.2 VP2(C6H5)CH-CH=CH2
355 0 0.3 9.6 C27H31
401 0.4 1 3.3 C31H29, [St4 – CH]
429 0.4 0.2 9.2 St3(C6H5)CH-CH=CH2 , C33H33 432 0.1 0 2.2 VP3(C6H5)CH=C=CH2
461 0 0 0.4 C36H29 506 0.1 0.3 1.1 C39H38

57
No other product peak was observed in the region where HCl evolution was
detected pointing out that, the evolution of HCl had no significant effect on
thermal stability of the copolymer. In general, for this sample, thermal
decomposition mainly took place around 494oC and the product yield was quite
low below 450oC. In Figure 4.20, single ion evolution profiles of some selected
characteristic products are shown.
Similar P2VP based thermal degradation products were also detected for Au-PS-b-
P2VP. It can be observed both from Table 4.6 and from the evolution profiles that
the relative intensities of P2VP based products decreased drastically, more than
what were observed for Cr and Co functional copolymers. Two peak maxima were
recorded in the evolution profiles of all products, except for the protonated
oligomers, at 390oC and 494oC. The protonated oligomers showed a single peak
around 390oC in their evolution profiles, the maximum yield was detected at
slightly higher temperatures as in the case of pure copolymer at around 414oC.
Although detection of P2VP based products around 390oC, in the temperature
range where P2VP decomposition was observed in the case of pure copolymer,
pointed out the presence of unreacted vinyl pyridine units. However, the drastic
decrease in the relative intensities of P2VP based products indicated that the extent
of uncoordinated pyridine units was quite low.
Unlike P2VP based products, PS based products were significantly intense.
Evolution profiles of PS based products shifted to higher temperatures showing an
intense and broad peak with a maximum at 494oC (Fig. 4.20). This shift was much
greater than that were detected for Cr and Co analogues. In the evolution profiles
of [St2 – H] at m/z=207 a sharp peak with a maximum at 512oC was also detected.
All products associated with the thermal degradation of chains involving
conjugated double bonds and/or crosslinked structure generated along the P2VP
backbone upon cleavage of pyridine units coordinated to metal, such as products
with m/z values 281, 325, 355, 401 and 429 evolved in narrow temperature range
and their yields were maximized at 512oC similar to the high temperature peak in
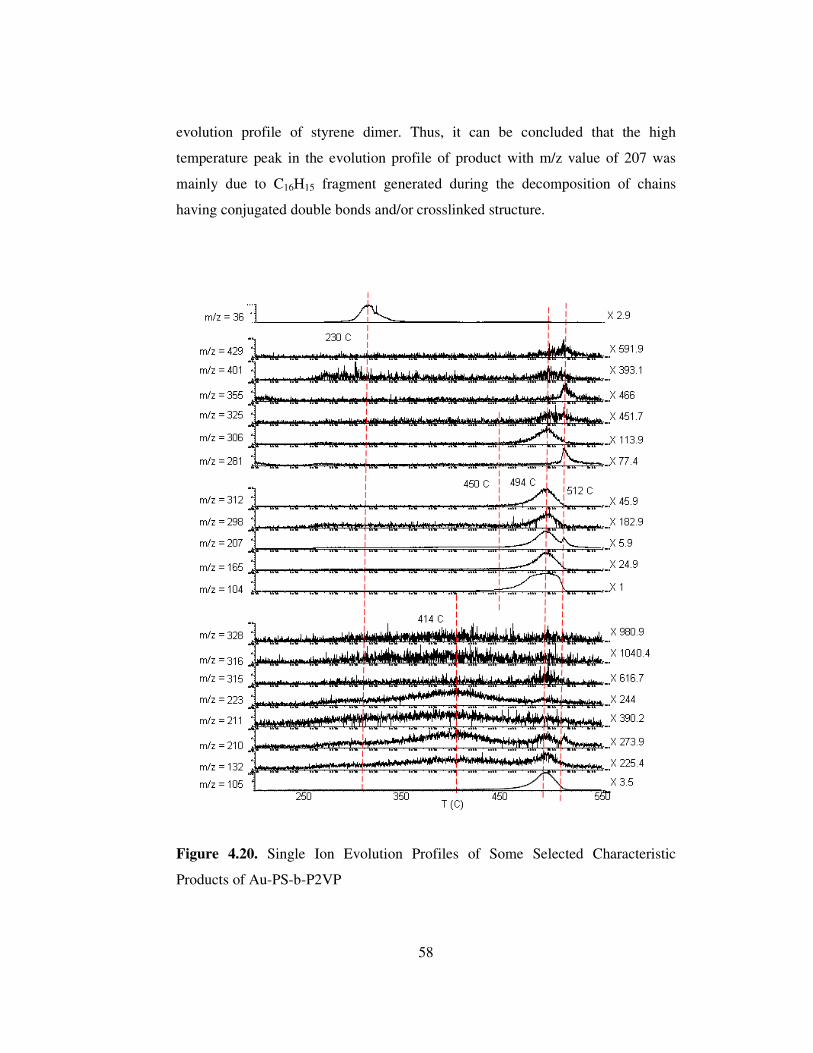
58
evolution profile of styrene dimer. Thus, it can be concluded that the high
temperature peak in the evolution profile of product with m/z value of 207 was
mainly due to C16H15 fragment generated during the decomposition of chains
having conjugated double bonds and/or crosslinked structure.
Figure 4.20. Single Ion Evolution Profiles of Some Selected Characteristic
Products of Au-PS-b-P2VP
59
CHAPTER 5
CONCLUSIONS
In this study, metal functional polymers, namely Cr-PS-b-P2VP, Co-PS-b-P2VP,
Au-PS-b-P2VP, Fe-PS-b-P2VP and Mo-PS-b-P2VP were synthesised by thermal
reactions of hexacarbonylchromium, Cr(CO)6, octacarbonyldicobalt Co2(CO)8
hydrogenotetrachloroaurate(III), H(AuCl4).4H2O,trichloroiron(III), FeCl3.6H2O,
molybdenum(VI)oxide, MoO3, and PS-b-P2VP. TEM images indicated
nanoparticle formation as a result of the reactions of PS-b-P2VP with the AuIII, Cr
and Co. On the other hand, crystalline structures were detected for Fe-PS-b-P2VP
and Mo-PS-b-P2VP. Samples involving nanoparticles were further characterized
by FTIR, UV-Vis and pyrolysis mass spectrometry techniques. Results of the
study can be summarized as:
• TEM images of metal nanoparticles showed that the size of Cr and Co
nanoparticles are between 10-20 nm, however, Au nanoparticles are
smaller than 10 nm.
• FTIR analysis indicated dissapearance of characteristic carbonyl peaks of
Cr(CO)6 and Co2(CO)8 for Cr-PS-b-P2VP, Co-PS-b-P2VP samples.
Decreases in the intensities of the diagnostic peaks due to C-H stretching
and bending modes and C-C and C=C stretching modes of pyridine ring
were observed for all Cr-PS-b-P2VP, Co-PS-b-P2VP and Au-PS-b-P2VP
samples. Furthermore, the appearance of a peak at about 467 cm-1
supported metal bonding to nitrogen.
60
• The results of pyrolysis mass spectrometry analysis can be summarized as ;
o No change in the thermal stability of P2VP chains involving
uncoordinated pyridine units.
o Thermal degradation mechanism of P2VP chains coordinated to
metals or metal ion through pyridine units were changed
significantly; the cleavage of pyridine units coordinated to metal or
metal ion, generation of conjugated unsaturated and/or crosslinked
polymer backbone and degradation of this thermally more stable
chains at high temperatures.
o Thermal stability of these chains increased depending on the type of
the metal or metal ion present in the order Co< Cr <Au3+ indicating
a stronger interaction between the metal or metal ion with nitrogen
atom on pyridine.

61
REFERENCES
[1] Bochman, M., Organometallics 1 Complexes with Transition Metal-Carbon σ-
Bonds, New York, 1994.
[2] Williams K.A., Boydston A.J., Bielawski C.W., Chemical Society Reviews,
2007, 729
[3] Pesetskii, S.S., Jurkowski, B., Krivoguz, Y.M., Davydov, A.A., Bogdanovich,
S.P. Journal of Applied Polymer Science, 2007, 1366.
[4] Lazzari, M., Arturo Lopez-Quintela, M., Advanced Materials, 2003, 1583-
1584.
[5] Chen, Z., Kornfield, J.A., Smith. S.D., Grothaus, J.T., Satkowski, M.M.,
Science, 1997, 277, 1248-1249.
[6] Grubbs, R.B., Highlight, 2005, 4324-4325.
[7] Hacaloğlu, J., Fares, M.M., Süzer, Ş., European Polymer Journal, 1997, 939.
[8] Fares, M.M., Yalçın, T., Hacaloğlu, J., Güngör, A., Süzer, Ş., Analyst, 1994,
693.
[9] Qian, K., Killinger, W.E., Casey, M., Rapid polymer identification by in-
source direct pyrolysis mass spectrometry and library searching techniques, Anal.
Chem., 1996, 68, 1019-1027.
[10] Blazso, M., Recent trends in analytical and applied pyrolysis of polymers, J.
Anal. Appl. Pyrolysis., 1997, 39, 1-25.
[11] Tsuge, S., Ohtani, H., Structural characterization of polymeric materials by
pyrolysis GC/MS, Polym. Deg Stab., 1997, 58, 109-130.
[12] Parsi, Z., Górecki, T., Poerschmann, J., Advances in non-discriminating
pyrolysis, J. Anal. App. Pyrolysis, 2005, 74, 11-18.
62
[13] Wapler, T.P., Practical applications of analytical pyrolysis, J. Anal. Appl.
Pyrolysis, 2004, 71, 1-12.
[14] Lattimer R.P., Pyrolysis field ionization mass spectrometry of hydrocarbon
polymers, J. Anal. Appl. Pyrolysis, 1997, 39, 115-127.
[15] Suvanto, S., Pakanen, T.A., Backman, L., Applied Catalysts, 1999, 177, 25-
36.
[16] Rutnakornpituk, M., Thompson, M.S., Harris, L.A., Farmer, K.E., Esker,
A.R., Riffle, J.S., Conolly, J., St. Pierre, T.G., Polymer, 2002, 43, 2337-2348.
[17] Aizawa, M., Buriak, J.M., J.Am.Chem.Soc., 2007, 128, 5879.
[18] Diana, F.S., Lee, S., Petroff, P.M., Kramer, E.J., Nano Letters, 2003, 3, 892.
[19] Shriver, D. F., Atkins, P.W., Langford, C.H., Inorganic Chemistry, John
Willey & Sons, Inc., Oxford,1990.
[20] Cotton, F.A., Wilkinson, G., Advanced Inorganic Chemistry, John Willey &
Sons, Inc., New York, 1972.
[21] Huhey, J.E., Inorganic Chemistry, Harper & Row, New York, 1983.
[22] Baranauskas, V.V., Zalich, M.A., Saunders, M., St, Pierre, T.G., Riffle, J.S.,
Chem. Mater., 2005, 17, 5246-5254.
[23] Mason, W.R., Gray, H.B., Inorg. Chem., 1968, 7, 55.
[24] Mason, W.R., Gray, H.B., Gray. J. Am. Chem. Soc., 1968, 90, 5721.
[25] Isci, H., Mason, W.R., Inorg. Chem.,1983, 22, 2266.
[26] Schmidtke, H.H., Garthoff, D., J. Am. Chem. Soc., 1967, 89, 1317.
[27] Paw, W., Cummings, S.D., Mansour, M.A., Connick, W.B., Geiger, D.K.,
Eisenberg, R., Coord. Chem. Rev., 1998, 171, 125.
[28] Hess, P., Parker, P.J., Appl. Polym. Sci., 1966, 10 (12), 1915.
63
[29] Sastri, S.B., Armistead, J.P., Keller, T.M., Sorathia, U., Polym. Compos.,
1997, 18, 48.
[30] Sastri, S.B., Keller, T.M., J. Appl. Polym. Sci., 1998, 36, 1885
[31] Sastri, S.B., Keller, T.M., J. Appl. Polym. Sci., 1998, 36, 1885
[32] Sumner, M.J., Sankarapandian, M., McGrath, J.E., Riffle, J.S., Polymer,
2002, 43, 5069.
[33] Sumner, M.J., Sankarapandian, M., McGrath, J.E., Riffle, J.S., Sorathia, U.,
International SAMPE Technical Conference, SAMPE, Covina, CA, 2001, 33,
1509.
[34] Tannenbaum, R., Inorg. Chim. Acta, 1997, 227, 233.
[35] Nogues, J., Schuller, I.K., J. Magn. Magn. Mater., 1999, 192, 203.
[36] Connolly, J., St. Pierre, T.G., Rutnakornpituk, M., Riffle, J.S., Eur. Cells
Mater., 2002, 3, 106.
[37] A.G., Elmacı, “Thermal Characterization of Homopolymers, Copolymers and
Metal Functional Copolymers of Vinylpyridines”, Middle East Technical
University, Graduate School of Natural and Applied Science, Department of
Chemistry, 2008. (In Preparation)
[38] Howell, B.A., Ther, J., Anal. Cal., 2007, 89, 393.
[39] McNeill, I.C., Angew Makromol Chem., 1997, 247, 179.
[40] Kannan, P., Biernacki, J.J., Visco, D.P., J. Anal Appl. Pyrolysis, 2007, 78,
162.
[41] Poutsma, M.L., Polym. Deg. Stab., 2006, 91, 2979.

64

65

66