Embed Size (px)
Citation preview
Nanocrystalline Advanced High-Strength Steel
Produced by Cold Rolling and Annealing
D. C. Van Aken and D. M. Field
Materials Science and Engineering
Missouri S&T
3
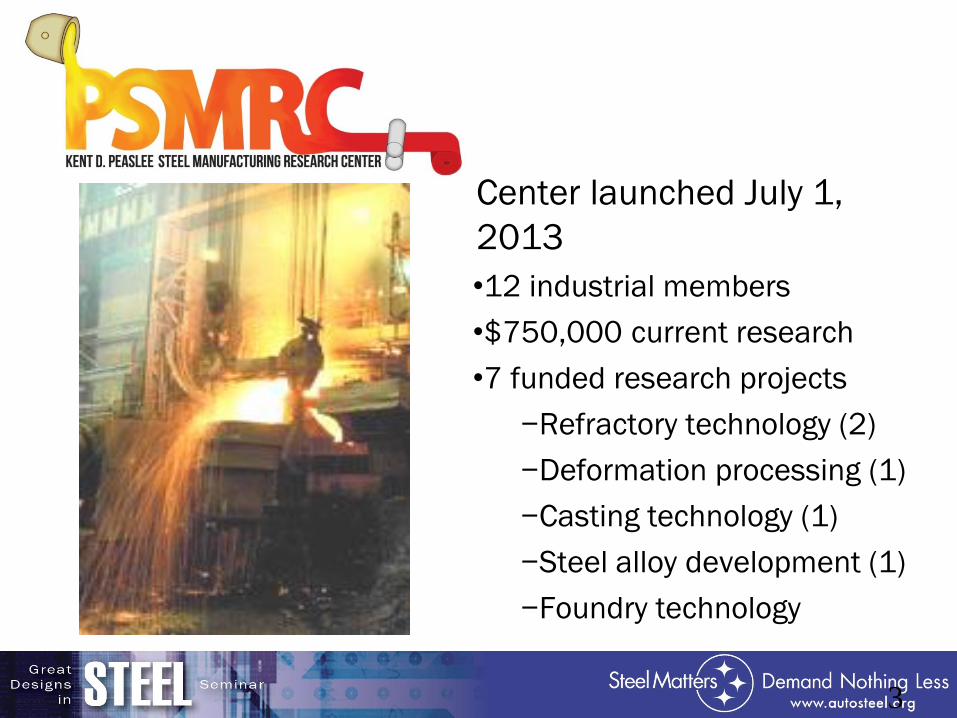
Center launched July 1,
2013
•12 industrial members
•$750,000 current research
•7 funded research projects
−Refractory technology (2)
−Deformation processing (1)
−Casting technology (1)
−Steel alloy development (1)
−Foundry technology
3rd Generation Advanced High-Strength Steel
• NSF / DOE funded work on Nano Acicular
Duplex Steels
− Meghan McGrath Ph.D. (2012)
− Krista Limmer Ph.D. (2014)
• PSMRC funded work on Two-stage TRIP AHSS
− Scott Pisarik M.S. (2014)
− Dan Field Ph.D. (2018)
• Industrial partners: Nucor, AK Steel, USS and
ArcelorMittal
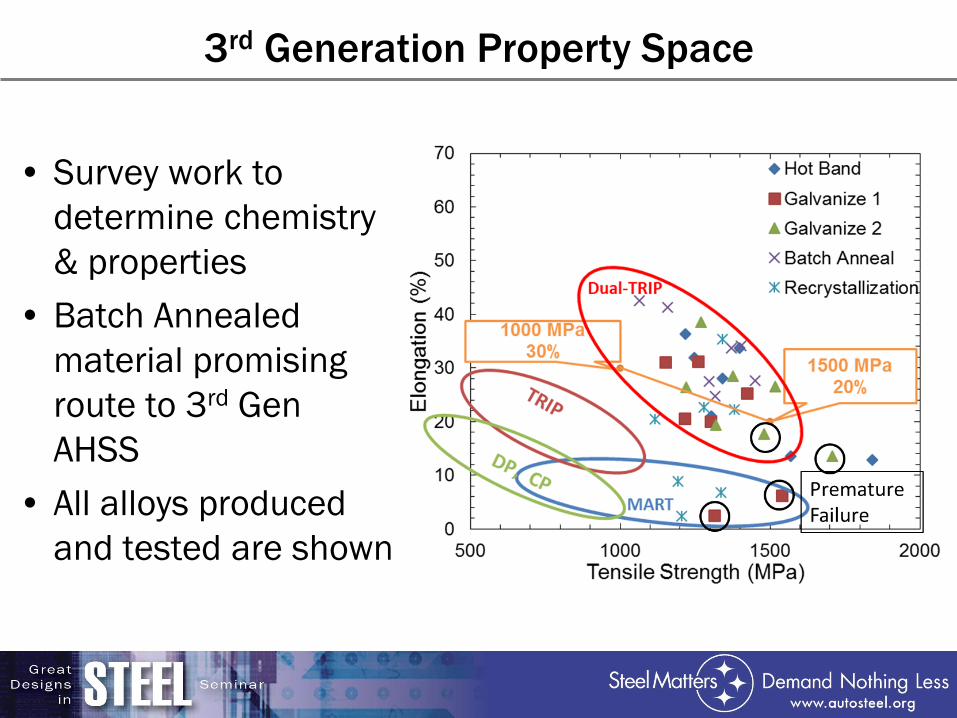
3rd Generation Property Space
• Survey work to
determine chemistry
& properties
• Batch Annealed
material promising
route to 3rd Gen
AHSS
• All alloys produced
and tested are shown
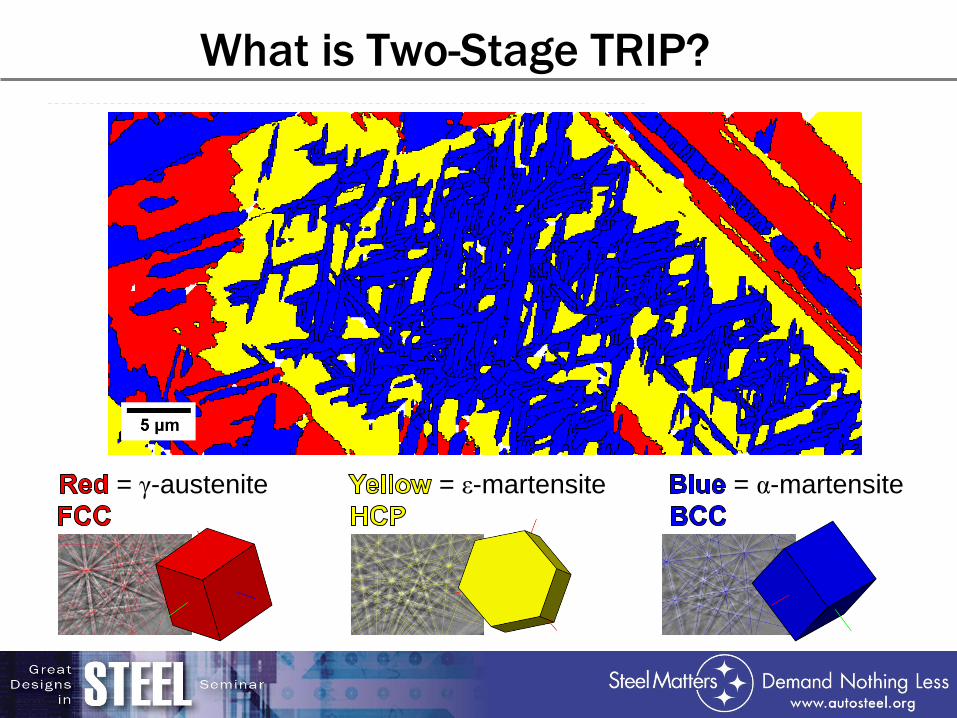
What is Two-Stage TRIP?
= γ-austenite = ε-martensite = α-martensite
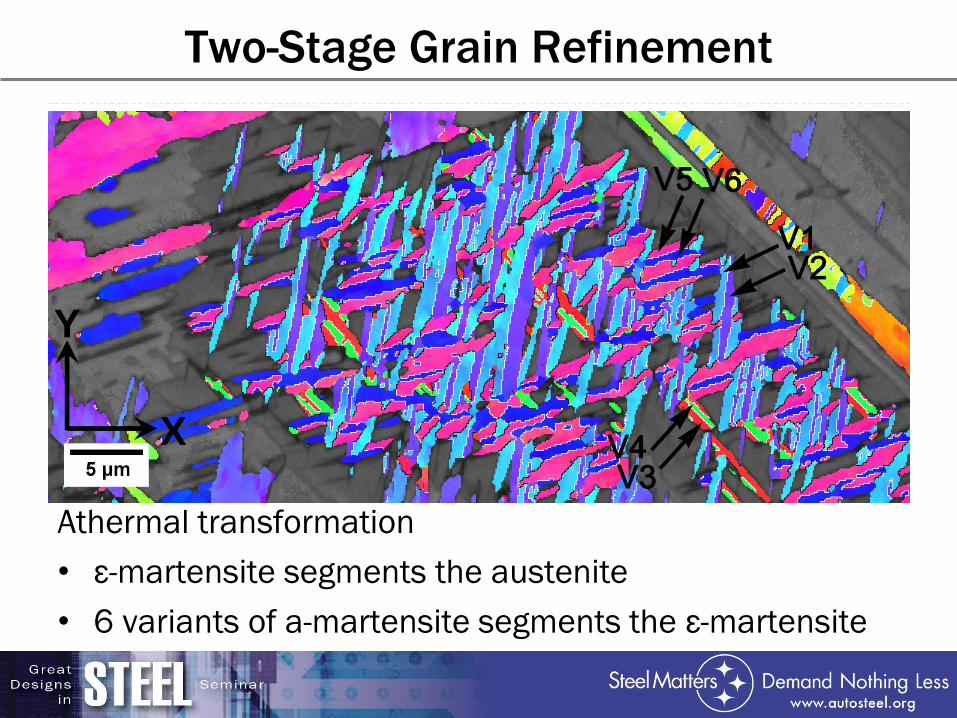
Two-Stage Grain Refinement
X
Y
X
Y
Athermal transformation
• ε-martensite segments the austenite
• 6 variants of a-martensite segments the ε-martensite
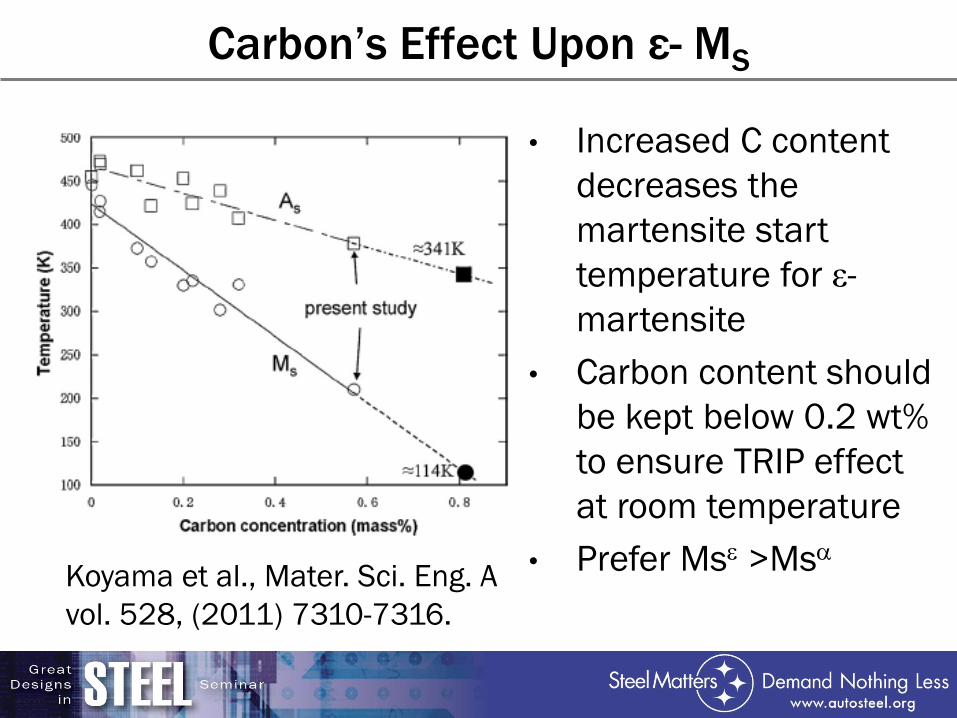
Carbon’s Effect Upon ε- MS
• Increased C content
decreases the
martensite start
temperature for ε-
martensite
• Carbon content should
be kept below 0.2 wt%
to ensure TRIP effect
at room temperature
• Prefer Mse >Msa Koyama et al., Mater. Sci. Eng. A
vol. 528, (2011) 7310-7316.
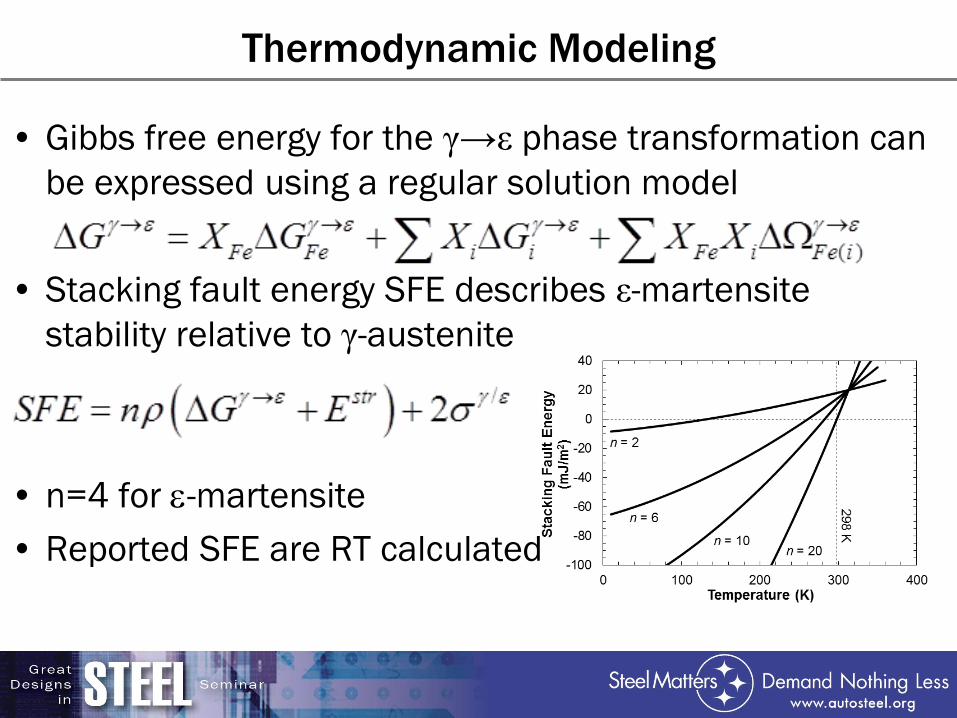
Thermodynamic Modeling
• Gibbs free energy for the γ→ε phase transformation can
be expressed using a regular solution model
• Stacking fault energy SFE describes ε-martensite
stability relative to γ-austenite
• n=4 for e-martensite
• Reported SFE are RT calculated
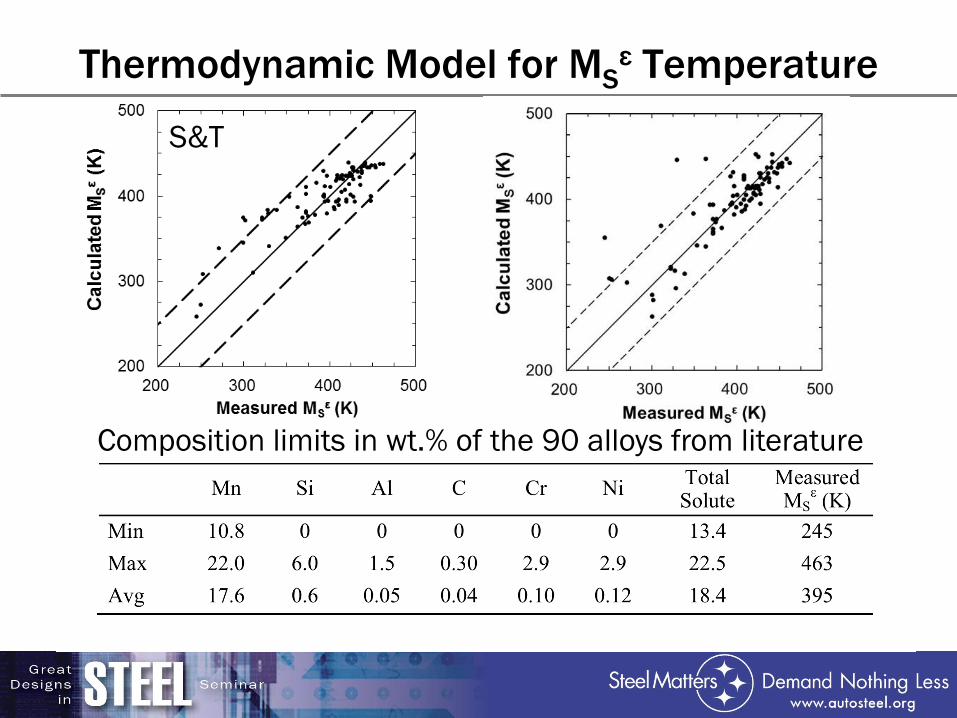
Thermodynamic Model for MSε Temperature
Composition limits in wt.% of the 90 alloys from literature
S&T
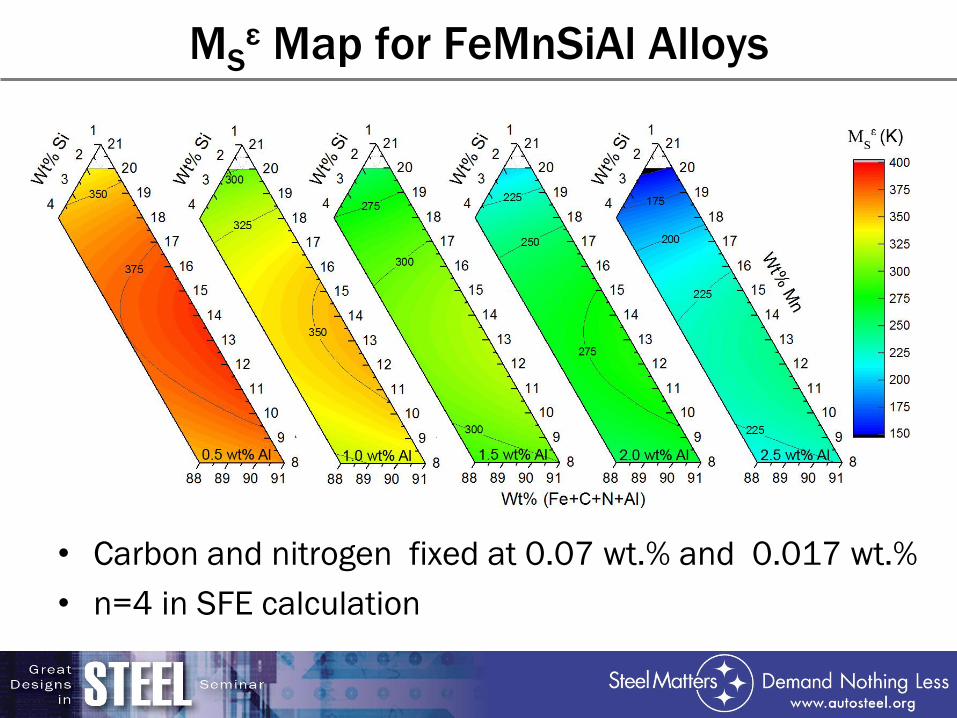
MSε Map for FeMnSiAl Alloys
• Carbon and nitrogen fixed at 0.07 wt.% and 0.017 wt.%
• n=4 in SFE calculation
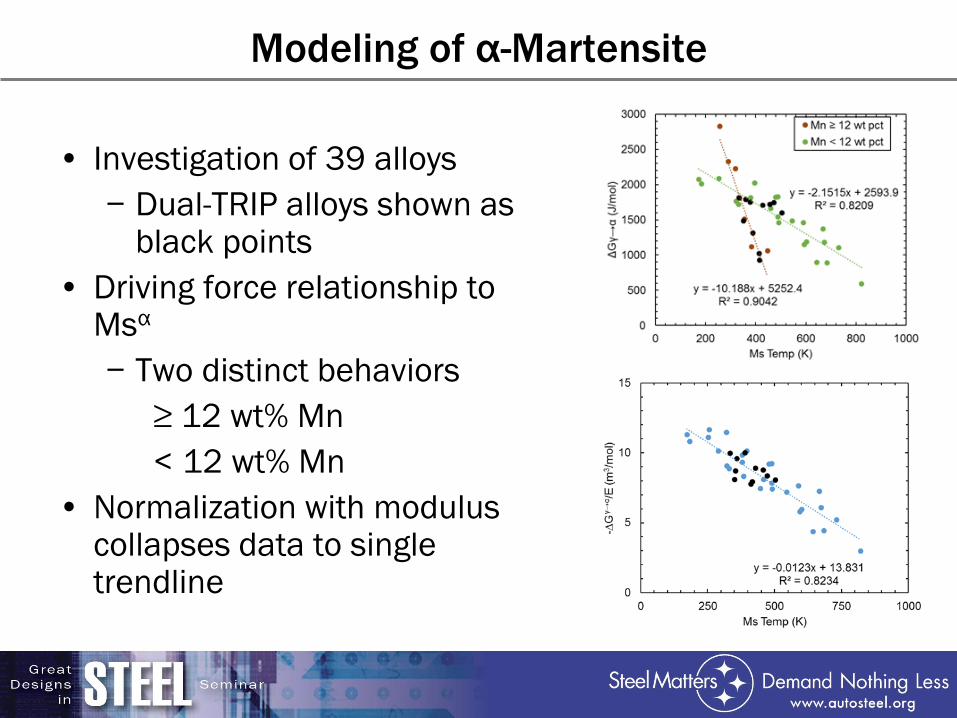
Modeling of α-Martensite
• Investigation of 39 alloys
− Dual-TRIP alloys shown as black points
• Driving force relationship to Msα
− Two distinct behaviors
≥ 12 wt% Mn
< 12 wt% Mn
• Normalization with modulus collapses data to single trendline
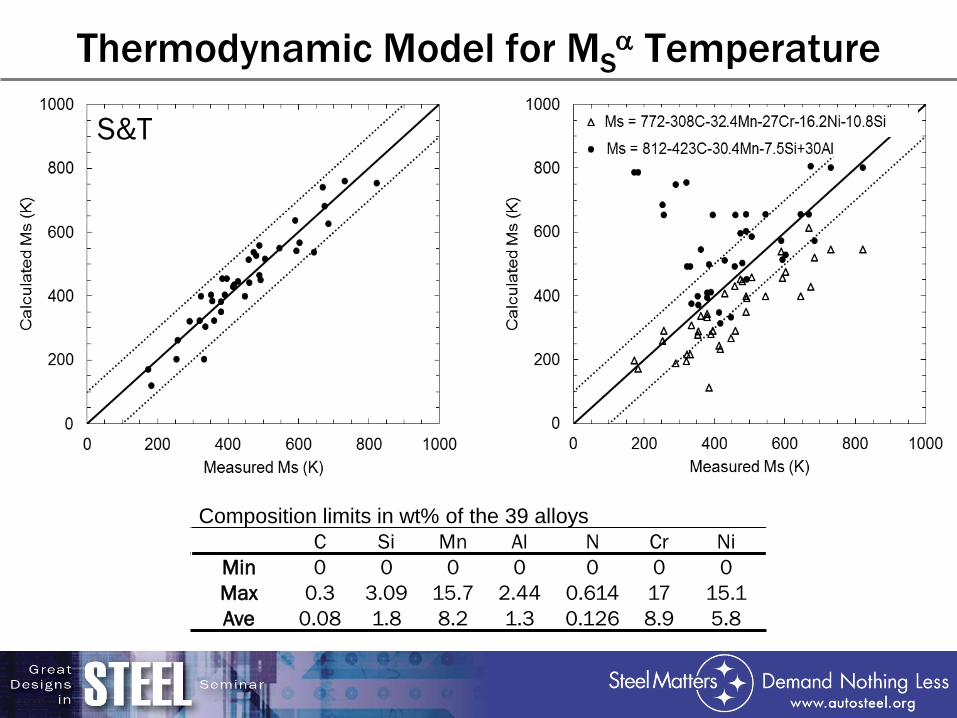
Composition limits in wt% of the 39 alloys
C Si Mn Al N Cr Ni
Min 0 0 0 0 0 0 0
Max 0.3 3.09 15.7 2.44 0.614 17 15.1
Ave 0.08 1.8 8.2 1.3 0.126 8.9 5.8
Thermodynamic Model for MSa Temperature
S&T
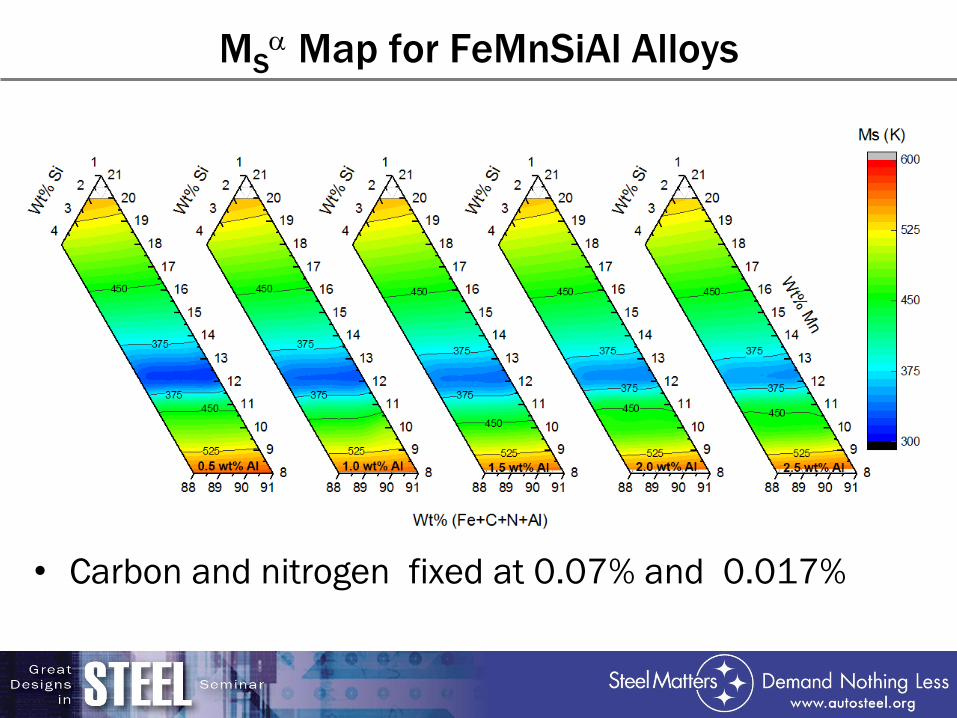
MSa Map for FeMnSiAl Alloys
• Carbon and nitrogen fixed at 0.07% and 0.017%
0
20
40
60
80
100
0 5 10 15 20 25 30 35 40
Vo
lum
e P
erc
en
t
Percent Elongation
γ-austenite
α-martensite
ε-martensite
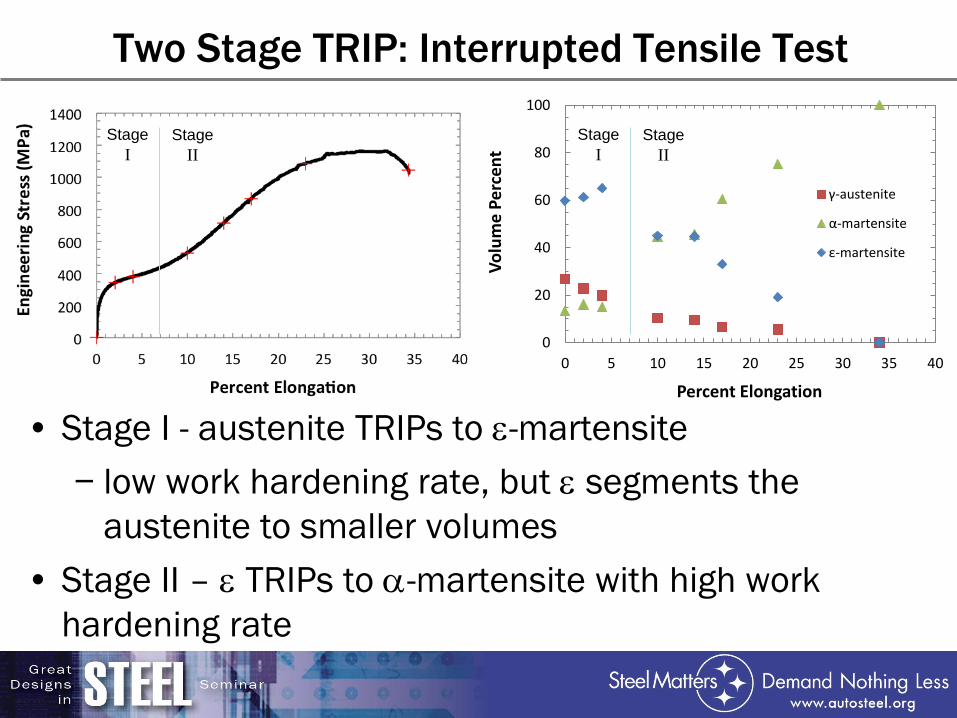
Two Stage TRIP: Interrupted Tensile Test
• Stage I - austenite TRIPs to e-martensite
− low work hardening rate, but e segments the
austenite to smaller volumes
• Stage II – e TRIPs to a-martensite with high work
hardening rate
Stage
I
Stage
II
Stage
I
Stage
II
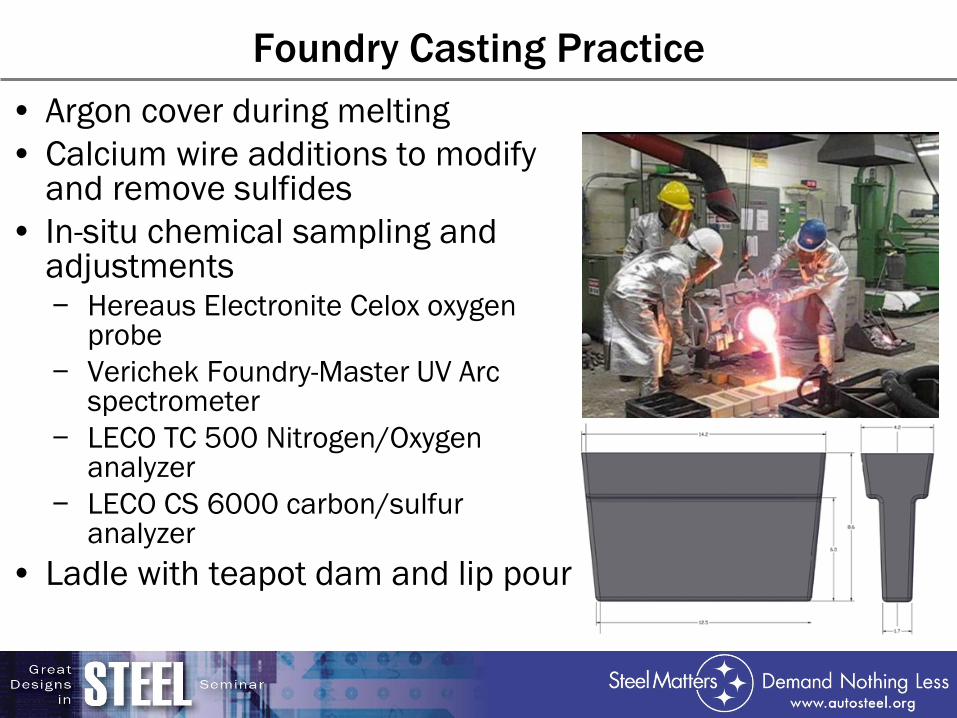
Foundry Casting Practice
• Argon cover during melting
• Calcium wire additions to modify and remove sulfides
• In-situ chemical sampling and adjustments − Hereaus Electronite Celox oxygen
probe
− Verichek Foundry-Master UV Arc spectrometer
− LECO TC 500 Nitrogen/Oxygen analyzer
− LECO CS 6000 carbon/sulfur analyzer
• Ladle with teapot dam and lip pour
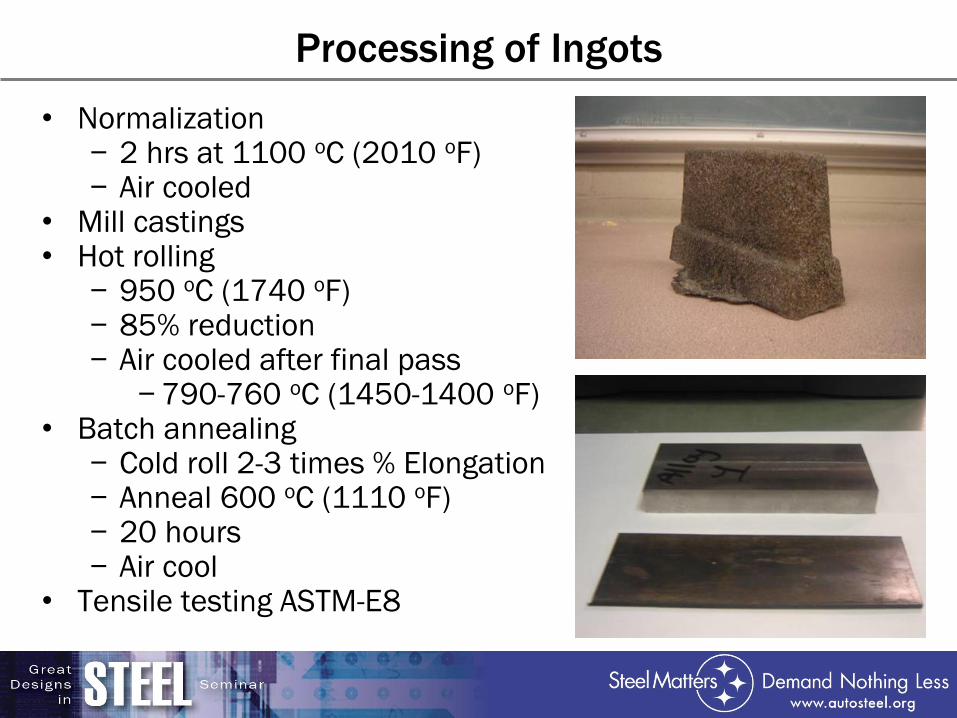
Processing of Ingots
• Normalization − 2 hrs at 1100 oC (2010 oF) − Air cooled
• Mill castings • Hot rolling
− 950 oC (1740 oF) − 85% reduction − Air cooled after final pass
− 790-760 oC (1450-1400 oF) • Batch annealing
− Cold roll 2-3 times % Elongation − Anneal 600 oC (1110 oF) − 20 hours − Air cool
• Tensile testing ASTM-E8
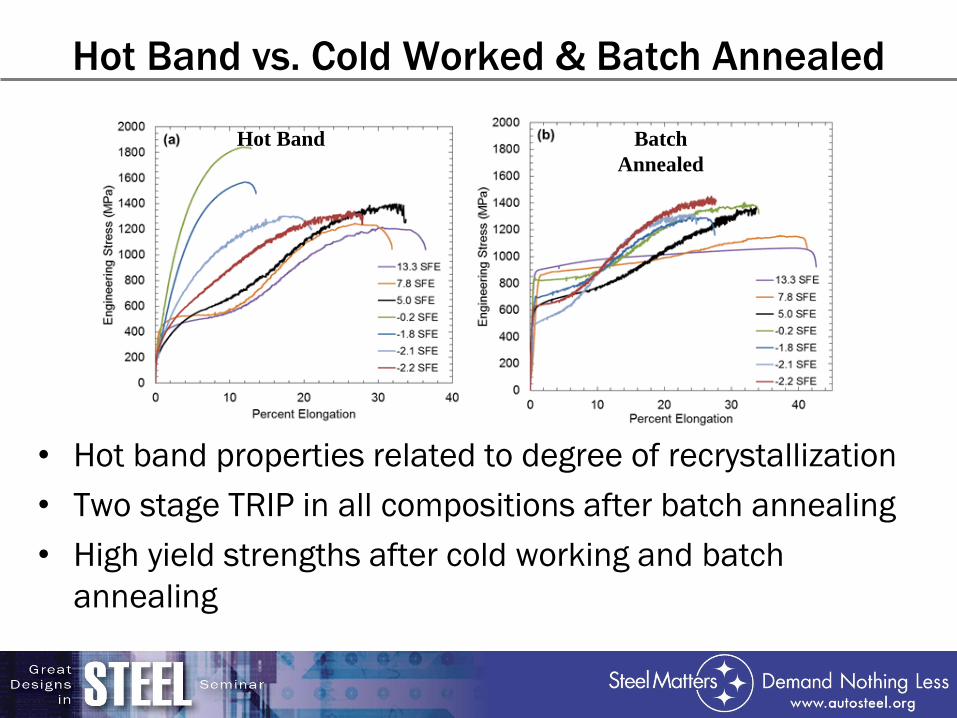
Hot Band vs. Cold Worked & Batch Annealed
• Hot band properties related to degree of recrystallization
• Two stage TRIP in all compositions after batch annealing
• High yield strengths after cold working and batch
annealing
Hot Band Batch
Annealed
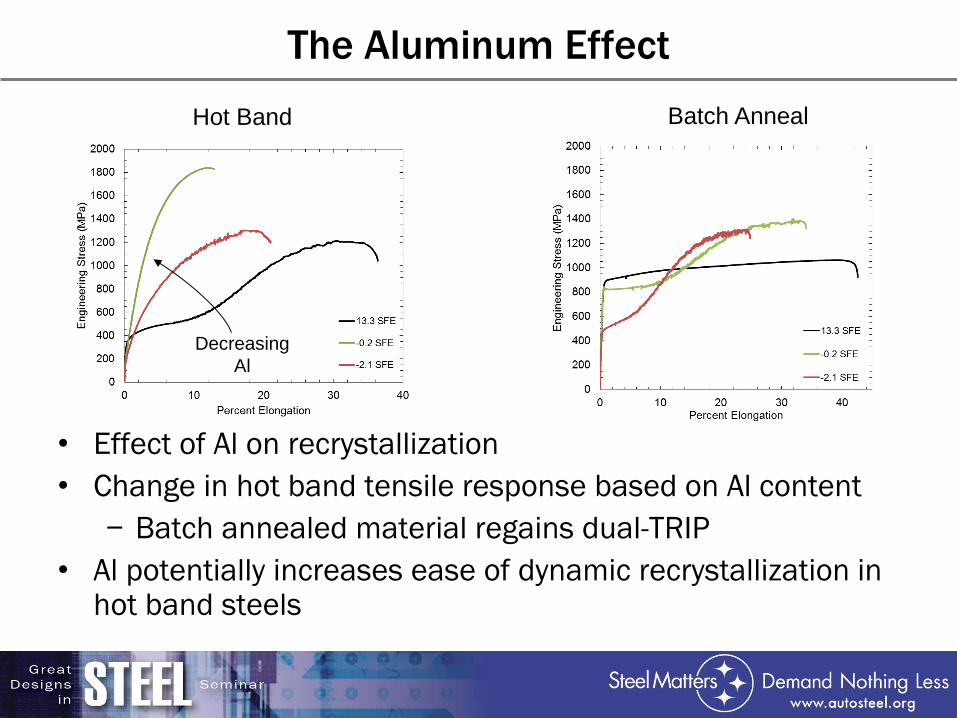
The Aluminum Effect
• Effect of Al on recrystallization
• Change in hot band tensile response based on Al content
− Batch annealed material regains dual-TRIP
• Al potentially increases ease of dynamic recrystallization in hot band steels
Hot Band Batch Anneal
Decreasing
Al
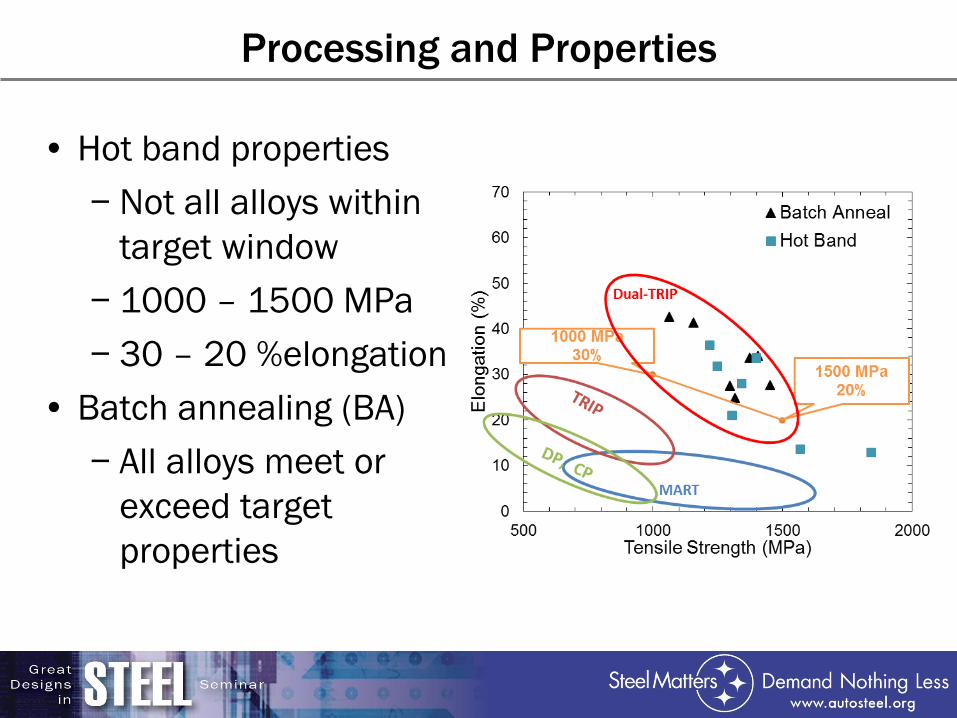
Processing and Properties
• Hot band properties
− Not all alloys within
target window
− 1000 – 1500 MPa
− 30 – 20 %elongation
• Batch annealing (BA)
− All alloys meet or
exceed target
properties
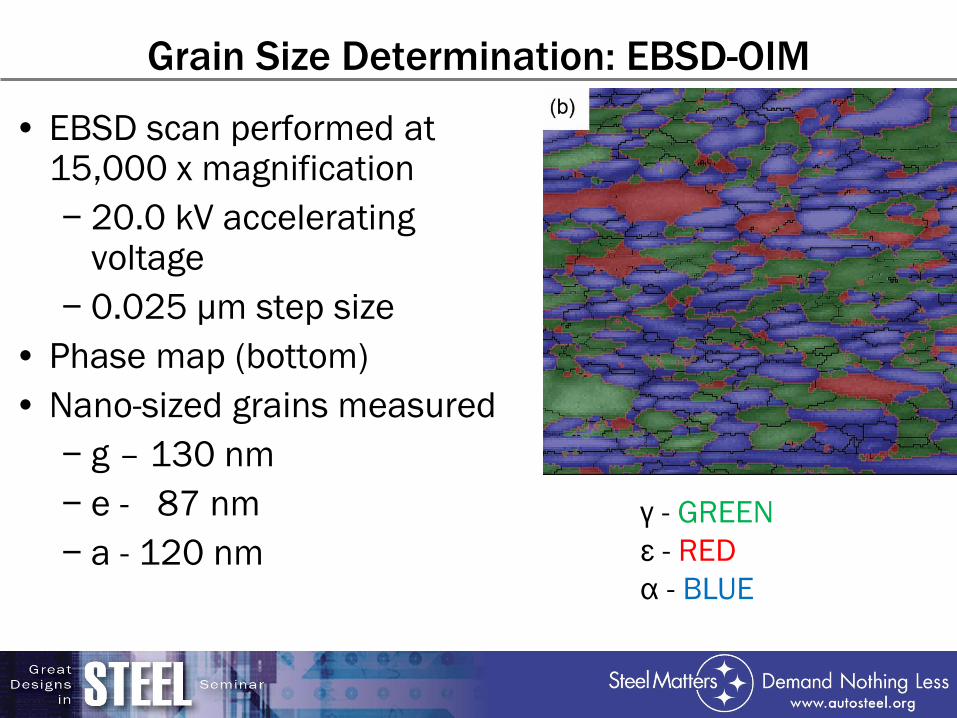
Grain Size Determination: EBSD-OIM
• EBSD scan performed at 15,000 x magnification
− 20.0 kV accelerating voltage
− 0.025 μm step size
• Phase map (bottom)
• Nano-sized grains measured
− g – 130 nm
− e - 87 nm
− a - 120 nm
γ - GREEN
ε - RED
α - BLUE
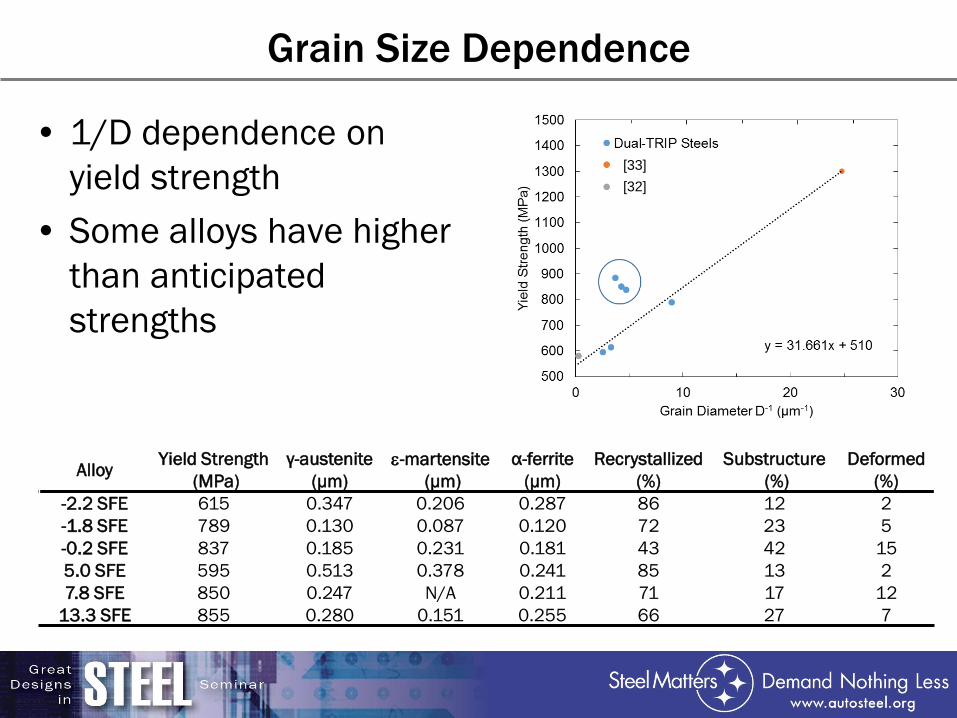
Grain Size Dependence
• 1/D dependence on
yield strength
• Some alloys have higher
than anticipated
strengths
Alloy Yield Strength
(MPa)
γ-austenite
(μm)
e-martensite
(μm)
α-ferrite
(μm)
Recrystallized
(%)
Substructure
(%)
Deformed
(%)
-2.2 SFE 615 0.347 0.206 0.287 86 12 2
-1.8 SFE 789 0.130 0.087 0.120 72 23 5
-0.2 SFE 837 0.185 0.231 0.181 43 42 15
5.0 SFE 595 0.513 0.378 0.241 85 13 2
7.8 SFE 850 0.247 N/A 0.211 71 17 12
13.3 SFE 855 0.280 0.151 0.255 66 27 7
[32]
[33]
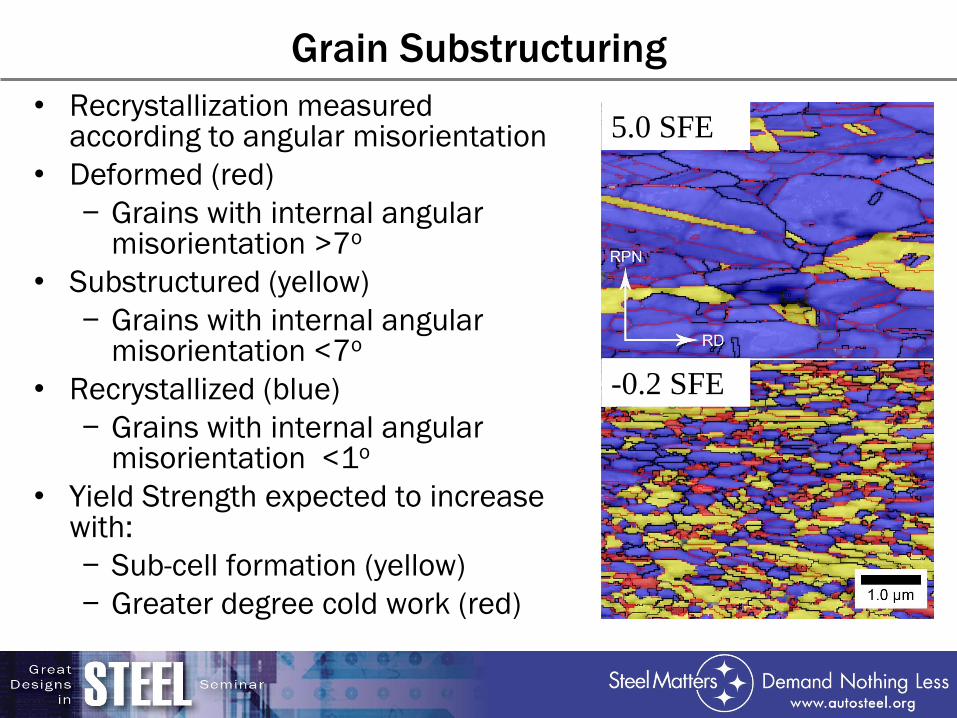
Grain Substructuring
• Recrystallization measured according to angular misorientation
• Deformed (red)
− Grains with internal angular misorientation >7o
• Substructured (yellow)
− Grains with internal angular misorientation <7o
• Recrystallized (blue)
− Grains with internal angular misorientation <1o
• Yield Strength expected to increase with:
− Sub-cell formation (yellow)
− Greater degree cold work (red)
5.0 SFE
-0.2 SFE
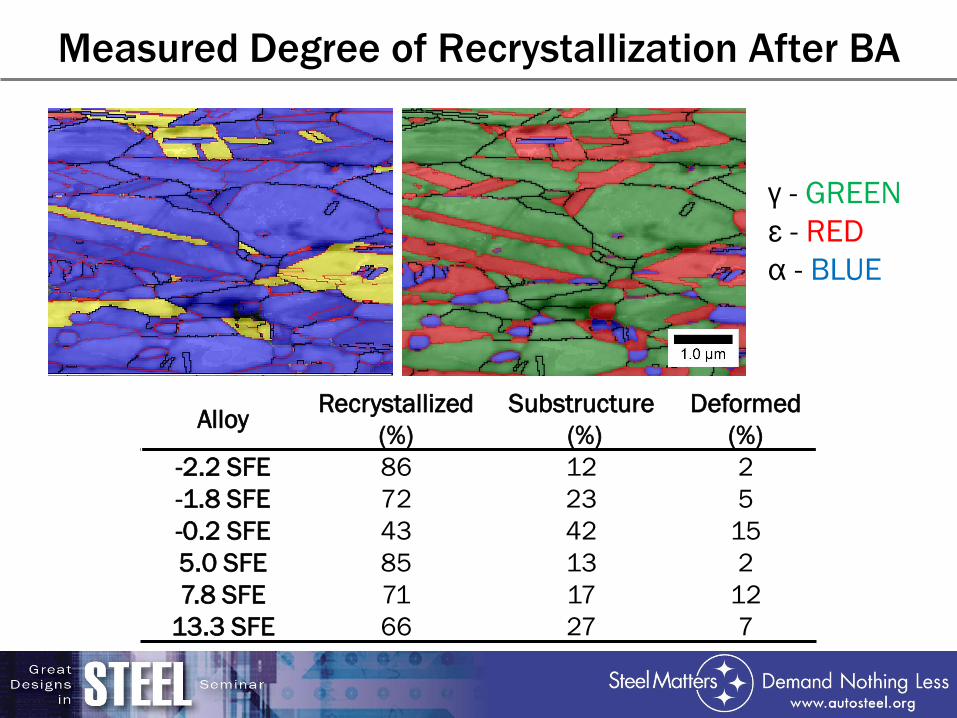
Measured Degree of Recrystallization After BA
Alloy Recrystallized
(%)
Substructure
(%)
Deformed
(%)
-2.2 SFE 86 12 2
-1.8 SFE 72 23 5
-0.2 SFE 43 42 15
5.0 SFE 85 13 2
7.8 SFE 71 17 12
13.3 SFE 66 27 7
γ - GREEN
ε - RED
α - BLUE
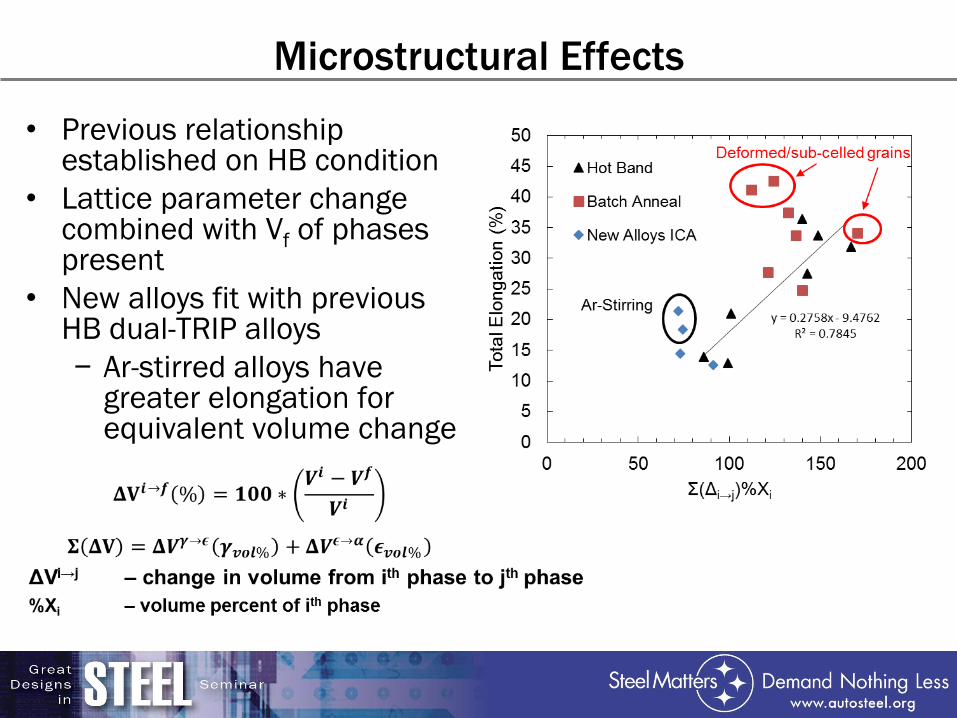
Microstructural Effects
• Previous relationship established on HB condition
• Lattice parameter change combined with Vf of phases present
• New alloys fit with previous HB dual-TRIP alloys
− Ar-stirred alloys have greater elongation for equivalent volume change
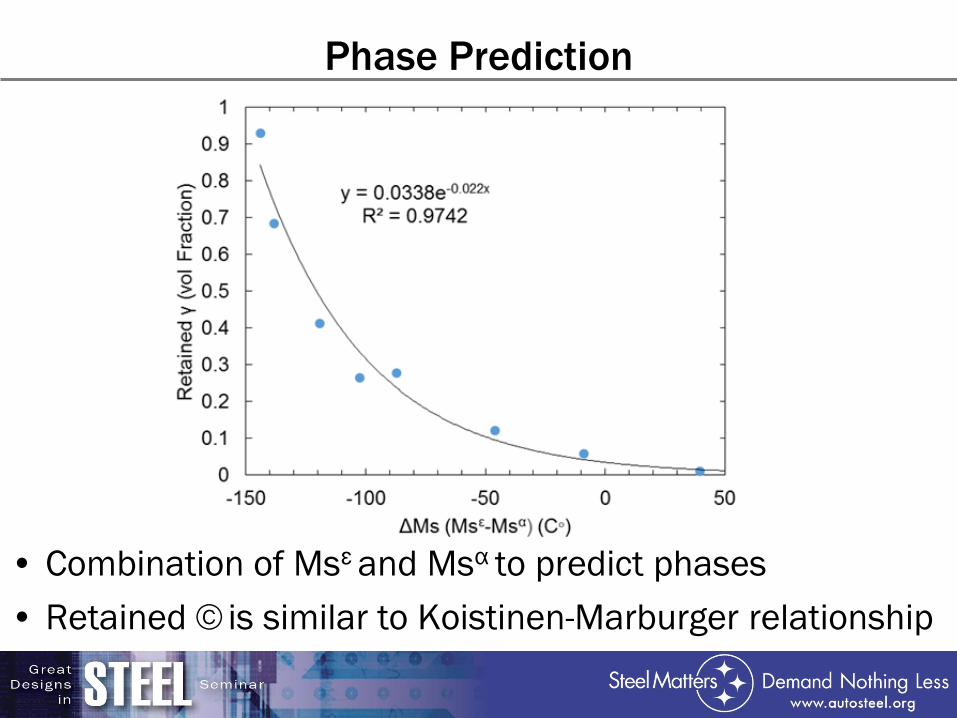
Phase Prediction
• Combination of Msε and Msα to predict phases
• Retained is similar to Koistinen-Marburger relationship
Summary
• Cold working and batch annealing leads to higher
yield strengths and 3rd generation property goals
− new models to predict martensitic reactions
− retained austenite related to difference in a and
e martensite start temperatures
− model relating transformable products to
elongation to failure
• 2016 heat campaign to scale up the casting
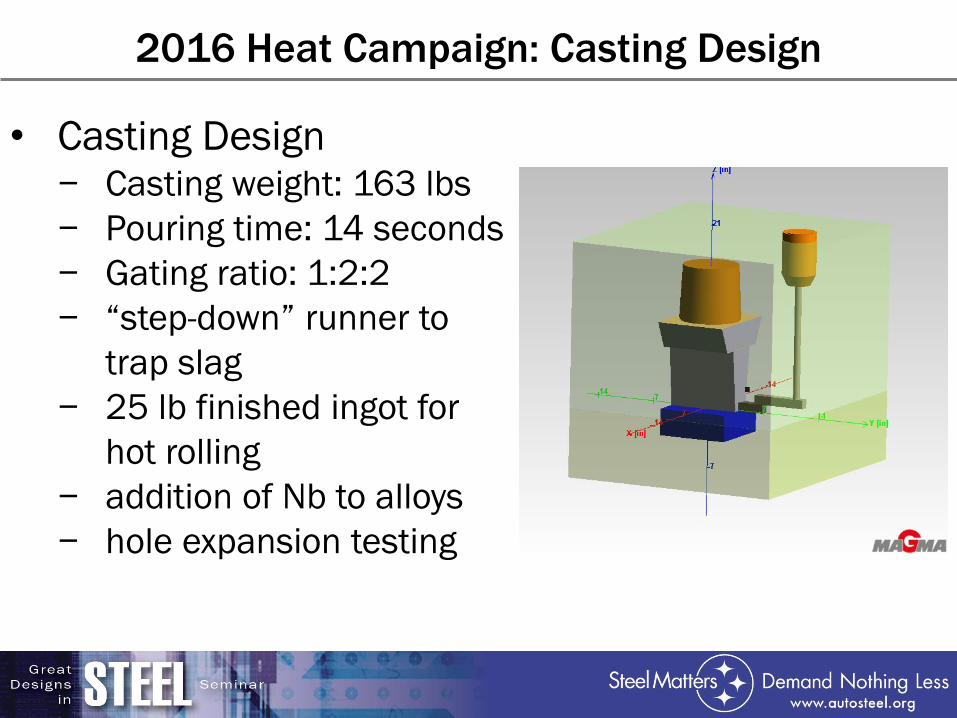
2016 Heat Campaign: Casting Design
• Casting Design − Casting weight: 163 lbs
− Pouring time: 14 seconds
− Gating ratio: 1:2:2
− “step-down” runner to
trap slag
− 25 lb finished ingot for
hot rolling
− addition of Nb to alloys
− hole expansion testing
Acknowledgements
• Kent D. Peaslee Steel Manufacturing Research Center
• Industrial mentoring committee
− Eric Gallo, Weiping Sun (NUCOR)
− Todd Link (US Steel)
− Luis Garza (AK Steel)
− Narayan Pottore, Bernard Chuwulebe (ArcelorMittal)
• Previous 3rd Gen AHSS graduate students
− Meghan McGrath Ph.D
− Scott Pisarik M.S
− Krista Limmer Ph.D