Embed Size (px)
Citation preview

Impact of Temperature on the Kinetics of Photodegradation and Nanoparticles Release in Nanocoatings
LiPiin Sung, Hsiang-Chun Hsueh Deborah Stanley Jacobs, Hsiang-Chun Hsueh, Chun-Chieh Tien and Tinh Nguyen
Engineering Laboratory (EL)
And
Justin Gorham, Savelas Rabb, and Lee YuMaterials Measurements Laboratory (MML)
NanoSafe 2016

Outline
• Nanoparticle release research in EL/NIST
• Case study: Accelerating weathering a nanosilica/epoxy coating• Kinetics of photodegradation• Surface accumulation of nanoparticle• Qualification of particle release

Model Epoxy (EP)MWCNT SiO2
Release Pathways of Nanoparticles (NP) During the Life Cycle of Nanocomposites:Mechanical, Matrix Degradation, Chemical Dissolution, Fire/Incineration, etc.
Mechanical abrasion Matrix Degradation via UV
Polyurethane (PU) flooringcoatings on wood substrates
SiO2
Al2O3
Latex Coatings on a dry-wall substrate
TiO2
ZnOAg
Exterior Coatings and Paints SiO2-PU ZnO -Latex
*Abrasion after UV exposure
Airborne release particles- working with Indoor Air Quality Group/ELGoal: • To develop test methods and measurement protocols for determining the quantities
and properties of nanoparticles released from polymer nanocomposites• To understand the mechanism that causes nanoparticles to leave the polymer matrix
during exposures to the environments
Providing data needed for assessing and managing potential EHS risks of NP release during nanocomposites’ life cycles.
3

• Provide well-controlled environmental stressors (UV, T, RH, mechanical)
NIST SPHERE
Simulated Photodegradation via High Energy Radiant Exposure
UV spectra and irradiance High through-put Exposure at output: 295 nm - 450 nm Incident irradiance on sample: 140 W/m2
Chin et al, Review of Scientific Instruments
75(11), 4951-4959, 2004.
Degradation rate, mechanism, kinetics, ….

Speed# of cyclesLoadType of wheels
Matrix Degradation via UV Mechanical abrasion
Taber rotary abraser(ASTM D 4060-14, organic coatings)
NIST SPHERE High Throughput,High Intensity UV Chamber
1. Characterize abraded surfaces (LSCM, SEM, EDX)
2. Remove Particles from Abraded Surface (TEM grid pressed against the surface or using an Adhesive Tape)
3. Collect residues from abrasion wheels
2 & 3 Inductively Coupled Plasma-Optical Emission Spectrometry (ICP-OES), SEM/EDX
UV intensityTemperatureHumidity
To be analyzed
by ICP-OES
Simulated Rain Test (Water Spraying)
5

Case Study - a nanosilica/epoxy coating
Objective
Effect of Key EnvironmentalFactors on Polymer Degradation
(Laboratory Exposure – accelerate weathering)UV, T, RH, mechanical stress
• To better understand the degradation mechanism, surface accumulation, and possible release of nanoparticles in exterior nanocoatings.
• Acceleration effect of temperature on Kinetics of photodegradation Surface accumulation of nanoparticle Particle release

Polymer:
Amine-cured epoxy, typically used for composites, coatings, and adhesives.
Nanoparticle:
Pure SiO2 Nanoparticles (untreated)
Individual particle size: ~15 nm Diameter.
Nanocoating Preparation:
Loading: 5 % (based on polymer mass).
Thickness: ~ 7 mm on a CaF2 substrate – for UV-vis, FTIR
~125 -150 mm free-standing films – ATR-FTIR, mass loss, XPS, AFM~ 300 mm, free-standing films – for particle release study
Materials

NIST SPHERE High-Throughput High Intensity UV Chamber
Chin et al, Review of Scientific Instruments (2004), 75, 4951.
Martin and Chin, U.S. Patent 6626053
UV Radiation Exposure
Simulated Photodegradation via High Energy Radiant Exposure
12
3
4
5
6
7
89
10
11
12
17
13
14
16
15
Exposure cell – general purpose
19 mm diameter
specimens
Exposure cell for nanosilica release

Exposure Conditions and Characterization
Characterization
• Chemical Degradation (rates, mechanism)
- ATR-FTIR, UV-vis, and XPS
• Surface Morphologies (AFM)
• Release rate by Inductively Coupled Plasma-Optical Emission Spectrometry (ICP-OES), using specially-designed holder.
SPHERESpectral UV intensity:Wavelength: 295 - 400 nmTemp: 60 °C , 50 °C , 40 °C , 30 °C (± 0.1°C)RH: 0 % ± 0.2%
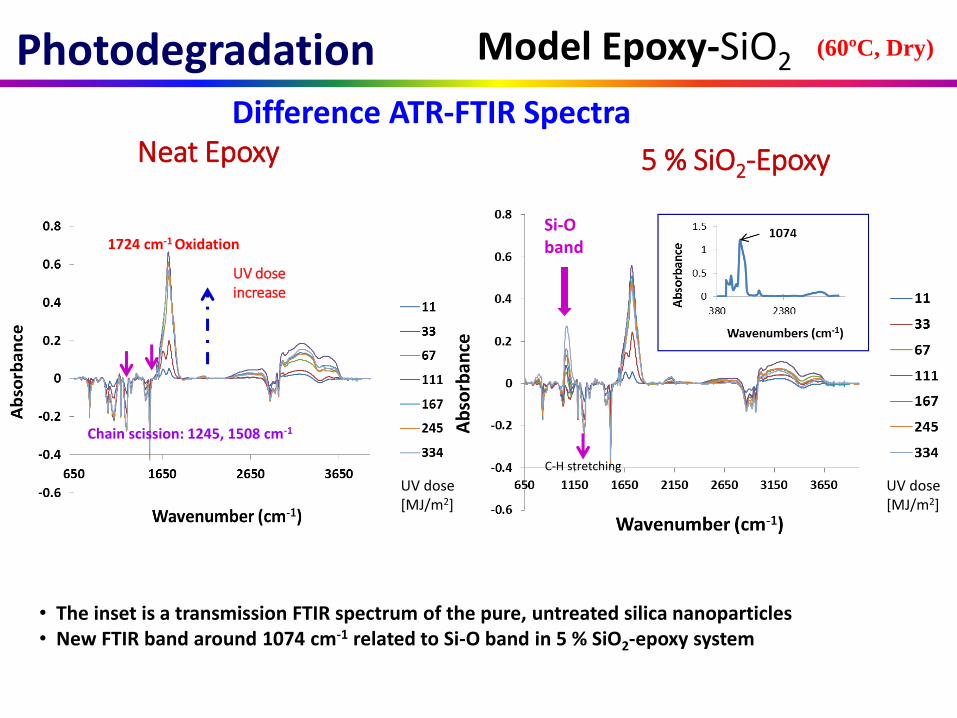
Difference ATR-FTIR Spectra Neat Epoxy 5 % SiO2-Epoxy
• The inset is a transmission FTIR spectrum of the pure, untreated silica nanoparticles• New FTIR band around 1074 cm-1 related to Si-O band in 5 % SiO2-epoxy system
UV dose[MJ/m2]
UV dose[MJ/m2]
UV doseincrease
Si-Oband
C-H stretching
1724 cm-1 Oxidation
Chain scission: 1245, 1508 cm-1
Model Epoxy-SiO2(60ºC, Dry)Photodegradation
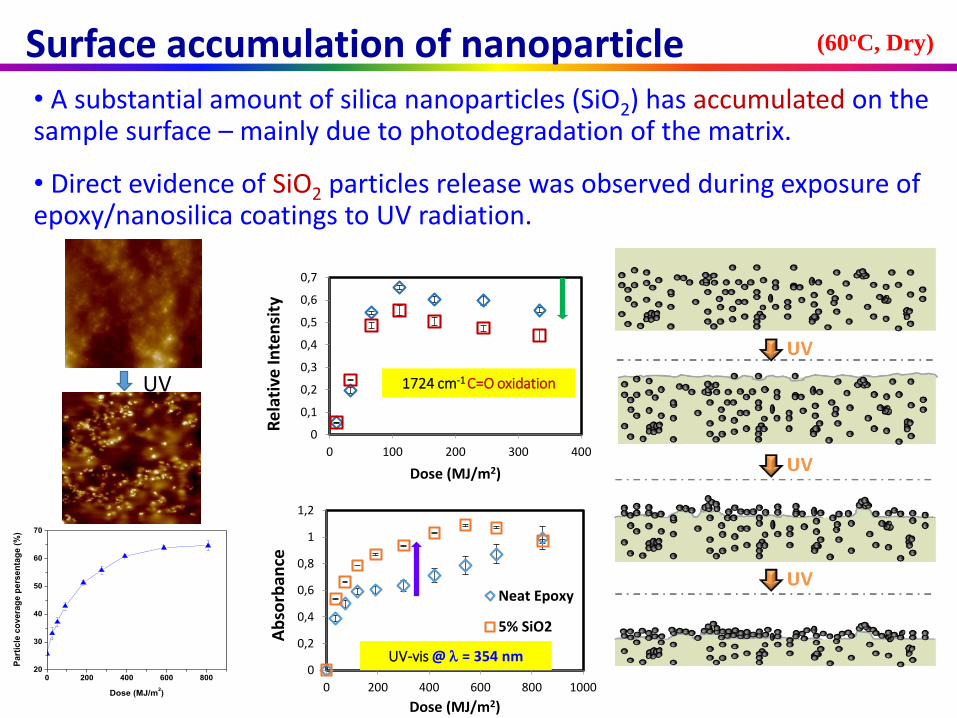
• A substantial amount of silica nanoparticles (SiO2) has accumulated on the sample surface – mainly due to photodegradation of the matrix.
• Direct evidence of SiO2 particles release was observed during exposure of epoxy/nanosilica coatings to UV radiation.
UV
Surface accumulation of nanoparticle (60ºC, Dry)
0
0,1
0,2
0,3
0,4
0,5
0,6
0,7
0 100 200 300 400
Re
lati
ve In
ten
sity
Dose (MJ/m2)
0
0,2
0,4
0,6
0,8
1
1,2
0 200 400 600 800 1000
Ab
sorb
ance
Dose (MJ/m2)
Neat Epoxy
5% SiO2
UV-vis @ = 354 nm
1724 cm-1 C=O oxidation
0 200 400 600 80020
30
40
50
60
70
Pa
rtic
le c
ov
era
ge
pe
rse
nta
ge
(%
)
Dose (MJ/m2)

Kinetics?
Temperature Effects
Arrhenius-like kinetics?
Kinetics data of polymer coatings containing nanoparticles under different UV environments is essential for better understanding the degradation mechanism and predicting the release of nanoparticesfrom exterior nanocoatings.
is the activation energyEa K: rate, T in °K

Temperature Effects: Chemical Changes (ATR-ATIR)
1060 cm-1: C-O and Si-O1245 cm-1: chain scission
1724 cm-1 C=O oxidation • IR bands 1245 cm-1 & 1724 cm-1
change rapidly at earlier exposure time/dose (< 200 MJ/m2), reach a plateau value for
dose > 400 MJ/m2
60 oC – highest degrade rate• IR bands 1060 cm-1
increases as UV dose increases no clear trends in temperature effects
All intensities were Normalized at dose = 0
-0,2
-0,15
-0,1
-0,05
0
0 200 400 600 800 1000 1200 1400 1600
Re
lati
ve In
ten
sity
Dose (MJ/m2)
30C 40C 50C 60C
0,0
0,2
0,4
0,6
0,8
1,0
1,2
0 200 400 600 800 1000 1200 1400 1600
Rel
ativ
e In
ten
sity
Dose (MJ/m2)
30C 40C 50C 60C
0
0,1
0,2
0,3
0,4
0,5
0,6
0 200 400 600 800 1000 1200 1400 1600
Re
lati
ve In
ten
sity
Dose (MJ/m2)
30C 40C 50C 60C
Two oppositely competing processes : loss of epoxy material (C-O loss) & increase of silica nanoparticles on the surface (Si-O increase).

0
0,2
0,4
0,6
0,8
1
1,2
0 200 400 600 800 1000 1200 1400
Ab
sorb
ance
Dose (MJ/m2)
0
0,2
0,4
0,6
0,8
1
1,2
0 200 400 600 800 1000 1200 1400
Ab
sorb
ance
Dose (MJ/m2)
30C
40C
50C
60C
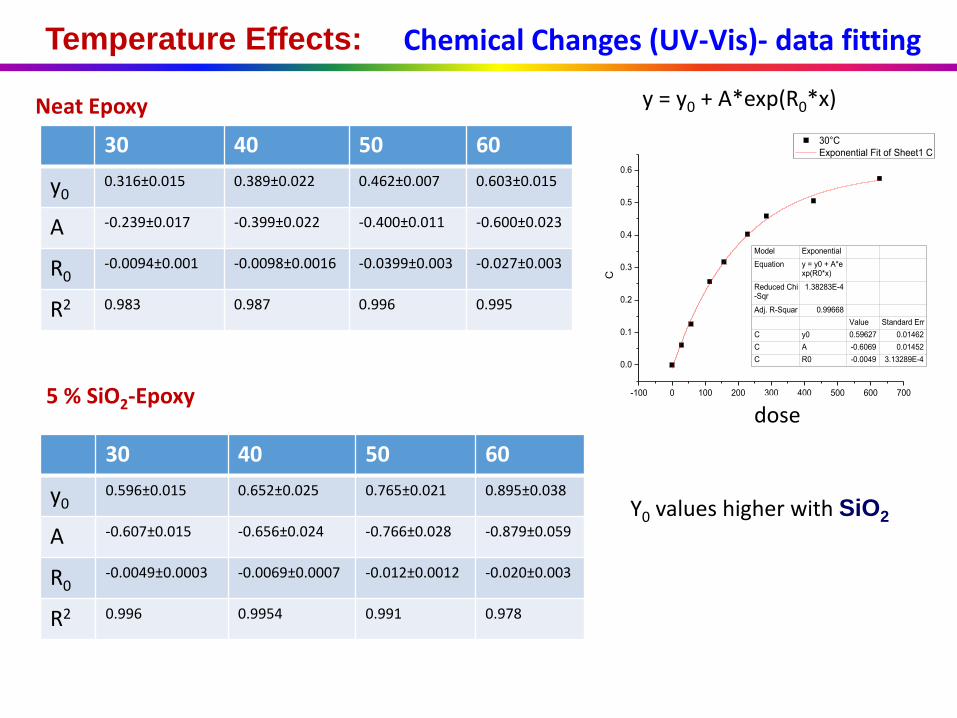
Temperature Effects: @ = 354 nmTemperature Effects: Chemical Changes (UV-Vis)
• Absorbance increased as UV dose increased• Higher temperature had a higher rate of increase
Neat Epoxy 5 % SiO2-Epoxy
-100 0 100 200 300 400 500 600 700
0.0
0.1
0.2
0.3
0.4
0.5
0.6
30°C
Exponential Fit of Sheet1 C
C
B
Model Exponential
Equation y = y0 + A*exp(R0*x)
Reduced Chi-Sqr
1.38283E-4
Adj. R-Squar 0.99668
Value Standard Err
C y0 0.59627 0.01462
C A -0.6069 0.01452
C R0 -0.0049 3.13289E-4
Temperature Effects: Chemical Changes (UV-Vis)- data fitting
y = y0 + A*exp(R0*x)
30 40 50 60
y00.316±0.015 0.389±0.022 0.462±0.007 0.603±0.015
A -0.239±0.017 -0.399±0.022 -0.400±0.011 -0.600±0.023
R0-0.0094±0.001 -0.0098±0.0016 -0.0399±0.003 -0.027±0.003
R2 0.983 0.987 0.996 0.995
Neat Epoxy
5 % SiO2-Epoxy
30 40 50 60
y00.596±0.015 0.652±0.025 0.765±0.021 0.895±0.038
A -0.607±0.015 -0.656±0.024 -0.766±0.028 -0.879±0.059
R0-0.0049±0.0003 -0.0069±0.0007 -0.012±0.0012 -0.020±0.003
R2 0.996 0.9954 0.991 0.978
dose
Y0 values higher with SiO2

0.003004 0.003008 0.003012
0.3
0.4
0.5
0.6
0.7
0.8
0.9
EP
EP-SiO2
y0
1/T (oK)
0.003004 0.003008 0.003012
0.36788
EP
EP-SiO2
ln(y
0)
1/T (oK)
0.003004 0.003008 0.003012
0.2
0.4
0.6
0.8
1/T (oK)
- A
0.003004 0.003008 0.003012
0.36788
1/T (oK)
ln(-
A)
0.003004 0.003008 0.003012
0.01
0.02
0.03
0.04
EP
EP-SiO2
1/T (oK)
R0
0.003004 0.003008 0.003012
0.00674
0.01832
EP
EP-SiO2
1/T (oK)
ln(R
0)
Temperature Effects – with and without SiO2 (UV-Vis Data)
Y0 values higher with SiO2
y = y0 + A*exp(R0*x)

-0,5
0
0,5
1
1,5
2
2,5
0 500 1000 1500
Mas
s Lo
ss (
%)
Dose (MJ/m2)
60C
50C
40C
30C
Mass Loss Temperature Effects:
0
0,5
1
1,5
2
0 200 400 600 800Mas
s Lo
ss (
%)
Dose (MJ/m2)
5 % SiO2-Epoxy
Neat Epoxy
Linear fitArrhenius-like
kinetics
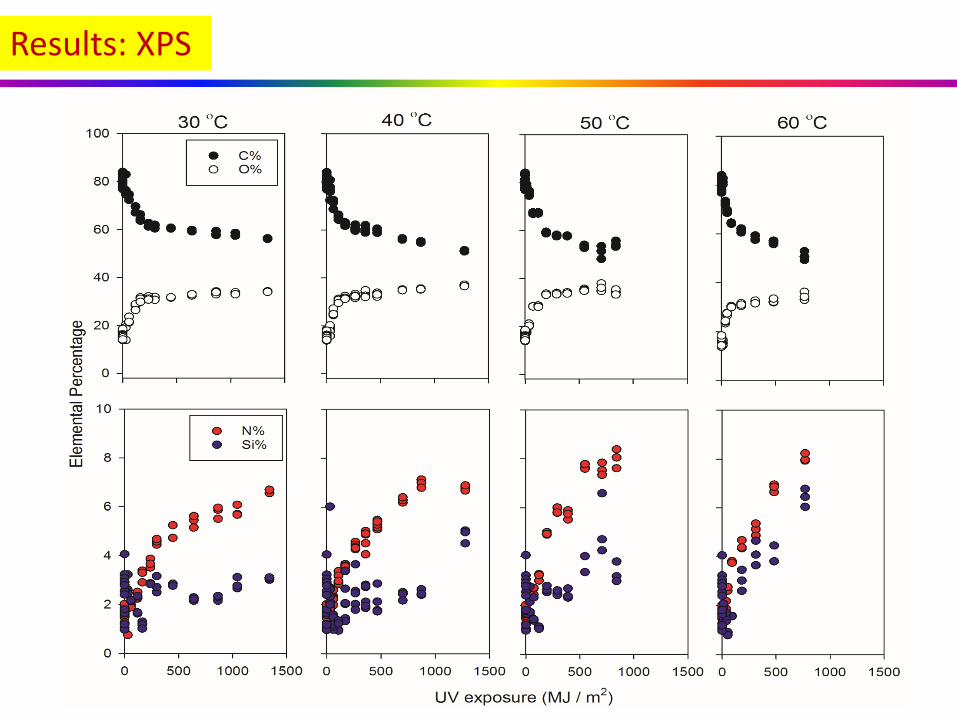
Results: XPS

• C(1s): the overall loss at 50 °C and 60 °C > that at 30 °C and 40 °C• O(1s): no significant difference for all temperatures• N(1s): %N30 °C < %N40 °C < %N50 °C ≈ %N60 °C.
Dose > 500 MJ * m-2
XPS
Dose < 500 MJ * m-2
No temperature dependence for C(1s), O(1s) and N(1s)
Surface enhancement C, O, N vs. UV dose at different T

XPS
0 200 400 600 800 1000 1200 14000
2
4
6
8
60 OC
50 OC
40 OC
30 OC
Dose (MJ/m2)
Ele
menta
l P
erc
enta
ge
Surface enhancement Si vs. UV dose at different T
Arrhenius-like kinetics
Linear fit
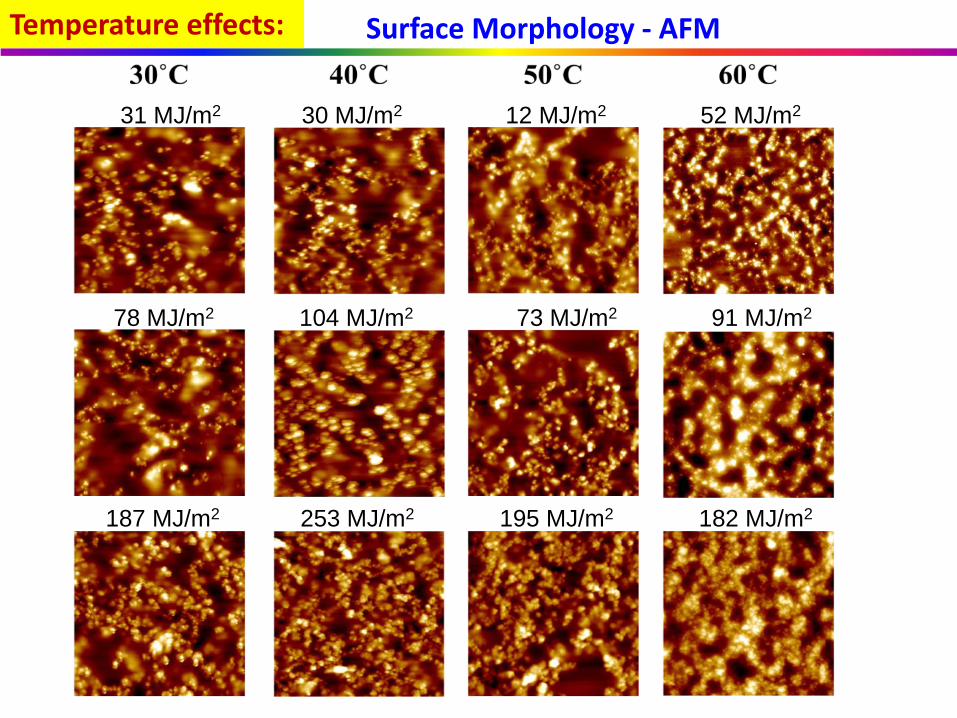
31 MJ/m2 30 MJ/m2 12 MJ/m2 52 MJ/m2
78 MJ/m2 104 MJ/m2 73 MJ/m2 91 MJ/m2
187 MJ/m2 253 MJ/m2 195 MJ/m2 182 MJ/m2
Surface Morphology - AFM Temperature effects:

0 200 400 600 800 10000
10
20
30
40
50
60
70
80
Pa
rtic
le S
urf
ace
Co
ve
rag
e (
%)
Dose (MJ/m2)
30oC
40oC
50oC
60oC
Remove first two points
0 200000 400000 600000 800000 1000000
20
25
30
35
40
45
50
55
60
65
70
Pa
rtic
le S
urf
ace
Co
ve
rag
e (
%)
Dose (MJ/m2)
30°C
40°C
50°C
60°C
0 1000000 2000000 3000000 4000000 5000000 6000000
20
25
30
35
40
45
50
55
60
65
70
Pa
rtic
le S
urf
ace
Co
ve
rag
e (
%)
Dose (MJ/m2)
30°C
40°C shifted 1.5
50°C shifted 1.9
60°C shifted 2.9
0.0030 0.0031 0.0032 0.0033
0.0
0.2
0.4
0.6
0.8
1.0
1.2
ln (
)
1/T(oK)
Equation y = a +
Adj. R-S 0.981
Value Standard
C Interce 11.417 0.85071
C Slope -3458.4 270.0223
0.0030 0.0032
1.0
1.2
1.4
1.6
1.8
ln R
0
1/T(oK)
Surface Morphology - AFM - data fittingTemperature effects:
Shift factor

Measurement and Modeling of NanosilicaRelease from Epoxy Nanocomposite Exposed to UV at 4 Temperatures using new sample holder (below) and surface treated SiO2
Quartz cover
With surface treated SiO2
improve dispersion
Collecting Released Nanoparticles – Using ICP-OES
Large uncertainties @ high Temp !
Dispersion issue?Non-uniform degradation
0 300 600 900 1200 15000
50
100
150
200
250
Si M
ass (mg
)Dose (MJ/m
2)
30oC
40oC
50oC
60oC

1 d 3 d 7 d 10 d
Epoxy+SiO2 (treated)
Scan size : 20 mm X 20 mm
With Surface Treated SiO2 Better Dispersion
Height
Phase
Epoxy+SiO2 (untreated)– 2 d –
Epoxy+SiO2 (untreated)– 14 d –

Non-Uniform Degradation Process
surface treated SiO2
more release
less release
0 200 400 600 800 1000 12000
50
100
150
Norm
aliz
ed M
ass (mg)
Dose (MJ/m2)
30oC
40oC
50oCx
x
Except 60 oC, Release rate: no strong Temperature dependence
Linear slope:0.126 ± 0.004

Acceleration effect of temperature -Arrhenius relationship
The higher temperature, the higher photodegradationand surface nanosilica accumulation rate.
The chemical degradation rate of the matrix (FTIR data UV-Vis data)
Accumulation rate for Si on the surface (AFM and XPS data ) followed the right temperature order, i.e., 60 °C > 50 °C > 40 °C > 30 °C.
Release rate: no strong temperature dependence, except 60 oC
Summary: The effects of temperature

Summary: Temp Dependence
Slopes (k) Vs T
Linearly increasing trends: y=kt+y0
mass loseXPS Si
Exponential Decay: y=a*e-kt +y0
XPS CFTIR-ATR 1245 and 1508
Exponential Rise: y=a*(1-e-kt)+y0
AFMXPS OUV-vis
Arrhenius-like kinetics