Embed Size (px)
Citation preview

Dr. Daniel J. HurleyCEO
May 24, 2016
Governor Snyder’s 2016 State Universities Summit
Narratives in U.S. Higher Education, Michigan in Context

Agenda• Challenges and opportunities• Selected issues in the national
narrative in higher education• Hope for the future regarding
college affordability and student success
• Open dialogue• Goal: Stimulate discussion

The Goal:
60% of Michigan Residents to have a Postsecondary degree or credential by 2025.
More Info at:
mitalentgoal2025.org
Good News on Educational Attainment in Michigan,Associate’s degree or above:2008: 35.7%2014: 39.3% (+3.6%)
43.3% when including high-quality certificates


Challenge: Demographics and Migration
Production of High School Graduates in Michigan
Source: Knocking at the College Door, 2015, Western Interstate Commission for Higher Education
2010 – 2015: Nearly 20,000 fewer H.S. Grads AnnuallyYet, state university enrollment:
Full-time freshmen: +1.5%Total undergrads: -0.1%Total students: -0.5%

Age Group Proportions, Michigan Residents, By Prosperity Region
Source: Reaching for Opportunity / U.S. Census Bureau, Annual County Population Estimates, 2013 data.
Challenge: Demographics and Migration

Percent of Michigan Adults, Aged 25-64, with Some College, No Degree
Source: Reaching for Opportunity
Opportunity: Adult Non-Degree Completers
Opportunity: Out-of-State & International Enrollment
International Student Enrollments: Midwest Regional States
2013-14 Growth National Rank 2014 Students
Illinois 8.7% #5 42,527
Pennsylvania 11.2% #6 41,446
Ohio 14.4% #8 32,498
Michigan 10.1% #9 29,648
Indiana 8.2% #10 26,406
Michigan higher education: A nearly $1 billion export annually

State Investment in Higher Education• 5th consecutive year of re-investment (appropriations)• FY 2011-2016: U.S. +11.6% / MI -2.4%• $1 billion reduction in inflation-adjusted state higher education
and student aid funding since 2002• MI ranks 39th in per capita state fiscal support for higher ed• Since 2000, 80% of tuition price increases are attributable to
state funding reductions; nearly 100% when factoring in institutional financial aid (inflation-adjusted, as of FY 2014).- House Fiscal Agency, December, 2013
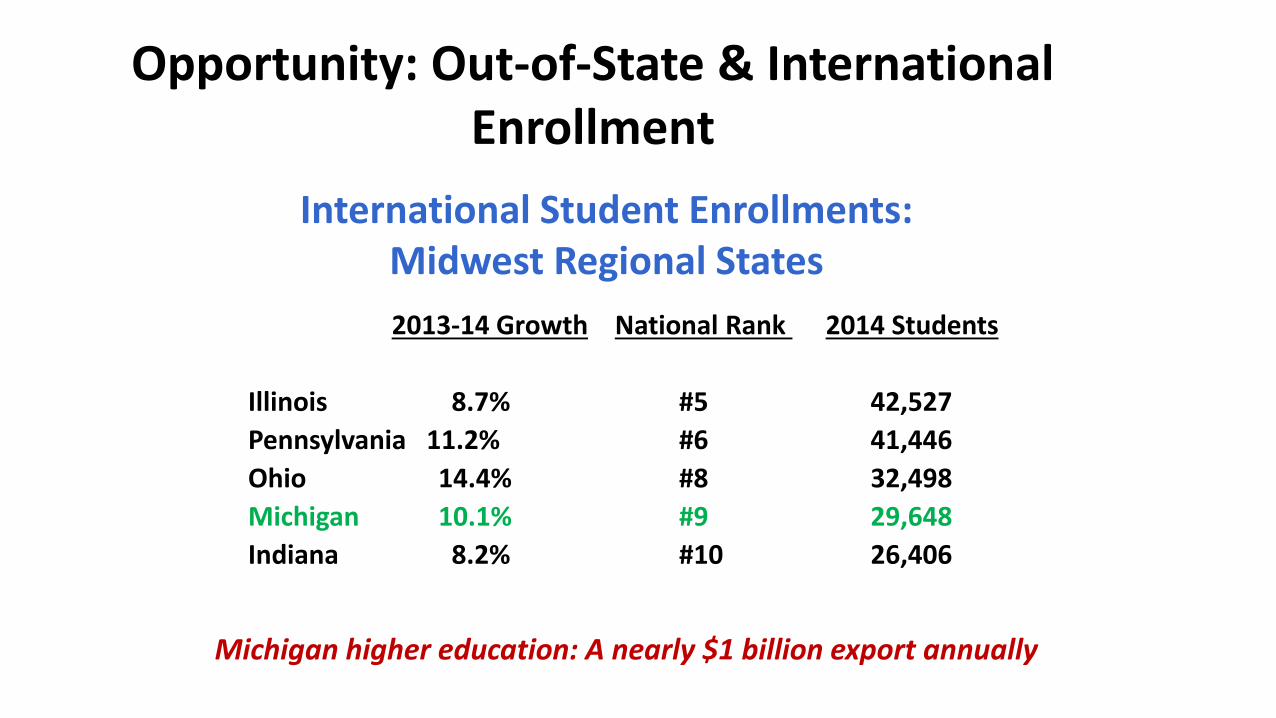
Higher Education Finance—
State Funding
Higher Education as a State Investment Priority
Source: Overview of Governor Snyder’s FY 2016-17 Budget, Senate Fiscal Agency, February 17, 2016
Higher Education Finance—
State Funding

11
0%
25%
50%
75%
FY
19
84
FY
19
85
FY
19
86
FY
19
87
FY
19
88
FY
19
89
FY
19
90
FY
19
91
FY
19
92
FY
19
93
FY
19
94
FY
19
95
FY
19
96
FY
19
97
FY
19
98
FY
19
99
FY
20
00
FY
20
01
FY
20
02
FY
20
03
FY
20
04
FY
20
05
FY
20
06
FY
20
07
FY
20
08
FY
20
09
FY
20
10
FY
20
11
FY
20
12
FY
20
13
FY
20
14
FY
20
15
Other
State Appropriations
Student Tuition and
Fees
Source: House Fiscal Agency, 2015
State Support and Tuition LinkedProportion of Tuition and State Appropriations that Comprise Universities’ General Funds
Higher Education Finance—
State Funding

70%
30%
University GF Revenues -FY1979
Appropriations Tuition & Fees
23%
77%
University GF Revenues -FY2015
Appropriations Tuition & Fees
In Michigan – The State-to-Student Cost Shift in Paying for a Public University Education
Data source: House Fiscal Agency
Higher Education Finance—
State Funding

State Disinvestment = Higher Tuition
Prices
Average 2015-16 In-State Tuition and Fees at Public Four-Year Institutions by State and Five-Year Percentage Change in Inflation-Adjusted Tuition and Fees
Michigan: $11,990
Michigan: 8%
Higher Education Finance—
Student Tuition
Source: The College Board, 2015 Annual Survey of Colleges
*Note: Published Prices, Not Including all forms of Grant Aid

State Student Aid• MI 39th nationally in student aid investment• 70% reduction in state aid since 2002 (CPI adjusted)
• Shift in the provision of student aid from the state to institutions
Higher Education Finance—
State Student Aid

Higher Education Finance—
State Student Aid
Source: The College Board, Trends in Student Aid, 2015; 2013-14 data.
State Grant Aid per Full-Time Undergraduate Student
Michigan: $225 / 31% of U.S. average

$3
11
,64
9,4
34
$3
31
,81
9,8
51
$3
53
,24
9,2
53
$3
52
,50
9,1
43
$3
95
,92
8,4
44
$4
21
,41
1,1
02
$4
56
,67
3,3
34
$5
05
,55
3,3
71
$5
14
,27
4,9
86
$6
03
,93
8,6
11
$6
34
,07
7,2
36
$6
64
,31
0,6
50
$6
94
,90
0,9
95
$7
39
,11
5,6
03
$3
46
,77
0,8
90
$2
71
,66
7,9
15
$2
58
,40
9,9
26
$2
33
,55
1,1
10
$2
93
,94
4,1
54
$2
82
,54
9,5
78
$2
63
,42
8,0
90
$2
43
,66
2,9
39
$9
1,9
91
,42
4
$9
8,8
07
,11
0
$1
03
,10
9,3
50
$1
00
,09
2,7
02
$1
01
,93
1,2
79
$1
04
,99
4,2
00
$0
$100,000,000
$200,000,000
$300,000,000
$400,000,000
$500,000,000
$600,000,000
$700,000,000
$800,000,000
FY 2002 FY 2003 FY 2004 FY 2005 FY 2006 FY 2007 FY 2008 FY 2009 FY 2010 FY 2011 FY 2012 FY 2013 FY 2014 FY 2015
Financial Aid in MichiganConstant 2015 dollars (CPI-U)
Institutional Financial Aid State Financial Aid
Public Universities –Filling the Void of State Student Aid Disinvestment
Higher Education Finance—
State Student Aid
Data source: House Fiscal Agency, MASU

Higher Education Finance—
Average Net Cost of Attendance
When factoring in all forms of Grant Aid—federal, state and institutional (not including loans), the average Cost of Attendance at Michigan’s public universities is $13,490
*Cost of Attendance includes tuition & fees, room & board, books & supplies, transportation.
Sticker Price Vs. Net Price at Michigan’s Public Universities
$0
$5,000
$10,000
$15,000
$20,000
$25,000
FY 2010 FY 2011 FY 2012 FY 2013 FY 2014
Total Cost of Attendance Net Price
Ave. Published Price: $22,585
Ave. Net Price: $13,490
Source: U.S. Dept of Ed, IPEDS

Higher Education Finance—
Student Debt
Student Debt• Student debt – It’s an issue – but not a crisis• Great Recession – enrollment boom, more borrowing• In Michigan – nearly 40% of public university grads
leave with NO student debt
% of Students with Debt
Ave Debt of Graduates
Per Capita Debt of Graduates
Public Universities-Michigan 61% $29,142 $17,784
Public Universities-National 60% $25,902 $15,486
Source: The Institute for College Access & Success, 2013-14 data

Higher Education Finance—
Student Debt
Distribution of Outstanding Education Debt by Average Balance
Source: The College Board, Trends in Student Aid, 2015; 2014 data.

Higher Education Finance—
Student Debt
Source: Vox.com, Libby Nelson. Data from New York Fed
Consumer Credit Panel/Equifax. 2014 Q4 data.
Student Debt Paradox: Smaller the Loan, Higher Likelihood of Loan Default
Percent of borrowers who have ever defaulted, by school-leaving loan balance

Higher Education Finance—
Student Debt
Distribution of Student Debt, Actual Vs. Anecdotal Reporting
Source: Hamilton Place Strategies

$1
2,8
27
$1
2,9
15
$1
2,4
68
$1
1,5
35
$1
0,0
95
$9
,69
9
$9
,18
6
$9
,06
7
$8
,79
6
$8
,84
3
$8
,50
9
$7
,99
5
$6
,68
7
$6
,89
6
$7
,01
3
7,4
96
$5
,90
5
$5
,97
2
$6
,54
3
$6
,96
7
$7
,54
4
$7
,52
5
$8
,14
0
$8
,52
7
$8
,94
9
$9
,69
8
$1
0,1
40
$1
0,3
27
$1
0,7
91
$1
0,9
71
$1
1,1
75
11
,45
4
145,000
150,000
155,000
160,000
165,000
170,000
175,000
180,000
185,000
190,000
195,000
$0
$5,000
$10,000
$15,000
$20,000
$25,000
FY 2000 FY 2002 FY 2004 FY 2006 FY 2008 FY 2010 FY 2012 FY 2014
FYES
Average GF Revenues per Resident Undergraduate FYESConstant 2015 dollars using CPI-U
Appropriation per Resident Undergrad FYES Resident Undergrad Tuition & Fee Rates Resident Undergrad FYESData source: House Fiscal Agency
Average FY15 revenuesare $61 less than FY02.
Public Universities –Not Passing the Buck on to Michigan Students
Higher Education Finance—
Institutional Spending

Institutional Fiscal Stewardshipat the State Universities of Michigan
• Group purchasing• MI Coalition on Health• MI Universities Self-Insurance Corporation• Midwest Higher Education Compact
• Organizational realignments, consolidations• Efforts to boost student success
• Increased retention, degree completion, reducing time-to-degree

Institutional Fiscal Stewardship:Academic Programming
New Discontinued
Bachelor’s Degrees 27 25
Master’s Degrees 19 48
Doctoral Degrees 10 11
New and Discontinued Degree Programs, May 2015 through April 2016
In the past year at Michigan’s 15 public universities, 28 more academic programs were eliminated than were created.

Graduation Rates
• Positive trend, but still room for improvement• Inadequacy of Federal Graduation Rate data• All MI State Universities participating in Student
Achievement Measure• Forthcoming: MI CEPI Graduation Rate• Includes part-time students• Includes transfers-in and transfers-out• Better data, much better graduation rate
Accountability

The Obama Administration unveiled a new College Scorecard in 2015.
The result?
Michigan’s public universities cost below average and return a higher salary compared to national peers.
collegescorecard.ed.gov
Accountability

The Obama Administration unveiled a new College Scorecard in 2015.
The result?
Michigan’s public universities cost below average and return a higher salary compared to national peers.
collegescorecard.ed.gov
Accountability

Collaborating to Advance Student Success• Career and College Readiness Standards*• Credit When It’s Due (Reverse Transfer)• Coalition of Michigan Veterans Educators*• Detroit Promise Scholarship Program• Liberal Education & America’s Promise• Math Pathways to Completion Initiative*• Michigan Career Pathways Steering
Committee*
Collaboration
• Michigan Gateways to Completion Project• Michigan Transfer Agreement*• Michigan Transfer Steering Committee*• Michigan Transfer Network*• MHEC Commission on Military Credit*• Implementation of Reaching for
Opportunity Report Recommendations
Asterisks indicate initiatives that the Michigan Association of State Universities (MASU) and Michigan Community College Association (MCCA) are jointly involved in.

Credit Transfer
• MACRAO Agreement – Since 1972, transferrable block of general education credits
• Michigan Transfer Agreement• Transfer of 30-credit hour block – all state universities
participating• Next Up: Creation of Statewide Transfer Steering Committee
• Focus: High-enrollment transfer pathways• Replacement/Upgrade of Michigan Transfer Network
(online resource)
Student Transitions

STEM vs. Liberal Arts: The False Dichotomy
• Narrative: Increasing utilitarian view of higher education• Broad learning is fundamental to democracy• Liberal education should be integrated into all disciplines• Success in contemporary, global society requires understanding
of big picture, complexity, ethical/civic responsibility• Employers want BOTH broad & specific skills/knowledge• Clear connections between students’ majors and broader
learning (relevance) — project- and problem-based learning• What drives students? Their interest & aptitude,
not paycheck.
Student Outcomes

Liberal Education & America’s Promise (LEAP)
• MI one of 14 states taking part in national public advocacy and campus action initiative
• Importance of liberal arts to individual students and nation dependent on economic creativity and democratic vitality
• Focus on essential learning outcomes (& assessments)
• High-impact educational practices
Student Outcomes

Hope for the Future Involving College Affordability & Student Success
• Increasing college preparation = increasing participation• Sophistication in student retention strategies• Innovation in instructional delivery• Edupreneuralism• Pre-college credit (dual enrollment, AP, early college)• Federal-State College Affordability Partnership

Local, State & Global Impact
• Innovation & Entrepreneurialism• Research & Development• Environmental Sustainability• Health Care• K-12 Outreach• Public Safety
Mission Delivery
• Civic Engagement & Education• Student Service and Outreach• Culture and Placemaking• Faculty Perspective and Expertise• Flint Water Crisis• Global Outreach