Embed Size (px)
Citation preview

This month, the U.S. Department of Agriculture (USDA) raised its forecast for 2007/08 soybean exports by 10 million bushels to 1.005 billion. Stable export demand for both soybean meal and soybean oil contributed to an increase in the 2007/08 crush forecast by 5 million bushels to 1.835 billion. Soybean ending stocks would fall to 160 million bushels, their lowest since 2003/04. Strengthening competition from exports and rising costs for soybean oil lowered the 2007/08 consumption forecast for methyl esters (biodiesel) from 3.8 billion pounds to 3.4 billion pounds. Rising export taxes in Indonesia are expected to reduce 2007/08 palm oil exports to 13.5 million metric tons, while domestic consumption is forecast improving to 4.8 million tons. Despite rising Malaysian palm oil production, a high demand for exports will limit the country’s biodiesel output. China’s 2007/08 palm oil imports were forecast 200,000 tons higher this month to 5.7 million tons.
Figure 1U.S. soybean stocks-to-use ratio seen plummeting toward a record low
0
10
20
30
1970 1975 1980 1985 1990 1995 2000 2005
Percent
Sources: Grain Stocks, National Agricultural Marketing Service, USDA and World Agricultural Supply and Demand Estimates, World Agricultural Outlook Board.
Oil Crops Outlook Mark Ash and Erik Dohlman U.S. Exports are Withstanding Higher Soybean Costs
OCS-08b Feb. 11, 2008
Contents Domestic Outlook Intl. Outlook Contacts & Links Tables Soybean S&D Soybean Meal Soybean Oil Cottonseed Cottonseed Meal Cottonseed Oil Peanuts Oilseed Prices Veg. Oil Prices Oilseed Meal Prices Web Sites WASDE Oilseed Circular Briefing Room ------------- The next release is April 10, 2008 -------------- Approved by the World Agricultural Outlook Board.
Domestic Outlook
2 Oil Crops Outlook/OCS-08b/February 11, 2008
Economic Research Service, USDA
Buoyant Soybean Demand To Trim 2007/08 Ending Stocks to a Bare Minimum The current drop in interest rates is exerting further pressure on the value of the U.S. dollar. The appreciation of most major currencies against the dollar is providing additional support for U.S. exports of soybeans and soybean products. Exports are also being aided by an easing of ocean freight rates. For instance, shipping costs for the Pacific Northwest-to-Japan route declined from $84 per metric ton in October 2007 to $51 by early February. This month, USDA raised its forecast for 2007/08 soybean exports by 10 million bushels to 1.005 billion. Even with the 2007/08 soybean supply down by 482 million bushels from last year, U.S. export shipments this year trail the 2006/07 pace by only 48 million bushels. Through January 31, outstanding export sales of soybeans were still quite large, based on steady recent export sales. The implications are that a steep seasonal decline of shipments should not set in for a while longer. Even with soybean shipments anticipated to fall sharply by next summer, the annual decline in 2007/08 exports (from 1.118 billion bushels in 2006/07) could be held to no more than 113 million bushels. Domestic processors are also contributing to the market strength of soybeans, leading to an increase in the 2007/08 crush forecast this month by 5 million bushels to 1.835 billion bushels. The September-December 2007 soybean crush totaled 629.8 million bushels—a 2.2-percent increase over the previous year. High prices for soybean meal and soybean oil are more than compensating processors for their sharply higher soybean costs. Values for both soybean meal and soybean oil are being supported by stable export demand. Thus, a steep drawdown of soybean ending stocks will account for the majority of this year’s reduction in supply. As a result of this month’s forecasts for higher soybean demand, the 2007/08 ending stocks would be 15 million bushels lower at 160 million. If realized, the percentage of soybean stocks to annual total use would decline to 5.3 percent, or a mere 19 days of inventory. Ending stocks could then drop to their lowest level since 2003/04, when the carryout fell to 112 million bushels (representing a stocks-to-use ratio of 4.5 percent). The good chance for a minimally adequate year-end supply only reinforces the urgency to rebuild it through a substantial expansion of soybean planting this spring. The national average farm price for soybeans rose by $1 per bushel in January to $11.00. Given that at least two-thirds of farm marketings for soybeans have been completed, the range for the season-average price forecast was narrowed this month to $10.00-$10.80 per bushel from $9.90-$10.90 previously. As the United States is still the top soybean-producing country, its price increases are being transmitted worldwide. Foreign Trade in Soybean Meal Is Proceeding Well Under similar circumstances, 2007/08 U.S. soybean meal exports were forecast higher to 8.7 million short tons from 8.4 million previously. Current export sales commitments for soybean meal are up 9 percent from a year ago. Although two
3 Oil Crops Outlook/OCS-08b/February 11, 2008
Economic Research Service, USDA
-thirds of total sales are for the Western Hemisphere, Asian and Middle Eastern countries account for most of the gains over last year. Better opportunities in these markets exist as South American exports are concentrated on an expanding trade with Europe. In mid-January, concerns over a weakening U.S. economy precipitated a slide in soybean meal prices, but they have since recovered to their month-earlier heights. The central Illinois price average for January 2008 was $331 per short ton, up from $315 in December and $190 in January 2007. The season-average price was unchanged at $305-$335 per short ton. Exports of Soybean Oil Accelerate, But High Prices Stifle U.S. Biodiesel Output A higher domestic output of soybean oil is seen for 2007/08, based on forecasts of a larger soybean crush and an above-average rate of oil extraction. However, a supply increase of more than 400 million pounds this year is expected to lag the demand gains for soybean oil. Despite considerably higher costs for soybean oil in 2008, U.S. export shipments have not suffered as a consequence. In fact, current export shipments of soybean oil are already ahead of last year’s pace and the total sales commitments are 71 percent ahead of their amount a year ago. New U.S. sales accelerated in January, particularly for China and North Africa. USDA reacted to the sales data by raising its 2007/08 export forecast for soybean oil from 1.65 billion to 1.95 billion pounds. Domestic soybean oil prices surged again in January, to a monthly average of 49.8 cents per pound compared to the December 2007 average of 45.2 cents. The unabated ascent of prices prompted increasing the 2007/08 forecast by 2 cents per pound to 47.5-51.5 cents. In just one year, prices for soybean oil have nearly doubled. Strengthening foreign competition and rising costs for soybean oil are unfavorable trends for domestic users. U.S. biodiesel producers are particularly vulnerable to the escalating expense of their primary input. Although consumption of soybean oil for methyl esters (biodiesel) in the fall quarter (October-December 2007) was 35 percent above the previous year, it was down one-third from the summer quarter. An inability to run profitably at current soybean oil prices is halting construction of new production facilities and idling the ones completed recently. Even so, support for soybean oil prices will remain for as long as the excess biodiesel capacity is capable of becoming operational. This month, USDA lowered its 2007/08 forecast of soybean oil use for methyl esters from 3.8 billion pounds to 3.4 billion pounds. There was no change to expected demand for food and other uses of soybean oil this month, so the lower domestic disappearance forecast (from 19.9 billion to 19.5 billion pounds) is due entirely to a dimmer outlook for biodiesel. When combined with a higher production forecast, U.S. inventories of soybean oil (totaling 3.058 billion pounds in December) could fall less dramatically in 2007/08 than previously anticipated. The prior forecast for ending stocks was as low as 2.25 billion pounds, but is buoyed this month to 2.5 billion pounds.

International Outlook
4 Oil Crops Outlook/OCS-08b/February 11, 2008
Economic Research Service, USDA
January Rains Soak South American Crops Heavy rains covered a large portion of Brazil last month. The moisture generally promoted soybean development, although for early sown crops in northern Mato Grosso, it delayed the start of harvest. The wet conditions are leading farmers to carefully monitor any new cases of soybean rust. The 2007/08 production forecast for Brazil is unchanged at 60.5 million metric tons. Since November, eastern Bolivia has endured widespread flooding and excessive rainfall. Substantial crop damage is evident throughout Santa Cruz, the country’s main soybean growing region. The adverse effect on yields is expected to cut Bolivia’s soybean output by 250,000 tons to 1.85 million, and reduce expected crush demand and ending stocks. In Argentina, an earlier dry spell was eased in January by a revival of rains. Soil moisture conditions for the recently sown crops were improved, particularly in Cordoba, the country’s top soybean-producing Province. A substantial part of the growing season still lies ahead, so the 2007/08 forecast of Argentine soybean production was unchanged at 47 million tons. Brisk Rate of Soybean Meal Consumption Seen For EU-27 This Year For 2007/08, EU-27 soybean meal consumption is expected at 35.3 million tons—up 700,000 tons from the previous forecast. The gains are helping to offset a further decline in feed wheat consumption. EU-27 imports of soybean meal are seen being pushed up to 24 million tons. Lower Feed Consumption in India To Boost Soybean Meal Exports Current outbreaks of highly pathogenic avian influenza in India, Bangladesh, and Pakistan present serious problems for the poultry and egg industries in those countries, which were already under stress from the rising cost of feed. Many countries have banned imports of eggs from India. In response, governments in the region are requiring the mass culling of birds to control spreading of the disease. The impact is expected to slow India’s domestic consumption of soybean meal to 2.1 million tons from 2.2 million previously and 1.95 million in 2006/07. In contrast, a greater availability of supplies boosts the forecast of 2007/08 Indian soybean meal exports by 100,000 tons to 4.1 million. For the season to date, October 2007-January 2008 export shipments were 214,000 tons ahead of the year-earlier pace, when the season total came to 3.5 million tons. Based on the latest government sowing data, India’s 2007/08 rapeseed area was revised up to 5.9 million hectares. Although recent dry and cold weather has been less than ideal for rapeseed’s pre-flowering stage, Indian production was forecast up to 5.5 million tons from 5.4 million due to the better-than-anticipated sowing. Yet, the crop would still be below last year’s output of 5.8 million tons when rapeseed area totaled 6.6 million hectares. Compared to a year ago, the cost for crude soybean oil imports arriving at Mumbai has soared from $720 to $1,180 per metric ton. Crude palm oil can be imported
5 Oil Crops Outlook/OCS-08b/February 11, 2008
Economic Research Service, USDA
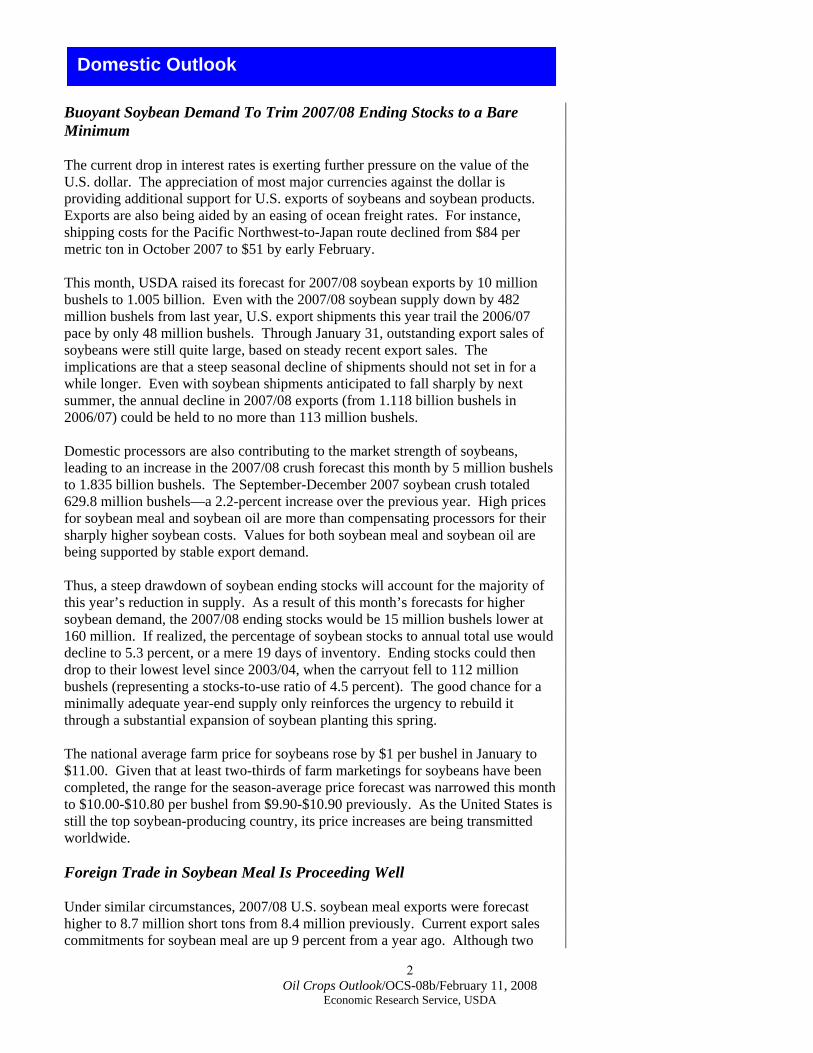
more cheaply at $900 per ton, although this too is up sharply from less than $600 a year ago. Rapid cost increases, combined with higher estimates for the domestic rapeseed harvest, reduced the 2007/08 forecast of Indian soybean oil imports this month to 1.1 million tons from 1.4 million. High Commodity Prices Prompt Indonesian Government To Revise Tariffs As in India, officials in Indonesia are worried about rapid price inflation for food staples. Indonesian prices for poultry and eggs have surged due to high expenses for imported corn and soybean meal. Import costs for wheat and rice are up sharply as well. The alternatives for consumers who are too poor to eat meat regularly are also becoming less affordable. For a majority of the population, soybean-based foods (such as tofu and tempeh) are the main source of protein. Escalating public protests are demanding that the Government take action on food costs. In January, the Government of Indonesia indefinitely suspended import tariffs of 10 percent on soybeans and 5 percent on wheat flour. Rice import tariffs will be reduced by 18 percent and the consumer subsidies will expand. Higher domestic production will also be encouraged by distributing free soybean seed to small farms. Imports now constitute up to two-thirds of Indonesian soybean consumption. Palm oil is another vital component of the Indonesian diet. The Government’s export tax on palm oil has been rising (currently at 10 percent) and its reference price is frequently adjusted upward. Further hikes in the export tax rate—from 15 to 25 percent—are likely, depending on how much higher prices go. In addition, Rotterdam palm oil prices exceeding $1,100 per ton would trigger a new 5-percent tax on biodiesel exports. Domestic consumption of palm oil in 2007/08 was forecast up to 4.8 million tons. Expectations for 2007/08 exports of palm oil from Indonesia were trimmed back to 13.5 million tons, still well above 2006/07 shipments of 11.5 million tons. Ample moisture is improving palm oil production in Malaysia, where October-December 2007 output was up by 13 percent (or 0.5 million tons) against a year earlier. Consequently, the 2007/08 output was forecast up to 17 million tons from 16.6 million previously. Malaysian palm oil exports are seen expanding to 13.4 million tons (from 13.1 million) in 2007/08. In contrast, high palm oil costs have stalled plans to expand biodiesel production in the country. The Government had approved licenses for as many as 91 biodiesel plants in Malaysia, although only 7 are currently operating. Biodiesel production capacity is at least 1 million tons, but negative margins are limiting current output to about one-tenth of capacity. Aside from their increasingly expensive feedstock, biodiesel producers in Southeast Asia are also losing favor with major customers in Europe. Dutch importers, among others, have scaled back on imports of palm oil and palm-based biodiesel until strict criteria for environmental sustainability are met. Many in Europe believe that the clearing of land for new oil palm plantations in Southeast Asia is causing environmental harm. Slower trade is forecast, lowering 2007/08 palm oil imports for the EU-27 by 300,000 tons to 3.8 million. In contrast, palm oil imports by other countries have been quite brisk just to fulfill their large food requirements. China’s palm oil imports were forecast 200,000 tons

6 Oil Crops Outlook/OCS-08b/February 11, 2008
Economic Research Service, USDA
higher this month to 5.7 million. Palm oil imports by Pakistan are expected to increase to 2.4 million tons from 2.2 million in 2006/07. And U.S. imports of palm oil are seen rising to a record-high 790,000 tons from 699,000 last year.
Figure 2Malaysia palm oil output rising
0
5
10
15
20
1998
/99
1999
/00
2000
/01
2001
/02
2002
/03
2003
/04
2004
/05
2005
/06
2006
/07
2007
/08F
Million metric tons
Source: Oilseeds: World Markets and Trade, Foreign Agricultural Service, USDA

For registration and other details:www.usda.gov/oce/forum/
EnergizingRural Americain the Global MarketplaceFebruary 21-22, 2008
Crystal Gateway Marriott HotelArlington, Virginia
USDA’s
Forecasts · Trends · Policies8
7 Oil Crops Outlook/OCS-o8b/February 11, 2008 Economic Research Service, USDA
Contacts and Links
8 Oil Crops Outlook/OCS-08b/February 11, 2008
Economic Research Service, USDA
Data Monthly tables from Oil Crops Outlook are available in Excel (.xls) spreadsheets at http://www.ers.usda.gov/briefing/soybeansoilcrops/Data/data.htm. These tables contain the latest data on the production, use, imports, exports, prices, and textile trade of cotton and other fibers. Recent Reports Economic Analysis of Base Acre and Payment Yield Designations Under the 2002 U.S. Farm Act evaluates farmers' decisions to designate base acres under the 2002 Farm Act. Findings suggest that decision makers responded to economic incentives in their designations of base acres by selecting those options that resulted in the greatest expected flow of program payments (http://www.ers.usda.gov/publications/ERR12/). See also Farm Program Acres for the county-level farm program and planted acreage data used in the report, which can be downloaded and mapped (http://www.ers.usda.gov/data/baseacres/). Related Websites WASDE, http://usda.mannlib.cornell.edu/MannUsda/viewDocumentInfo.do?documentID=1194 Oilseed Circular, http://www.fas.usda.gov/oilseeds_arc.asp Soybeans and Oil Crops Briefing Room, http://www.ers.usda.gov/briefing/soybeansoilcrops/
Contact Information Mark Ash (soybeans, minor oilseeds), (202) 694-5289, [email protected] Erik Dohlman (peanuts), (202) 694-5308, [email protected] Subscription Information Oil Crops Outlook is issued 11 times per year by the Economic Research Service, U.S. Department of Agriculture, Washington, DC 20036-5831. Electronic release only; no published copies are available. Subscribe to ERS’ e-mail notification service at http://www.ers.usda.gov/updates/ to receive timely notification of newsletter availability. To order printed copies of the five field crops newsletters—cotton and wool, feed, rice, oil crops, and wheat—as a series, specify series SUB-COR-4043.
The U.S. Department of Agriculture (USDA) prohibits discrimination in all its programs and activities on the basis of race, color, national origin, age, disability, and, where applicable, sex, marital status, familial status, parental status, religion, sexual orientation, genetic information, political beliefs, reprisal, or because all or a part of an individual's income is derived from any public assistance program. (Not all prohibited bases apply to all programs.) Persons with disabilities who require alternative means for communication of program information (Braille, large print, audiotape, etc.) should contact USDA's TARGET Center at (202) 720-2600 (voice and TDD). To file a complaint of discrimination write to USDA, Director, Office of Civil Rights, 1400 Independence Avenue, S.W., Washington, D.C. 20250-9410 or call (800) 795-3272 (voice) or (202) 720-6382 (TDD). USDA is an equal opportunity provider and employer.
E-mail Notification Readers of ERS outlook reports have two ways they can receive an e-mail notice about release of reports and associated data. • Receive timely notification (soon after the report is posted on the web) via USDA’s Economics, Statistics and Market Information System (which is housed at Cornell University’s Mann Library). Go to http://usda.mannlib.cornell.edu/MannUsda/aboutEmailService.do and follow the instructions to receive e-mail notices about ERS, Agricultural Marketing Service, National Agricultural Statistics Service, and World Agricultural Outlook Board products. • Receive weekly notification (on Friday afternoon) via the ERS website. Go to http://www.ers.usda.gov/Updates/ and follow the instructions to receive notices about ERS outlook reports, Amber Waves magazine, and other reports and data products on specific topics. ERS also offers RSS (really simple syndication) feeds for all ERS products. Go to http://www.ers.usda.gov/rss/ to get started.

9 Oil Crops Outlook/OCS-08b/February 11, 2008
Economic Research Service, USDA
Table 1—Soybeans: U.S. supply and disappearance
Area Yield Supply DisappearanceYear beg. Planted Harvested Beginning Seed, feed, EndingSept. 1 stocks Production Imports Total Crush Exports & residual Total stocks
Million acres Bu/acre ---------- ------------ ------------ Million bushels ------------ ------------ ------------ ------------2005/06 72.0 71.3 43.0 256 3,063 3 3,322 1,739 940 194 2,873 449 2006/071 75.5 74.6 42.7 449 3,188 9 3,647 1,806 1,118 148 3,073 574 2007/082 63.6 62.8 41.2 574 2,585 6 3,165 1,835 1,005 165 3,005 160
2006/07September 0.4 142.4 64.9 October 0.5 161.7 182.6 November 0.6 155.1 126.4 Sep-Nov 449.3 3,188.2 1.5 3,639.1 459.2 373.8 104.7 937.7 2,701.4 December 0.6 157.4 122.7 January 0.5 155.3 135.1 February 0.8 136.8 129.2 Dec-Feb 2,701.4 --- 1.9 2,703.3 449.5 387.0 80.0 916.4 1,786.9 March 0.9 155.7 85.0 April 0.8 144.9 83.0 May 0.8 151.9 51.4 Mar-May 1,786.9 --- 2.6 1,789.5 452.6 219.5 25.1 697.3 1,092.2 June 1.1 148.7 50.3 July 0.9 150.2 35.5 August 1.0 146.2 51.9 Jun-Aug 1,092.2 --- 3.0 1,095.2 445.1 137.7 (61.4) 521.4 573.8 Total 3,188.2 9.0 3,646.6 1,806.4 1,118.0 148.4 3,072.8
2007/08September 0.4 147.7 60.9 October 0.6 164.0 138.9 November 0.6 155.7 127.1 Sep-Nov 573.8 2,585.2 1.6 3,160.6 467.4 326.9 36.8 831.2 2,329.4 December1 NA 162.4 NATotal to date 1.6 629.8 326.9
1 Estimated. 2 Forecast. Sources: Crop Production and Grain Stocks, National Agricultural Statistics Service, U.S. Department of Agriculture; and Oilseed Crushings, Census Bureau, U.S. Department of Commerce.

10 Oil Crops Outlook/OCS-08b/February 11, 2008
Economic Research Service, USDA
Table 2—Soybean meal: U.S. supply and disappearance Supply Disappearance
Year begin. Beginning Ending Oct. 1 stocks Production Imports Total Domestic Exports Total stocks
1,000 short tons2005/06 172 41,244 141 41,557 33,195 8,048 41,243 314 2006/071 314 43,027 156 43,497 34,360 8,786 43,146 351 2007/082 351 43,784 165 44,300 35,300 8,700 44,000 300
2006/07 October 313.8 3,823.2 12.8 4,149.7 3,084.4 677.0 3,761.3 388.4 November 388.4 3,671.9 13.6 4,073.9 2,858.3 842.0 3,700.4 373.6 December 373.6 3,733.0 13.7 4,120.2 2,864.1 787.2 3,651.3 468.9 January 468.9 3,693.3 13.6 4,175.8 3,049.9 753.2 3,803.1 372.7 February 372.7 3,252.6 13.4 3,638.7 2,592.8 756.3 3,349.0 289.6 March 289.6 3,712.3 15.2 4,017.1 2,771.8 916.8 3,688.6 328.5 April 328.5 3,442.9 12.6 3,783.9 2,826.2 629.2 3,455.3 328.6 May 328.6 3,623.0 13.9 3,965.5 3,022.2 664.1 3,686.3 279.2 June 279.2 3,528.2 11.2 3,818.6 2,769.8 731.8 3,501.6 317.1 July 317.1 3,568.0 11.2 3,896.3 2,967.3 613.8 3,581.1 315.2 August 315.2 3,473.9 13.4 3,802.5 2,799.9 765.7 3,565.6 236.9 September 236.9 3,504.4 11.8 3,753.1 2,753.2 649.0 3,402.2 350.9 Total 43,026.7 156.3 43,496.8 34,359.9 8,786.0 43,145.8
2007/08 October 350.9 3,910.2 12.4 4,273.5 3,286.9 673.3 3,960.2 313.3 November 313.3 3,730.6 12.1 4,056.1 2,813.9 947.4 3,761.3 294.8 December1 294.8 3,881.2 NA 4,176.0 NA NA 3,770.5 405.5 Total to date 11,522.0 24.5 11,546.5 6,100.8 1,620.7 11,492.0 1 Estimated. 2 Forecast.Source: Oilseed Crushings, Census Bureau, U.S. Department of Commerce.
11 Oil Crops Outlook/OCS-08b/February 11, 2008
Economic Research Service, USDA
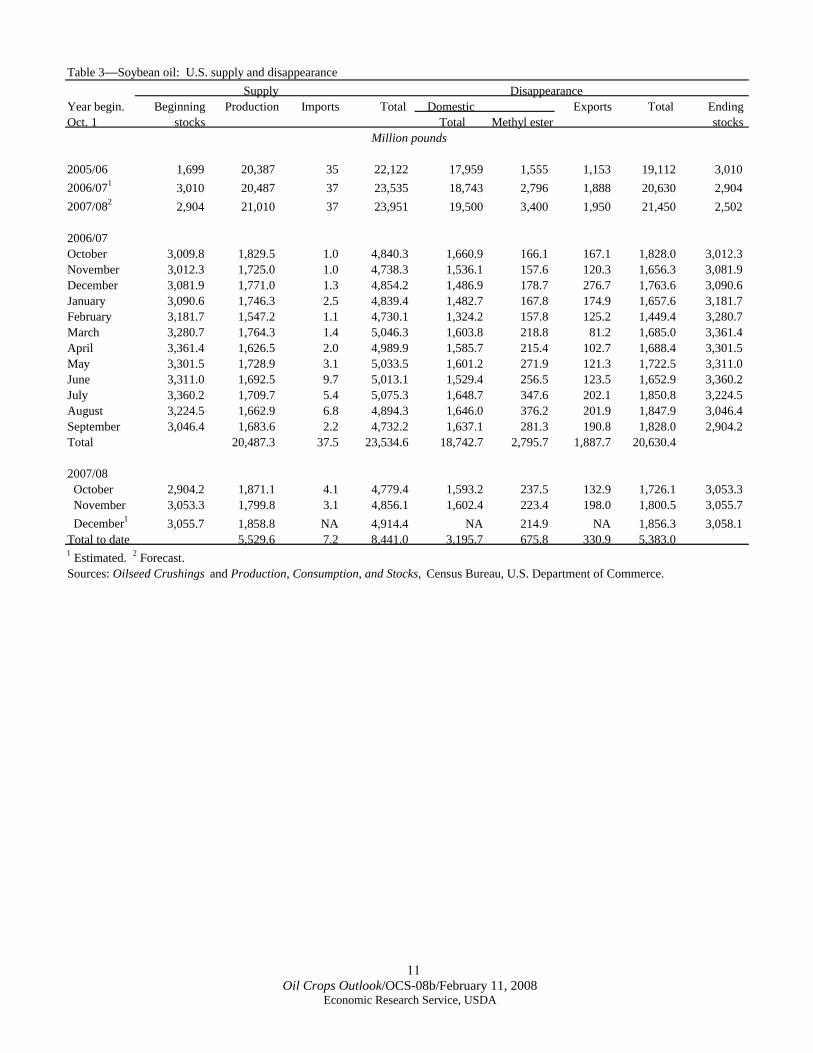
Table 3—Soybean oil: U.S. supply and disappearance Supply Disappearance
Year begin. Beginning Production Imports Total Domestic Exports Total Ending Oct. 1 stocks Total Methyl ester stocks
Million pounds
2005/06 1,699 20,387 35 22,122 17,959 1,555 1,153 19,112 3,010 2006/071 3,010 20,487 37 23,535 18,743 2,796 1,888 20,630 2,904 2007/082 2,904 21,010 37 23,951 19,500 3,400 1,950 21,450 2,502
2006/07October 3,009.8 1,829.5 1.0 4,840.3 1,660.9 166.1 167.1 1,828.0 3,012.3 November 3,012.3 1,725.0 1.0 4,738.3 1,536.1 157.6 120.3 1,656.3 3,081.9 December 3,081.9 1,771.0 1.3 4,854.2 1,486.9 178.7 276.7 1,763.6 3,090.6 January 3,090.6 1,746.3 2.5 4,839.4 1,482.7 167.8 174.9 1,657.6 3,181.7 February 3,181.7 1,547.2 1.1 4,730.1 1,324.2 157.8 125.2 1,449.4 3,280.7 March 3,280.7 1,764.3 1.4 5,046.3 1,603.8 218.8 81.2 1,685.0 3,361.4 April 3,361.4 1,626.5 2.0 4,989.9 1,585.7 215.4 102.7 1,688.4 3,301.5 May 3,301.5 1,728.9 3.1 5,033.5 1,601.2 271.9 121.3 1,722.5 3,311.0 June 3,311.0 1,692.5 9.7 5,013.1 1,529.4 256.5 123.5 1,652.9 3,360.2 July 3,360.2 1,709.7 5.4 5,075.3 1,648.7 347.6 202.1 1,850.8 3,224.5 August 3,224.5 1,662.9 6.8 4,894.3 1,646.0 376.2 201.9 1,847.9 3,046.4 September 3,046.4 1,683.6 2.2 4,732.2 1,637.1 281.3 190.8 1,828.0 2,904.2 Total 20,487.3 37.5 23,534.6 18,742.7 2,795.7 1,887.7 20,630.4
2007/08 October 2,904.2 1,871.1 4.1 4,779.4 1,593.2 237.5 132.9 1,726.1 3,053.3 November 3,053.3 1,799.8 3.1 4,856.1 1,602.4 223.4 198.0 1,800.5 3,055.7 December1 3,055.7 1,858.8 NA 4,914.4 NA 214.9 NA 1,856.3 3,058.1 Total to date 5,529.6 7.2 8,441.0 3,195.7 675.8 330.9 5,383.0 1 Estimated. 2 Forecast. Sources: Oilseed Crushings and Production, Consumption, and Stocks, Census Bureau, U.S. Department of Commerce.
12Oil Crops Outlook/OCS-08b/February 11, 2008
Economic Research Service, USDA
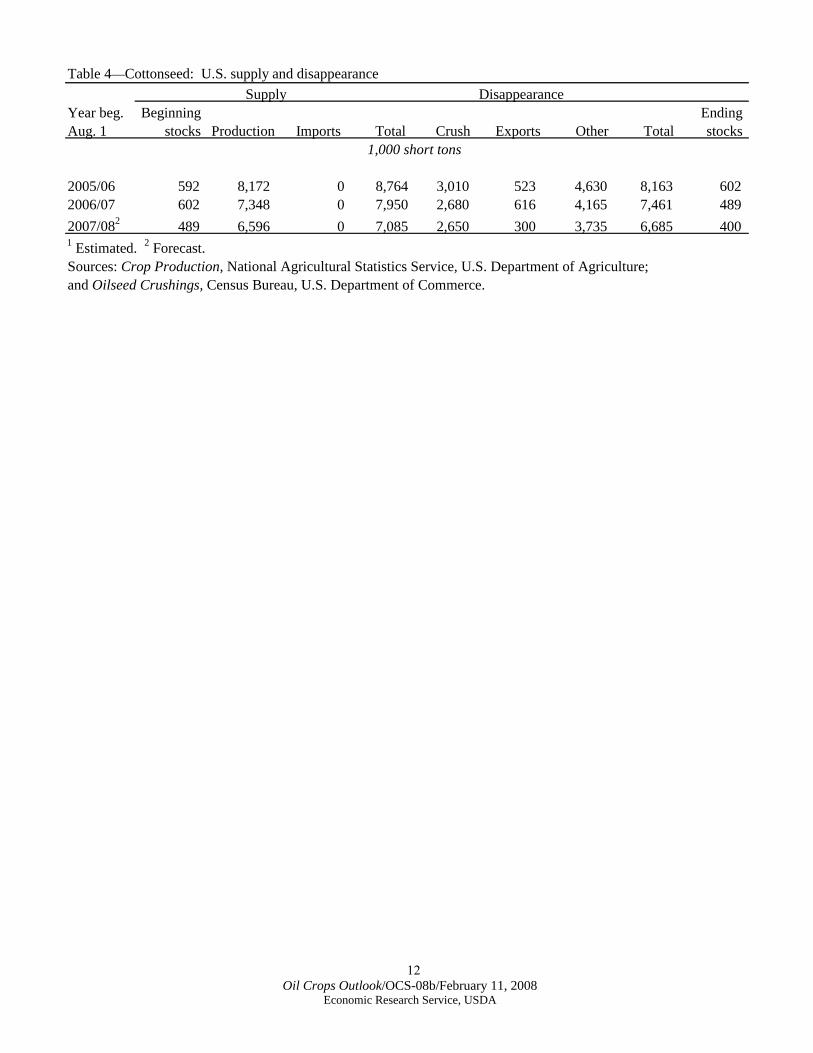
Table 4—Cottonseed: U.S. supply and disappearance Supply Disappearance
Year beg. Beginning Ending Aug. 1 stocks Production Imports Total Crush Exports Other Total stocks
1,000 short tons
2005/06 592 8,172 0 8,764 3,010 523 4,630 8,163 602 2006/07 602 7,348 0 7,950 2,680 616 4,165 7,461 489 2007/082 489 6,596 0 7,085 2,650 300 3,735 6,685 400 1 Estimated. 2 Forecast.Sources: Crop Production, National Agricultural Statistics Service, U.S. Department of Agriculture; and Oilseed Crushings, Census Bureau, U.S. Department of Commerce.

13 Oil Crops Outlook/OCS-08b/February 11, 2008
Economic Research Service, USDA
Table 5—Cottonseed meal: U.S. supply and disappearance Supply Disappearance
Year beg. Beginning Ending Oct. 1 stocks Imports Production Total Domestic Exports Total stocks
1,000 short tons
2005/06 53 0 1,372 1,425 1,225 141 1,366 59 2006/071 59 0 1,241 1,301 1,133 105 1,238 63 2007/082 63 0 1,205 1,268 1,133 85 1,218 50 1 Estimated. 2 Forecast.Source: Oilseed Crushings, Census Bureau, U.S. Department of Commerce.

14 Oil Crops Outlook/OCS-08b/February 11, 2008
Economic Research Service, USDA
Table 6—Cottonseed oil: U.S. supply and disappearance Supply Disappearance
Year beg. Beginning Ending Oct. 1 stocks Imports Production Total Domestic Exports Total stocks
Million pounds
2005/06 76 1 951 1,028 860 67 927 101 2006/071 101 1 849 951 708 138 845 106 2007/082 106 1 835 942 734 118 852 90 1 Estimated. 2 Forecast.Sources: Oilseed Crushings and Production, Consumption, and Stocks, Census Bureau, U.S. Department of Commerce.
15Oil Crops Outlook/OCS-08b/February 11, 2008
Economic Research Service, USDA
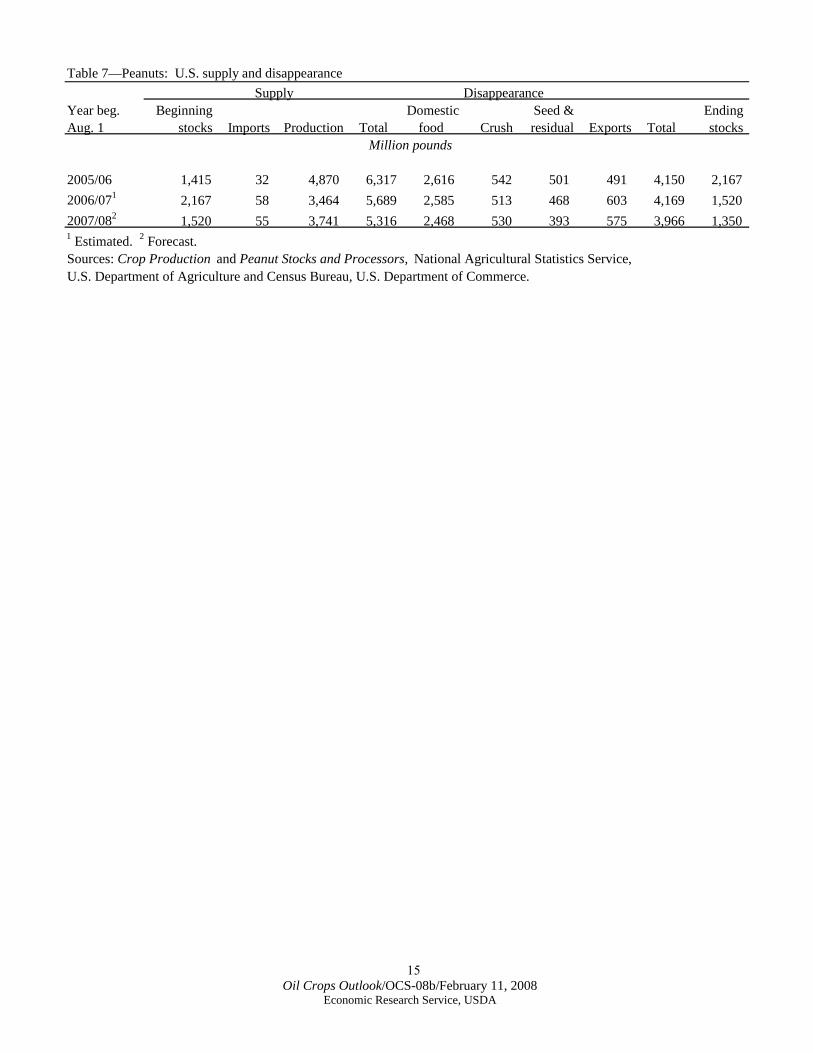
Table 7—Peanuts: U.S. supply and disappearance Supply Disappearance
Year beg. Beginning Domestic Seed & Ending Aug. 1 stocks Imports Production Total food Crush residual Exports Total stocks
Million pounds
2005/06 1,415 32 4,870 6,317 2,616 542 501 491 4,150 2,167 2006/071 2,167 58 3,464 5,689 2,585 513 468 603 4,169 1,520 2007/082 1,520 55 3,741 5,316 2,468 530 393 575 3,966 1,350 1 Estimated. 2 Forecast.Sources: Crop Production and Peanut Stocks and Processors, National Agricultural Statistics Service, U.S. Department of Agriculture and Census Bureau, U.S. Department of Commerce.

16 Oil Crops Outlook/OCS-08b/February 11, 2008
Economic Research Service, USDA
Table 8—Oilseed prices received by U.S. farmersMarketingyear Soybeans Cottonseed Sunflower Canola Peanuts Flaxseed
$/bu. $/ton $/cwt. $/cwt. Cents/lb. $/bu.
1997/98 6.47 121.00 11.60 11.30 28.30 5.81 1998/99 4.93 129.00 10.60 10.30 28.40 5.05 1999/00 4.63 89.00 7.53 7.82 25.40 3.79 2000/01 4.54 105.00 6.89 6.71 27.40 3.30 2001/02 4.38 90.50 9.62 8.77 23.40 4.29 2002/03 5.53 101.00 12.10 10.60 18.20 5.77 2003/04 7.34 117.00 12.10 10.60 19.30 5.88 2004/05 5.74 107.00 13.70 10.70 18.90 8.07 2005/06 5.66 96.00 12.10 9.62 17.30 5.94 2006/07 6.43 111.00 14.50 11.90 17.70 5.80 2007/081 10.00-10.80 145-175 20.60-21.90 17.80-19.10 21.2-22.8 12.55-13.35
2006/07September 5.23 97.00 11.60 NA 17.30 5.46 October 5.52 98.00 12.10 NA 17.20 5.41 November 6.08 113.00 12.50 NA 17.20 5.38 December 6.18 120.00 13.60 NA 17.60 5.73 January 6.37 121.00 13.80 NA 17.80 6.03 February 6.87 130.00 14.90 NA 17.80 6.39 March 6.95 NA 15.60 NA 17.80 6.79 April 6.88 NA 15.90 NA 18.30 6.72 May 7.12 NA 16.60 NA 17.90 7.08 June 7.51 NA 17.00 NA 18.10 7.81 July 7.56 NA 18.40 14.50 18.70 8.14 August 7.72 NA 18.40 14.60 18.00 8.64
2007/08September 8.18 137.00 17.70 15.00 18.60 9.55 October 8.36 153.00 17.80 16.30 21.40 11.60 November 9.41 160.00 18.40 16.60 21.70 12.90 December 10.00 171.00 19.20 17.70 21.30 13.00 January1 11.00 171.00 20.90 20.00 22.00 13.90 1 Preliminary. NA = Not available.Source: Agricultural Prices, National Agricultural Statistics Service, U.S. Department of Agriculture.
17 Oil Crops Outlook/OCS-08b/February 11, 2008
Economic Research Service, USDA
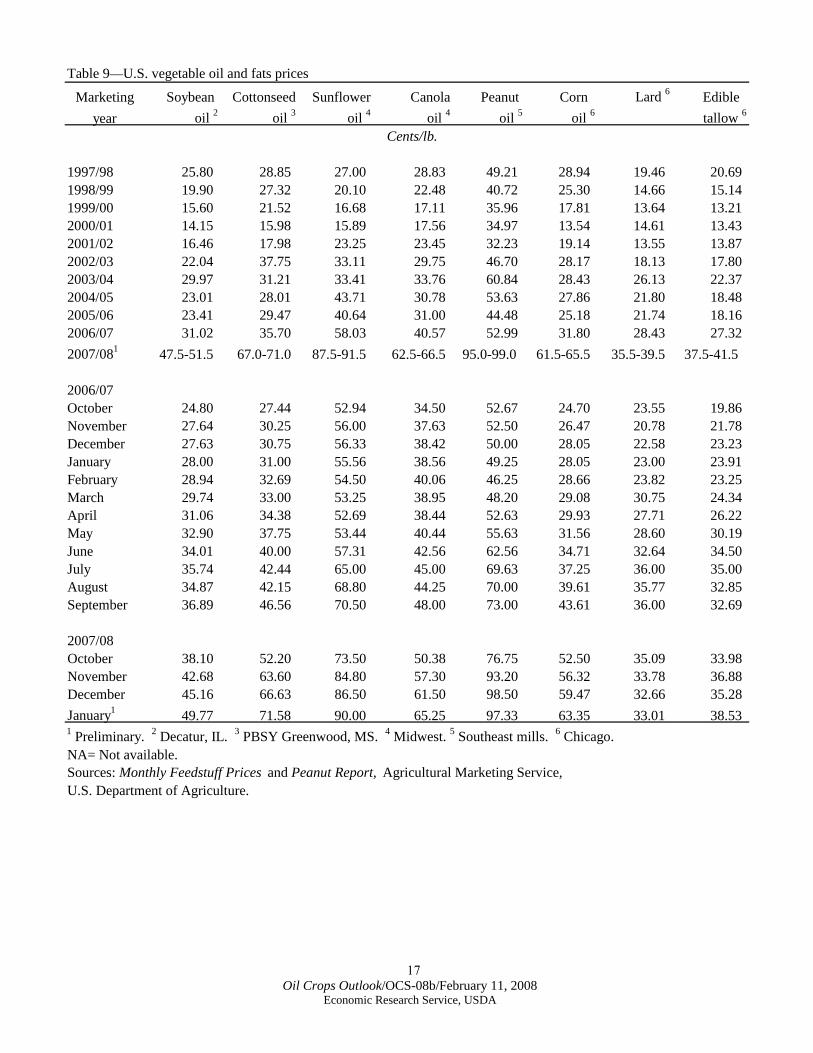
Table 9—U.S. vegetable oil and fats prices
Marketing Soybean Cottonseed Sunflower Canola Peanut Corn Lard 6 Edible year oil 2 oil 3 oil 4 oil 4 oil 5 oil 6 tallow 6
Cents/lb.
1997/98 25.80 28.85 27.00 28.83 49.21 28.94 19.46 20.69 1998/99 19.90 27.32 20.10 22.48 40.72 25.30 14.66 15.14 1999/00 15.60 21.52 16.68 17.11 35.96 17.81 13.64 13.21 2000/01 14.15 15.98 15.89 17.56 34.97 13.54 14.61 13.43 2001/02 16.46 17.98 23.25 23.45 32.23 19.14 13.55 13.87 2002/03 22.04 37.75 33.11 29.75 46.70 28.17 18.13 17.80 2003/04 29.97 31.21 33.41 33.76 60.84 28.43 26.13 22.37 2004/05 23.01 28.01 43.71 30.78 53.63 27.86 21.80 18.48 2005/06 23.41 29.47 40.64 31.00 44.48 25.18 21.74 18.16 2006/07 31.02 35.70 58.03 40.57 52.99 31.80 28.43 27.32 2007/081 47.5-51.5 67.0-71.0 87.5-91.5 62.5-66.5 95.0-99.0 61.5-65.5 35.5-39.5 37.5-41.5
2006/07October 24.80 27.44 52.94 34.50 52.67 24.70 23.55 19.86 November 27.64 30.25 56.00 37.63 52.50 26.47 20.78 21.78 December 27.63 30.75 56.33 38.42 50.00 28.05 22.58 23.23 January 28.00 31.00 55.56 38.56 49.25 28.05 23.00 23.91 February 28.94 32.69 54.50 40.06 46.25 28.66 23.82 23.25 March 29.74 33.00 53.25 38.95 48.20 29.08 30.75 24.34 April 31.06 34.38 52.69 38.44 52.63 29.93 27.71 26.22 May 32.90 37.75 53.44 40.44 55.63 31.56 28.60 30.19 June 34.01 40.00 57.31 42.56 62.56 34.71 32.64 34.50 July 35.74 42.44 65.00 45.00 69.63 37.25 36.00 35.00 August 34.87 42.15 68.80 44.25 70.00 39.61 35.77 32.85 September 36.89 46.56 70.50 48.00 73.00 43.61 36.00 32.69
2007/08October 38.10 52.20 73.50 50.38 76.75 52.50 35.09 33.98 November 42.68 63.60 84.80 57.30 93.20 56.32 33.78 36.88 December 45.16 66.63 86.50 61.50 98.50 59.47 32.66 35.28 January1 49.77 71.58 90.00 65.25 97.33 63.35 33.01 38.53 1 Preliminary. 2 Decatur, IL. 3 PBSY Greenwood, MS. 4 Midwest. 5 Southeast mills. 6 Chicago.NA= Not available.Sources: Monthly Feedstuff Prices and Peanut Report, Agricultural Marketing Service, U.S. Department of Agriculture.
18 Oil Crops Outlook/OCS-08b/February 11, 2008
Economic Research Service, USDA
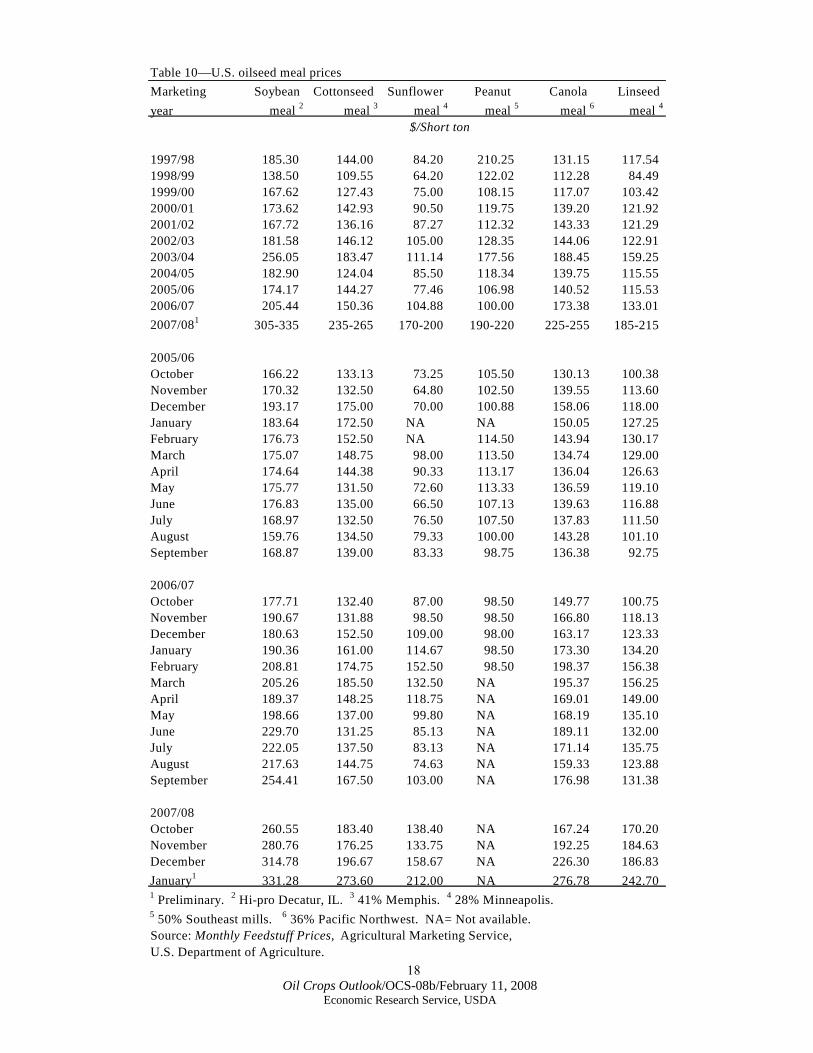
Table 10—U.S. oilseed meal prices Marketing Soybean Cottonseed Sunflower Peanut Canola Linseed year meal 2 meal 3 meal 4 meal 5 meal 6 meal 4
$/Short ton
1997/98 185.30 144.00 84.20 210.25 131.15 117.54 1998/99 138.50 109.55 64.20 122.02 112.28 84.49 1999/00 167.62 127.43 75.00 108.15 117.07 103.42 2000/01 173.62 142.93 90.50 119.75 139.20 121.92 2001/02 167.72 136.16 87.27 112.32 143.33 121.29 2002/03 181.58 146.12 105.00 128.35 144.06 122.91 2003/04 256.05 183.47 111.14 177.56 188.45 159.25 2004/05 182.90 124.04 85.50 118.34 139.75 115.55 2005/06 174.17 144.27 77.46 106.98 140.52 115.53 2006/07 205.44 150.36 104.88 100.00 173.38 133.01 2007/081 305-335 235-265 170-200 190-220 225-255 185-215
2005/06October 166.22 133.13 73.25 105.50 130.13 100.38 November 170.32 132.50 64.80 102.50 139.55 113.60 December 193.17 175.00 70.00 100.88 158.06 118.00 January 183.64 172.50 NA NA 150.05 127.25 February 176.73 152.50 NA 114.50 143.94 130.17 March 175.07 148.75 98.00 113.50 134.74 129.00 April 174.64 144.38 90.33 113.17 136.04 126.63 May 175.77 131.50 72.60 113.33 136.59 119.10 June 176.83 135.00 66.50 107.13 139.63 116.88 July 168.97 132.50 76.50 107.50 137.83 111.50 August 159.76 134.50 79.33 100.00 143.28 101.10 September 168.87 139.00 83.33 98.75 136.38 92.75
2006/07October 177.71 132.40 87.00 98.50 149.77 100.75 November 190.67 131.88 98.50 98.50 166.80 118.13 December 180.63 152.50 109.00 98.00 163.17 123.33 January 190.36 161.00 114.67 98.50 173.30 134.20 February 208.81 174.75 152.50 98.50 198.37 156.38 March 205.26 185.50 132.50 NA 195.37 156.25 April 189.37 148.25 118.75 NA 169.01 149.00 May 198.66 137.00 99.80 NA 168.19 135.10 June 229.70 131.25 85.13 NA 189.11 132.00 July 222.05 137.50 83.13 NA 171.14 135.75 August 217.63 144.75 74.63 NA 159.33 123.88 September 254.41 167.50 103.00 NA 176.98 131.38
2007/08October 260.55 183.40 138.40 NA 167.24 170.20 November 280.76 176.25 133.75 NA 192.25 184.63 December 314.78 196.67 158.67 NA 226.30 186.83 January1 331.28 273.60 212.00 NA 276.78 242.701 Preliminary. 2 Hi-pro Decatur, IL. 3 41% Memphis. 4 28% Minneapolis.5 50% Southeast mills. 6 36% Pacific Northwest. NA= Not available.Source: Monthly Feedstuff Prices, Agricultural Marketing Service, U.S. Department of Agriculture.