Embed Size (px)
Citation preview

Nasdaq 3Q21Quarterly UpdateOctober 20, 2021

2
Disclaimers
Non-GAAP Information
In addition to disclosing results determined in accordance with U.S. GAAP, Nasdaq also discloses certain non-GAAP results of operations, including, but not limited to, non-GAAP net income attributable to Nasdaq, non-GAAP diluted earnings per share, non-GAAP operating income, non-GAAP operating expenses, and non-GAAP EBITDA, that include certain adjustments or exclude certain charges and gains that are described in the reconciliation table of U.S. GAAP to non-GAAP information provided at ir.nasdaq.com/Income-Statement-Trend-Summary-and-GAAP-to-Non-GAAP-Reconciliation. Management uses this non-GAAP information internally, along with U.S. GAAP information, in evaluating our performance and in making financial and operational decisions. We believe our presentation of these measures provides investors with greater transparency and supplemental data relating to our financial condition and results of operations. In addition, we believe the presentation of these measures is useful to investors for period-to-period comparisons of results as certain items do not reflect ongoing operating performance.
These measures are not in accordance with, or an alternative to, U.S. GAAP, and may be different from non-GAAP measures used by other companies. In addition, other companies, including companies in our industry, may calculate such measures differently, which reduces their usefulness as a comparative measure. Investors should not rely on any single financial measure when evaluating our business. This information should be considered as supplemental in nature and is not meant as a substitute for our operating results in accordance with U.S. GAAP. We recommend investors review the U.S. GAAP financial measures included in this presentation. When viewed in conjunction with our U.S. GAAP results and the accompanying reconciliations, we believe these non-GAAP measures provide greater transparency and a more complete understanding of factors affecting our business than U.S. GAAP measures alone.
We understand that analysts and investors regularly rely on non-GAAP financial measures, such as those noted above, to assess operating performance. We use these measures because they highlight trends more clearly in our business that may not otherwise be apparent when relying solely on U.S. GAAP financial measures, since these measures eliminate from our results specific financial items that have less bearing on our ongoing operating performance.
Organic revenue growth, organic change and organic impact are non-GAAP measures that reflect adjustments for: (i) the impact of period-over-period changes in foreign currency exchange rates, and (ii) the revenues, expenses and operating income associated with acquisitions and divestitures for the twelve month period following the date of the acquisition or divestiture. Reconciliations of these measures can be found in the appendix to this presentation.
Foreign exchange impact: In countries with currencies other than the U.S. dollar, revenues and expenses are translated using monthly average exchange rates. Certain discussions in this presentation isolate the impact of year-over-year foreign currency fluctuations to better measure the comparability of operating results between periods. Operating results excluding the impact of foreign currency fluctuations are calculated by translating the current period’s results by the prior period’s exchange rates.

3
Cautionary Note Regarding Forward-Looking Statements
Information set forth in this communication contains forward-looking statements that involve a number of risks and uncertainties. Nasdaq cautions readers that any forward-looking information is not a guarantee of future performance and that actual results could differ materially from those contained in the forward-looking information. Such forward-looking statements include, but are not limited to (i) projections relating to our future financial results, total shareholder returns, growth, trading volumes, products and services, ability to transition to new business models, taxes and achievement of synergy targets, (ii) statements about the closing or implementation dates and benefits of certain acquisitions, divestitures and other strategic, restructuring, technology, de-leveraging and capital allocation initiatives, (iii) statements about our integrations of our recent acquisitions, (iv) statements relating to any litigation or regulatory or government investigation or action to which we are or could become a party, and (v) other statements that are not historical facts. Forward-looking statements involve a number of risks, uncertainties or other factors beyond Nasdaq’s control. These factors include, but are not limited to, Nasdaq’s ability to implement its strategic initiatives, economic, political and market conditions and fluctuations, government and industry regulation, interest rate risk, U.S. and global competition, the impact of the COVID-19 pandemic on our business, operations, results of operations, financial condition, workforce or the operations or decisions of our customers, suppliers or business partners, and other factors detailed in Nasdaq’s filings with the U.S. Securities and Exchange Commission, including its annual reports on Form 10-K and quarterly reports on Form 10-Q which are available on Nasdaq’s investor relations website at http://ir.nasdaq.com and the SEC’s website at www.sec.gov. Nasdaq undertakes no obligation to publicly update any forward-looking statement, whether as a result of new information, future events or otherwise.
Website Disclosure
Nasdaq intends to use its website, ir.nasdaq.com, as a means for disclosing material non-public information and for complying with SEC Regulation FD and other disclosure obligations.
Disclaimers

4
“We're making continued progress on becoming the premier platform and ecosystem for the global capital markets and beyond with leading technology, insights and markets expertise.”Adena Friedman, President & CEO, Nasdaq
Strategic Update

Strong growth in 3Q21, Continued Progress Advancing Strategy
5
(Year over year % change)
Annualized Recurring Revenues (ARR)* +19%$1,834M
Solutions Segments* Revenue +19%$541M
Solutions Segments Organic Revenue Growth +13%$59M
Net Revenues* +17%$838M
Non-GAAP Diluted EPS +16%$1.78
• Our evolution is continuing in 2021: SaaS revenues increased to 34% of ARR
• Success in our foundational listings business has created "flywheel effects" driving higher growth in trading and other businesses.
• The current capital markets and macro backdrop remains largely conducive to Nasdaq's execution
• Expense guidance narrowed to the high end of previously communicated range, driven by strong revenue growth
• Clear recent progress towards realizing our unique ESG potential
• Key secular growth areas we've positioned ourselves to serve remain very large: Anti Financial Crime, Index and Analytics
For all non-GAAP information throughout this presentation, the U.S. GAAP to non-GAAP reconciliations may be found at ir.nasdaq.com/Income-Statement-Trend-Summary-and-GAAP-to-Non-GAAP-Reconciliation. Reconciliations of organic revenue growth can be found in the appendix to this presentation. Organic revenue growth is considered a non-GAAP metric.* For all defined terms, refer to the appendix to this presentation.

6
Executing our Strategy to Broaden Opportunity & Accelerate Progress
◦ Acquisition of Verafin, creating a new Anti-Financial Crime technology leader
◦ Divested our U.S. Fixed Income business
Pillars of Strategy
Re-allocating capital to better support opportunities as a technology and analytics provider
Critical 2021 Developments and Data Points
◦ Introduced Nasdaq Data Link, bringing SaaS and API delivery to proprietary, 3rd party, and customer insights
◦ Annualized SaaS revenues of $620 million in 3Q21 increased 42% YoY
◦ 22% year over year increase in global corporate issuer base2
◦ 668 Nasdaq-listed IPOs year to date◦ Investments in Puro.Earth and Level ATS add
new capabilities to address key client needs
◦ Anti Financial Crime Technology 58% of Market Technology 3Q21 revenues (vs. 36% in FY20)
◦ Index and Analytics total 63% of Investment Intelligence 3Q21 revenues (vs. 56% in FY20)
Implementing our vision of a SaaS-enabled technology provider
Accelerate performance of growth platforms
Amplifying the most distinctive aspects of our marketplace and corporate foundational businesses
42% YoYSaaS Revenue Increase1
$620MSaaS revenues 3Q21 annualized1
1 Includes the impact of the acquisition of Verafin2 Number of corporate issuers includes SPACs, excludes ETPs

Progress on Key Metrics Confirm our Confidence in our Strategy
7
SaaS as % of ARR
4% 4%
9%8%
10%
15%
2016 2017 2018 2019 2020 2021 YTD
Solutions Segments Organic Revenue Growth
3-5 Year Outlook:
6-9% CAGR2025 Objective:
40%-50%
21%
28%
34%
4Q16 4Q20 3Q21

Increased demand for SaaS scalability and flexibility
Increasing demand for Anti-Financial Crime Technology
Today's Environment Generally Supportive of Near-term ExecutionHow our business environment impacts our ability to meet client needs and address challenges of our clients
8
Institutional Investors & Asset Owners
Corporate Issuers
Exchanges and other Market Operators
Banks & Broker Dealers
Long-term Secular Dynamics
Cyclical & External Factors
Adoption of direct listings and SPACs complements traditional IPO to broaden avenues to public ownership
Demand for ESG solutions increasing broadly
Many recent IPOs are future IR & ESG opportunities
Operating company IPO pipeline is healthy
Increased outsourcing of technology not critical to competitive differentiation
Increasing needs for technology solutions to more effectively stop financial crime
Market Infrastructure Technology sales cycle and implementation remains impacted by the pandemic
Market volumes moderating from recent peaks, still active
8
Digitalization of investment processes drives increased demand for analytics
Increases in passive and thematic investing
Industry AUM dynamics continue to provide tailwind

Continue to Be Well Positioned Against Sizeable, Growing Opportunities
9
Market Technology• Verafin Fraud & AML (FRAML)• Nasdaq Surveillance• Nasdaq Financial Framework
$26B TAM1
$9.5B SAM1
$437M LTM'21
Revenues
$19B TAM1
$7B SAM1
$195M LTM'21
Revenues
$3B TAM1
$1.6B SAM1
$425M LTM'21
Revenues
Analytics• eVestment2
• Nasdaq Data Link• Nasdaq Fund Network
Index• Nasdaq-100• Thematics• SmartBeta
$7B TAM1
$1.5B SAM1
$225M LTM'21
Revenues
IR & ESG Services• IR Insight & Advisory Services• Boardvantage• ESG Advisory, OneReport
~22xOpportunity: SAM relative to LTM'21 Revenues
~36x ~4x ~7x1 Total addressable market (TAM) based on consulting reports, including from Oliver Wyman, TABB, Chartis, Forestar and Nasdaq analysis. Serviceable addressable market (SAM) is based on internal estimates reflecting market opportunity relative to total addressable market. Refer to slide 31 for further details. 2 eVestment includes Solovis and the combined eVestment/Solovis offerings of Nasdaq Asset Owner Solutions.

10
“The third quarter 2021 revenue and profit growth was broad-based, and reflects increased investments to both unlock new opportunities and sustain our focus in our foundational markets and listings businesses.”Ann Dennison, Executive Vice President and Chief Financial Officer, Nasdaq
Business and Financial Update

11
3Q21 Financial Performance Summary
(US$ millions, except per share) 3Q21 3Q20 % Δ
Net Revenues $838 $715 17%
Organic 13%
Operating Expenses $397 $346 15%
Organic 8%
Operating Income $441 $369 20%
Operating Margin 53% 52%
Income Before Income Taxes $409 $345 19%
Net Income $303 $256 18%
Diluted EPS 1 $1.78 $1.53 16%
Dividend Per Share $0.54 $0.49 10%
Driving Accelerating Growth, Creating Sustainable Value
Solutions Segments Organic Revenue Growth
Growth in ARR
to $1.8 billion
+13%Market Services Organic Revenue Growth
Capital Return to Shareholders in 2021 YTD, including $885 million in share repurchases
+14%+19%
Growth in Annualized SaaS Revenues to $620 million+42%
$1.1B
Non-GAAP Financial Results
1 Diluted EPS reflects weighted average diluted shares outstanding of 170.2 million in 3Q21 and 167.5 million in 3Q20.

12
1,538 1,5771,760 1,804 1,834
3Q20 4Q20 1Q21 2Q21 3Q21
436 448
584 604 620
3Q20 4Q20 1Q21 2Q21 3Q21
Recurring Revenue KPIs Reflect Organic Growth and Verafin Impact
+19% YoY
Annualized SaaS Revenues ($Ms)
+42% YoY
Annualized Recurring Revenue ($Ms)
Note: Beginning in 1Q21, both ARR and annualized SaaS revenues include the impact of Verafin.

Market TechnologyQuarter over Quarter Comparison
(US$ millions) 3Q21 3Q20 % Δ
Anti Financial Crime Technology $66 $32 106%
Market Infrastructure Technology $48 $54 (11)%
Total Revenues $114 $86 33%
Organic revenue growth (1)%
Operating income $10 $9 11%
Operating margin 9% 10%
Annualized SaaS revenues $276 $120 130%
ARR $428 $278 54%
Market Technology ARR growth
+54%Market Technology
revenues from SaaS1
57% +16%Anti Financial Crime revenue growth YoY
ex Verafin
67%
86%97%
SaaS%NewCustomers
2019 2020 LTM'21
Customer Conviction Driving Continued Shift to SaaS Solutions
Note: Last 12 months includes the impact of Verafin since the close of the acquisition.1 Excludes the impact of the purchase price adjustment on deferred revenue related to Verafin.
● Anti Financial Crime Technology: Revenues increased primarily due to the inclusion of revenues from our acquisition of Verafin and continued growth in surveillance solutions. The temporary purchase price adjustment on deferred revenue related to the Verafin acquisition had a negative impact of $7 million in the period.
● Market Infrastructure Technology: Revenues decreased primarily due to the successful completion of a significant long-term contract, and lower professional services revenue reflecting both elevated prior year comparisons period as well as capacity constraints that pandemic-related logistical challenges have imposed on installation and change request projects.
3Q21 Financial Highlights
13
1224
140
NewLogoClientsChoosingSaaS
2019 2020 LTM'21

14
Investment Intelligence
● Market Data: Revenues decreased primarily due to a decline in U.S. tape revenues, partially offset by an increase in proprietary data revenues driven by an 11% increase in ARR, excluding NFI.
● Index: Revenues increased primarily due to higher AUM in exchange traded products linked to Nasdaq indexes and revenues related to futures trading linked to the Nasdaq-100 Index.
● Analytics: Revenues increased primarily due to growth in our eVestment platform driven by new sales, strong retention, and higher average revenue per client from expanded offerings.
3Q21 Financial Highlights
Quarter over Quarter Comparison
(US$ millions) 3Q21 3Q20 % Δ
Market Data $102 $105 (3)%
Index $119 $86 38%
Analytics $51 $45 13%
Total Revenues $272 $236 15%
Organic revenue growth 15%
Operating income $177 $153 16%
Operating margin(1) 65% 65%
Annualized SaaS revenues $200 $176 14%
ARR $555 $507 9%
14
Growth in AUM in ETPs benchmarked to Nasdaq's indexes
YoY revenue Growth in Analytics
Organic YoY revenue growth in Investment
Intelligence
+15% +13% +15%
3Q20 Net impact ofswitches
Net inflows /(outflows)
Netappreciation /(depreciation)
3Q21
$361
$53$(92)$313
$87
(1) The Investment Intelligence operating margin reflects the allocation of certain costs that support the operation of various aspects of Nasdaq’s business, including Market Services, to units other than Investment Intelligence.
Change in Period End ETP AUM ($B) Reflects Switches Which Entail Minimal Revenue Impact

Corporate Platforms (US$ millions) 3Q21 3Q20 % Δ
Listing Services $99 $78 27%
IR & ESG Services $56 $53 6%
Total Revenues $155 $131 18%
Organic revenue growth 18%
Operating income $65 $51 27%
Operating margin 42% 39%
Annualized SaaS revenues $144 $140 3%
ARR $529 $453 17%
● Listing Services: Revenues increased primarily due to higher U.S. listing revenues reflecting primarily an increase in the overall number of listed companies.
● IR & ESG Services: Revenues increased as a result of increased sales and higher retention rates. Growth in revenues reflect an increase in the number of corporate issuer clients as well as higher adoption across the breadth of investor relations and newer ESG advisory and reporting offerings.
● The operating margin of 42% increased three percentage points compared to the prior year period and was driven by the continued increase in the listed issuer base.
3Q21 Financial Highlights
IPO win rate. Nasdaq led U.S.
exchanges for IPOs with 147 IPOs that raised $29 billion
Increase in IR & ESG Services revenue
reflecting strong demand for IR & ESG product
offerings
Organic YoY revenue growth
75% +6% +18%
Quarter over Quarter Comparison
3,8894,051
4,3474,550
4,732
3Q20 4Q20 1Q21 2Q21 3Q21
15
22% Growth in Nasdaq-listed Corporate Issuers1 vs. Prior Year
1 Number of issuers reflects U.S. and European corporates, including SPACs but excluding ETPs

● Equity Derivative Trading and Clearing: Revenues increased primarily due to higher U.S. industry trading volumes, higher U.S. capture rates, partially offset by lower U.S. market share.
● Cash Equity Trading: Revenues increased primarily due to higher U.S. net capture rates, higher European value traded, partially offset by lower U.S. market share.
● Fixed Income and Commodities Trading and Clearing: Revenues increased primarily due to the impact of higher European product revenues.
● Trade Management Services: Revenues increased primarily due to increased demand for connectivity services.
16
Market Services (US$ millions) 3Q21 3Q20 % Δ
Equity Derivatives Trading and Clearing $105 $84 25%
Cash Equity Trading $96 $85 13%
Fixed Income and Commodities Trading and Clearing $13 $12 8%
Trade Management Services $81 $75 8%
Total Revenues $295 $256 15%
Operating income $187 $154 21%
Operating margin 63% 60%
ARR $322 $300 7%
% of Cash Equities net revenues from Nasdaq-
listed companies
Organic YoY revenue growth
~80%Increase in Equity
Derivatives Trading & Clearing net revenues
+25%
3Q21 Financial Highlights
+14%
$256
$288
$334$308
$295
$75 $77 $79 $81 $81
$181$211
$255$227 $214
Trading and Clearing Trade Management Services
3Q20 4Q20 1Q21 2Q21 3Q21
Quarterly Net Revenue Reflects Expansion of Both Trading and Recurring Sources vs. Prior Year
Quarter over Quarter Comparison

17
(US$ millions)
Total Non-GAAP operating expenses3Q21 3Q20 % Δ
Compensation and benefits $230 $198 16%
Professional and contract services $33 $35 (6)%
Computer operations and data communications $47 $39 21%
Occupancy $27 $24 13%
General, administrative and other $13 $11 18%
Marketing and advertising $12 $7 71%
Depreciation and amortization $27 $24 13%
Regulatory $8 $8 —%
Total non-GAAP operating expenses $397 $346 15%
Organic non-GAAP operating expense 8%
Supporting Growth with Appropriate Resources
Non-GAAP operating expense guidance reflecting the impact of strong and broad-based organic revenue growth on variable expenses
$1.605B-$1.620B
Quarter over Quarter Comparison
3Q21 non-GAAP operating expenses increased $51 million, or 15%, to $397 million. The increase reflects a $26 million, or 8%, organic increase, a $25 million increase from the impact of acquisitions, and a $4 million increase from the impact of changes in FX rates due to a weaker U.S. dollar, partially offset by a $4 million decrease from the impact of divestitures.
Of the $26 million, or 8%, organic increase:• $14 million, or 7%, increase in compensation expense, driven primarily by increased
headcount, as well as the impact of higher variable compensation • $5 million, or 71%, increase in marketing and advertising expense, largely driven by the
higher level of new listing activity in the period• $3 million, or 8%, increase in computer operations and data communications expense,
driven by higher data costs and actions to increase capacity in our marketplaces.
25.0%-27.0%Non-GAAP Tax Rate(1)
2021 Guidance Update
(1) U.S. GAAP operating expense and tax rate guidance are not provided due to the inherent difficulty in quantifying certain amounts due to a variety of factors including the unpredictability in the movement in foreign currency rates, as well as future charges or reversals outside of the normal course of business.
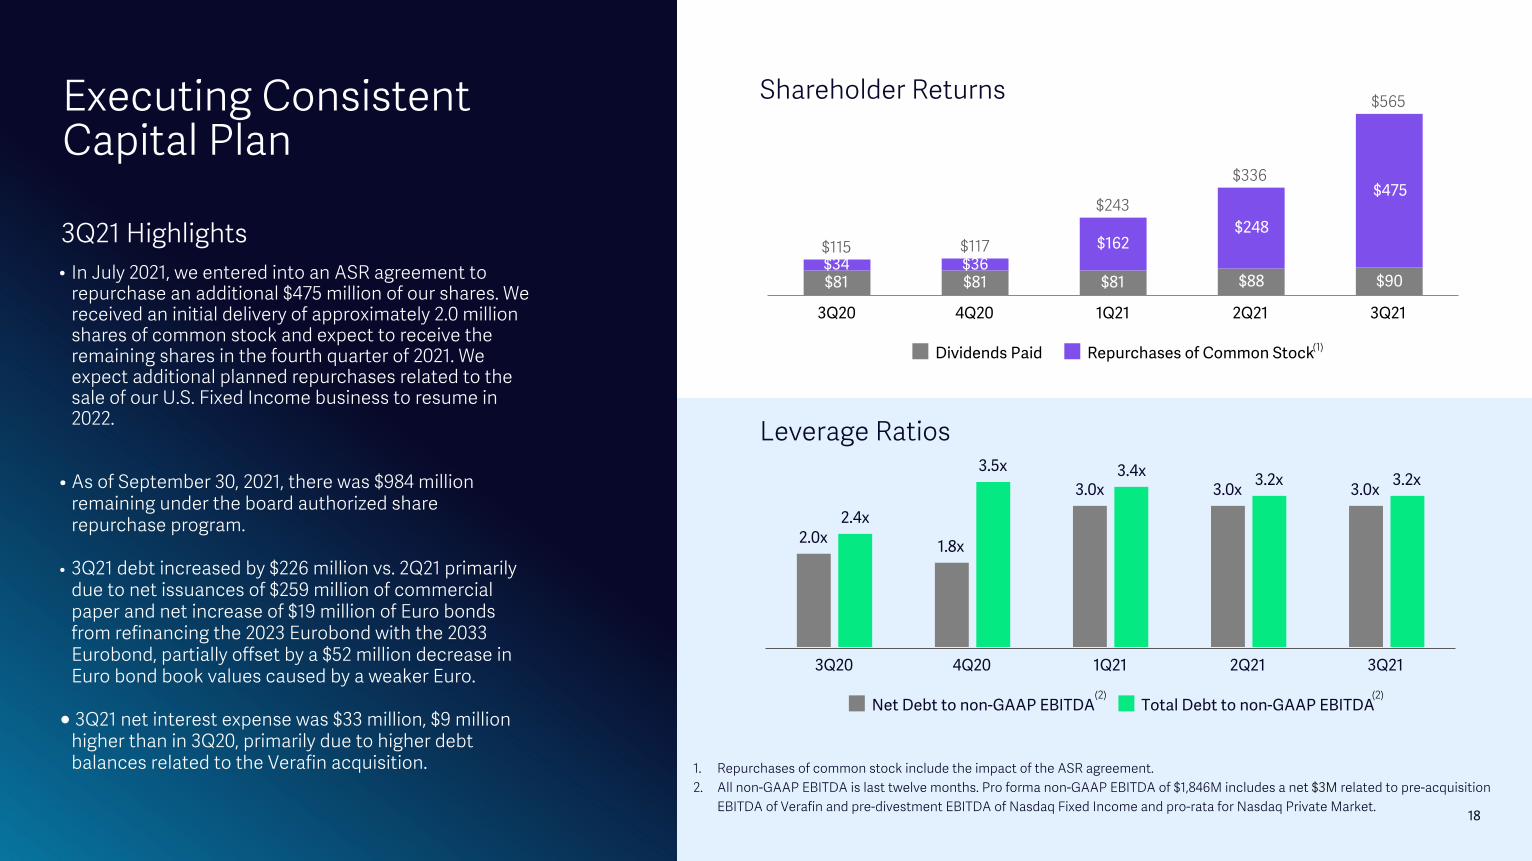
Executing Consistent Capital Plan
• In July 2021, we entered into an ASR agreement to repurchase an additional $475 million of our shares. We received an initial delivery of approximately 2.0 million shares of common stock and expect to receive the remaining shares in the fourth quarter of 2021. We expect additional planned repurchases related to the sale of our U.S. Fixed Income business to resume in 2022.
• As of September 30, 2021, there was $984 million remaining under the board authorized share repurchase program.
• 3Q21 debt increased by $226 million vs. 2Q21 primarily due to net issuances of $259 million of commercial paper and net increase of $19 million of Euro bonds from refinancing the 2023 Eurobond with the 2033 Eurobond, partially offset by a $52 million decrease in Euro bond book values caused by a weaker Euro.
● 3Q21 net interest expense was $33 million, $9 million higher than in 3Q20, primarily due to higher debt balances related to the Verafin acquisition.
3Q21 Highlights
Leverage Ratios
1. Repurchases of common stock include the impact of the ASR agreement.2. All non-GAAP EBITDA is last twelve months. Pro forma non-GAAP EBITDA of $1,846M includes a net $3M related to pre-acquisition
EBITDA of Verafin and pre-divestment EBITDA of Nasdaq Fixed Income and pro-rata for Nasdaq Private Market.
$115 $117
$243
$336
$565
$81 $81 $81 $88 $90$34 $36
$162$248
$475
Dividends Paid Repurchases of Common Stock
3Q20 4Q20 1Q21 2Q21 3Q21
Shareholder Returns
2.0x 1.8x
3.0x 3.0x 3.0x
2.4x
3.5x 3.4x 3.2x 3.2x
Net Debt to non-GAAP EBITDA Total Debt to non-GAAP EBITDA
3Q20 4Q20 1Q21 2Q21 3Q21
18
(2)(2)
(1)

Recent Developments
• SEC approved Nasdaq’s Board Diversity Transparency rule
• Published 2020 sustainability report, with increased disclosure across Environmental, Social and Governance pillars. Published our first Task Force on Climate-Related Financial Disclosures report
• Acquired majority position in Puro.Earth, a provider of carbon removal solutions
• In September, received improved Sustainalytics risk rating score of 11.7 "Low Risk"; top 3rd percentile among global issuers
• Began reporting diversity statistics on Nasdaq’s employee population
• Received improved Sustainalytics risk rating score of 15.1 – “Low Risk”; top 7th percentile of global issuers
• Upgraded by MSCI ESG ratings to BBB (from BB)
• ISS Governance QualityScore 1 (1st decile)
YTD 2021
2020
19

20
Strong growth in 3Q21, Continued Progress Advancing Strategy
• Strong Revenue and ARR growth reflect the high potential of a repositioned Nasdaq
• Success in our foundational listings business has created "flywheel effects" driving higher growth in trading and other businesses.
• Our evolution continuing in 2021: Acquisition of Verafin closed, investments in Puro.earth & Level ATS, sale of NFI*
• The current capital markets and macro backdrop remains largely conducive to Nasdaq's execution
• Expense guidance narrowed to the high end of initial range, driven by strong revenue growth
• Clear recent progress towards realizing our unique ESG opportunities and potential
• Key secular growth areas we've positioned ourselves to serve remain very large
Recap:

Appendix

22
Debt Overview
(US$ millions) 9/30/2021 6/30/2021 Maturity Date
Commercial Paper $480 $221 NA
0.445% Notes $598 $598 Dec 2022
1.75% Euro Notes $— $709 May 2023
4.25% Notes $498 $498 Jun 2024
Revolver (Libor + 105 bps) (1) $(4) $(4) Dec 2025
3.85% Notes $498 $497 Jun 2026
1.75% Euro Notes $689 $705 Mar 2029
0.875% Euro Notes $689 $705 Feb 2030
1.65% Notes $643 $643 Jan 2031
0.90% Euro Notes $707 $— Jul 2033
2.50% Notes $643 $643 Dec 2040
3.25% Notes $486 $486 Apr 2050
Total Debt Obligations $5,927 $5,701
Less Cash and Cash Equivalents (2) $(303) $(390)
Net Debt $5,624 $5,311
$5.6B Net DebtWell Laddered Debt Maturities
(US$
mill
ions
)
2021 2022 2023 2024 2025 2026 ... 2029 2030 2031 2032 2033 ... 2040 ... 20500
100
200
300
400
500
600
700
800
1. Includes debt issuance costs of $4M at 9/30/2021 and $4M at 6/30/2021. 2. Excludes $29M of restricted cash at 9/30/2021 and $40M at 6/30/2021.

231. Net of change in Section 31 fees receivables of $(10)M in 2018; $9M in 2019; $35M in 2020; $(66)M in 2021 YTD; and $(32)M in 2018-2021 YTD.
Free Cash Flow Calculation (US$ millions) 2018 2019 2020 2021 YTD 2018 - 2021 YTD
Cash flow from operations $1,028 $963 $1,252 $699 $3,942
Capital expenditure (111) (127) (188) (113) (539)
Free cash flow $917 $836 $1,064 $586 $3,403
Verafin structuring items — — — 323 323
Section 31 fees, net(1) 9 (14) (57) 144 82
Free cash flow ex. Section 31 and Verafin structuring items $926 $822 $1,007 $1,053 $3,808
Uses of cash flow
Share repurchases $394 $200 $222 $410 $1,226
Cash paid for ASR agreement — — — 475 475
Net repayment/(borrowing) of debt 320 430 (1,912) (469) (1,631)
Acquisitions, net of dispositions and other (380) 63 157 2,240 2,080
Verafin structuring items — — — 323 323
Dividends paid 280 305 320 260 1,165
Total uses of cash flow $614 $998 $(1,213) $3,239 $3,638
Historical Cash Flow / Uses of Cash Flow
• 2021 YTD free cash flow excluding Section 31 fees and Verafin structuring items totaled $1,053 million, an increase of 35% versus the comparable prior year period.
• 2021 YTD free cash flow includes the impact of Verafin related tax and structuring items, described below:
• The Verafin purchase price of $2.75B reflected certain amounts that were paid post close due to tax and other structuring items. These included a tax payment of $221M and a purchase price holdback escrow of $102M.
• The cash outflow for the tax liability is offset within Acquisitions of businesses, net of cash and cash equivalents acquired within investing activities, leading to no impact on the total change in cash and cash equivalents and restricted cash and cash equivalents for the 9 months ended September 30, 2021.

24
Total Variance Net Impacts: 3Q21
Total Variance Organic Impact Acq. & Div. Impact1 FX Impact
All figures in US$ Millions 3Q21 3Q20 $M % $M % $M % $M %
Market Technology $114 $86 $28 33 % ($1) (1) % $29 34 % $— — %
Investment Intelligence 272 236 36 15 % 36 15 % — — % — — %
Corporate Platforms 155 131 24 18 % 24 18 % — — % — — %
Market Services 295 256 39 15 % 37 14 % — — % 2 1 %
Other 2 6 (4) (67) % — — % (4) (67) % — — %
Total Solutions Segments Revenue 541 453 88 19 % 59 13 % 29 6 % — — %
Total Revenue less transaction-based expenses 838 715 123 17 % 96 13 % 25 3 % 2 — %
Non-GAAP Operating Expenses 397 346 51 15 % 26 8 % 21 6 % 4 1 %
Non-GAAP Operating Income 441 369 72 20 % 70 19 % 4 1 % (2) (1) %
Non-GAAP Operating Margin 53 % 52 % — — — — — — — —
Note: The sum of the percentage changes may not tie to the percent change in total variance due to rounding.1 Reflects the impact of the Verafin acquisition as well as the Bwise, NFI and NPM divestitures.

25
Market Technology and Market Services Additional Detail
(US$ in Millions) 3Q20 4Q20 1Q21 2Q21 3Q21
Market Technology Order Intake1 84 37 41 119 76
U.S. equity options 76 82 96 95 96
European options and futures 8 10 10 8 9
Equity Derivatives Net Revenues $84 $92 $106 $103 $105
U.S. cash equities 54 70 90 73 61
European cash equities 28 32 38 34 32
Other 3 3 5 3 3
Cash Equity Trading Net Revenues $85 $105 $133 $110 $96
Fixed income products 3 3 6 4 4
Energy and carbon products 6 8 7 6 6
Other fees and revenues 3 3 3 4 3
Fixed Income and Commodities Trading and Clearing Net Revenues $12 $14 $16 $14 $13
1 Order intake is the total contract value of orders signed during the period, excluding Verafin.

2626
2Q21 1Q21 FY 2020
As reported Adjustment Recasted Results As reported Adjustment Recasted Results As reported Adjustment Recasted
ResultsMarket Technology Revenues 117 — 117 100 — 100 357 — 357
Expense 100 — 100 102 — 102 325 — 325
Operating income 17 — 17 (2) — (2) 32 — 32
Investment Intelligence (1) Revenues 263 (2) 261 258 (2) 256 908 (10) 898
Expense 93 (1) 92 91 (1) 90 328 (2) 326
Operating income 170 (1) 169 167 (1) 166 580 (8) 572
Corporate Platforms (2) Revenues 154 (5) 149 155 (9) 146 530 (9) 521
Expense 89 (2) 87 90 (2) 88 340 (6) 334
Operating income 65 (3) 62 65 (7) 58 190 (3) 187
Market Services (1) Net Revenues 312 (4) 308 338 (4) 334 1,108 (12) 1,096
Expense 110 (2) 108 110 (2) 108 421 (10) 411
Operating income 202 (2) 200 228 (2) 226 687 (2) 685
Corporate Items (1,2) Revenues — 11 11 — 15 15 — 31 31
Expense — 5 5 — 5 5 — 18 18
Operating income — 6 6 — 10 10 — 13 13
Total Company Net revenue 846 — 846 851 — 851 2,903 — 2,903
Total expense 392 — 392 393 — 393 1,414 — 1,414Non-GAAP operating income 454 — 454 458 — 458 1,489 — 1,489
Operating margin 54% —% 54% 54% —% 54% 51% —% 51%
1. Reclassified quarterly non-GAAP results reflect the exclusion of U.S. Fixed Income revenues and expenses from Market Services and Investment Intelligence to Corporate Items.2. Reclassified quarterly non-GAAP results reflect the exclusion of the NASDAQ Private Market, LLC, or NPM, revenues and expenses from Corporate Platforms to Corporate Items.
Below are the operating segments results after considering the impact of the divestitures of our U.S. Fixed Income Business and Nasdaq Private Market:
Reclassified Operating Segment Results

27271. Reclassified quarterly non-GAAP results reflect the exclusion of U.S. Fixed Income revenues and expenses from Market Services and Investment Intelligence to Corporate Items.2. Reclassified quarterly non-GAAP results reflect the exclusion of NPM revenues and expenses from Corporate Platforms to Corporate Items.
Below are the operating segments results after considering the impact of the divestitures of our U.S. Fixed Income Business and Nasdaq Private Market:
Reclassified Operating Segment Results
4Q20 3Q20 2Q20 1Q20
As reported Adj. Recasted Results As reported Adj. Recasted
Results As reported Adj. Recasted Results As reported Adj. Recasted
ResultsMarket TechnologyRevenues 106 — 106 86 — 86 84 — 84 81 — 81Expense 107 — 107 77 — 77 69 — 69 73 — 73Operating income (1) — (1) 9 — 9 15 — 15 8 — 8Investment Intelligence (1)
Revenues 247 (2) 245 238 (2) 236 213 (3) 210 211 (3) 208Expense 87 (1) 86 83 — 83 81 — 81 77 (1) 76Operating income 160 (1) 159 155 (2) 153 132 (3) 129 134 (2) 132Corporate Platforms (2)
Revenues 144 (5) 139 132 (1) 131 126 (1) 125 128 (2) 126Expense 99 (2) 97 81 (1) 80 77 (2) 75 83 (1) 82Operating income 45 (3) 42 51 — 51 49 1 50 45 (1) 44Market Services (1)
Net Revenues 291 (3) 288 259 (3) 256 276 (3) 273 281 (4) 277Expense 113 (2) 111 105 (3) 102 100 (3) 97 103 (2) 101Operating income 178 (1) 177 154 — 154 176 — 176 178 (2) 176Corporate Items (1,2)
Revenues — 10 10 — 6 6 — 7 7 — 9 9Expense — 5 5 — 4 4 — 5 5 — 4 4Operating income — 5 5 — 2 2 — 2 2 — 5 5Total Net revenue 788 — 788 — 715 — 715 — 699 — 699 — 701 — 701Total expense 406 — 406 — 346 — 346 — 327 — 327 — 336 — 336Non-GAAP operating income 382 — 382 369 — 369 372 — 372 365 — 365Operating margin 48% —% 48% 52% —% 52% 53% —% 53% 52% —% 52%

28
Summary of Historical Financial Results
NON-GAAP RESULTS(US$ Millions, except EPS)
2017 2018 2019 2020 YTD'21
Revenue from Solutions Segments $1,278 $1,453 $1,596 $1,776 $1,570
Market Services Net Revenues 850 931 893 1,096 938
Other Revenues 283 142 46 31 26
Net Revenues 2,411 2,526 2,535 2,903 2,534
Operating Expenses 1,271 1,320 1,295 1,414 1,182
Operating Income 1,140 1,206 1,240 1,489 1,352
Operating Margin(1) 47% 48% 49% 51% 53%
Income Before Income Taxes 1,008 1,075 1,128 1,393 1,261
Net Income 670 797 835 1,031 945
Diluted Earnings Per Share $3.95 $4.75 $5.00 $6.18 $5.63
Dividend Per share $1.46 $1.70 $1.85 $1.94 $1.57
1. Operating margin equals operating income divided by net revenues.

29
Solutions Segments Organic Revenue Growth
Solutions Segments Total Variance Organic Impact Other Impact (1)
All figures in US$ Millions Current Period
Prior-year Period $ % $ % $ %
3Q21 $541 $453 88 19 % 59 13 % 29 6 %
2Q21 527 419 108 26 % 73 17 % 35 8 %
1Q21 502 415 87 21 % 64 15 % 23 6 %
4Q20⁽³⁾ 497 421 76 18 % 66 16 % 10 2 %
2020⁽³⁾ 1,795 1,613 182 11 % 159 10 % 23 1 %
2019(2),⁽³⁾ 1,613 1,471 142 10 % 112 8 % 30 2 %
2018(2) 1,471 1,294 177 14 % 113 9 % 64 5 %
2017⁽³⁾ 1,530 1,449 81 6 % 59 4 % 22 2 %
2016⁽³⁾ 1,449 1,319 130 10 % 53 4 % 77 6 %
Note: The sum of the percentage changes may not tie to the percent change in total variance due to rounding.1. Other impact includes acquisitions, divestitures, and changes in FX rates.2. Revenues from the BWise enterprise governance, risk and compliance software platform, which was sold in March 2019, and the Public Relations Solutions and Digital Media Services businesses, which
were sold in mid-April 2018, are included in Other Revenues for these periods and therefore not reflected above. 3. Revenues have not been recasted for the NPM sale in August 2021 or the sale of NFI.

30
Market Services Organic Revenue Growth
Note: The sum of the percentage changes may not tie to the percent change in total variance due to rounding.1. Other impact includes acquisitions, divestitures and changes in FX rates.2. Revenues have not been re-casted for the NFI sale in July 2021.
Market Services Segment Total Variance Organic Impact Other Impact (1)
All figures in US$ Millions Current Period
Prior-year Period $ % $ % $ %
3Q21 $295 $256 39 15 % 37 14 % 2 1 %
2Q21 308 273 35 13 % 27 10 % 8 3 %
1Q21 334 277 57 21 % 48 17 % 9 3 %
4Q20⁽²⁾ 291 225 66 29 % 60 27 % 6 3 %
2020⁽²⁾ 1,108 912 196 21 % 191 21 % 5 1 %
2019⁽²⁾ 912 958 (46) (5) % (29) (3) % (17) (2) %
2018⁽²⁾ 958 881 77 9 % 75 9 % 2 — %
2017⁽²⁾ 881 827 54 7 % (7) (1) % 61 7 %
2016⁽²⁾ 827 771 56 7 % (13) (2) % 69 9 %

31
TAM/SAM
Market Technology Analytics Index IR & ESG Services
Total Addressable Market $26B $19B $3B $7B
Categories included:
Trading; Clearing/Risk; CSD; Trade execution services;
AML; Fraud; KYC; Screening, Surveillance;
eCommunications; and New Markets1
Analytics and work flow tools serving the investment
management community
Asset-based and subscription-based index licensing
IR software and advisory services; board and leadership workflow solutions and services; ESG consulting and advisory
services; ESG software including reporting, disclosure, sustainability management,
environmental health & safety, supply chain and product stewardship
Serviceable Addressable Market $9.5B $7B $1.6B $1.5B
Categories included:Trading, Clearing/Risk; CSD;
Trade execution services; AML; Fraud; Surveillance
Data, analytics and portfolio management solutions sold to asset managers, asset owners and their advisors and private
markets
Asset-based index licensing
IR software and advisory services within developed, applicable markets; board portal
software and assessments; ESG advisory services; ESG reporting and disclosure
software
1 New Markets reflects selected industries including Sports & Gaming, Transportation & Logistics, and Digital Assets

32
Defined Terms
ARR: ARR for a given period is the annualized revenue derived from subscription contracts with a defined contract value. This excludes contracts that are not recurring, are one-time in nature, or where the contract value fluctuates based on defined metrics. ARR is currently one of our key performance metrics to assess the health and trajectory of our recurring business. ARR does not have any standardized definition and is therefore unlikely to be comparable to similarly titled measures presented by other companies. ARR should be viewed independently of revenue and deferred revenue and is not intended to be combined with or to replace either of those items. ARR is not a forecast and the active contracts at the end of a reporting period used in calculating ARR may or may not be extended or renewed by our customers.
Solutions Segments: Revenues from our Corporate Platforms, Investment Intelligence and Market Technology segments.
Net Revenues: Revenues less transaction-based expenses.
AUM: Assets Under Management.
ETP: Exchange Traded Product.
NFI: Nasdaq's U.S. Fixed Income business.
New Logo Clients: Net clients that have not previously transacted with Nasdaq.


![3Q21 [ENG] Results Presentation-Analyst](https://img.pdfslide.net/doc/110x75/62059ee21708c43c2d4570d9/3q21-eng-results-presentation-analyst.jpg)