Embed Size (px)
Citation preview

nature methods
correction notice
Nat. Methods 5, 683–685 (2008)
Improving membrane voltage measurements using FRET with new fluorescent proteinsHidekazu Tsutsui, Satoshi Karasawa, Yasushi Okamura & Atsushi MiyawakiIn the version of this supplementary file originally posted online, there were two errors in the amino acid sequence of the construct in Supplementary Figure 4. The errors have been corrected in this file as of 10 January 2012.
Nature Methods: doi:10.1038/nmeth.1235
Improving membrane voltage measurements using FRET with
new fluorescent proteins
Hidekazu Tsutsui, Satoshi Karasawa, Yasushi Okamura & Atsushi Miyawaki
Supplementary figures and text:
Supplementary Fig. 1: New fluorescent proteins, mUKG and mKOκ.
Supplementary Fig. 2: Photostability of the new fluorescent proteins.
Supplementary Fig. 3: Schematic diagrams of the optical configurations for simultaneous detection of donor
and acceptor signals.
Supplementary Fig. 4: A schematic showing the domain structures of Ci-VSP and Mermaid.
Supplementary Fig. 5: Confocal images of Neuro2A cells expressing Mermaid and power spectral analysis of
ratio signals in response to spike trains.
Supplementary Fig. 6: Time courses of emission ratio in Xenopus oocytes.
Supplementary Methods
Supplementary Table 1: Statistical data of video-rate ratio imaging experiments.
Nature Methods: doi:10.1038/nmeth.1235
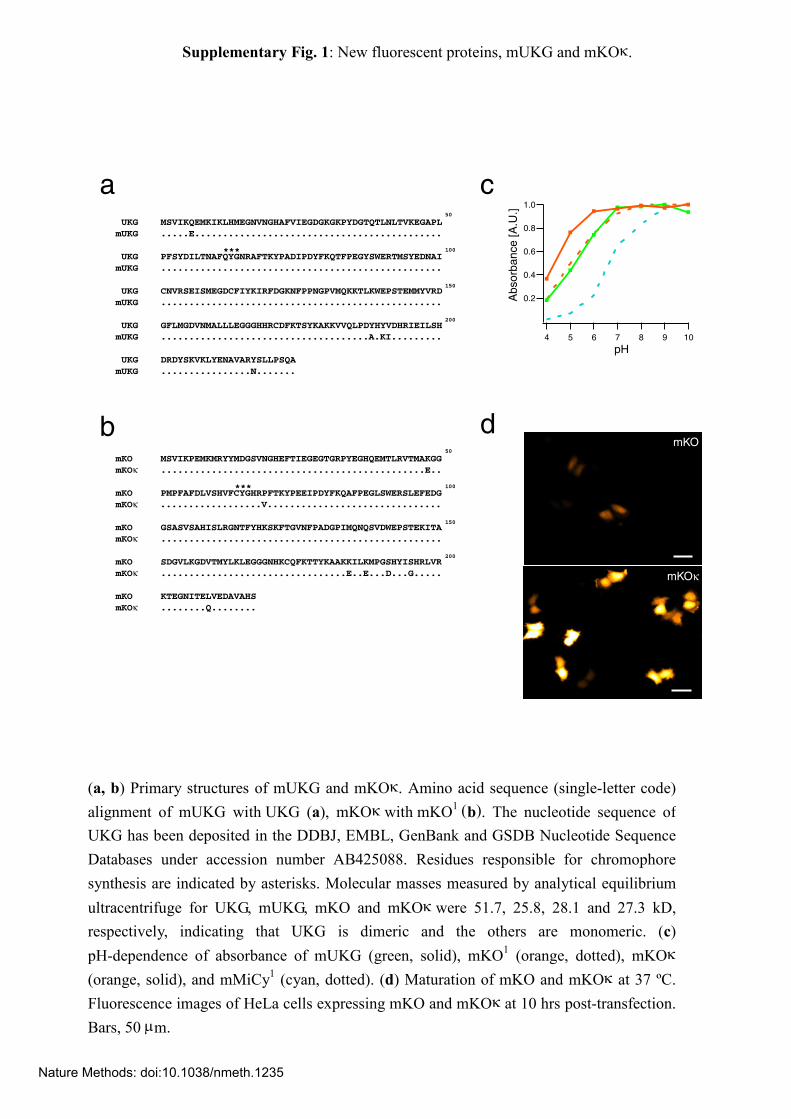
UKG MSVIKQEMKIKLHMEGNVNGHAFVIEGDGKGKPYDGTQTLNLTVKEGAPLmUKG .....E............................................
UKG PFSYDILTNAFQYGNRAFTKYPADIPDYFKQTFPEGYSWERTMSYEDNAImUKG ..................................................
UKG CNVRSEISMEGDCFIYKIRFDGKNFPPNGPVMQKKTLKWEPSTEMMYVRDmUKG ..................................................
UKG GFLMGDVNMALLLEGGGHHRCDFKTSYKAKKVVQLPDYHYVDHRIEILSHmUKG .....................................A.KI.........
UKG DRDYSKVKLYENAVARYSLLPSQAmUKG ................N.......
50
100
150
200
***
mKO MSVIKPEMKMRYYMDGSVNGHEFTIEGEGTGRPYEGHQEMTLRVTMAKGGmKOκ ...............................................E..
mKO PMPFAFDLVSHVFCYGHRPFTKYPEEIPDYFKQAFPEGLSWERSLEFEDGmKOκ ..................V...............................
mKO GSASVSAHISLRGNTFYHKSKFTGVNFPADGPIMQNQSVDWEPSTEKITAmKOκ .................................................. mKO SDGVLKGDVTMYLKLEGGGNHKCQFKTTYKAAKKILKMPGSHYISHRLVRmKOκ .................................E..E...D...G.....
mKO KTEGNITELVEDAVAHSmKOκ ........Q........
50
100
150
200
***
Abs
orba
nce
[A.U
.]
pH
1.0
0.8
0.6
0.4
0.2
10987654
mKO
mKOκ
a c
db
Supplementary Fig. 1: New fluorescent proteins, mUKG and mKOκ.
(a, b) Primary structures of mUKG and mKOκ. Amino acid sequence (single-letter code) alignment of mUKG with UKG (a), mKOκ with mKO1 (b). The nucleotide sequence of UKG has been deposited in the DDBJ, EMBL, GenBank and GSDB Nucleotide Sequence Databases under accession number AB425088. Residues responsible for chromophore synthesis are indicated by asterisks. Molecular masses measured by analytical equilibrium ultracentrifuge for UKG, mUKG, mKO and mKOκ were 51.7, 25.8, 28.1 and 27.3 kD, respectively, indicating that UKG is dimeric and the others are monomeric. (c) pH-dependence of absorbance of mUKG (green, solid), mKO1 (orange, dotted), mKOκ (orange, solid), and mMiCy1 (cyan, dotted). (d) Maturation of mKO and mKOκ at 37 ºC. Fluorescence images of HeLa cells expressing mKO and mKOκ at 10 hrs post-transfection. Bars, 50 µm.
Nature Methods: doi:10.1038/nmeth.1235

Arc lamp illumination
Laser illumination
sec sec
sec sec
c d
a b
UKGCeruleanmUKGmMicy
1.0
0.8
0.6
0.4
0.2
0.0
6004002000
1.0
0.8
0.6
0.4
0.2
0.0
150100500
UKGCeruleanmUKGmMicy
mCherry
mKOκtagRFP
mCherrymKOκtagRFP
Nor
mal
ized
fluo
resc
ence
Nor
mal
ized
fluo
resc
ence
Nor
mal
ized
fluo
resc
ence
Nor
mal
ized
fluo
resc
ence
1.0
0.8
0.6
0.4
0.2
0.0
6004002000
1.0
0.8
0.6
0.4
0.2
0.0
200150100500
Supplementary Fig. 2: Photostability of the new fluorescent proteins.
Photostability of fluorescent proteins. (a, c) Fluorescence decay curves for UKG, mUKG, cerulean2, and mMiCy1. (b, d) Fluorescence decay curves for mKOκ, mCherry3 and tag-RFP4. Fluorescence intensities were measured while samples were strongly illuminated using an arc lamp (a, b) or lasers (c, d). Experimental details are shown in Supplementary Methods.
Nature Methods: doi:10.1038/nmeth.1235

PMT
PM
T
L1Arc
Obj. Obj.
L2 EX
EM1
EM2
DM1
DM2L3
Prism PrismCCD
CCD
L1Arc L2 EX
EM1
EM2
DM1
DM2
L3
L4
a b
Schematic diagrams of the optical configurations for simultaneous detection of donor (mUKG) and acceptor (mKOκ) signals using two photomultipliers (Hamamatsu-Photonics, H5784-02) (a) and charged-coupled-device cameras (CoolSNAP HQ, Photometrics) (b) on an inverted microscope (IX71, Olympus). L1: collector lens; L2: projection lens; L3, 4: tube lens; EX: excitation filter (BP440-460, Olympus); EM1: emission filter (BP475-540, Olympus); EM2: emission filter (590AF60, Omega); DM1: dichroic mirror (LP465, Olympus); DM2 dichroic mirror (LP545, Olympus).
Supplementary Fig. 3: Schematic diagrams of the optical configurations for simultaneous detection of donor and acceptor signals.
Nature Methods: doi:10.1038/nmeth.1235
Ci-VSPVSD linker
BamHI
1 217 249
1 217 239
239
255
Xho1
phosphatase domain
ME................R..QQMK......RYRK...............................DI*
VSD linker mUKG mKOκME................Q..QQMK..ISGDPMS.............QASKLETMVS...........HS*Mermaid
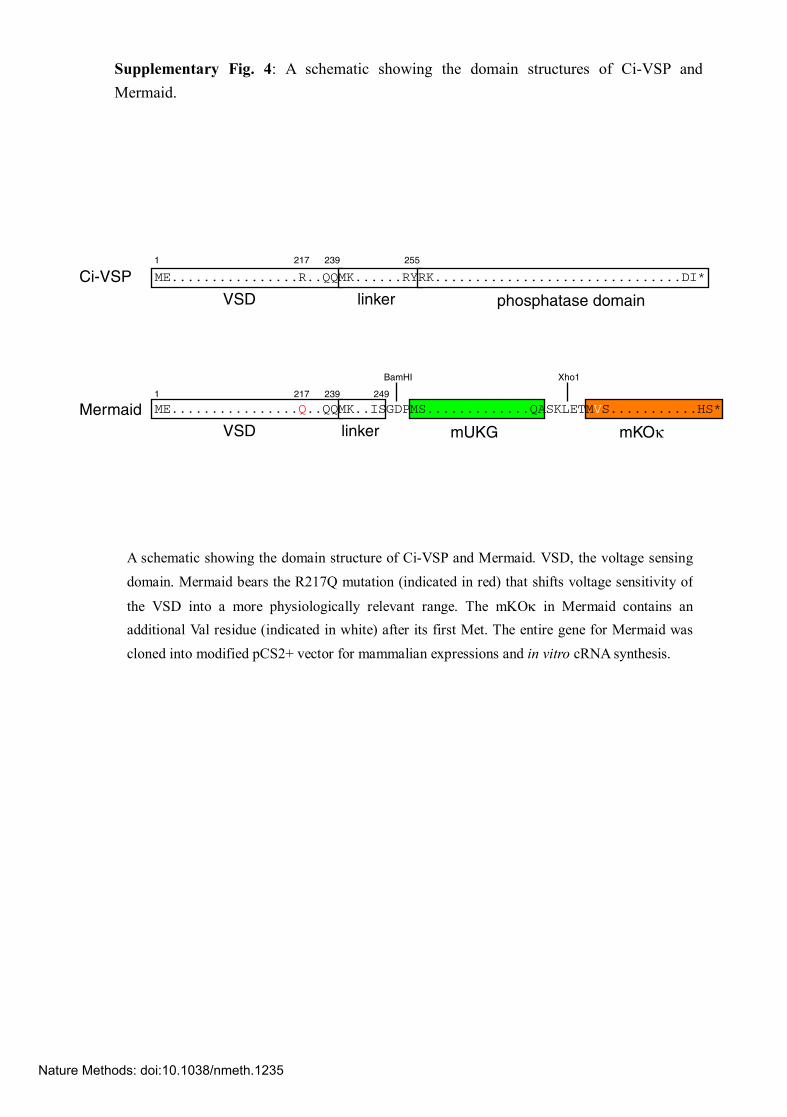
Supplementary Fig. 4: A schematic showing the domain structures of Ci-VSP and Mermaid.
A schematic showing the domain structure of Ci-VSP and Mermaid. VSD, the voltage sensing domain. Mermaid bears the R217Q mutation (indicated in red) that shifts voltage sensitivity of
the VSD into a more physiologically relevant range. The mKOκ in Mermaid contains an additional Val residue (indicated in white) after its first Met. The entire gene for Mermaid was cloned into modified pCS2+ vector for mammalian expressions and in vitro cRNA synthesis.
Nature Methods: doi:10.1038/nmeth.1235

mUKG mergemKOκ DIC
Supplementary Fig. 5: Confocal images of Neuro2A cells expressing Mermaid and power spectral analysis of ratio signals in response to spike trains.
a
b
(a) Confocal images of Neuro2A cells expressing Mermaid 18 hrs post-transfection, which clearly demonstrate that the probe localizes on the plasma membrane. Cells were imaged using Olympus FV500 LSM equipped with a DPSS (diode pumped solid state) 488 nm laser. Emissions from mUKG and mKOκ were acquired via 505-550 nm and 560-600 nm band pass filters, respectively. Bar, 10 µm. (b) Power spectral analysis of Mermaid ratio signals in response to 100 Hz spike trains in three different Neuro2A cells.
cell #08214008
cell #08214012
cell #08214014
voltage
20 mV
100 ms
∆10 %
4
3
2
1
10 100 1000
8
6
4
2
10 100 1000
8
6
4
2x1
0-6 x1
0-6 x1
0-6
10 100 1000
FT1 FT2
Am
plitu
de (
2 /Hz)
Frequency
Frequency
Frequency
Am
plitu
de (
2 /Hz)
Am
plitu
de (
2 /Hz)
Nature Methods: doi:10.1038/nmeth.1235
20 ms
+60 mV
+40 mV
+20 mV
0 mV
-20 mV
-40 mV
∆10
%
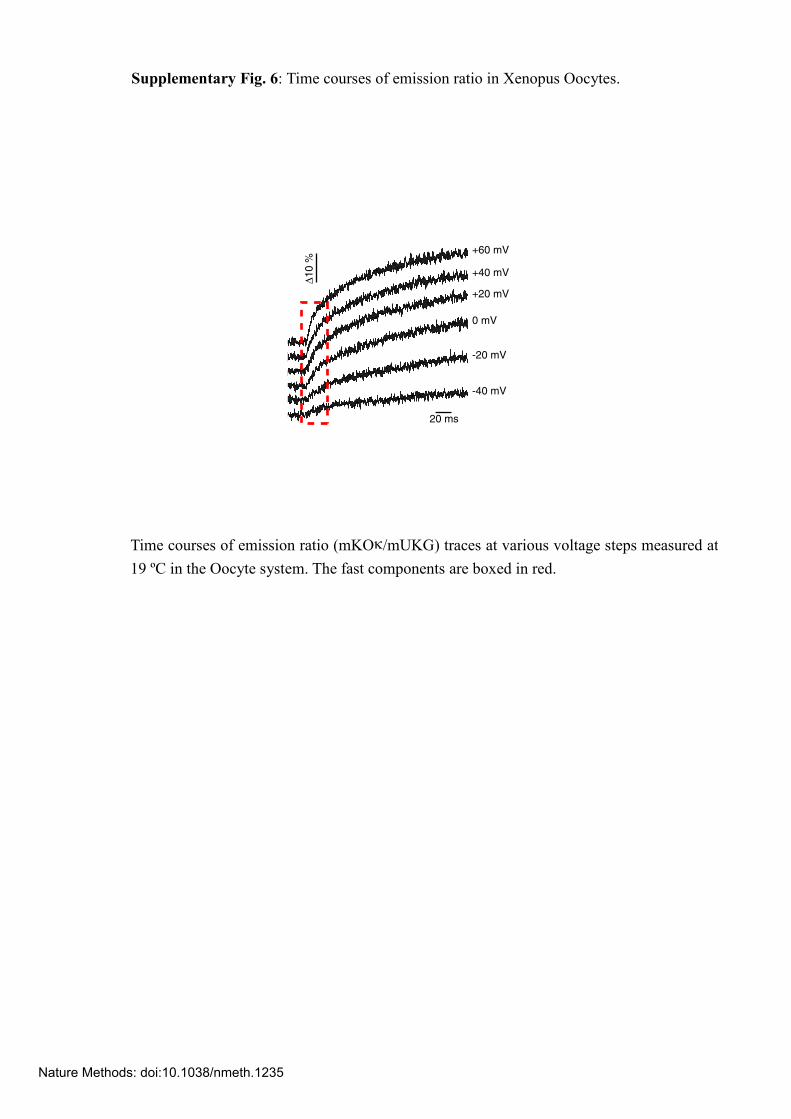
Time courses of emission ratio (mKOκ/mUKG) traces at various voltage steps measured at 19 ºC in the Oocyte system. The fast components are boxed in red.
Supplementary Fig. 6: Time courses of emission ratio in Xenopus Oocytes.
Nature Methods: doi:10.1038/nmeth.1235
Supplementary Methods
cDNA Cloning A small piece of stony coral (Sarcophyton sp.) was collected with the aid of an aqualung in
the shallow water off Sesoko Island (Okinawa, Japan). The RNA was isolated with TRIZOL reagent (Gibco BRL). Reverse transcription of cDNA from total RNA, PCR-based amplification of the cDNA fragments of interest using degenerate primers, and subsequent generation of a full-length cDNA by RACE were performed. For bacterial expression of the
protein, a cDNA fragment containing the coding region was amplified using primers containing 5’-BamHI and 3’-XhoI sites, and was cloned in-frame into the BamHI/XhoI site of the modified pRSETB vector, which introduces a 6X-His tag at the C-terminus of the protein after the addition of two amino acids (-Leu-Glu-) corresponding to the XhoI site.
For mammalian expression, the cDNA containing the coding region with a Kozak consensus sequence at the 5’ end was cloned into the BamHI/EcoRI site of the pCS2+ vector.
Mutagenesis Site-directed semi-random mutations were introduced as described previously5. Multiple degenerative primers were used together for reactions.
Characterizations of novel fluorescent proteins in vitro
Protein expression in Escherichia coli (JM109DE3) and purification by Ni2+ affinity chromatography were performed as described previously6. Absorption/fluorescence spectroscopy and pH titration were performed at room temperature as previously described6.
To measure molecular mass of the novel fluorescence proteins, sedimentation equilibrium experiments were performed using a Beckman An60Ti rotor on a Beckman XL-1 analytical ultracentrifuge at 25,000 rev/min at 25 ºC.
Photostability of fluorescent proteins in cells The photostability of fluorescent proteins against intense arc lamp- and laser-illumination was tested in HeLa cells. The photostability was compared with that of mMiCy1 , cerulean2 , mCherry3 and tag-RFP4. HeLa cells were transfected with plasmids using Lipofectamine
2000 regent (Invitrogen) and imaged after ~24 hours. To illuminate with intense arc lamp,
Nature Methods: doi:10.1038/nmeth.1235

cells were imaged on an inverted microscope (IX70, Olympus) with a 40X objective (UAPO340, N.A. 1.35) and a 75 W xenon lamp. For cyan~green emitting FPs (UKG, mUKG, mMiCy, and cerulean), a 455DF30 excitation filter was used; the intensity of the excitation light was 1.23W/cm2 at the specimen. For orange~red emitting FPs (mKOκ,
mCherry, and tag-RFP), a 550DF30 filter was used; the intensity of the excitation light was 0.95 W/cm2 at the specimen. Fluorescence images were acquired using a cooled charge-coupled device camera (CoolSNAP HQ, Photometrics) every 30 sec via LP480 and LP575 filters for the cyan~green FPs and orange~red FPs, respectively. For laser
illumination, cells were imaged on an inverted laser-scanning microscope (FV500, Olympus) with a 60X objective (PlanApo, N.A. 1.40). A HeCd-laser (442 nm) and a HeNe-laser (543 nm) were used for the cyan~green and orange~red FPs, respectively. Illumination powers were 0.08 mW and 0.19 mW at the specimen, respectively. Square area
of 0.14 mm x 0.14 mm was scanned continuously at 0.37 Hz.
Electrophysiology Xenopus oocytes were injected with 50 nl cRNA (0.2 µg/µl), and 1~5 days later they were
voltage-clamped using an amplifier (OC-725C, Warner Instruments). Bath solution contained (in mM): NaCl 88, KCl 1, NaHCO3 2.4, MgSO4 0.82, Ca(NO3)2 0.33, CaCl2 0.41, and Hepes 15 (pH 7.4). Whole-cell patch clamp recordings were performed from neuro2A cells using a patch clamp amplifier (Axopatch 200B, Axon Instruments). Patch pipettes
were pulled from borosilicate glass capillaries of 1.5 mm outer diameter (Narishige) using a Flaming-Brown microelectrode puller (P -97; Sutter Instruments). Pipette solution contained (in mM): KCl 150, EGTA 1, MgCl 1, MgATP 2, and Hepes 10 (pH 7.2). The external solution contained (in mM): NaCl 120, KCl 2.5, MgSO4 1.5, CaCl2 2.0, NaHCO3 26,
NaH2PO4 1.1, and glucose 10 (pH 7.4). We used Clampex software (Axon instruments) for data acquisition and Clampfit (Axon instruments) for data analysis. In order to examine the kinetics of Mermaid statistically, we gave action potential waveforms as well-controlled voltage commands. The waveform was recorded from a rat DRG neuron in the
current-clamp mode, whose peak amplitude and half -width were 115 mV and 2.1 ms, respectively. The power spectrum of Mermaid signals as shown in Fig. 1h was obtained with Fast Fourier Transforms (FFT) based algorithm equipped in Clampfit software7 at spectral resolution of 9.77 Hz.
Nature Methods: doi:10.1038/nmeth.1235
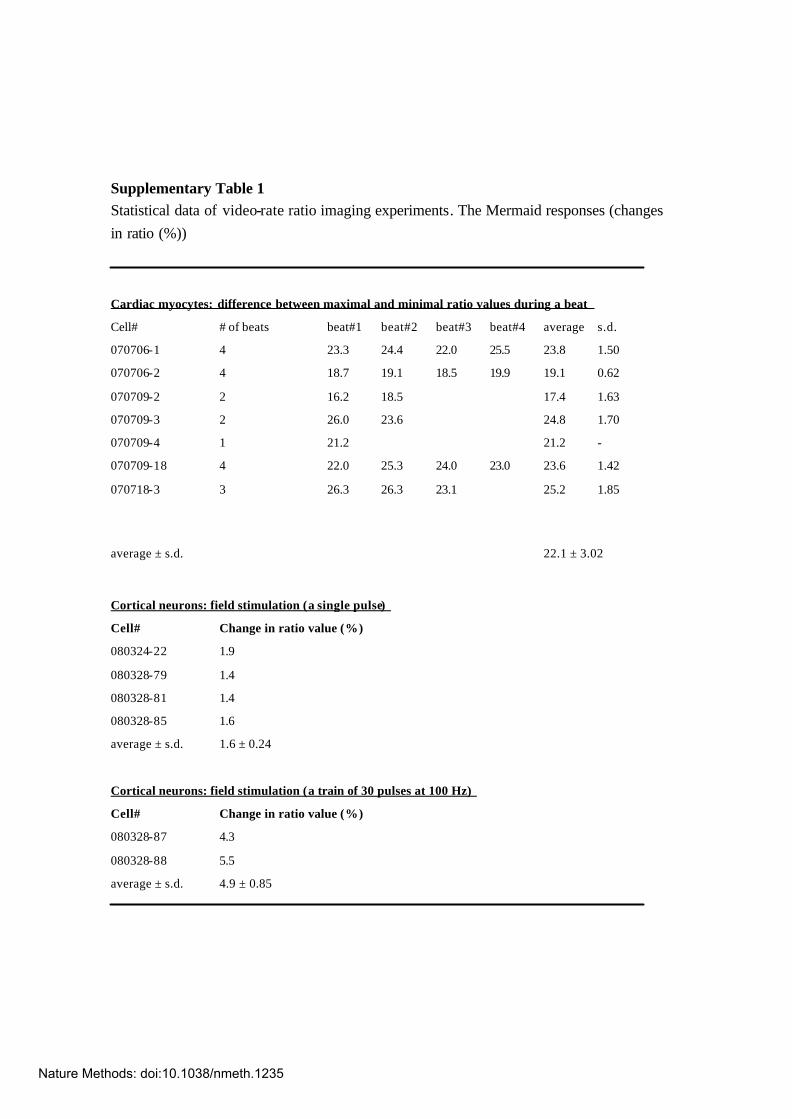
Supplementary Table 1 Statistical data of video-rate ratio imaging experiments. The Mermaid responses (changes in ratio (%))
Cardiac myocytes: difference between maximal and minimal ratio values during a beat
Cell# # of beats beat#1 beat#2 beat#3 beat#4 average s.d.
070706-1 4 23.3 24.4 22.0 25.5 23.8 1.50
070706-2 4 18.7 19.1 18.5 19.9 19.1 0.62
070709-2 2 16.2 18.5 17.4 1.63
070709-3 2 26.0 23.6 24.8 1.70
070709-4 1 21.2 21.2 -
070709-18 4 22.0 25.3 24.0 23.0 23.6 1.42
070718-3 3 26.3 26.3 23.1 25.2 1.85
average ± s.d. 22.1 ± 3.02
Cortical neurons: field stimulation (a single pulse)
Cell# Change in ratio value (%)
080324-22 1.9
080328-79 1.4
080328-81 1.4
080328-85 1.6
average ± s.d. 1.6 ± 0.24
Cortical neurons: field stimulation (a train of 30 pulses at 100 Hz)
Cell# Change in ratio value (%)
080328-87 4.3
080328-88 5.5
average ± s.d. 4.9 ± 0.85
Nature Methods: doi:10.1038/nmeth.1235

Supplementary references
1. Karasawa, S. et al., Biochem. J. 381 , 307-312 (2004).
2. Rizzo, M.A. et al., Nat Biotechnol. 22 , 445-459. (2004). 3. Shaner, N. C. et al., Nat. Biotechnol. 22, 1567-1572 (2004). 4. Merzlyak, E. M. et al., Nat Methods. 4 , 555-557 (2007). 5. Sawano, A, et al., Nucleic Acids Res. 28, E78 (2000).
6. Ando, R, et al., Pro Nalt Acad Sci USA 99 , 12651-12656 (2002). 7. Chapter 9: “Digital spectral analysis in Clampfit” in pClamp 9 user’s guide, Axon
Instruments.
Nature Methods: doi:10.1038/nmeth.1235


![Sistem Uji Kompetensi Guru [UKG] Online - vedcmalang.com Memulai U… · Sistem Uji Kompetensi Guru [UKG] Online Panduan UKG Pelaksana: Pengoperasian Tim UKG Online Direktorat Jenderal](https://img.pdfslide.net/doc/110x75/5a75fc617f8b9a1b688cdbfa/sistem-uji-kompetensi-guru-ukg-online-memulai-u-sistem-uji-kompetensi.jpg)


![1312 [51.7] 30 A 1498](https://img.pdfslide.net/doc/110x75/61b149b38d976a20e8422984/1312-517-30-a-1498.jpg)