Embed Size (px)
Citation preview

National Administrative
Department of Statistics
Methodology and Statistical Production Division
DIMPE
Monthly Retail
Trade Survey Methodology
- MMCM
May 2004

MONTHLY RETAIL
TRADE SAMPLE METHODOLOGY
CODE: TE-MMCM-TEM–01 VERSION: 02 PAGE: 2 DATE: 07-05-04
NATIONAL ADMINISTRATIVE DEPARTMENT OF STATISTICS
JORGE BUSTAMENTE ROLDÁN
Director
CHRISTIAN JARAMILLO HERRERA
Deputy Director
MARIO CHAMIE
General Secretary
Technical Directors
EDUARDO EFRAÍN FREIRE DELGADO
Director of Methodology and Statistical Production
BERNARDO GUERRERO LOZANO
Director of Censuses and Demography
NELCY ARAQUE GARCÍA
Director of Regulation, Planning, Standardization and Normalization
MIGUEL ÁNGEL CÁRDENAS CONTRERAS
Director of Geostatistics
ANA VICTORIA VEGA ACEVEDO
Director of Synthesis and National Accounts
CAROLINA GUTIÉRREZ HERNÁNDEZ
Director of Diffusion, Marketing and Statistical Culture
Bogotá, D.C., 2011

Monthly Retail Trade Survey
Methodology-MMCM
CODE: TE-MMCM-TEM–01 VERSION: 02 PAGE: 3 DATE: 07-05-04
CONTENTS
PRESENTATION ............................................................................................................................ 6 INTRODUCTION ............................................................................................................................ 7 1. PLANNING .................................................................................................................................. 8 1.1. PROGRAMMING ................................................................................................................ 8 1.1.1. NEED FOR INFORMATION ....................................................................................................... 8 1.1.2. OBJECTIVES ........................................................................................................................... 8 1.1.2.1. General Objective .............................................................................................................. 8 1.1.2.2. Specific Objectives ............................................................................................................ 8 1.1.3. BASIC DEFINITIONS ................................................................................................................ 9 1.1.4. CONCEPTUAL FRAMEWORK ................................................................................................. 11 Table 1. Classification by merchandise groups (According to ISIC Rev. 3 A.C.) .......................... 12 1.1.5. OBSERVATION FIELD ........................................................................................................... 12 1.1.5.1. Observation unit ............................................................................................................... 12 1.1.5.2. Universe of study ............................................................................................................. 13
1.1.5.3. Target population ............................................................................................................. 13 1.1.6. REFERENCE PERIOD............................................................................................................. 13 1.1.7. TIMELINE ............................................................................................................................. 13 Table 2. Activities timeline of the Monthly Retail Trade Sample ................................................... 14 1.1.8. SCOPE AND LIMITATIONS ..................................................................................................... 14 1.1.9. DISSEMINATION METHODS .................................................................................................. 14 1.2. DESIGN ................................................................................................................................ 15 1.2.1. DESIGN CONCEPTS ............................................................................................................... 15 1.2.1.1. Target population ............................................................................................................. 15 1.2.1.2. Variables of interest ......................................................................................................... 15 1.2.1.3. Estimation of parameters ................................................................................................ 15
1.2.1.4. Coverage and disaggregation level ....................................................................... 15 1.2.1.5. Disaggregation levels ....................................................................................................... 15 1.2.1.6. Statistical units ................................................................................................................. 16 1.2.1.7. Reference Period .............................................................................................................. 16 1.2.1.8. Collection period .............................................................................................................. 16 1.2.2.1 Sampling framework ............................................................................................................ 16 1.2.2.2 Sampling design ................................................................................................................... 17 Table 3. Regrouped commercial classes .......................................................................................... 18 1.2.2.3 Sample size........................................................................................................................... 21 1.2.2.4 Design and selection of the sample ...................................................................................... 21 1.2.2.5 Methodology of estimation and variance ............................................................................. 22 1.2.2.6 Novelties management ........................................................................................................ 27 1.2.2.7 Sample maintainance .......................................................................................................... 28 1.2.2.8 Statistical analysis methods ................................................................................................. 29 Table 4. Homogeneous groups of merchandise and retail trade activity. ........................................ 29 Table 5. Correlative of merchandise groups between both samples ................................................ 30 Table 6. Relative weighting of each merchandise group ................................................................. 34

Monthly Retail Trade Survey
Methodology-MMCM
CODE: TE-MMCM-TEM–01 VERSION: 02 PAGE: 4 DATE: 07-05-04
Table 7. Deflators by merchandise groups....................................................................................... 35 1.2.2.9 Data collection instruments .................................................................................................. 37 1.2.2.10 Distribution method and gathering of forms ...................................................................... 39 1.2.2.11 Field operation design at territorial branches .................................................................... 39 1.2.2.12 Quality specifications, operation and capture control, filtering and processing of
information. ...................................................................................................................................... 40 2. STATISTICAL PRODUCTION .............................................................................................. 43 2.1 IMPLEMENTATION .............................................................................................................. 43 2.1.1 TRAINING ................................................................................................................................. 43 2.1.2 INFORMATION COLLECTION ..................................................................................................... 43 2.1.3 CRITIQUE OF THE INFORMATION.............................................................................................. 44 2.1.4 CAPTURE AND FILTERING STAGE ............................................................................................. 44 2.1.5 IMPUTATION ............................................................................................................................ 46 2.1.6 PRODUCTION AND REVIEW OF EXPANDED RESULTS ................................................................ 46 2.2 ANALYSIS ................................................................................................................................ 47 2.2.1 DATA PREPARATION ................................................................................................................ 47 3. EVALUATION AND CONTROL ............................................................................................ 48 4. DOCUMENTATIÓN ................................................................................................................ 49 4.1 METHODOLOGIES AND MANUALS ................................................................................. 49 4.2 COLLECTION ......................................................................................................................... 50 5. DISSEMINATION ..................................................................................................................... 50 ANNEXES ....................................................................................................................................... 52 ANNEX A ........................................................................................................................................ 52 GLOSSARY .................................................................................................................................... 52 ANNEX B. ....................................................................................................................................... 56 FORMULAS FOR THE ESTIMATION OF INDICES AND PERCENTAGE VARIATIONS
.......................................................................................................................................................... 56 ANNEX C. ....................................................................................................................................... 60 PERCENTAGE VARIATIONS .................................................................................................... 60 ANNEX D ........................................................................................................................................ 62 NOVELTIES
……………………………………………………………………………………………………..59 LIQUIDATED ................................................................................................................................ 62 NOVELTY 1. LIQUIDATED: IT OPERATED ZERO MONTHS IN THE YEAR N OF THE SURVEY. ............ 62 NOVELTY 97. LIQUIDATED: OPERATING ONE MONTH OR LONGER. ................................................. 63 NOVELTY 2. CHANGE OF SECTOR OF THE STATISTICAL UNIT DUE TO ECONOMIC PROCESS. ......... 64 NOVELTY 19. CHANGE OF SECTOR DUE TO WRONG CLASSIFICATION AND BECAUSE IT DOES NOT
BELONG TO THE UNIVERSE OF STUDY. ............................................................................................. 65 INACTIVE (3) ................................................................................................................................ 66 UNLOCATED (4) ........................................................................................................................... 67 DEBT (5) ......................................................................................................................................... 68 IMPUTATION (98) ........................................................................................................................ 69 DUPLICATE (6) ............................................................................................................................ 69 EXITS DUE TO TRANSFER TO ANOTHER REGIONAL BRANCH (7) ............................. 70 ENTERS DUE TO TRANSFER FROM ANOTHER REGIONAL BRANCH(8) .................... 70 JOINED THE SAMPLE AS NEW (9) .......................................................................................... 71 MERGED (10) ................................................................................................................................ 71 SCISSION (12)................................................................................................................................ 72

Monthly Retail Trade Survey
Methodology-MMCM
CODE: TE-MMCM-TEM–01 VERSION: 02 PAGE: 5 DATE: 07-05-04
ABSORPTION (13) ........................................................................................................................ 73 HOUSEHOLDS WITH ECONOMIC ACTIVITY (18).............................................................. 75 INFORMATION PROVIDED (99) ............................................................................................. 75 SUMMARY OF NOVELTY CODES ........................................................................................... 76 ANNEX E. ....................................................................................................................................... 77 MONTHLY RETAIL TRADE SAMPLE FORM ....................................................................... 77 ANNEX F. ....................................................................................................................................... 78 FORM: MOTOR VEHICLES TRADE, RETAIL TRADE OF ITS PARTS, ACCESSORIES,
FUELS AND LUBRICANTS. ....................................................................................................... 78 BIBLIOGRAPHY .......................................................................................................................... 79

Monthly Retail Trade Survey
Methodology-MMCM
CODE: TE-MMCM-TEM–01 VERSION: 02 PAGE: 6 DATE: 07-05-04
PRESENTATION
The National Administrative Department of Statistics, DANE as the coordinator entity of the National Statistical System (NSS), within the framework of the "Statistical Planning and Harmonization" project, works to strengthen and consolidate the NSS. This is carried out through several processes such as: the production of strategic statistics; the generation, adaptation, adoption and diffusion of standards; the consolidation and harmonization of statistical data, and the connection of instruments, stakeholders, initiatives and products. These actions are carried out in order to improve the quality of strategic statistic data, and its availability and accessibility to respond to users demand. In this context DANE, aware of the need and obligation to provide better products for its users, developed a standard presentation guide for methodologies. The aim of this guide is to contribute to the visualization and understanding of the statistical processes, allowing further analysis, control, replicability, and evaluation. The documents are presented in a standard and comprehensive manner, thus facilitating the understanding of the main technical characteristics involved in the processes and sub-processes of each research, making them available for both specialized users and the general public. These series of guides promote the transparency and credibility of the technical expertise of DANE, for a better understanding and use of statistical information. This information is produced according to the principles of coherence, comparability, integrality and quality of the statistics.

Monthly Retail Trade Survey
Methodology-MMCM
CODE: TE-MMCM-TEM–01 VERSION: 02 PAGE: 7 DATE: 07-05-04
INTRODUCTION
This document is a compendium of the methodological process of the Monthly Retail Trade Sample (MMCM by its acronym in Spanish). It is based on the experience from surveys of domestic trade sector, existing publications and knowledge, which comes from the work teams directly linked to the research, among them: the sampling design team, the systems team, the enterprise logistics team, and the economic thematic team. In this context, the entire research process is to be described, in each of its stages, from the moment when the customers and their necessities are identified until the delivery and publication of results. If a specific topic needs further amplification, the reader will have access to the annexes and documents included.
According to the historical background, in 1970 DANE conducted the Census of Industry Trade and Services (CIS by its acronym in Spanish). In that same year, the first Monthly Retail Trade Sample (MMCM) was initiated, which concluded in 1973; its objective was to identify the behavior of the domestic trade sector as well as the households' consumption over the short term. Having in mind that the trading sector is predominantly dynamic, the sample is being updated annually. At this moment, approximately 627 companies are currently being researched. The collected information is filtered and consolidated until a national total is obtained; this aggregate data is then published in a monthly press bulletin.

MONTHLY RETAIL
TRADE SAMPLE METHODOLOGY
CODE: TE-MMCM-TEM–01 VERSION: 02 PAGE: 8
DATE: 07-05-04
PREPARED BY: DM Teams; TE, LE of the Monthly Retail Trade Sample
Checked by: Technical Secretary MMCM Approved by: Director of DIMPE
.
1. PLANNING
1.1. PROGRAMMING
1.1.1. Need for Information Given the importance of the trading sector in the economy with regards to value generation of sales and the volume of merchandise it distributes, it became necessary for both DANE and the government to conduct periodic statistics that reflect the evolution and behavior of retail trade at the national level. This is especially important due to its role in Gross Domestic Product (GDP), generation of employment, and the volume of final consumption goods circulating through this channel.
1.1.2. Objectives
1.1.2.1. General Objective To measure the trends of retail trade based on the following variables: sales, employed personnel, per capita wages and salaries generated in retail trade companies participating in the research and, in a related way, the households' consumption over the short term
1.1.2.2 Specific Objectives
To measure he behavior of sales by merchandise groups and commercial activity -ISIC Rev.3 Adapted for Colombia (A.C.), of the companies involved in retail trade across the country.
To evaluate the evolution of the retail trade sector personnel across the country.
To determine the evolution of per capita wages and salaries generated in the retail trade sector.
To produce and calculate basic statistics for the retail trade sector in national accounts.
To provide characteristics of the sampling framework, for researches related with the retail trade.

METODOLOGÍA DE LA MUESTRA
MENSUAL DE COMERCIO AL POR MENOR
MMCM
CÓDIGO: TE-MMCM-TEM–01 VERSIÓN: 01 PÁGINA: 9 FECHA: 07-05-04
1.1.3. Basic definitions1
Trade: “the re-sale (sale without transformation) of new and used goods; it can be retail or wholesale. Includes all the agents, traders, auctioneers and commissioners whose task is the sale and purchase of goods for themselves or on behalf of a third party”.
2
Domestic trade: “the re-sale (sale without transformation) of new and used goods within the national territory, it can be retail or wholesale”.
3
Retail Trade: “the re-sale (sale without transformation) of new merchandise or goods, destined for consumption, personal or household use. It excludes commercial activities conducted at pawn shops, lottery outlets, mobile points of sale, homes, and telemarketing activities; it also excludes activities associated with maintenance and repair related to trade”.
4
ISIC Rev.3 AC Activity: its role is to establish a structure in which the statistical information regarding all economic activities from different productive sectors in the country shall be presented. The term activity used in this context refers to a production process, i.e. the combination of actions that result in a given set of goods and services.
Enterprise: for the purposes of economic statistics, "enterprise is defined as every business unit, or combination of business units, owner or manager that, acting under a single legal name, directly or indirectly comprises and controls all functions and activities necessary for the development and realization of the corporate purpose for which it was created”
5 .
In practice, an enterprise may be constituted or formed by:
Business units, dependent or independent of each other, according to the activity they carry out. They might be geographically scattered or not, engaged in industrial production, mining, farming, marketing and /or in the provision of services to enterprises or households.
A simple structure which could be limited to a single business unit where all corporate purposes are centrally conducted.
Wages and salaries: fixed or standard remuneration earned by personnel during a month, in cash or kind, in return for work, excluding deductions such as withholding income tax, social security, and deductions from employee funds, cooperatives and the like.
6
1 DANE,(2002). International Standard Industrial Classification of All Economic Activities Adapted for
Colombia (CIIU.Rev.3ªA.C) 2 Ibíd.,
3 Ibíd.,
4 Ibíd.,
5 Op.Cit.,
6 Ibíd.

Monthly Retail Trade Survey
Methodology-MMCM
CODE: TE-MMCM-TEM–01 VERSION: 02 PAGE: 10 DATE: 07-05-04
It includes basic salaries, allowances and bonuses, overtime pay or paid time off (PTO), sick and maternity leaves, paid directly by the employer; in addition, it includes commissions, profit sharing, sales percentages, and permanent travel allowances.
Employed personnel: it is the average number of personnel that render their services to an enterprise, in exchange for an agreed remuneration established in a contract. For this research it is categorized by gender and type of contract
7.
Employed personnel according to the type of contract
Proprietors, partners and relatives without remuneration
Refers to proprietors and partners of the local business unit(s) that constitute the enterprise; those are the individuals who work without receiving a fixed salary and earn their income from the enterprise profits. If a proprietor or partner has a fixed salary, it
must be included in the corresponding type of contract. 8
Permanently employed personnel
Refers to the personnel on the enterprise’s payroll, whose employment relationship is established for an indefinite term. Also part of this category is the permanently employed personnel that appears on the corporate payroll but is temporarily absent, due to sick leave, maternity leave, paid leave, strike, etc
9.
Temporary personnel hired directly by the enterprise
Corresponds to personnel hired directly by the enterprise to perform tasks related to the activity of the enterprise, for a definite time not exceeding one year and in exchange for an agreed remuneration.
Temporary personnel hired through employment agencies It refers to temporary employees hired through agencies specialized in providing personnel, to carry out tasks related to the activity of the enterprise for a definite time and in exchange for an agreed remuneration.
10
Apprentices: those individuals who, for a fixed period of time, work in the administrative or sales areas of the enterprise, where they initiate the application of knowledge from their profession, skill or occupation (hired in accordance with the terms of Law 789 of Dec., 2002) and are remunerated with a monthly maintenance support payment. In this group there are students from: the National Learning Service (SENA by its acronym in
7 Ibíd.
8 Ibíd.
9 Ibíd.
10 Ibíd.

Monthly Retail Trade Survey
Methodology-MMCM
CODE: TE-MMCM-TEM–01 VERSION: 02 PAGE: 11 DATE: 07-05-04
Spanish)11
, universities, and other educational institutions of higher, technical or technological education.
Social benefits: mandatory and/or voluntary remunerations different from wages and salaries, paid by the employer to the employees during the month. These include employer’s contributions to social security and/or compensation funds, legal and extralegal premiums; vacation pay; family, food, and transportation allowances; medical assistance and funeral expenses; travel allowances and occasional commissions; life and risk insurance paid directly by the enterprise; compensation for occupational illness and work dismissal; housing assistance; severance pay; scholarships to children of workers and other scholarships in favor of the employee. Payments to pensioners and fees paid in exchange for professional services are excluded.
Sales: monthly sales revenue is researched by merchandise groups, regardless of the term or method of payment (cash, credit, check or credit card), excluding the indirect taxes (VAT and consumption tax).
Debt: it occurs when a unit, being active in the reference period, fails to provide a response for specific field procedure or office procedure on time.
1.1.4. Conceptual framework It is based on the fundamental concepts used in the industry, the variables researched, and on recommendations from other researches and organizations that use the information. Additionally, the International Standard Industrial Classification (ISIC) Rev. 3 Adapted for Colombia (A.C.) is taken as the basis for the classification of commercial activities which, as noted above, unifies the analysis criteria to achieve a correct classification. The ISIC Rev.3 A.C. has a 4 digit coding system: each digit corresponds to the Section, Division, Group and Class respectively. The following table lists the 14 groups of goods of the MMCM with the coding that can be allocated according to the characteristics of merchandise traded.
11
Government agency chartered to provide vocational education to the Colombian workforce

Monthly Retail Trade Survey
Methodology-MMCM
CODE: TE-MMCM-TEM–01 VERSION: 02 PAGE: 12 DATE: 07-05-04
Table 1. Classification by merchandise groups (According to ISIC Rev. 3 A.C.)
Source: International Standard Classification – ISIC Rev.3 A.C.
i. Observation field
1. Observation unit
For the MMCM, observation unit is the same as statistical unit: a commercial business or commercial enterprise, located within the national territory, dedicated to the purchase and sale (or re-sale) of merchandise.
The commercial enterprise is defined as “the combination of activities and resources that a company carries out independently, for the re-sale (sale without transformation) of merchandise from a commercial location (retail store) or from an establishment or geographical zone. Independent data about the commercial enterprise is kept and it

Monthly Retail Trade Survey
Methodology-MMCM
CODE: TE-MMCM-TEM–01 VERSION: 02 PAGE: 13 DATE: 07-05-04
comprises information on purchases and sales, as well as for the average number of employed personnel, wages, salaries and benefits, involved in the marketing process”
12.
2. Universe of study It includes formally established business units, located within the national territory, whose main activity is retail trade, except for those engaged in maintenance and repair activities. Pawn shops, lottery outlets, telemarketing enterprises, companies engaged in sales by mail, as well as the trade of used goods are excluded from the universe of the study.
3. Target population Retail trade enterprises dedicated to the re-sale (sale without transformation) of goods, destined for consumption, personal or domestic use, located in the national territory. These enterprises must have annual sales revenues equal or exceeding 1.210 millions of Colombian pesos for the year 1997 and/or 20 or more employees.
ii. Reference Period The provided information corresponds to the month proceeding the one in which the information is collected and submitted. .
iii. Timeline The MMCM process consists of a series of activities previously programmed and conducted in a team environment by specialized and trained personnel in order to obtain optimum results. The timeline below shows a work forecast for the publishing of results for the month of November, in addition to the final evaluation which is generally done in the first week of December. Its aim is to determine the necessities of the research and subsequently make the necessary adjustments. Likewise, the timeline shows the maximum time limit to receive the updated framework (2
nd week of December), taking into
account that this is a continuous task which must be completed in the 2nd
week of January. In order to enable the monthly publication of the press bulletin (e.g. month of November) the forms are initially pre-filled in and then, the collection material is sent to all territorial branches within the maximum period of six days. In the following four weeks, the information is collected and at the same time the form is criticized, coded, and captured. In the last week of collection the capture is completed, the operation and new developments reports are created, and the material is sent to the DANE Central. During the following two weeks, the information received from all regional branches is consolidated and reviewed, and the final output tables are released, which are the principal components for the development of the press bulletin.
12
Ibíd.

Monthly Retail Trade Survey
Methodology-MMCM
CODE: TE-MMCM-TEM–01 VERSION: 02 PAGE: 14 DATE: 07-05-04
Table 2. Activity timeline of the Monthly Retail Trade Sample (E.g. Month of November)
No. RESPONSIBLE
TEAM
ACTIVITY NOVEMBER DECEMBER JANUARY
1 Committee Thematic committee
2 Statistical Methodology
Updated framework
3 Sampling design Update of the sample or adjustments to the sampling design
4 Log. Enterprises Pre-fill in of forms
5 Log. Enterprises Transfer of written material to Regional branches
6 Regional branches
Collection of information (November)
7 Regional branches
Critique, coding and capture (November)
8 Regional branches
Transfer of information to DANE Central
9 Enterprise logistics
Consolidation, review and creation of output tables (November)
10 Thematic and logistic
Analysis of results, review and adjustments to output tables
11 Thematic Press bulletin (November)
iv. Scope and limitations The coverage of the sample is national, due to the lack of updated frameworks which would enable the representation at the regional, department or city level . On the other hand, the sample was highly affected by trade dynamics, mainly of small establishments, as well as by the increase in establishments under liquidation or with an inactive status. Consequently,, it was decided that the units with personnel parameters and high income are to be included in the research(units of forced inclusion of the Annual Trade Survey (EAC by its acronym in Spanish)). In addition, according to the retail trade definition: "The re-sale (sale without transformation) of new goods or products destined for consumption, personal or household use…" marketing of used goods or products is not taken into account. In the same manner, all commercial activities at pawn shops, lottery outlets, mobile points of sale, telemarketing activities and homes with economic activity are excluded. Likewise, companies whose principal commercial activity are the maintenance and repair services related to trade are not part of the research.
v. Dissemination methods
The results of this research can be consulted through the Database and the Internet. DANE publishes the trade figures monthly in the following publications:
Website (www.dane.gov.co main observed variables, updated data)
Press bulletin or booklet
Situational indicators
“Bulletin of Statistics” and “Colombia Statistics”

Monthly Retail Trade Survey
Methodology-MMCM
CODE: TE-MMCM-TEM–01 VERSION: 02 PAGE: 15 DATE: 07-05-04
b. DESIGN
i. Design concepts
1. Target population Formally established business units, located in the national territory, dedicated to domestic retail trade, excluding those dedicated to repair and maintenance activities, commercial activities at pawn shops, lottery outlets, mail or telemarketing sales activities.
2. Variables of interest
Study variables: Sales, employed personnel, wages and salaries, cost of goods sold and inventories.
Classification variables: Personnel category, economic activity ISIC Rev. 3, and merchandise groups.
Calculated variables: Sales by square meters (ongoing indicator) and per capita wages and salaries.
3. Parameters to be estimated Total of the study variables, the disaggregation levels established for sales and personnel, and the per capita wages and salaries from which variations are calculated.
4. Coverage and disaggregation level
Geographical coverage: Nationwide.
Thematic coverage: Covers the enterprises with more than 20 employees and sales of over 1.210 millions of Colombian pesos in the year 1997, dedicated to retail trade activities, excluding those related to repair and maintenance, pawn shops, lottery outlets, mail or telemarketing sales activities.
5. Disaggregation levels The disaggregation levels, in which the figures are presented, depend on the study variables, as follows:
Sales: By merchandise groups and commercial classes.
Employed personnel: By categories.
Wages and salaries: Per capita and total.

Monthly Retail Trade Survey
Methodology-MMCM
CODE: TE-MMCM-TEM–01 VERSION: 02 PAGE: 16 DATE: 07-05-04
6. Statistical units
Sampling unit: All formally established business units (enterprises) located within the national territory with the domestic retail trade as a principal activity except for those dedicated to repair and maintenance activities, pawn shops, lottery outlets, mail and telemarketing sales activities.
Observation unit: Enterprises themselves.
Unit of analysis13
7. Reference Period It is the time period for which statistical information is gathered. . It comprises the 30 days of the researched month (n).
8. Collection period
It is the time span in which the enterprise provides the information to DANE. It corresponds to the month following the reference month (n+1).
1.2.2.1 Sampling framework
Given the coverage of the research, commercial enterprises with 20 or more employees or those enterprises that generated sales income equal or superior to 1.210 million Colombian pesos in the year 1997. The framework was based upon the forced inclusion of the 1997 Annual Trade Survey, whose main activity corresponds to division 52 of ISIC, Rev.3.
Filtering of the framework
The following process was performed in order to guarantee that the framework meets the minimum requirements, to ensure there will be no over-coverage, sub-coverage or repeated elements. First, by using the lists from the files provided by the Colombian tax and customs authority (DIAN by its acronym in Spanish), DANE’s Statistical Normalization Division extended the directory with the lists of enterprises which paid taxes for the accounting periods of 1997 and 1996. This file was provided by CONFECAMARAS (Chambers of commerce network) ,existing since 1995, with 103,215 records (which contains updates conducted on the operations of the Annual Trade Survey (EAC for its acronym in Spanish) and Services, mini-surveys and the telephone operation of 1998). In this way a total of 87,000 enterprises in the trade industry was obtained.
13
Corresponds to the different aggregation levels with which the results are presented. See sub-heading 1.2.1.5

Monthly Retail Trade Survey
Methodology-MMCM
CODE: TE-MMCM-TEM–01 VERSION: 02 PAGE: 17 DATE: 07-05-04
Later, a filtering process of the resulting set of enterprises was conducted, to capture the units that met at least one of the size requirements in order to be part of the framework for the new sample. Consequently, 1,020 enterprises were obtained which complied with at least one of the required parameters to fit the framework and whose main activity was retail trade. Through a telephone operation, information from the variables researched was acquired for 370 enterprises from which 115 eventually fulfilled the requirements. In the last stage, a final filtering was conducted by the Enterprise Logistics Team of the MMCM. Through a telephone operation, enterprises that complied with the established parameters were added to the research framework. In conclusion, the framework consists of 1,832 units drawn from the framework of DANE’s EAC/97 (collected in 1998) and 49 enterprises from the comparisons conducted with external files obtaining, in this way, a framework of 1,881 units for the MMCM for the period 2002-2003. To this day, a framework of 2,577 units has been obtained in the process of files updating.
1.2.2.2 Sampling design
The design of the sample is Probabilistic Stratified of Elements.
Probabilistic. The sampling units have a well-known probability of selection and it is greater than zero.
Stratified: The universe was organized in strata, characterized by its
homogeneity according to the following criteria:
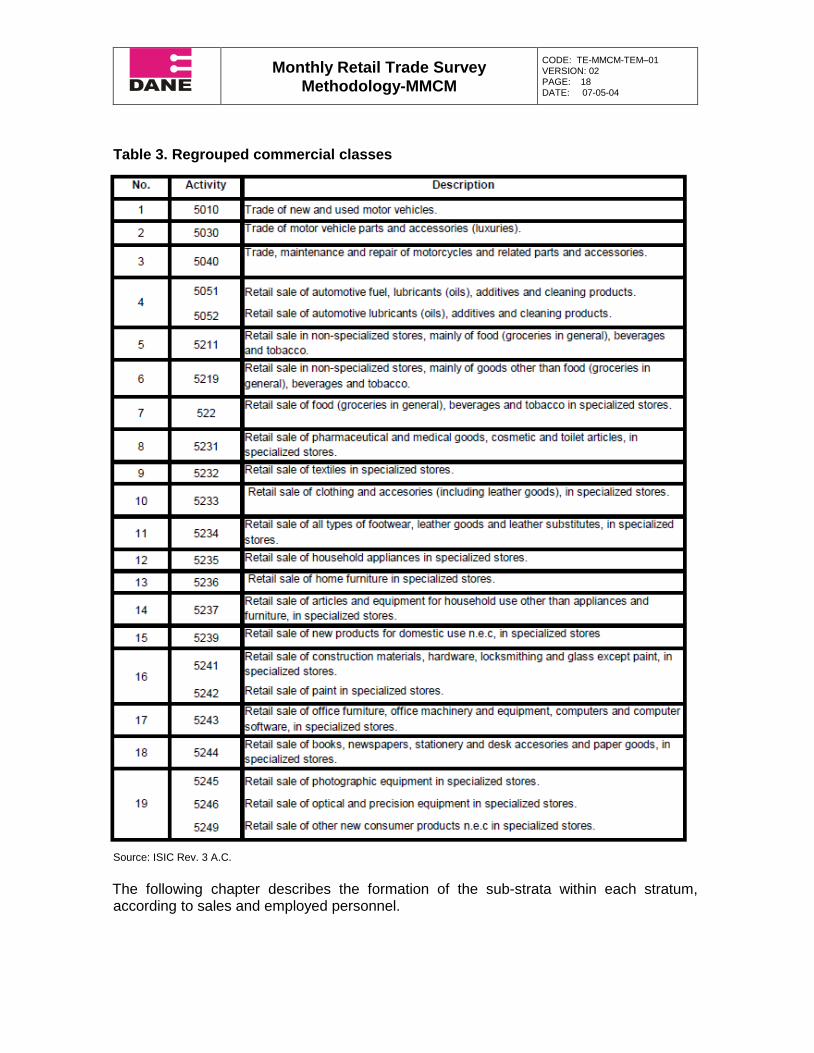
According to the code of the ISIC Rev. 3 A.C.
According to sales revenue and number of employed personnel. Following nineteen groups were formed according to the main economic activity: (See table 3).
Monthly Retail Trade Survey
Methodology-MMCM
CODE: TE-MMCM-TEM–01 VERSION: 02 PAGE: 18 DATE: 07-05-04
Table 3. Regrouped commercial classes
Source: ISIC Rev. 3 A.C.
The following chapter describes the formation of the sub-strata within each stratum, according to sales and employed personnel.

Monthly Retail Trade Survey
Methodology-MMCM
CODE: TE-MMCM-TEM–01 VERSION: 02 PAGE: 19 DATE: 07-05-04
Formation of the strata As previously mentioned, inside each of these groups considered as strata, sub-strata were formed using sales and employed personnel as criteria. The cluster classification method was used for the formation of the sub-strata in each of the commercial activities. This procedure enables to simultaneously group business units inside each activity based on two stratification variables. The method consisted of using the classification inside each activity, aiming to group business units which are most similar according to their variables, sales income and employed personnel (the groups formed using this method are the strata in which the commercial activity was subdivided). The classification technique builds mutually very homogeneous and heterogeneous groups, ensuring in this way one of the main requirements of a good stratification. In the construction of strata inside every commercial activity, a stratum of forced inclusion and another of probabilistic inclusion were defined, depending on the economic activity. Units of forced inclusion are those which are eliminated from the classification procedure (stratification), because they have very different information from the rest of the units of the framework with respect to the variables of stratification. The sole purpose is to reduce the variance within the strata that divides each of the research sub-populations (commercial activities). In particular, all department stores are units of forced inclusion. The remaining units from the universe of study, not included in the stratum of forced inclusion, were classified in the probabilistic inclusion strata. The classification procedure was implemented on the units of probabilistic inclusion inside the commercial activity, until achieving the most appropriate stratification; this was constructed taking into account the following parameters of the stratified sampling: Given that a minimum variance is required inside each stratum, in order to achieve an efficient stratification in each cluster (stratum) accomplished by the classification method, the variance to control the efficiency of accomplished stratification was estimated. The variance of the stratification variables average of the (sales income and employed personnel) within each stratum for the commercial activity was estimated as follows:
)( hYV2
22
1
j
h
hh
h
h
N
n
SN
N
n
Where:
)( hYV : Stratum contribution to the combined variance of the income variable.
nh : Sample size set (optimum allocation) for stratum h.

Monthly Retail Trade Survey
Methodology-MMCM
CODE: TE-MMCM-TEM–01 VERSION: 02 PAGE: 20 DATE: 07-05-04
Nh : Population size of the stratum.
jN : Size of the commercial activity j.
2hS : Stratification variable variance (sales income or employed personnel).
In addition, stratified variable variance in the commercial activity was estimated as follows:
And the relative error of the stratified variable:
Y
ZYVsee
est
1)(..
Where:
)(ˆ estYV : Stratified variable variance within the activity.
Z1 : Value of the 1 percentile of the normal distribution. (In this case 005. value was taken in order to assure a 95% reliability of the sample).
Y : Average value of the population, including the units of forced inclusion for the estimation. As it can be observed, it was necessary to assign a sample size for each stratum in order to find the variance; the sample size was assigned with information a priori (empirical information of the best sample size inside each commercial activity) and was allocated optimally. For this, the functional form of optimal allocation was used:
n nN
Nh
h h
h hI
H
1
Where:
nh : Is the sampling size corresponding to stratum h. n : It is a population sample size chosen a priori from what is known from previous researches. An approximate size of 20% of the population size of the class was chosen within each class for this case.
Nh : Is the population size of stratum h.
h : It is the population standard deviation of the variable in stratum h.
In this way, by assigning a sample size inside each stratum, formed according to the classification method, a value of the variance was obtained, thus enabling to observe the
h
hest YVYV )()(

Monthly Retail Trade Survey
Methodology-MMCM
CODE: TE-MMCM-TEM–01 VERSION: 02 PAGE: 21 DATE: 07-05-04
error found for the group achieved by the classification method. The classification procedure was executed as many times as necessary until a relative error of about 5% with an optimum sample allocation inside the strata was obtained. The inside strata design is always Simple Random Sampling (MAS by its acronym in Spanish). The final formation of the strata is presented in the document DM-MMCM-TAB-04
14 (conformation of strata and the sample size).
1.2.2.3 Sample size The sample size for each commercial activity was obtained through a process of variation within each activity; in this procedure, a desired sample size was assigned for all commercial activities (a priori sample size), then the commercial activity was subjected to the stratification procedure within each stratum and the sample size was assigned through optimal allocation. Subsequently, the relative error was estimated with a 95% confidence level as well as the variance inside each commercial activity. It was expected that the sample size assigned to each commercial activity complied with the stipulated error and confidence restrictions so it could be considered as an acceptable sample size (maximum relative error of 5% and 95% reliability). If this sample size did not meet such conditions, having a predetermined level of confidence, it was decreased or increased according to the end result of the obtained error; if the error was very large, the sample size was increased and if the error was very small, this result gave the opportunity to increase the sample size a little more (if needed) for the commercial activity, and so on, until obtaining the sample size with the desired efficiency. The final sample size is presented in the document DM-MMCM-TAB-04 (conformation of strata and sample size)
1.2.2.4 Design and selection of the sample There are two main forms selecting the sampling units.
Sampling units with probability of selection equal to one or of forced inclusion. Units of forced inclusion are selected because of two important reasons: Firstly, because department stores are also included in the retail trade research and separate information is required for these units, and secondly, to reduce the variance inside commercial activity strata. In order to identify these units, prior to the classification procedure (stratification), the business units were listed and sorted not only according to the income but also employed personnel, so the units with the highest scores within the value ranges of the variables in each commercial activity could be identified. These units were not part of the stratification procedure and became part of the units of forced inclusion.
14
DANE. Sampling Design – Monthly Retail Trade Sample – Tabulate 4
Monthly Retail Trade Survey
Methodology-MMCM
CODE: TE-MMCM-TEM–01 VERSION: 02 PAGE: 22 DATE: 07-05-04
A new analysis was performed with the units subjected to the stratification procedure; aiming to see if there were unacceptable variances within the strata (which implies that the error is very large), given by any business unit(s), whereby these were also considered unit(s) of forced inclusion.
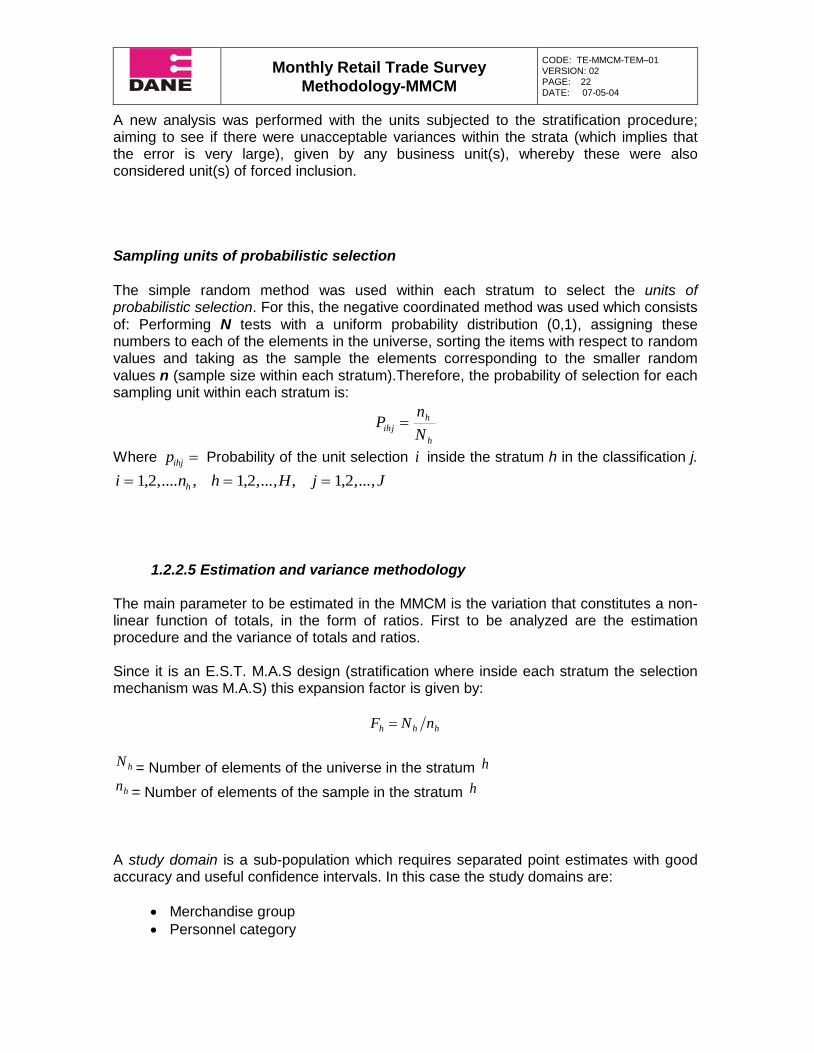
Sampling units of probabilistic selection
The simple random method was used within each stratum to select the units of probabilistic selection. For this, the negative coordinated method was used which consists
of: Performing N tests with a uniform probability distribution (0,1), assigning these numbers to each of the elements in the universe, sorting the items with respect to random values and taking as the sample the elements corresponding to the smaller random
values n (sample size within each stratum).Therefore, the probability of selection for each sampling unit within each stratum is:
h
h
ihjN
nP
Where pihj Probability of the unit selection i inside the stratum h in the classification j.
i n h H j Jh 1 2 1 2 1 2, ,.... , , ,..., , , ,...,
1.2.2.5 Estimation and variance methodology The main parameter to be estimated in the MMCM is the variation that constitutes a non-linear function of totals, in the form of ratios. First to be analyzed are the estimation procedure and the variance of totals and ratios. Since it is an E.S.T. M.A.S design (stratification where inside each stratum the selection mechanism was M.A.S) this expansion factor is given by:
hhh nNF
hN = Number of elements of the universe in the stratum h
hn = Number of elements of the sample in the stratum h A study domain is a sub-population which requires separated point estimates with good accuracy and useful confidence intervals. In this case the study domains are:
Merchandise group
Personnel category

Monthly Retail Trade Survey
Methodology-MMCM
CODE: TE-MMCM-TEM–01 VERSION: 02 PAGE: 23 DATE: 07-05-04
Economic activity
Where the Zdk variable is defined as:
Z1 si k U
0 si k U dk
d
d
Where: k = Business unit Ud = Domain d Then
z NdkU d
Where Nd = The unknown number of elements in the universe which belong to domain d Now, for the variable:
dkdkdk zxy *
kx
= is the quantitative variable of interest and is observed in the sample. Under the stratified sampling design, The total of a domain is:
dt = total of variable x in domain d
Parameter
U dkd xt
Estimator With
H
1=h
h
1
F=
ˆ
h
h
m hdk
dm
H
h
dhd
y
yNt
Monthly Retail Trade Survey
Methodology-MMCM
CODE: TE-MMCM-TEM–01 VERSION: 02 PAGE: 24 DATE: 07-05-04
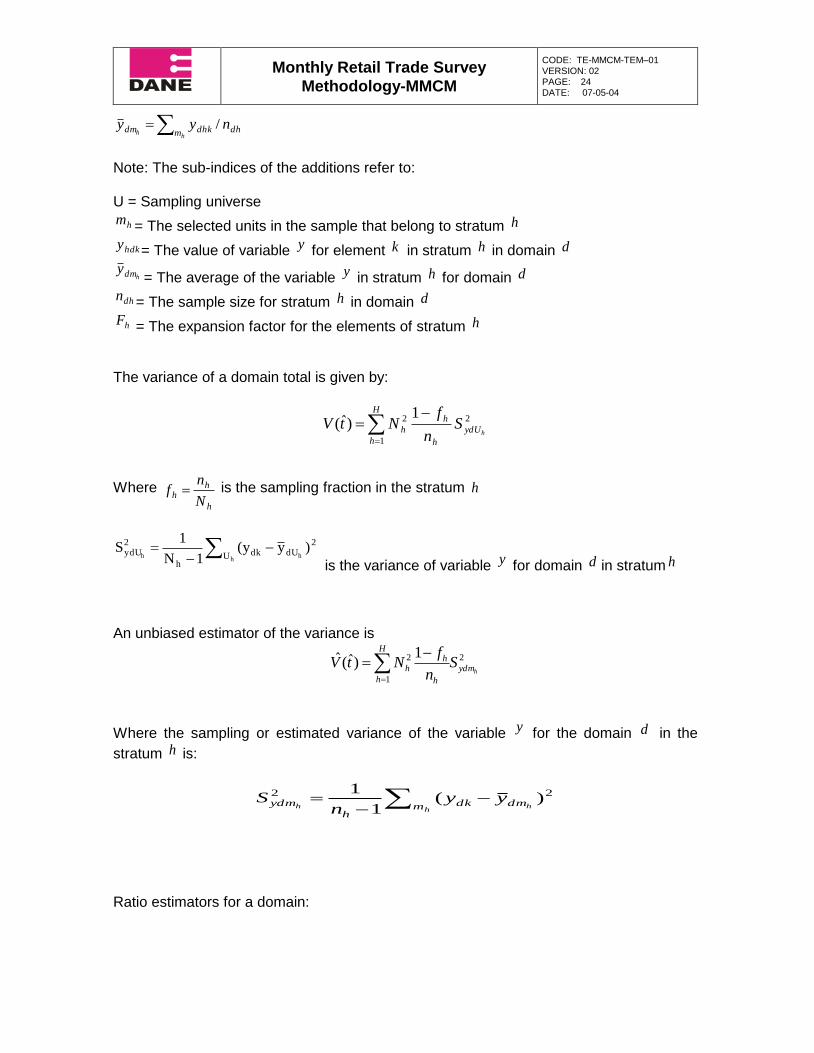
h
h m dhdhkdm nyy /
Note: The sub-indices of the additions refer to: U = Sampling universe
hm = The selected units in the sample that belong to stratum h
hdky = The value of variable y for element k in stratum h in domain d
hdmy= The average of the variable y in stratum h for domain d
dhn = The sample size for stratum h in domain d
hF = The expansion factor for the elements of stratum h
The variance of a domain total is given by:
1)ˆ( 2
1
2
hydU
h
hH
h
h Sn
fNtV
Where h
hh
N
nf is the sampling fraction in the stratum h
h
hh U
2dUdk
h
2ydU )y(y
1N
1S
is the variance of variable y for domain d in stratum h An unbiased estimator of the variance is
2
1
2 1)ˆ(ˆ
hydm
H
h h
hh S
n
fNtV
Where the sampling or estimated variance of the variable y for the domain d in the
stratum h is:
h
hh m dmdk
h
ydm yyn
S 22 )(1
1
Ratio estimators for a domain:

Monthly Retail Trade Survey
Methodology-MMCM
CODE: TE-MMCM-TEM–01 VERSION: 02 PAGE: 25 DATE: 07-05-04
A ratio estimator for a domain has the form
dx
dy
t
tR
Where
dyt Is the total of variable y in domain d
dxt Is the total of variable x in domain d And the estimator is
dx
dy
t
tR
ˆ
ˆˆ
dyt Is the estimated total of variable y in domain d
dxt Is the estimated total x in domain d
The variance of the ratio estimator Given that the ratio estimators are nonlinear functions of totals, its estimator is biased although with a not very large relative bias; the approximate variance of the ratio estimator is given by:
H
h
yxUdhdyUdhdxUdh
hUd
hd SRSRS
nx
fRAV
1
222
22
11)ˆ(
With
22 1
hU dUhdk
h
xUdh xxn
S
= The population variance of variable x for domain d in
stratum h .
22 1
hU dUhdk
h
yUdh yyn
S
= The population variance of variable y for domain d in
stratum h .
hU dUhdkdUhdk
h
xyUdh yyxxn
S12
= The population covariance of variables x y for
domain d in stratum h .
Ratio estimator variance:
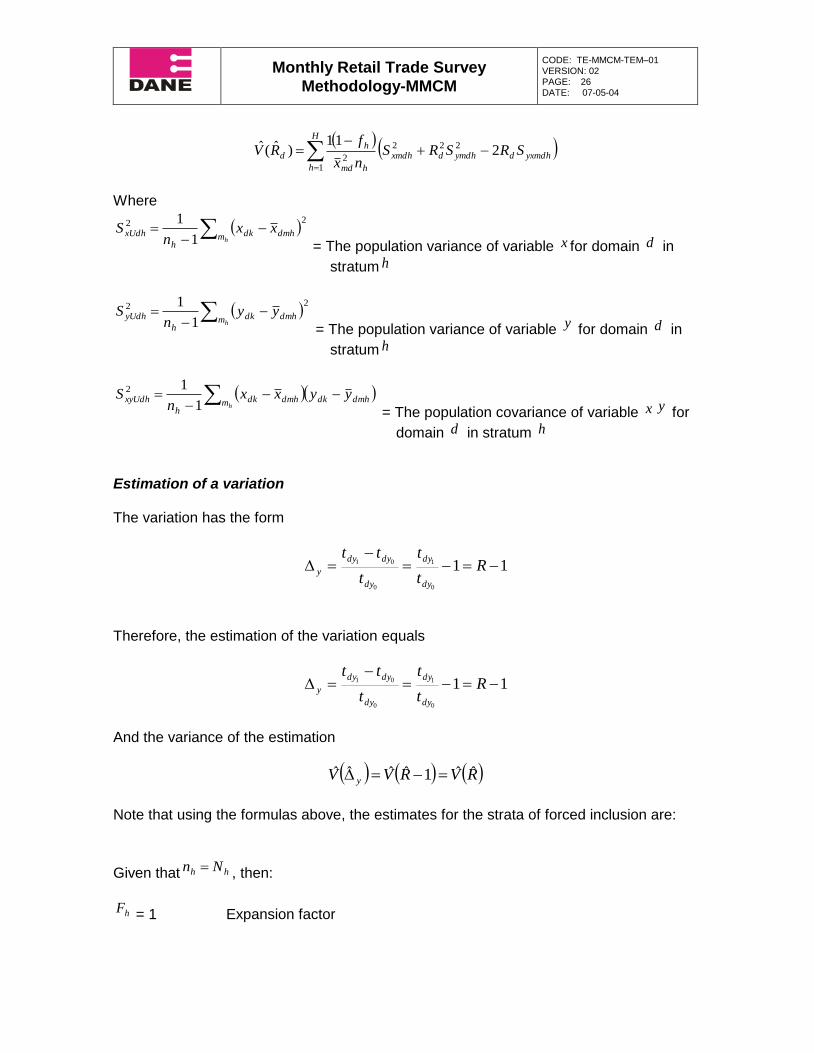
Monthly Retail Trade Survey
Methodology-MMCM
CODE: TE-MMCM-TEM–01 VERSION: 02 PAGE: 26 DATE: 07-05-04
H
h
yxmdhdymdhdxmdh
hmd
hd SRSRS
nx
fRV
1
222
22
11)ˆ(ˆ
Where
22
1
1
hm dmhdk
h
xUdh xxn
S
= The population variance of variable x for domain d in
stratum h
22
1
1
hm dmhdk
h
yUdh yyn
S
= The population variance of variable y for domain d in
stratum h
hm dmhdkdmhdk
h
xyUdh yyxxn
S1
12
= The population covariance of variable x y for
domain d in stratum h
Estimation of a variation The variation has the form
11
0
1
0
01
Rt
t
t
tt
dy
dy
dy
dydy
y
Therefore, the estimation of the variation equals
11
0
1
0
01
Rt
t
t
tt
dy
dy
dy
dydy
y
And the variance of the estimation
RVRVV yˆˆ1ˆˆˆˆ
Note that using the formulas above, the estimates for the strata of forced inclusion are:
Given that hh Nn , then:
hF = 1 Expansion factor

Monthly Retail Trade Survey
Methodology-MMCM
CODE: TE-MMCM-TEM–01 VERSION: 02 PAGE: 27 DATE: 07-05-04
k
kyy
Total
0)ˆ(ˆ yV Variance
Estimated coefficient of variation
Criteria for handling the variation coefficients
The coefficient of variation is an important criterion for determining the estimation quality. When the magnitude of the variability of the estimated parameters is very large, it loses applicability. In other words, the true value of the parameter, in the universe, can be in a very wide range, which will not provide useful information. This coefficient is a standard indicator to determine the accuracy of an estimator, which is defined as the quotient between the standard error of the estimator and the estimator in percentage terms. Therefore, the estimated coefficient of variation is given by
100*)ˆ(
)ˆ(ˆˆ
Vvc
The result of an estimation is usually regarded as very good if its coefficient of variation is less than 5%; as good if it is between 5% and 10%; acceptable if it is greater than 10% but less than 15%, and of restricted use if it is greater than 15%.
The samples are designed in order to obtain estimates with a precision which is initially established, according to the economic activity or study domain for the income variables and employed personnel. Any other disaggregation level or estimated parameter is likely to have a not necessarily accurate precision, therefore the datum is unreliable.
1.2.2.6 Novelty management Novelties are circumstances registered during the information collection period by the business units that are part the sample and which affect the estimation of the parameters. Novelty management must be taken into account at various stages of the research, but especially during the estimation procedure and sample update. Annex F lists the definitions of the novelties handled in the domestic trade researches; it also describes the procedures to be followed during the field operation and information collection stages, the exclusions and special cases. Note that as long as the sample isn’t updated, the business units cannot be replaced, nor can their class or stratum be altered, even when the information provided allows the replacement.

Monthly Retail Trade Survey
Methodology-MMCM
CODE: TE-MMCM-TEM–01 VERSION: 02 PAGE: 28 DATE: 07-05-04
1.2.2.7 Maintenance of the sample Maintenance of the sample depends in great part on the framework update, given the constant dynamics of the sector (taking as dynamics the deaths and births of business units), continuous update of the sampling framework must be carried out in order to achieve high level of accuracy in the sampling information. Maintenance of the sample consists of:
Checking periodically the efficiency of the sampling design employed, using data from the same survey.
Retaining a sample size which is adequate to obtain the precision required in the estimations by domains.
Replacing dead research units: Commercial units which are liquidated, merged, unreachable for a long time, etc.
If necessary, adjusting the expansion factors to the existing dynamics.
Taking decisions depending on the movements that occur inside the sample, given the circumstances that the research units could register. These may be: Fused units, split units, and lastly new units that are feasible to be included in the research.
The advised updating procedure of the sample is the one recommended by Kish
15 This
procedure guarantees that the new rearrangement or redesign of the sample will not only maintain the desirable parameters to keep the design of the previous sample, the, but also preserve comparability with the information previously collected, since it guarantees the preservation of information of the units that had already been researched. Maintenance periodicity: It must be performed continuously, according to the economic dynamics and through conducting follow-ups to have certainty of the new development presented. In addition, the estimated coefficient of variation (C.V.E. by its acronym in Spanish) given by the research must be checked and the need for updating must be evaluated given the observed levels of quality. Through the collection process, it has been observed that the retail trade sector is rather dynamic, demonstrating a sample loss of around 35% in the period between 1999-2001, which is why it was decided to make a sampling addition in order to improve the precision of the estimates. In the year 1999, 414 units were researched and since 2002, 627 units have been part of the research.
15
Kish, Leslie, Cap. 12, P. 558.

Monthly Retail Trade Survey
Methodology-MMCM
CODE: TE-MMCM-TEM–01 VERSION: 02 PAGE: 29 DATE: 07-05-04
1.2.2.8 Statistical analysis methods Correlative The MMCM presents the evolution of sales, employment and remunerations of the retail trade enterprises selected for this research. For this purpose, sales information is presented for the total without fuels, total without fuels or vehicles, by homogeneous merchandise groups, and by commercial activity ISIC Rev 3 A.C., for total employment and by modality of contract, and for average and total wages and salaries. The following table shows the merchandise groups which are being researched for the sales variable, and the economic activities that correspond to each of these fourteen groups. In other words, the table shows a correlative between homogeneous groups of merchandise and commercial activity.
Table 4. Homogeneous groups of merchandise and retail trade activity.
Source: DANE ** ISIC Revision 3 A.C.
Comparison of correlative tables of merchandise groups
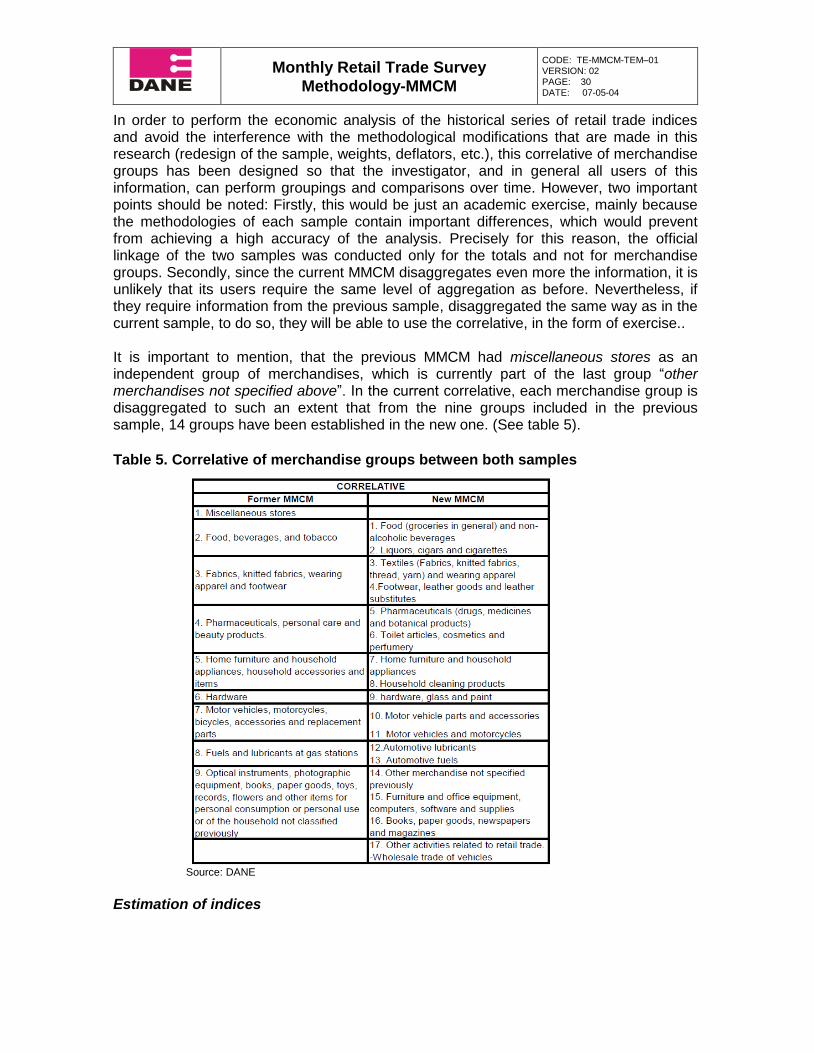
Monthly Retail Trade Survey
Methodology-MMCM
CODE: TE-MMCM-TEM–01 VERSION: 02 PAGE: 30 DATE: 07-05-04
In order to perform the economic analysis of the historical series of retail trade indices and avoid the interference with the methodological modifications that are made in this research (redesign of the sample, weights, deflators, etc.), this correlative of merchandise groups has been designed so that the investigator, and in general all users of this information, can perform groupings and comparisons over time. However, two important points should be noted: Firstly, this would be just an academic exercise, mainly because the methodologies of each sample contain important differences, which would prevent from achieving a high accuracy of the analysis. Precisely for this reason, the official linkage of the two samples was conducted only for the totals and not for merchandise groups. Secondly, since the current MMCM disaggregates even more the information, it is unlikely that its users require the same level of aggregation as before. Nevertheless, if they require information from the previous sample, disaggregated the same way as in the current sample, to do so, they will be able to use the correlative, in the form of exercise.. It is important to mention, that the previous MMCM had miscellaneous stores as an independent group of merchandises, which is currently part of the last group “other merchandises not specified above”. In the current correlative, each merchandise group is disaggregated to such an extent that from the nine groups included in the previous sample, 14 groups have been established in the new one. (See table 5).
Table 5. Correlative of merchandise groups between both samples Source: DANE
Estimation of indices
Monthly Retail Trade Survey
Methodology-MMCM
CODE: TE-MMCM-TEM–01 VERSION: 02 PAGE: 31 DATE: 07-05-04
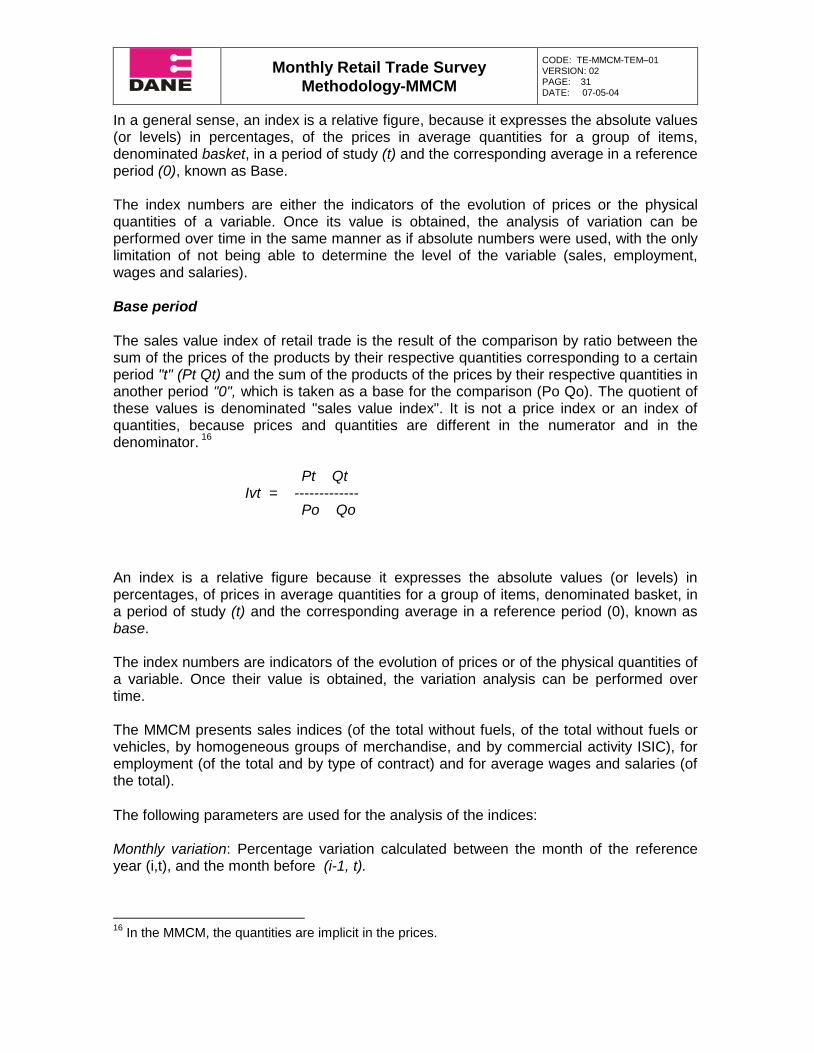
In a general sense, an index is a relative figure, because it expresses the absolute values (or levels) in percentages, of the prices in average quantities for a group of items, denominated basket, in a period of study (t) and the corresponding average in a reference period (0), known as Base. The index numbers are either the indicators of the evolution of prices or the physical quantities of a variable. Once its value is obtained, the analysis of variation can be performed over time in the same manner as if absolute numbers were used, with the only limitation of not being able to determine the level of the variable (sales, employment, wages and salaries).
Base period
The sales value index of retail trade is the result of the comparison by ratio between the sum of the prices of the products by their respective quantities corresponding to a certain period "t" (Pt Qt) and the sum of the products of the prices by their respective quantities in another period "0", which is taken as a base for the comparison (Po Qo). The quotient of these values is denominated "sales value index". It is not a price index or an index of quantities, because prices and quantities are different in the numerator and in the denominator.
16
Pt Qt Ivt = ------------- Po Qo An index is a relative figure because it expresses the absolute values (or levels) in percentages, of prices in average quantities for a group of items, denominated basket, in a period of study (t) and the corresponding average in a reference period (0), known as base. The index numbers are indicators of the evolution of prices or of the physical quantities of a variable. Once their value is obtained, the variation analysis can be performed over time. The MMCM presents sales indices (of the total without fuels, of the total without fuels or vehicles, by homogeneous groups of merchandise, and by commercial activity ISIC), for employment (of the total and by type of contract) and for average wages and salaries (of the total).
The following parameters are used for the analysis of the indices: Monthly variation: Percentage variation calculated between the month of the reference year (i,t), and the month before (i-1, t).
16
In the MMCM, the quantities are implicit in the prices.

Monthly Retail Trade Survey
Methodology-MMCM
CODE: TE-MMCM-TEM–01 VERSION: 02 PAGE: 32 DATE: 07-05-04
Annual variation: Percentage variation calculated between the month of the reference year (i, t), and the same month of the previous year (i, t-1). Cumulative variation year to date: Percentage variation calculated between the period elapsed from January until the reference month of the year, (January until i,t) and, the same period elapsed in the previous year (January until i, t-1). Cumulative annual variation: percentage variation calculated between the period elapsed from the last twelve months up to the reference month of the year, and the same period elapsed in the previous year (twelve months until the month of reference year t / twelve months until reference month year t-1). The indices were calculated as follows: Having defined the base year for comparison, which for the monthly retail trade sample was 1999, a simple average of the year for the expanded value of each variable is generated as follows:
Average =
9912
112
1lvp
i
Where, vpl99: Is the average of the total value expanded in 1999 of each variable (sales for each one of the 16 groups, for each commercial activity, employment and average wages and salaries) In order to find the index for each month, a relation between the absolute expanded value of each variable for each month and the average of 1999 of this same variable is calculated:
99
12
1vpl
veIv t
t
To find this same index, the chained Laspeyres formula can be used:
)1(
)1(
t
ttt
ve
veIvIv
Where: Ivt: Value index of the variable. vet: Sum of the expanded value of each variable in month "t".

Monthly Retail Trade Survey
Methodology-MMCM
CODE: TE-MMCM-TEM–01 VERSION: 02 PAGE: 33 DATE: 07-05-04
It is important to note that the MMCM indices are not cumulative, they are in fact independent between periods. For this reason, when the variations for these indices are constructed it must be taken into account how the periods are conformed. For sales and average wages and salaries, nominal and real indices are generated (deflated by their respective indices). Weighting system
To calculate the index of the total sales value, first it is necessary to establish the true importance or relative weighting that each merchandise group has in the total sales of the sector in the final consumption of goods. (See table 6).
Weighting factors are used due to the fact that the research was designed to show the evolution of trade through the selection of a representative sample of enterprises for each retail trade activity.
Indeed, there is a high precision of information which is published about sales by merchandise groups and by commercial activity ISIC Rev. 3. However, during the estimation of the total trade sales and without using weighting factors, estimation will be determined by the implicit weight presented by sales from each group of merchandise in the sample for each period (structure of sales of enterprises). For this reason, it is much more accurate to use a structure that determines the true importance of each group of merchandise in households’ goods expenditure. This is why the weighting system from the 1994-1995 income and expenditure survey (ENIG by its acronym in Spanish) is used, which enables more precise distribution of households’ goods expenditure.
The weighting factors are used to calculate: The sales total (nominal and real) of retail trade without fuels, and the sales total (nominal and real) of retail trade without fuels or vehicles. (See table 6)

Monthly Retail Trade Survey
Methodology-MMCM
CODE: TE-MMCM-TEM–01 VERSION: 02 PAGE: 34 DATE: 07-05-04
Table 6. Relative weighting of each merchandise group Source: DANE –1994-95 ENIG Deflator indices Deflator indices are a tool used to remove the effect of prices alterations on the nominal values (current) and build series expressed in homogeneous units comparable in time. The nominal values are deflated by indices to obtain real or constant values. Deflators are used because it is important to know the increments in sales (real or in quantities), not the increments in prices.

Monthly Retail Trade Survey
Methodology-MMCM
CODE: TE-MMCM-TEM–01 VERSION: 02 PAGE: 35 DATE: 07-05-04
In order to obtain the sales in actual prices of this research, it was necessary to form a basket for the fourteen merchandise groups which are included in the research. This was done according to the evolution of prices of these groups and the consumer price index (CPI) and the producer price index (PPI). Since the enterprises generally carry out their salary adjustments with information from the CPI, the national total from this index is used to deflate real salaries and wages.
Table 7. Deflators by merchandise groups
Linking methodology The need for more accurate, reliable and timely data, with regards to the evolution of retail trade, forced to redesign the former MMCM. In this sense, important changes were made, some of the most important are: a new unit of observation, greater coverage of
Monthly Retail Trade Survey
Methodology-MMCM
CODE: TE-MMCM-TEM–01 VERSION: 02 PAGE: 36 DATE: 07-05-04
sources and information, analysis by ISIC activity, and a new system of weights and deflators. The new methodology took effect in January of 1999 and this is why it is necessary to link this new series with the series obtained with the former methodology. Taking into account what is mentioned above and considering that major changes were made to the calculation methodology, since the linkage of the series has shown conceptual limitations (disaggregation among others), it was settled that the series could only be linked for:
Sales total without fuels.
Sales total without fuels or vehicles.
Average employment total.
Linking procedure On the other hand, the conceptual difference is much more noticeable in the calculation of average salaries, which is why this variable was not linked. This difference lies mainly in the fact that the previous Retail Trade Sample included benefits generated in the calculation of this indicator, whilst the new Retail Trade Sample does not include them; it only analyzes information on generated wages and salaries. Given the above, the linkage calculation of the two samples was performed as follows: The average of the 1999 indices total of the previous sample for each of the variables to be linked was calculated. With this average, an adjustment factor was obtained, calculated as:
100 / (index average) = adjustment factor
Then, this adjustment factor is multiplied for all the indices of the previous sample (from January 1989 to December 1998), thus, the indices prior to 1999 are linked for the totals.
Linkage limitations The use of extensive series of information by different users would imply performing a linkage, not only of the totals, but at all levels, in order to be able to reconstruct historical behaviors adapted to the new methodology. However, as mentioned earlier, the major differences between the two methodologies make it impossible to reach, at least with medium accuracy, at the linkage level with the desired level of details. The closest that could be reached, would be to perform an academic exercise using a correlative that shows how to relate the nine groups that were previously researched with the sixteen groups currently being researched, where the current weighting factors to add or disaggregate levels would be applied.

Monthly Retail Trade Survey
Methodology-MMCM
CODE: TE-MMCM-TEM–01 VERSION: 02 PAGE: 37 DATE: 07-05-04
For this reason, the linkages of the totals mentioned above are presented in document
TE-MMCM-TAB-0317
.
1.2.2.9 Data collection instruments
The MMCM information is obtained through the unique form is used in the entire country, which consists of a header and four chapters. However, to compile the information of the companies that trade motor vehicles, parts and accessories, fuels and lubricants, a unique form has also been designed denominated Monthly Sample of Motor Vehicles Trade and Retail Trade of Their Parts, Accessories, Fuels and Lubricants, whose results are published on a quarterly basis, but which enables the MMCM to publish monthly information (privately owned vehicles, trucks, motorcycles, off-road vehicles) related to the trade of vehicles.
Form structure (MMCM)
Consists of a header and four chapters described bellow (See also the annex D):
Header: Contains control data such as sequence number, activity code, department, municipality and the enterprise’s Tax Identification Number (NIT by its acronym in Spanish) (comes pre-filled out).
Chapter I. Identification and general information: Refers to the enterprise location data, which is of great importance for the update of directories and location of the source in the field operations (comes partially pre-filled out).
Sales Area (m2): This indicator is designed to measure the effectiveness of the sales area, from the point of view of the level achieved by each square meter dedicated to the display of goods. The areas intended for concessions, storage, offices, parking zones, cafeterias, restaurants, bathrooms and other service areas are not included.
Chapter II. Sales in the month: The value of sales must be recorded, expressed in thousands of Colombian pesos, without indirect taxes (Value Added Tax and consumption tax) for each group of merchandise traded by the company during the month. Also, the percentage of the internet sales share must be evidenced. Sales records correspond to net sales, which are equivalent to sales less (-) discounts, offers and others.
Chapter III. Inventories and cost of goods sold: The initial and final value of inventories of each month and the value of the cost of the goods sold is inquired. These values should be recorded in thousands of Colombian pesos, without indirect taxes (VAT and consumption taxes).
Chapter IV. Average employed personnel, wages, salaries and social benefits
17
DANE. Economic Thematic – Monthly Retail Trade Sample – Tabulate 3

Monthly Retail Trade Survey
Methodology-MMCM
CODE: TE-MMCM-TEM–01 VERSION: 02 PAGE: 38 DATE: 07-05-04
generated in the month: In this chapter, it is required to give information about the average number of individuals employed by the company during the month, disaggregated by type of contract. Similarly, it is requested to give information about the total value of wages, salaries and social benefits generated by the given personnel, disaggregated by type of contract. Social benefits correspond to those generated during the period, not the paid ones nor provisioned.
After this chapter there is a space destined to make comments, either by the person responsible for supplying enterprise information or by those who review and criticize such information. These observations can be a complement or clarifications of the data entered in the form and therefore are of great importance.
Other complementary sections of the form are the boxes where the processing date, the information of the person who fills out the form and the information of the person responsible for the company is entered.
Structure of the Trade of Motor Vehicles, Parts and Accessories and Fuels and
Lubricants form. The same information as in the Trade Form is requested for the identification chapters (chapters I and IV) and for the average employed personnel (chapters I and V). The remaining chapters correspond to the following information:
Chapter II. Sales of motor vehicles: the objective of this chapter is to know the sales of motor vehicles taking into account its type, its origin, whether they are new or used, both in units and in values (thousands of Colombian pesos).
Chapter III. Sales of parts, pieces and accessories for motor vehicles: this chapter gives information on the monthly evolution of sales of parts, pieces, and (luxury) accessories exclusively for motor vehicles. It includes retail trade of batteries, tires and pneumatics for all types of motor vehicles. In addition, it also establishes the percentage of the internet sales share. This information must be recorded in thousands of Colombian pesos, excluding VAT.
Chapter IV. Sales of fuels and lubricants for motor vehicles: in this chapter, the total value of the monthly sales of fuels (regular and super gasoline, Diesel and natural gas) must be recorded; also, lubricants, additives and cleaners for all types of motor vehicles. The information must be supplied in thousands of Colombian pesos, excluding VAT and any national, departmental or municipal taxes and surcharges; the volume (gallons or cubic meters) must also be given. The percentage of sales of lubricants, additives and cleaning products sold via internet must also be indicated.
Collection manual There are two collection manuals; one for trade and the other one for vehicles. Both manuals are designed to provide guidelines to the person inside the enterprise responsible for providing information for the correct completion of the form. This form

Monthly Retail Trade Survey
Methodology-MMCM
CODE: TE-MMCM-TEM–01 VERSION: 02 PAGE: 39 DATE: 07-05-04
contains the same chapters as the questionnaire. Special cases or explanations not covered in these manuals may be consulted with the research coordinator at DANE Central at the Methodology and Statistical Production Division (DIMPE for its acronym in Spanish), enterprise logistics team
18.
1.2.2.10 Distribution method of forms
Distribution
The methods used to distribute the collection material of the sample are:
Certified mail used especially when the sources are located outside of the urban perimeter of the DANE’s offices.
Personal delivery by a DANE’s official, with pre-established routes which enable to distribute the forms in a short amount of time.
Making the appointment over the phone for a meeting between the source and the critic at DANE’s territorial branches or auxiliary offices.
Material delivered to the source:
If the enterprise is new to the sample directory: presentation letter, original and copies of forms and collection manual.
If the enterprises already in the sample directory: originals and copies of the forms are delivered periodically for each month in the collection process, and the collection manuals are updated according to adjustments made in the form design .
1.2.2.11 Field operation design at territorial branches The territorial branches receive the forms for the month which should be processed from the Enterprise Logistics team, along with the directory of sources (list of enterprises to visit) at every stage of collection; the technical assistant establishes the workloads according to personnel. The collector-critic has the following material: forms pre-filled out and verified checklist of delivery and checklist of visits according to the directory of enterprises. The collector-critic sets the appointments with the enterprises according to the dates established in the chronogram of activities.
18 (See the following manuals: “Manual de diligenciamiento de la Muestra Mensual de Comercio al por Menor” y “Manual de diligenciamiento de la Muestra Mensual de Comercio de Vehículos Automotores y Comercio al por Menor de sus partes, accesorios, combustibles y lubricantes” (Fill out manual of the MMCM and fill out manual of the MMCM of motor vehicles, parts, accessories, fuels and lubricants).

Monthly Retail Trade Survey
Methodology-MMCM
CODE: TE-MMCM-TEM–01 VERSION: 02 PAGE: 40 DATE: 07-05-04
1.2.2.12 Quality specifications, operation and capture control, filtering and
processing of information.
Operation control This control is done permanently, through the reports generated by the processing system of the research. The aspects to verify are: coverage, new developments and debts from the sources that are part of the directory of the field operation each month.
Receiving at the territorial branches
The collection of the information from the enterprises comprising the sample is done through six DANE’s territorial branches, during the period of forty (40) days, starting from the end of the reference month. This is due to the fact that the majority of companies are closing their accounting periods at the end of the month following the month of reference.
In the cases of enterprises of forced inclusion in debt, DANE must find motivation mechanisms for collaboration in the delivery of information before generating definitive figures.
In order to process of information in the first four months of each year, delays exceeding the average delays of other months in the timely delivery of the information from source enterprises must be foreseen, due to situations such as: overwork of the accountants due to inventories, balances, preparation and presentation of reports to partners or the company; development and delivery of financial statements to the “Superintendencia de Sociedades” (Superintendence of Corporations) and to the “Dirección de Impuestos y Aduanas Nacionales” (The Colombian tax and customs authority), presentation of the simplified balance to the Chamber of Commerce; delivery of the personnel records and hours worked to “Ministerio del Trabajo de la Republica de Colombia” (Colombia’s Ministry of Labour); detailed presentation to the Municipal Treasury of sales made in the year. Collection of the information usually returns to normal in mid May.
Identification data and location of the establishment, as well as all other variables of the directory, are confirmed directly with the informant.
During this process, the overall consistency of the information is verified; this is done by comparing variables between chapters and within them.
Information critique and capture at the territorial branches
The critique is always performed with the form of the month in process and the forms from previous months, when the need to make adjustments to previous months arises, it requires prior verification and consultation with the reporting

Monthly Retail Trade Survey
Methodology-MMCM
CODE: TE-MMCM-TEM–01 VERSION: 02 PAGE: 41 DATE: 07-05-04
source. These adjustments must be sent to DANE Central in a written record along with the forms, on the dates of information transmission.
When figures with variations outside of the range are detected, according to the critique manual, data should be verified with the informant source to correct it or justify it, depending on the actual situation of the enterprise.
Information capture is done in the adjusted processing system, according to validation and consistency specifications provided by the thematic team, to guarantee the existence of minimum checkups (such as character types of the variables, sums and comparisons between chapters and variations) necessary to obtain a database with consistent information.
After the information from each form is inputted, variation tabs are generated for each enterprise to be reviewed by the critic; the data printed on the cards are compared to the data recorded by the source in the form. Furthermore,, a verification of atypical data is performed in order to establish if they are justified.
The information critique manual contains instructions on how to check the consistency of the data.
The user manual contains instructions for the handling of the processing system (capture program).
The ISIC is used to revise activity codes of the enterprises according to merchandise groups.
From this process, the required inputs to construct the quality indicator are obtained on a month to month basis.
Filtering and processing of data
In order to guarantee the opportunity and quality of database filtering and processing, it is essential to have good critique and input of the information. The captured information is sent by the territorial branches to DANE Central’s - Enterprise Logistics team, where it is consolidated into the processing system, nationwide coverage is controlled and, moreover, data for each company is verified again. To start the process of generating the tables in current values, the percentage of companies failing to report information or in debt cannot exceed 2% of the total of the enterprises’ directory sent to field in the collection operation. The consolidation of tables to current values is also part of this process. These are generated by the system, the total sales from the trade form are reviewed, the groups with the variables that had the highest contributions on the total sales are identified, and

Monthly Retail Trade Survey
Methodology-MMCM
CODE: TE-MMCM-TEM–01 VERSION: 02 PAGE: 42 DATE: 07-05-04
those companies that had the highest annual variations for each group of goods are listed, the same is done for the tables by economic activity of sales and personnel by type of contract. Vehicle information is reviewed for each vehicle category, as well as by origin.
Disaggregation of the information To describe the activity of the retail trade sector, the index numbers of sales values are used, along with the index numbers of employment and wages and salaries, which reflect trends in the demand for consumption of domestic goods in the country. The Monthly Retail Trade Sample presents indices for sales (of the total without fuels, of the total without fuels or vehicles, by homogeneous merchandise groups and by commercial activity ISIC), employment (total and by type of Contract), and average wages and salaries (of the total).
Enrollment and selection of personnel
Selecting and hiring personnel to collaborate in the process of the operation development, from its first stages until the delivery of definitive figures for the research is conducted in two stages:
In order to perform the operations of distribution, collection, critique and capture, the following activities are conducted at territorial branches and auxiliary offices:
Announcement in the web page of the available positions.
Review of resumes and support documentation according to the defined profile.
Training course dictated by the technical assistant of the research in each of the territorial branches.
Classification test.
Selection of personnel.
Reinforcement of training. Personnel for the processes of consolidation, production and analysis of information is selected at DANE Central. This personnel will focus on the detection and correction of inconsistencies, analysis, production and revision of output tables.
The personnel selection process for these positions consists of the following:
Announcement in the web page of the available positions.
Assessment of resumes.
Training course.
Test or evaluation of the technical proposal.
Personal interview.
Selection of personnel.
Further training.

Monthly Retail Trade Survey
Methodology-MMCM
CODE: TE-MMCM-TEM–01 VERSION: 02 PAGE: 43 DATE: 07-05-04
2. STATISTICAL PRODUCTION
2.1 IMPLEMENTATION
2.1.1 Training
Training for the collectors-critics is done at the moment when there is rotation of personnel. The trade methodological group of the Direction of Methodology and Statistical Production (DIMPE by its acronym in Spanish) will give instructions and the necessary training, providing the necessary assistance and solving inquiries.
2.1.2 Information collection Each source is provided with form “DANE I360-6” one month in advance. This form is already pre-filled out with the enterprise name, address, phone number, internal identification of the source (source code, pin number, department, year and month), and the name of the month that the data refers to. The remaining fields such as value of sales, employment, and remuneration are left blank so that the informant completes them. The signature and stamp of the person responsible are also requested. See the attached form. The self filling-in method is the method of completion for the MMCM form, with advice from a DANE’s official when required. This process consists of two stages:
Pre-critique The collector-critic sets up an appointment with the source in order to collect the completed form. Once at the company, they perform the pre-critique process, which consists of the verification of identification data and minimal verifications of lines that should be filled out. This is done in the presence of the person who filled out the form so that any inconsistencies found in the information could be clarified immediately. When the forms are received by fax, mail or hand delivered by an officer of the enterprise different from the person who filled it, the forms shall not be pre-critiqued.
Collection Collection begins in the third decade of the month "n + 1"(where "n" is the reference month of the figures) and it is conducted through a personal visit to the source. The forms should be remitted to DANE Central in the third decade of the month "n + 2".
Control card at the Collection Division (DIRE by its acronym in Spanish)

Monthly Retail Trade Survey
Methodology-MMCM
CODE: TE-MMCM-TEM–01 VERSION: 02 PAGE: 44 DATE: 07-05-04
The control card, as its names indicates it, controls the number of forms received in the reference month "n" and based on this information debts are collected from each territorial branch. After the pre-critique stage, forms are gathered. The collector–critic takes the originals and the copies of the forms to the territorial branch; the enterprise keeps a copy of the completed form.
2.1.3 Critique of the information In each territorial branch the completed forms are collected by the collector-critic or sent by fax or mail. In order to start the critique process, the form for the month in process previously filled out by the source must be available, as well as the folder with the forms history (from previous months) of each enterprise. The critique of the forms is performed taking into account the instructions described in the research manual according to the type of form which needs to be critiqued. When there are doubts about how to follow the procedures, the critic should consult the person responsible for the research in the territorial division. The critique process starts with the verification of the identification data and general information; afterwards, the chapters corresponding to identification, sales in the month, inventories and cost of goods sold, average employed personnel, salaries and wages and social benefits generated in the month are critiqued. It is necessary to verify that the observations really justify the annual and monthly variations found in the previous chapters; if not, the source should be consulted for clarification. Once the observations are evaluated, the processing of the following boxes is verified: city and completion date, filled out by the person in charge of completing the form, The last to be written are the date of completion of the critique and the name of the person who made it.
2.1.4 Capture and filtering stage The MMCM has a system to capture and filter the information, through which the coverage, novelties and enterprises captured are controlled. Furthermore, the information given in the forms by the informant sources, as well as the observation are captured. General characteristics of the information processing system of the sample are:
Directory module: The options in this module give the possibility to update the directory variables, print them, by regional and form type, as well as to pre-fill out the forms, keep track of new developments and review its history.
Trade module: This module has options to capture information from trade enterprises for the month in process, also to generate variation tabs, update data

Monthly Retail Trade Survey
Methodology-MMCM
CODE: TE-MMCM-TEM–01 VERSION: 02 PAGE: 45 DATE: 07-05-04
of previous months, review the history of the information captured from each company, and generate tables with the main variables of trade; other options in this module enable the generation of the list of captured companies and of companies with new developments as well as the development of the consolidation processes at DANE Central at national level; lastly, they also enable the transfer of information from each territorial branch to DANE Central.
Vehicles module: This module has options to capture information for the month in process of enterprises variables destined for the sale of vehicles, and also to generate variations tabs, update data from previous months, review the history of the captured information of each company, generate tables with the main trade variables, generate the list of the researched companies and companies with new developments and performs consolidation processes at DANE Central, at the national level; it also allows the transfer of information from each territorial branch to DANE Central.
Utilitarian module: This module has options such as: start capturing, make backup copies, re-index tables, clean tables and generate tables in Microsoft Excel® and database File (DBF). It also has options to consolidate information in DANE Central, reverse the closure of the month and close the month in process.
Deflator indices module: This module is still in development, it generates indices and indicators by commercial groups.
Reports: This module has the option of generating reports by types of novelties and by regional branch, of the summary of companies that show novelties and a list of them.
There is also an additional quarterly module used to generate the figures from the Quarterly Survey of department stores and hypermarkets.
According to the responsibilities of each work team, different levels of access are given for the use of each of the options of the capture software. In case of the directory update, the novelties option is only active at the regional branches. The detailed specifications of each of the options of the capture software can be found in the system user’s guide. Once the critique of the form is finished, the information along with the observations should be inputted by the collector-critic in the software application through the capture option. In this process the application software must have validation and consistency specifications delivered by the thematic team to the systems team. After each form is captured, variations tabs are generated, the tool which is used for the verification of inputted data and the analysis at the enterprise level. The variations recorded in the tab must be verified in the forms to confirm that the corresponding observations exist. This is done in order to obtain the information.

Monthly Retail Trade Survey
Methodology-MMCM
CODE: TE-MMCM-TEM–01 VERSION: 02 PAGE: 46 DATE: 07-05-04
Validation and consistency After finishing the collection, critique, and capture of the information, every territorial branch sends the obtained information, according to the dates on the chronogram. The information is then consolidated in the enterprise logistics capture application in DANE Central, where each enterprise is revised again in order to check the consistency of the information. If it is inconsistent, clarification by the source or by the regional office is requested. Once the information is consolidated, the reports of sources in debt are generated If the debt reaches a maximum of 2%, the list of companies to impute is generated. Further, with a directory of sources at 100% of coverage, the first consolidated tables are generated for the review of consolidated information. These tables are obtained directly from the capture program and are reviewed by merchandise groups which contribute the most to the variations either negatively or positively, checking the system information against the forms and at the same time analyzing the behavior of each enterprise. This review is done by economic activity for the consolidated tables of personnel, wages and salaries, costs and inventories. In the case of vehicles, the review is done by origin- imported and domestic- and new and used. As for personnel, it is reviewed by activity and by type of contract. For this review, all the forms for the month of information are available, along with the comments, reports and explanatory annexes sent by the respective regional branch which collects them, and the captures at DANE Central. After the first review of the consolidated tables (supported by the tables design to help identify the behavior of enterprises which contribute the most to the variations) a second list which contains new information with the corrections done in the previous step is generated and reviewed.
2.1.5 Imputation The process of information imputation of the enterprises which, at this stage, still fail to report information is done to probabilistic or forced units, whose information has low participation in the results at the group level (inclusion by sample). Information is updated in the following period. If a local source holds a significant stake in the results (forcible inclusion) and has not provided the information, all resources are exhausted so that the source sends the information and the process is put on hold until the arrival of this information.
2.1.6 Production and review of expanded results For each of the variables observed in the research, expanded numbers are produced and generated by level of trade group and for the total of the trade sector. The analysis on these levels makes it possible to see the evolution of each of the variables in time, and to establish the inconsistencies of the information through the comparison between consecutive months and between equal months in several years (seasonal behaviors).

Monthly Retail Trade Survey
Methodology-MMCM
CODE: TE-MMCM-TEM–01 VERSION: 02 PAGE: 47 DATE: 07-05-04
All checkups, reviews and analyses conducted until this stage of the process, guaranty the consistency of the information of each of the variables with respect to their evolution in time. Next, the indices of the variables researched are produced, per trade group level and for the total of the trade sector, as well as the monthly, year to date, and annual variation tables. These results are used to perform an analysis which consists of a direct observation of the data in order to detect variations outside the standard ranges in accordance with their historical behavior. This is how the consistency review is complemented with the context analysis. After this stage, the production of the press bulletin starts (which is subject to review and approval for publication by the Press Office of the institution).
2.2 ANALYSIS In accordance with the information requested from the sources which are part of the MMCM research, the behavior of sales is established as well as the behavior of employment and wages and salaries of the retail trade sector in Colombia. For this purpose, time variations of these indicators are analyzed, then their relation is established and the results are contextualized in light of the economic situation of the country. As the analysis tool to monitor the sector, economic information produced by other institutions is employed, as well as the information produced internally by DANE, which is directly and indirectly related to households’ consumption. Situational analyses of the variations of the figures obtained for the period are performed monthly, aiming to provide reliable information of the economic behavior of the retail trade sector by means of the press bulletin. The process of analysis consists of several stages, which are described below.
2.2.1 Data preparation Once the information is received at DANE Central, the information which has already been consolidated is statistically analyzed and the consistency validation task begins. After this stage, economic and structure analysis of the consolidated information begins. This process involves:
Coverage control and report of novelties.
Imputation of sources that do not report information
Consistency reviews.
Necessary adjustments to inconsistencies.
Calculation of expansion factors for the probabilistic portion.
Expansion of figures.
Calculation of sampling errors.

Monthly Retail Trade Survey
Methodology-MMCM
CODE: TE-MMCM-TEM–01 VERSION: 02 PAGE: 48 DATE: 07-05-04
Information analyses of general variables for merchandise groups and retail trade groupings according to ISIC classification in sales, total employment by type of contract and total wages and salaries.
Analysis of evolution and development of the national sectoral structure.
Comparison of results with other researches.
Selection of data which will be the base for the output tables. Making of graphs and figures to support the tables.
Making the progress bulletin.
Making the executive report.
Preparation of figures and graphics support which should be published in the brochure and on the WEB page.
Publication.
3. EVALUATION AND CONTROL Each stage of the process has previously established pre and post information controls, which intend to determine the data consistency and completeness. For the specific case of the critique stage, the controls are:
o Comparison of consistency and verification of activity with the same month of the immediately preceding year.
o Verification and consistency of the horizontal and vertical summations at
the establishment level. In the event of an inconsistency, the observations chapter should be reviewed in order to check whether it includes clarifications about the inconsistency found. Otherwise, the source must be consulted. As part of the coverage control, it will be verified that all establishments have provided information in a timely manner; otherwise it is necessary to determine the kind of novelty presented (liquidated, merged, among others). Subsequently, an automatic critique is done where control flows have been established in the system. At this stage it is possible to detect inconsistency problems that may occur while inputting the information, which are detrimental to its quality. Once the data are consolidated, a validation review of these results is done, in order to detect variations, spotting which establishments contributed the most to these variations. In such case, the enterprise records and the form must be checked, to ensure its justification or the source should be consulted. Lastly, the final tables are created with the approval of the thematic group to control the variations outside of range, atypical data and macroeconomic context, proceeding to carry out the respective results analysis and its corresponding publication.
Monthly Retail Trade Survey
Methodology-MMCM
CODE: TE-MMCM-TEM–01 VERSION: 02 PAGE: 49 DATE: 07-05-04
4. DOCUMENTATIÓN The documentation that supports the research consists of :
4.1 METHODOLOGIES AND MANUALS
Methodological annex of the Monthly Retail Trade Sample. National Administrative Department of Statistics- DANE, Press bulletin MMCM, January 2000.
Methodology of the Monthly Retail Trade Sample. National Administrative Department of Statistics- DANE, May 2003.
Methodology of deflators, correlative, indices and linking. National Administrative Department of Statistics- DANE, Bogotá D.C. 2003.
Fill out manual of the Monthly Retail Trade Sample and of Vehicles. National Administrative Department of Statistics- DANE, January 2004.
Critique and coding manuals of the Monthly Retail Trade Sample and Vehicles. National Administrative Department of Statistics- DANE, Bogotá D.C. January 2004.
System Manual of the Monthly Retail Trade Sample. National Administrative Department of Statistics- DANE, Bogotá. 2001.
User guide of the Monthly Retail Trade Sample. National Administrative Department of Statistics- DANE, Bogotá. 2001.
Consistency and validation specifications of the Monthly Retail Trade Sample. National Administrative Department of Statistics- DANE, Bogotá, D.C. 2004.
Variation ranges methodology for quality control of the information of the variables part of the Monthly Retail Trade Sample. National Administrative Department of Statistics- DANE, Bogotá, D.C. 2002.
Methodology of imputation for debt status novelties. Monthly Retail Trade Sample. National Administrative Department of Statistics- DANE, Bogotá, D.C. 2003.
Formats to control the reprocessing and monitoring for trade and vehicles.

Monthly Retail Trade Survey
Methodology-MMCM
CODE: TE-MMCM-TEM–01 VERSION: 02 PAGE: 50 DATE: 07-05-04
4.2 COLLECTION
Monthly Retail Trade Sample Form.
Form of the Monthly Motor Vehicles Trade Sample and Retail Trade of its Parts, Accessories, Fuels and Lubricants.
5. DISSEMINATION DANE fulfills the function of dissemination of the information results through data banks located in all major cities. Results for each month are published monthly in the Statistical Advance (with estimated values) in the middle of the month “n+3”, where “n” is the reference month. Subsequently, the definite results (without the estimated figures) are published in the Press Bulletin in the Trade section. Information of the Monthly Retail Trade Sample can be obtained through any of the following ways:
Web site
Press Bulletin
Situational indicators
Statistical bulletin
Magnetic tools: CD’s
Diskettes
Tabulated or flat files in Database
Monthly Retail Trade Sample Brochure
5.1 INFORMATION CHARACTERISTICS In the output tables, the user can find information about the following indices:
Percentage variation of the Retail Sales Total without fuel (nominal and real).
Percentage variation of the Retail Sales Total without fuels or vehicles (nominal and real).
Percentage variation of the Retail Sales Total by merchandise groups and Commercial Activity ISIC, Rev. 3 (nominal and real).
Percentage variation of generated wages and salaries (nominal and real) and employment by type of contract.
Real and nominal index of the Retail Trade Sales Total.
Real and nominal index of the Retail Sales Total without fuel.
Real and nominal index by Commercial activity ISIC, Rev. 3 and by merchandise groups.
Wages and salaries index.
Employment index.

Monthly Retail Trade Survey
Methodology-MMCM
CODE: TE-MMCM-TEM–01 VERSION: 02 PAGE: 51 DATE: 07-05-04
The general results of the month, as well as the annual variation, accumulated year to date variation and accumulated annual variation are presented in the Press Bulletin. Likewise, the analysis of the sector’s tendencies by commercial group is conducted and the behavior of employment and wages and salaries are presented, comparing the accumulated to twelve months, year to date variation and the annual variation.

Monthly Retail Trade Survey
Methodology-MMCM
CODE: TE-MMCM-TEM–01 VERSION: 02 PAGE: 52 DATE: 07-05-04
ANNEXES
ANNEX A
GLOSSARY19
Coefficient of variation: Defined as the percentage variation of the standard error for the central estimation, e.g., the quotient between the standard error of the estimator and the estimator multiplied by 100.
CVV
E
( )
( )*
100
The real variance of the parameter )ˆE( valueexpected itsor )ˆ( V is usually unknown,
however in calculations performed in this study these values for the auxiliary variable are known, since the population information is available according to the 1993 census.
Domestic trade: “The re-sale (sale without transformation) of new and used merchandise within the national territory, it can be retail or wholesale”.
Enterprise: For purposes of economic statistics, "enterprise is defined as every business unit or combination of business units, owned or managed, , which under a single legal name, directly or indirectly comprises and controls all necessary functions and activities in order to develop and reach corporate goal for which it was created”
20 .
Estimated coefficient of variation: A widely used measure, CVE.
cvV
( )
( )*
100
The result of estimation is considered to be good if its coefficient of variation is less than 5%; acceptable if it is between 5% and 10%; of low precision if it is higher than 10% but lower that 15%; and useless if it is higher than 15%. Although the variance, the standard error and the coefficient of variation measure the magnitude of the variability of the sampling distribution of the estimator, in other words sampling error as some may call it , the coefficient of variation has the advantage of presenting this measure in percentage terms, therefore, is a measure commonly used for estimations.
Estimator and estimate: mathematical formula which is used to make estimations. It depends on two aspects: statistical design and the way how the probability of inclusion is assigned to each element of the population- which is denominated estimator. The 19
DANE,(2002). International Standard Industrial Classification of all Economic Activities; Revision 3
Adapted for Colombia(ISIC.Rev.3ªA.C) 20
Op.Cit.,

Monthly Retail Trade Survey
Methodology-MMCM
CODE: TE-MMCM-TEM–01 VERSION: 02 PAGE: 53 DATE: 07-05-04
estimate or the estimated value is the approximation of the true value of the population, calculated by replacing the values obtained in the selected sample in this formula.
This estimation value can be point or interval estimation. In the first case the estimation is done by using a single value, while in the second case two values, denominated lower limit and upper limit, which define the interval, are being used. .In this case it is said that with a given level of confidence, expressed as a percentage usually of the 90% or 95%, the interval covers the parameter.
Expected value and bias: Given that all possible population samples in a chosen design were taken, and due to a certain probabilistic method a probability of inclusion has been assigned to each of its elements, and after calculating the estimation of the parameter of interest for each sample with the same formula, the calculated average of all of these estimations is denominated the expected value. The difference between the expected value and the real value of the parameter in the population is denominated bias, so if this difference is equal to zero, meaning that the expected value and the real value of the parameter in the population are equal, then the estimator is unbiased, which is the most important quality of the estimators.
ISIC Rev.3 AC Activity: It establishes a structure which will present statistics of all economic activities of the different productive sectors in the country. The term activity used in this context refers to a production process, i.e. the combination of actions that result in a given set of goods and services.
Probabilistic sample: It is part of the universe, obtained by random selection, using a sampling design p(.), which guarantees that each and every of the elements has a known probability, greater than zero, that they will be included in the sample. The objective of a sample selection is to determine and collect information about the unknown characteristics of the population, such as: frequencies of occurrence of an event, averages, totals, proportions, etc.
Retail Trade: “The re-sale (sale without transformation) of merchandise or goods, destined for consumption, personal or household use. It excludes commercial activities conducted at pawn shops, lottery outlets, mobile points of sale, homes, and telemarketing activities; it also excludes activities associated with maintenance and repair related trade”.
Sampling design: Algorithm or procedure whereby the elements that will be included in the probabilistic sample are obtained, in accordance with the research objectives. The goal of designing a sample is to obtain estimations of the values in the universe of study as accurately as possible within a certain cost. In order to meet this objective the starting point is a suitable sampling frame based on probabilistic procedures, i.e. procedures that guarantee to each of the units of the universe a probability greater than zero of being included in the sample and to obtain estimates with useful accuracy levels and within the margins of error and pre-set levels of confidence.
Sampling distribution, variance of the estimator and standard error: The way how the estimates of these possible samples are distributed is denominated sampling

Monthly Retail Trade Survey
Methodology-MMCM
CODE: TE-MMCM-TEM–01 VERSION: 02 PAGE: 54 DATE: 07-05-04
distribution, and the magnitude of the variability of this distribution, randomly assigned, is the variance of the estimator. The square root of this variance is denominated standard DEVIATION of the distribution or standard error. The lower the magnitude of this variability is the better will the accuracy of the estimation of the parameter of interest be, provided that there is no bias. This magnitude depends on:
The method used to select the sample.
The parameter which needs to be estimated, since it is different to calculate a total, an average, or a ratio etc. even for the same sample.
The natural variability of the studied variable such as age, income, etc.
The sample size.
The frequency with which the studied event occurs.
Sampling framework: Sampling framework is the instrument which enables locating and identifying each and every of the elements of the universe of study. A sampling frame is expected to comply with the following characteristics:
All the elements of the universe must be found in the framework, i.e., there is no sub coverage.
All the elements inside the framework must belong to the universe, i.e. that there shouldn’t be over coverage.
Repeated elements cannot exist inside the framework. Another desirable characteristic of the sampling framework is that it contains additional information of each unit in order to:
Build study domains.
Stratify.
Make designs with probability proportional to size measure.
Enable, build or propose better estimators, for example, estimators of regression or post stratification.
Simple random sampling (MAS by its acronym in Spanish): Consists of randomly selecting n elements (sample size) of a population of N elements (size of the universe), in other words, for a preset value n extractions are performed between the N elements, without replacement, in such a way that all the elements of the population have an equal chance of being included in the sample.
Stratified sampling: Involves the previous categorization of all the units or elements that form the universe, in internally homogeneous sub populations, from the operational perspective, of available information or of variance. The selection of the elements is made inside of each stratum. There are various reasons to perform stratification, such as:
Need for information about each stratum.
Due to the difference in the availability of auxiliary information which would enable establishing more efficient designs in some strata.

Monthly Retail Trade Survey
Methodology-MMCM
CODE: TE-MMCM-TEM–01 VERSION: 02 PAGE: 55 DATE: 07-05-04
For operational reasons, related to the type of information in each stratum (as it can be more expensive to measure certain parts of the population than others).
In order to obtain more accurate estimates, since in the process of forming strata in the way which ensures homogeneous sub populations inside of each stratum, variation is reduced and therefore -the sampling error as well.
Trade: “The re-sale (sale without transformation) of merchandize and products; it can be retail or wholesale. Includes all the agents, traders, auctioneers and commissioners whose task is the sale and purchase of goods for themselves or on behalf of a third party”.
21
21
Ibíd.

Monthly Retail Trade Survey
Methodology-MMCM
CODE: TE-MMCM-TEM–01 VERSION: 02 PAGE: 56 DATE: 07-05-04
ANNEX B.
FORMULAS FOR THE ESTIMATION OF INDICES AND PERCENTAGE VARIATIONS
Monthly indices
Monthly sales value Index (nominal and real) for merchandise groups and for each
commercial activity.
Having set the reference year, which for the Monthly Retail Trade sample was 1999, a simple average of the year for the expanded value of the variable is generated as:
Average =
9912
112
1lvp
i
Where, vpl99: Is the average of the total expanded value of each variable in 1999 (sales for each of the 16 merchandise groups and for each commercial activity). In order to find the index for each month, a relation between the absolute expanded values of each variable for each month and the average of 1999 for this same variable is calculated:
99
12
1vpl
veIv t
t
To find this same index, the chained Laspeyres formula can be used:
Where: Ivt : Value index of the variable. vet: Total of the expanded value of each variable in month “t”. It is important to note that the indices of the Monthly Retail Trade Sample are not cumulative, that is, they are independent between periods.
)1(
)1(
t
ttt
ve
veIvIv

Monthly Retail Trade Survey
Methodology-MMCM
CODE: TE-MMCM-TEM–01 VERSION: 02 PAGE: 57 DATE: 07-05-04
Total monthly sales value index (nominal and real) of the total of the trade sector
without fuels.
( Ivt (i) x Pond (i) ) ,
Where Ivt (i) = Corresponds to the indices of each of the sixteen merchandise
groups (i) in each period, calculated in the previous step 1.1. Pond (i) = The values of the weightings of each merchandise group (i), after
making the adjustment due to the exclusion of fuels.
Sales index (nominal and real) of the total of the trade sector without fuels ad
vehicles
(Ivt (i) x Pond (i) ), Where Ivt (i) = Corresponds to the indices of each of the sixteen merchandise groups
(i) in each period, calculated in the previous step 1.1. Pond (i) = The values of the weightings of each merchandise group (i), after
making the adjustment due to the exclusion of fuels or vehicles.
Wages and salaries index (nominal and real) This indicator is composed of the per capita information between employment and wages and salaries generated by permanent and temporary personnel hired directly by the enterprise. After this average is obtained, the procedure is the same as the one used to construct the sales indices.
Average =
9912
112
1lvp
i
Where: vpl99: Is the average of the total extended value in 1999 of the total relation of employment and these two categories and its wages and salaries.

Monthly Retail Trade Survey
Methodology-MMCM
CODE: TE-MMCM-TEM–01 VERSION: 02 PAGE: 58 DATE: 07-05-04
Now, in order to find the index for each month, a relation between the absolute extended values of this variable for each month and the average of 1999 for this same variable is calculated:
99
12
1vpl
veIv t
t
To find this same index, the chained Laspeyres formula can also be used:
)1(
)1(
t
ttt
ve
veIvIv
Where: Ivt : Value index of the variable. vet: Sum of the extended value of the variable in the month “t”. It is important to note that the indices of the Monthly Retail Trade Sample are not cumulative, that is, they are independent between periods.
Employment index Having set the base year for comparison, which for the Monthly Retail Trade sample was 1999, a simple average of the year for the extended value of the variable is generated as follows:
Average =
9912
112
1lvp
i
Where, vpl99: Is the average of the total extended value of the employment variable in 1999. This formula is used in the same way to build indices by occupational category and the total employment.

Monthly Retail Trade Survey
Methodology-MMCM
CODE: TE-MMCM-TEM–01 VERSION: 02 PAGE: 59 DATE: 07-05-04
Now, in order to find the index for each month, it is necessary to determine the relation between the absolute extended values of each variable for each month and the average of 1999 for this same variable:
99
12
1vpl
veIv t
t
Same index can be calculated using the chained Laspeyres formula:
)1(
)1(
t
ttt
ve
veIvIv
Where: Ivt : Value index of the variable. vet: Sum of the extended value of the variable in month “t”. This formula is used in the same way to create indices by occupational category and the total employment. It is important to note that the indices of the Monthly Retail Trade Sample are not cumulative, that is, they are independent between periods.
Monthly Retail Trade Survey
Methodology-MMCM
CODE: TE-MMCM-TEM–01 VERSION: 02 PAGE: 60 DATE: 07-05-04
ANNEX C.
PERCENTAGE VARIATIONS
Monthly variation
For each monthly index type, monthly variations are calculated in relation to the previous month of the same year, using the following formula:
Monthly variation: ( Ivt(t) n (i) 1 ) x 100
n Iv(t-1) (i)
Annual variation
This annual percentage variation is calculated with relation to the same month of the previous year, using the following formula: Ivt(t) n (i) Annual variation: ( - 1 ) x 100 Ivt(t) n-1 (i)
Accumulated variation year to date Variations are calculated with the formula:
DAt n ( - 1) x 100 DAt n-1 Where (i) = Corresponds to index accumulation from January until the month
“t” of year n, of variable i.
Annual accumulated variation
In order to find this variation, the following formula is used: DAt n ( - 1 ) x 100 DAt n-1 Where DAt n (i) = Corresponds to the index accumulation from month t-12 until
month “t” of year n, of variable i.

Monthly Retail Trade Survey
Methodology-MMCM
CODE: TE-MMCM-TEM–01 VERSION: 02 PAGE: 61 DATE: 07-05-04
For example, if the accumulated annual variation is going to be estimated for the month of June of the year 2000, then the calculated sum is from July of 1999 to June of 2000. The same procedure is done for the sum of the denominator that will go from July of 1999 to June of 2000.

Monthly Retail Trade Survey
Methodology-MMCM
CODE: TE-MMCM-TEM–01 VERSION: 02 PAGE: 62 DATE: 07-05-04
ANNEX D
NOVELTIES
LIQUIDATED
Definition: It is the definitive termination of an economic activity by an enterprise that involves the closure of their establishments. Compulsory liquidation aims at the sale of the assets of the company for the orderly payment of obligations.
Exclusions: If the statistical unit is under liquidation, it is not developing the economic activity, and it is only collecting outstanding debts, it is categorized as inactive, (see new development 3). If the statistical unit is under a liquidation process and it is still developing the economic activity under research, it is categorized in the group of enterprises that provide information (see new development 99). If the statistical unit was liquidated due to fusion, see the novelty number 10. If the statistical unit was liquidated due to absorption, see the novelty number 13.
Novelty 1 (Liquidated): It operated zero months in the year n of the survey.
Exclusions: If the statistical unit was liquidated, but operated in the reference period of the survey for some time, developing the researched economic activity and it was not possible to collect information in this period, it is treated as liquidated with information (see the novelty number 97).
Procedure: The novelty number 1 is assigned when the statistical unit shows the certificate of liquidation from the Chamber of Commerce or a cancelled registration, besides confirming that the establishments, where the economic activity was conducted,
have been closed and additionally, operated zero (0) months in the reference year n22
(of the survey).
Sending the form to DANE Central: The type 1 of the novelty is registered on the cover of the form, certificate of the Chamber of Commerce (liquidation certificate) must be attached, whereas the follow-up report of companies with the change in status, elaborated by the critic must contain the following information as minimum requirements: Name of informant. Date when the enterprise became inactive. Operating state of the establishments where the company used to conduct its
economic activity.
22
n : It refers to the year of the survey art he one being collected, n+1 will be the year after the reference survey.

Monthly Retail Trade Survey
Methodology-MMCM
CODE: TE-MMCM-TEM–01 VERSION: 02 PAGE: 63 DATE: 07-05-04
Active period of the enterprise during the period of the survey. The rest of the information collected on the field.
Sequence number: When a statistical unit changes its NIT or company name, the procedure related to the sequence number is the following: If the business unit belongs to the universe of study and it changes its NIT, company name, address or any of the identifying attributes, the same sequence number must be kept and it must continue to provide information. The sequence number will change only when the statistical unit is liquidated and it presents the support documents from the Chamber of Commerce, assigning it the liquidated status. The new statistical unit will be incorporated into the survey provided that: It belongs to the universe of study
23, does not already provide information to DANE
and is of forced inclusion, in other words, as long as it fulfills the parameters of income or employed personnel, assigning it new development 9. If the statistical unit is not of forced inclusion, the completed form will be sent to DANE Central. If the new enterprise does not belong to the sector in study, the mini survey form should be applied.
Capture: In the capture of forms, everything related to the chapter I (Unique Business Cover), should appear as updated.
Novelty 97 (Liquidated): operating one month or longer.
Exclusions: If the statistical unit was liquidated and operated zero (0) months in the year of reference, follow the instructions from the novelty 1.
Operational: Novelty 97 must be assigned when the statistical unit shows the certificate from the Chamber of Commerce, where its liquidation is verified. In addition, it could be established that the unit conducted the activity under research during some months of the year of the survey, but it was not possible to obtain information for those months. The operation period must always be filled in and the documents that support the liquidation must be attached. If there are no such documents, novelty 3 is assigned.
Sending the form to Central DANE: The novelty number 19 is to be recorded on the cover of the form and the certificate of the Chamber of Commerce (liquidation certificate) must be attached, whereas the follow-up report of companies with the change in status, elaborated by the critic must contain the following information as minimum requirements: Name of informant Date when the enterprise became inactive Operating state of the establishments where the company used to conduct its
researched economic activity. Active period of the enterprise during the period of the survey. The rest of the information collected on the field, and other data found in the field.
23 Universe of study corresponds to sector and activities researched

Monthly Retail Trade Survey
Methodology-MMCM
CODE: TE-MMCM-TEM–01 VERSION: 02 PAGE: 64 DATE: 07-05-04
Sequence number: it remains with the same sequence number.
Capture: all information that the statistical unit (Enterprise) reports must be recorded.
Novelty 2 Change of sector of the statistical unit due to economic process).
CHANGE OF SECTOR
Definition: Change of sector occurs when unit which is providing information to the survey for the researched economic sector, focuses its main activity or activities towards an activity which does not belong to the sector of research. In other words, the greatest added value is represented by another sector (industry, services, or other). This event always involves a change of economic activity of the unit.
Exclusions: When a statistical unit changes the sector due to a poor classification in the original directory selection. See novelty 19.
Procedure: Novelty 2 is assigned, when a statistical unit of the studied economic sector has more than 60% of the value added in some other economic sector which is not being researched, as a result of the operating process of the researched statistical unit. For this novelty, it is important to visit the company in order to observe the reported changes directly on the field, having in mind that this novelty code implies loss of sample for the research.

Monthly Retail Trade Survey
Methodology-MMCM
CODE: TE-MMCM-TEM–01 VERSION: 02 PAGE: 65 DATE: 07-05-04
When there is doubt about the change or it is observed that this may be situational, it is appropriate to request from the enterprise to complete the form for the year of the survey and send the information without being inputted to the DANE Central. The information can also be compared in each regional branch with other economic researches conducted by DANE, in order to confirm whether the company provides information to some other sector. In case it does, the sequence number of the research should either be recorded or it is necessary to immediately inform DANE Central about the change in the sector, so that the comparison could be made nationwide.
Sending the form to the DANE Central: The novelty is written in the top right corner of the form, as well as the activity of the sector to which the enterprise is moving to, coded with ISIC Rev 3 A.C., in 4 digits. The economic activity developed by statistical unit in the year of the survey as well as the starting date of the change (month and the year) are described in the observation section., All supporting documentation must be attached in written form together with the follow-up companies report with the novelty elaborated by the critic on a separate format or in the observations section of the form.
Sequence number: Remains the same.
Capture: For the process of form capturing, only what corresponds to chapter I paragraphs 1 to 9 should appear with the novelty. In the novelty observations field of the system, the sector to which it moved to, coded with ISIC Rev 3 A.C. in 4 digits must be recorded as well as the date when the change of sector initiated.
Novelty 19: Change of sector due to wrong classification and because it does not
belong to the universe of the study.
Exclusions: When a business unit of the researched economic sector moves to another sector, as a result of the economic process of the statistical unit (See novelty 2).
Procedure: Novelty 2 is assigned when a statistical unit of the studied economic sector has more than 60% of its value in another economic sector which is not being researched, as a result of the operating process of the statistical unit which is being researched. The company is visited in order to observe the reported changes on the field since this new development code implies loss of sample for the research. When there is doubt about the change or it is observed that this may be situational, it is appropriate to request from the enterprise to complete the form for the year of the researched survey and send information without being inputted to the DANE Central. The information can also be compared in each regional branch with other economic researches conducted by DANE, in order to confirm whether the company provides information to some other sector. In case it does, the sequence number of the research

Monthly Retail Trade Survey
Methodology-MMCM
CODE: TE-MMCM-TEM–01 VERSION: 02 PAGE: 66 DATE: 07-05-04
should either be recorded or it is necessary to immediately inform DANE Central about the change in the sector, so that the comparison could be made nationwide.
Sending the form to the DANE Central: The novelty is written in the top right corner of the form as well as the activity of the sector to which the enterprise is moving to, coded with ISIC Rev 3 A.C., in 4 digits. The economic activity developed by statistical unit in the year of the survey as well as the starting date of the change (month and the year ) are described in the observation section. All supporting documentation must be attached in written form together with the follow-up companies report with the novelty elaborated by the critic on a separate format or in the observations section of the form.
Sequence number: Remains the same
Capture: For the process of form capturing, only what corresponds to chapter I paragraphs 1 to 9 should appear with the novelty. In the novelty observation field of the system, the sector to which it really belongs to, coded with ISIC Rev 3 A.C. in 4 digits must be recorded.
Exclusions: When a business unit of the researched economic sector moved to another sector, as a result of the economic process of the statistical unit (see novelty 2)
INACTIVE (3)
Definition: the statistical unit24
has an absolute, temporary shortage and with the possibility of restarting their productive activities; Inactive status is different from liquidation. While liquidation is definitive, inactivity can be present due to reasons such as strikes, moving, expansions, etc. When a multi-active unit no longer performs some of their activities, temporarily or definitively, but continues performing the activity being researched, it should provide information (it is considered active). Causes of temporary inactivity include strikes, expansions, processes of liquidation, etc.
Exclusions: If the inactivity happened in the year of data collection and the information from the reference year could not be obtained, novelty 5 must be assigned (see novelty 5).
Procedure: Novelty 3 is assigned when the business unit complies with the conditions of the definition above. The support documents provided by the source should be attached, as well as the grounds for inactivity, such as a purpose or a liquidation certificate from the Chamber of Commerce, if available Following information from the field research should be indicated in the observation field of the form:
24
Enterprise or establishment according to the case

Monthly Retail Trade Survey
Methodology-MMCM
CODE: TE-MMCM-TEM–01 VERSION: 02 PAGE: 67 DATE: 07-05-04
Name of the informant.
Inactivity starting date
Procedure status of the establishments, parts of the local unit, where the researched economic activity used to be developed.
It is necessary to verify that the year of inactivity corresponds to the reference year of the survey (n).
Sequence number: If upon arrival to the researched business unit a change in ownership is reported, and the unit belongs to the universe of study, it must remain with the same sequence number and it must continue providing information. If in the initial address of a business unit (enterprise) there is a new unit operating, it will be incorporated into the survey as long as it belongs to the universe of the study
25, it does
not already provide information to DANE and is of forced inclusion, that is, if fulfills the parameters of income or employed personnel, assigning it novelty 9. If the statistical unit is not of forced inclusion the completed form will be sent to DANE Central. If the new company does not belong to the sector of research, the mini survey form should be conducted.
Capture: For the form capturing, only the information which corresponds to chapter I, paragraphs 1 to 9 should appear with the novelty.
UNLOCATED (4)
Definition: While following the field procedure, the statistical unit of interest cannot be located with the information recorded in the directory database.. This event may occur due to an undetected change at the physical location or due to an error in the recorded address.
Procedure: Novelty 4 must be written in the upper right corner of the form only when the statistical unit of interest has been found neither at the address provided on the form nor in the directories of the locality. Procedure report about the recovery of selected statistical units must be sent to DANE Central. Additionally, following steps should be made: Enquire the individuals from the connected or neighboring businesses about the new
location of the company. Consult the phone directories of the city. Consult the Chambers of Commerce Perform any other type of procedure considered relevant Review the physical forms from previous years to look for other possible addresses.
25 Universe of study corresponds to sector and activities researched

Monthly Retail Trade Survey
Methodology-MMCM
CODE: TE-MMCM-TEM–01 VERSION: 02 PAGE: 68 DATE: 07-05-04
Special procedure: there is a different treatment when the survey starts and the statistical units (companies or enterprises) are not located due to wrong information in the directory. A special procedure must be conducted during the following year in order to recover the source. If after this procedure they are not found, they are excluded from the sample.
Sequence number: If upon arrival to the researched business unit a change in ownership is reported, but the unit retains the activity, it should remain with the same sequence number and continue providing information. If in the initial address of a business unit (enterprise) a new unit is operating, it will be incorporated into the survey as long as it belongs to the universe of the study
26, it does
not already provide information to DANE and is of forced inclusion, that is, if fulfills the parameters of income or employed personnel, assigning it novelty 9. If the statistical unit is not of forced inclusion, the completed form will be sent to DANE Central.
If the new company does not belong to the sector study, the mini survey form must be conducted.
Capture: only what corresponds to chapter I, paragraphs 1 to 7 should appear with the novelty.
DEBT (5)
Definition: it occurs when a unit, being active in the reference period, fails to provide information on time for specific field procedure or office procedure.
Procedure: Novelty 5 is assigned to the economic unit in the following cases:
It was absolutely impossible to collect information in the time scheduled , and as long as it does not have the following conditions(priority):
o Statistical unit of priority 1 (of forced inclusion) o Statistical Unit important for the region (unique) o Statistical unit that was in debt for providing information in the previous
year
There is a new owner due to purchase of the statistical unit and they does not have information from the reference period (n). In this case, the directory is updated and the month and year of the change of owner is recorded. If the new owner does have information for the reference period, see novelty 99.
If the statistical unit did not fill in the form due to loss of information or documentation. Attach written support.
26 Universe of study corresponds to sector and activities researched

Monthly Retail Trade Survey
Methodology-MMCM
CODE: TE-MMCM-TEM–01 VERSION: 02 PAGE: 69 DATE: 07-05-04
Due to inactivity in the collection year, but it is found that the unit operated economically, during the reference period. Attach supporting documents in written form, if possible.
For the purpose of obtaining information from sources that have not met the initial deadline, a letter of extension should be sent, requesting a letter from the enterprise with a date of commitment in which it will report the information; if the source does not provide the information within the stipulated period, submit in written form all necessary documents, sanctions will be imparted in accordance with the legal requirements. It is necessary to try to obtain information at least until the closure of the procedure. Review regulatory circular from May 14
th 1996. (See annex)
Capture: For the process of form capturing, only the corresponding to chapter I, paragraph 1 to 9 should appear with the novelty. The statistical unit which at the time of the collection changed owners, if it was impossible to locate the previous owner, and moreover, there is no information for the year of the survey- should appear inside the system as in debt with observation. The directory with the data must be updated with the new owner’s information in order to collect the information about the following year's survey. In the observations field of the system "debt due to change of ownership and without information in year 2003" must be inputted.
IMPUTATION (98)
Definition: It consists of assigning a plausible value instead of the missing or incorrect data with the consequent loss of accuracy of results.
Procedure: This novelty is restricted to the regional procedure. The Enterprise Logistics team at DANE Central must check the listing of enterprises in debt, so as to detect those statistical units defined as priorities which cannot be imputed. Those units are:
Statistical unit of priority 1 (of forced inclusion)
Statistical Unit important for the region (unique)
Statistical unit that remained in debt the previous year
Sequence number: The statistical unit remains with the same sequence number.
DUPLICATE (6)
Definition: It occurs when the same data for the identification and location of the statistical unit are contained in more than one record (multiple forms). This occurrence, more than affecting the life of the unit, will mostly affect the directory and sample sizes.
Procedure: Novelty 6 is assigned to the form with the greater sequence number or to that whose data provides less consistency; the other form will be used for collecting further

Monthly Retail Trade Survey
Methodology-MMCM
CODE: TE-MMCM-TEM–01 VERSION: 02 PAGE: 70 DATE: 07-05-04
information. . In the top right corner of each form, the sequence number which the form was duplicated with must be written.
Capture: For the capture of the forms, only the information which corresponds to chapter I, paragraph 1 to 7 should appear, with the novelty recording the duplicate sequence number in the observations field.
EXITS DUE TO TRANSFER TO ANOTHER REGIONAL BRANCH (7)
Definition: it consists of detecting the transfer of a statistical unit from DANE’s regional branch where it belonged, to a different one. This occurrence will affect the variables: address, telephone number, department, municipality and regional branch, in other words, the totality of the variables related to unit location.
Procedure: the regional branch (where the form was transferred from, due to change of address of the main office or upon request of the statistical unit) must send following information to DANE Central:
All updated information from chapter I, sections: 1 identification, 2 location and general data.
Name of the person to contact at the new address.
Collection instruments (forms, manuals and proof of delivery and good standing).
Forms from previous years (in order to continue with controls of information provided).
DANE Central will conduct all relevant controls and send all documentation to the regional branch, which should collect the information. The enterprise logistics team should always check the occurring change (7) and assign the corresponding novelty.
Sequence number: the form continues with the same sequence number.
Capture: All the updated information of chapter I sections: 1 identification, 2 location and general data must be recorded in the directory capture module. It is also necessary to indicate in the observations field the name of the regional office where this information should be received.
ENTERS DUE TO TRANSFER FROM ANOTHER REGIONAL BRANCH (8)
Procedure: the same sequence number must be kept and the information about the statistical unit received through this transfer must be obtained; furthermore, novelty 8 must be written in the top right corner of the form.
Exceptions: if some novelty other than novelty 8 is detected while performing the procedure, for example liquidated, inactive or another, this must be informed to DANE Central and this novelty should be recorded with code 7 within the regional branch where it exits from .

Monthly Retail Trade Survey
Methodology-MMCM
CODE: TE-MMCM-TEM–01 VERSION: 02 PAGE: 71 DATE: 07-05-04
Capture: the same sequence number must be kept and the information must be inputted into the system once it has been criticized; in the capture observations field the regional office of origin must be written.
JOINED THE SAMPLE AS NEW (9)
Procedure: Only those statistical units that comply with the parameters of forced inclusion and those of probabilistic inclusion which were not in the previous survey and were selected by the Sampling group as part of the process of maintenance of the sample shall be considered as new. The collection procedure must be applied to these statistical units (enterprises) and in the top right corner the code for novelty 9 must be written. The new statistical unit (enterprise) included because it meets requirements and is the product of a merger, must list the sequence numbers that consolidates it.
Capture: A new sequence number is assigned (the system assigns the number) and includes the information into the system once it is criticized. Sequence numbers which consolidate a new statistical unit (company) resulting from a merger, must be noted in the capture observations field.
MERGED (10)
Definition: Occurs when one or more statistical units come together to create a new statistical unit, conformed by their former assets. They can have various combinations as shown in the diagram below.
Procedure: Novelty 10 is assigned to the statistical units (enterprises) which stop providing information; the operation period must always be filled out. The new company resulting from the merger is surveyed, provided that it belongs to the universe of study, otherwise, the mini survey questionnaire must fill be out.
Sequence number: If the unit belongs to the universe of study, novelty 10 must be noted in the upper right corner of the form, as well as the sequence number of the new enterprise; otherwise, it is necessary to explain in the observations field whether it is probabilistic or does not belong to the universe of study (entering the activity code for the latter case) Information about new statistical units (enterprises) that fulfill the parameters of forced inclusion is captured, and for those units which belong to probabilistic inclusion, information is sent to DANE Central. (See novelty 9).

Monthly Retail Trade Survey
Methodology-MMCM
CODE: TE-MMCM-TEM–01 VERSION: 02 PAGE: 72 DATE: 07-05-04
Merged
Source: TE- MMCM (Economic Thematic Team Monthly Retail Trade Sample)
Capture: for sources with novelty 10, information for chapter I is captured as well as the information that has been reported in the months prior to the merger. The new statistical unit that complies with the parameters of forced inclusion is captured with novelty 9, sequence number is assigned and the merging statistical units (enterprises) must be listed in the observations field. In the observations field related to the capturing of the unit with code 10, new sequence number of the new statistical unit resulting from the merger should be listed. It is also necessary to explain whether it is probabilistic or does not belong to the universe of study, noting the activity code.
SCISSION (12)
Definition: occurs when a statistical unit based on one or more parts of its assets generates a new statistical unit (in this case legal person) or expands one or more of its existing units.
Procedure: novelty 12 is assigned to the statistical unit in a state of scission, the survey’s form is applied to the new enterprise (result of the scission) as long as it belongs to the universe of study; otherwise, the mini survey questionnaire must be filled out. In case that the assets of the other business unit, which is being surveyed, expand due to this scission, it will be identified with novelty 99, provided that it continues to operate in the same universe of study. Otherwise, novelty 2 is being assigned, recording in the observation field the new activity code (see novelty 2). Information about new statistical units (enterprises) that fulfill the parameters of forced inclusion is captured and the filled out questionnaires of the units of probabilistic inclusion are sent to DANE Central. (See novelty 9).
Sequence number: In the top right corner of the form, novelty 12 must be noted, as well as the sequence number of the expanded unit provider of information and that of the new enterprise, if it belongs to the universe of study. Otherwise, it must be explained, in the observation field whether the units are probabilistic or do not belong to the universe of study, the activity code must be noted for the latter case.

Monthly Retail Trade Survey
Methodology-MMCM
CODE: TE-MMCM-TEM–01 VERSION: 02 PAGE: 73 DATE: 07-05-04
The statistical unit which was expanded or created (new) must have the sequence number of the enterprise that originated the change. Also, the company being divided shall have the sequence numbers in which its assets were subdivided.
Capture: For sources with novelty 12, chapter I must be captured as well as the information reported in the year. The new statistical unit that meets parameters of forced inclusion is captured with novelty 9 and a sequence number is assigned. In the capture observation field, both the extended statistical unit as well the new statistical unit must have the sequence number of the company that originated the change. Similarly, the divided company shall have the sequence numbers in which its assets were subdivided.
ABSORPTION (13)
Definition: when two or more statistical units are joined to form a single statistical unit, but one of them retains the legal traits - NIT, Company Name, and Trade Name.
Procedure: novelty 13 is assigned to the statistical unit that stops rendering information, the months of operation must always be filled out. The survey form is conducted in the absorbing company as long as they belong to the universe of study, otherwise, a mini survey questionnaire must be filled out. If the result of absorption is a statistical unit that belongs to the universe of study and is of forced inclusion (see diagram below) the novelty and the sequence numbers are assigned as follows:
o If the absorbent statistical unit provided information for the survey, it is assigned novelty 99 and the sequence number will be the one which belonged to the absorbing company.
o If the absorbent statistical unit did not provide information for the survey, it
is assigned novelty 9 and a new sequence number. Provided that the result of the absorption is a statistical unit that belongs to the universe of study and is of probabilistic inclusion (see the diagram) the novelty and sequence numbers are assigned as follows:
o If the absorbent statistical unit provided information to the survey, it is assigned novelty 99 and the sequence number will be the one which belonged to the absorbing company.
o If the absorbent statistical unit did not provide information to the survey, it
is sent to DANE Central with the information of the year in reference. Both the absorbing and absorbed statistical units must have the sequence number of the company that originated the change.

Monthly Retail Trade Survey
Methodology-MMCM
CODE: TE-MMCM-TEM–01 VERSION: 02 PAGE: 74 DATE: 07-05-04
Absorption
Does the new enterprise belong to
the sector?
NO
YES
Directory update
Absorption of a unit that provides information of forced
inclusion and unites with:
A business unit that does not provide information.
Result of the fusion:
Business unit(s) that provide information
Which correspond to:
Converted to forced inclusion
Converted to probabilistic
inclusion
Forced inclusion
Probabilistic inclusion
Continues the process as new
Directory update.
Check whether it is inside the framework
Converted to forced
inclusion
Converted to forced
inclusion
Converted to probabilistic
inclusion
Monthly Retail Trade Survey
Methodology-MMCM
CODE: TE-MMCM-TEM–01 VERSION: 02 PAGE: 75 DATE: 07-05-04
Capture: For the sources with novelty 13, chapter I and the information that has been reported for the months prior to the absorption must be captured. In the capture observation field the sequence number of the company that originated the change must be recorded, both for the absorbed and the absorbent statistical unit.
HOUSINGS WITH ECONOMIC ACTIVITY (18)
Definition: Refers to occupied dwellings in which economic activities are conducted using spaces that are not independent from those of the dwelling. Also included in these new developments are fixed posts such as kiosks, booths etc. and mobile posts such as displays on wheels, motor vehicles, vans etc.
Procedure: Novelty 18 must be noted in the top right corner of the form when the statistical unit is a dwelling with economic activity, fixed post, mobile posts and others sites listed in the definition. The monitoring report of enterprises with new developments, supplied by the critic, must be attached; this report should be included within the comments section of the collection form or in a separate form specifically for that purpose.
Sequence number: the statistical unit (enterprise) continues with the same sequence number.
Capture: Only the information for chapter I paragraphs 1 to 7 (from the identification section to the company's current state section) must appear for the capture of forms.
INFORMATION PROVIDED (99) The system assigns this code automatically when the statistical unit is completely filtered.
Capture: Once the information is captured, the reports for comparison of figures produced by the system for the analysis by the critic should be printed and attached to the form.
DELIVERY OF MATERIAL WITH NOVELTIES In order to obtain a greater efficiency in the management of novelties, a proper delivery of the collection material of the research should be done as follows:
The monitoring report of enterprises with novelties, provided by the critic, should be attached to all statistical units (enterprises) that present novelties; this report
Same sequence number of absorbing source.
Continues the process
Same sequence number of absorbing source. Continues the process
Part of the research

Monthly Retail Trade Survey
Methodology-MMCM
CODE: TE-MMCM-TEM–01 VERSION: 02 PAGE: 76 DATE: 07-05-04
should be included within the comments section of the collection form or in a separate form specifically for that purpose.
The mini survey forms from companies that do not comply with parameters of
forced inclusion should be sent to DANE Central with a written list containing the identification data of each company (Nit, company name, trade name, number of employees and income).
IMPORTANT: Forms with novelties should be sent to DANE Central, along with written support, during the usual deliveries of information. It is necessary to confirm the novelties before sending them, in order to avoid re-processes and problems in the information capture process.
SUMMARY OF NOVELTY CODES
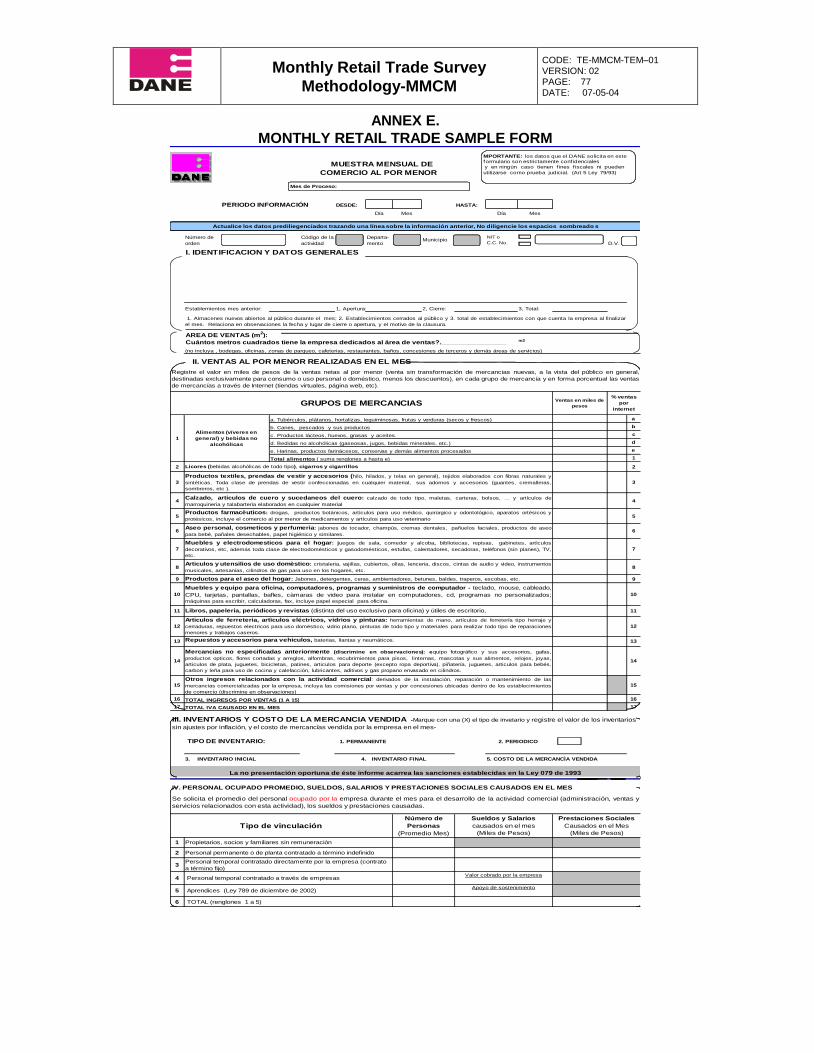
Monthly Retail Trade Survey
Methodology-MMCM
CODE: TE-MMCM-TEM–01 VERSION: 02 PAGE: 77 DATE: 07-05-04
ANNEX E.
MONTHLY RETAIL TRADE SAMPLE FORM
MUESTRA MENSUAL DE
PERIODO INFORMACIÓN DESDE: HASTA:
Día Mes Día Mes
Número de
orden
Código de la
actividad
Departa-
mentoMunicipio
NIT o
C.C. No.
D.V.
I. IDENTIFICACION Y DATOS GENERALES
Establemientos mes anterior: 1, Apertura: 2, Cierre: 3, Total:
AREA DE VENTAS (m2):
Cuántos metros cuadrados tiene la empresa dedicados al área de ventas?.________________ m2
(no incluya , bodegas, oficinas, zonas de parqueo, cafeterias, restaurantes, baños, concesiones de terceros y demás áreas de servicios)
II. VENTAS AL POR MENOR REALIZADAS EN EL MES
Ventas en miles de
pesos
a. Tubérculos, plátanos, hortalizas, leguiminosas, frutas y verduras (secos y frescos) a
b. Canes, pescados y sus productos b
c. Productos lácteos, huevos, grasas y aceites. c
d. Bedidas no alcohólicas (gaseosas, jugos, bebidas minerales, etc.) d
e. Harinas, productos farinácesos, conservas y demás alimentos procesados e
Total alimentos ( suma renglones a hasta e) 1
2 2
3 3
4 4
5 5
6 6
7 7
8 8
9 9
10 10
11 11
12 12
13 13
14 14
15 15
16 TOTAL INGRESOS POR VENTAS (1 A 15) 16
17 TOTAL IVA CAUSADO EN EL MES 17
1
2
3
4
5
6
IV. PERSONAL OCUPADO PROMEDIO, SUELDOS, SALARIOS Y PRESTACIONES SOCIALES CAUSADOS EN EL MES
Prestaciones Sociales
Causados en el Mes
(Miles de Pesos)
Propietarios, socios y familiares sin remuneración
Personal permanente o de planta contratado a término indefinido
Personal temporal contratado directamente por la empresa (contrato
a término fijo)
Número de
Personas
(Promedio Mes)
Tipo de vinculación
Aprendices (Ley 789 de diciembre de 2002)
TOTAL (renglones 1 a 5)
Personal temporal contratado a través de empresas
Apoyo de sostenimiento
Valor cobrado por la empresa
Se solicita el promedio del personal ocupado por la empresa durante el mes para el desarrollo de la actividad comercial (administración, ventas y
servicios relacionados con esta actividad), los sueldos y prestaciones causadas.
Sueldos y Salarios
causados en el mes
(Miles de Pesos)
Aseo personal, cosmeticos y perfumeria: jabones de tocador, champús, cremas dentales, pañuelos faciales, productos de aseo
para bebé, pañales desechables, papel higiénico y similares.
Muebles y electrodomesticos para el hogar: juegos de sala, comedor y alcoba, bibliotecas, repisas, gabinetes, artìculos
decorativos, etc, además toda clase de electrodomésticos y gasodomésticos, estufas, calentadores, secadoras, teléfonos (sin planes), TV,
etc.
Articulos y utensilios de uso domèstico: cristaleria, vajillas, cubiertos, ollas, lenceria, discos, cintas de audio y video, instrumentos
musicales, artesanías, cilindros de gas para uso en los hogares, etc.
Registre el valor en miles de pesos de la ventas netas al por menor (venta sin transformación de mercancias nuevas, a la vista del público en general,
destinadas exclusivamente para consumo o uso personal o doméstico, menos los descuentos), en cada grupo de mercancía y en forma porcentual las ventas
de mercancías a través de Internet (tiendas virtuales, página web, etc).
Licores (bebidas alcohólicas de todo tipo), cigarros y cigarrillos
1
MUESTRA MENSUAL DE
2. PERIODICO
La no presentación oportuna de éste informe acarrea las sanciones establecidas en la Ley 079 de 1993
Muebles y equipo para oficina, computadores, programas y suministros de computador - teclado, mouse, cableado,
CPU, tarjetas, pantallas, bafles, càmaras de video para instalar en computadores, cd, programas no personalizados;máquinas para escribir, calculadoras, fax, incluye papel especial para oficina.
Articulos de ferreteria, artìculos eléctricos, vidrios y pinturas: herramientas de mano, artículos de ferretería tipo herraje y
cerraduras, repuestos electricos para uso doméstico, vidrio plano, pinturas de todo tipo y materiales para realizar todo tipo de reparaciones
menores y trabajos caseros.
Mercancias no especificadas anteriormente (discrimine en observaciones): equipo fotográfico y sus accesorios, gafas,
productos opticos, flores cortadas y arreglos, alfombras, recubrimientos para pisos, linternas, mascotas y sus alimentos, relojes, joyas,
articulos de plata, juguetes, bicicletas, patines, articulos para deporte (excepto ropa deportiva), piñatería, juguetes, articulos para bebés,
carbon y leña para uso de cocina y calefacción, lubricantes, aditivos y gas propano envasado en cilindros.
Libros, papeleria, periódicos y revistas (distinta del uso exclusivo para oficina) y útiles de escritorio,
COMERCIO AL POR MENOR
3. INVENTARIO INICIAL 4. INVENTARIO FINAL
Productos textiles, prendas de vestir y accesorios (hilo, hilados, y telas en general), tejidos elaborados con fibras naturales y
sintéticas. Toda clase de prendas de vestir confeccionadas en cualquier material, sus adornos y accesorios (guantes, cremalleras,
sombreros, etc ).
1. Almacenes nuevos abiertos al público durante el mes; 2. Establecimientos cerrados al público y 3. total de establecimientos con que cuenta la empresa al finalizar
el mes. Relaciona en observaciones la fecha y lugar de cierre o apertura, y el motivo de la clausura.
III. INVENTARIOS Y COSTO DE LA MERCANCIA VENDIDA -Marque con una (X) el tipo de invetario y registre el valor de los inventarios
sin ajustes por inflación, y el costo de mercancías vendida por la empresa en el mes-
5. COSTO DE LA MERCANCÌA VENDIDA
Alimentos (víveres en
general) y bebidas no
alcohólicas
% ventas
por
internetGRUPOS DE MERCANCIAS
1. PERMANENTE TIPO DE INVENTARIO:
Otros ingresos relacionados con la actividad comercial: derivados de la instalación, reparación o mantenimiento de las
mercancías comercializadas por la empresa, incluya las comisiones por ventas y por concesiones ubicadas dentro de los establecimientos
de comercio (discrimine en observaciones)
Calzado, articulos de cuero y sucedaneos del cuero: calzado de todo tipo, maletas, carteras, bolsos, ... y artículos de
marroquineria y talabartería elaborados en cualquier material
Repuestos y accesorios para vehiculos, baterias, llantas y neumáticos.
Productos farmacèuticos: drogas, productos botánicos, artìculos para uso médico, quirùrgico y odontológico, aparatos ortésicos y
protésicos, incluye el comercio al por menor de medicamentos y artìculos para uso veterinario
Productos para el aseo del hogar: Jabones, detergentes, ceras, ambientadores, betunes, baldes, traperos, escobas, etc.
Actualice los datos prediliegenciados trazando una línea sobre la información anterior, No diligencie los espacios sombreado s
Mes de Proceso:
MPORTANTE: los datos que el DANE solicita en este formulario son estrictamente conf idencialesy en ningún caso tienen f ines f iscales ni pueden
utilizarse como prueba judicial. (Art 5 Ley 79/93)

Monthly Retail Trade Survey
Methodology-MMCM
CODE: TE-MMCM-TEM–01 VERSION: 02 PAGE: 78 DATE: 07-05-04
ANNEX F.
FORM: MOTOR VEHICLES TRADE, RETAIL TRADE OF ITS PARTS, ACCESSORIES,
FUELS AND LUBRICANTS.
MUESTRA MENSUAL DE
COMERCIO AL POR MENOR
PERIODO INFORMACIÓN DESDE: HASTA:
Día Mes Día Mes
Número
de orden
Código de la
actividad NIT o D.V.
C.C. No.
I. IDENTIFICACION Y DATOS GENERALES
Establemientos inicio mes: 1. Apertura (+): 2. Cierre (-): 3. Total:
II. VENTAS DE VEHÍCULOS AUTOMOTORES EN EL MES
Unidades Unidades Unidades Unidades Valor Unidades
2, Camperos (aptos para todo terreno)
3, Motos (cuatrimotos, motocarros)
4, Caminonetas (hasta 2 Toneladas)
5, Vehículos de trasporte público
7, *Otros (especifíque en observaciones)
11, VENTAS DE VEHÍCULOS AUTOMORES POR INTERNET (% renglón 8)
%
1
2
3
4 TOTAL(RENGLONES 1 a 3)
5 TOTAL IVA CAUSADO
IV. VENTAS DE COMBUSTIBLES Y LUBRICANTES PARA VEHÍCULOS AUTOMOTORES
1
2
3
4
5
6
7 TOTAL (renglones 1 a 6)
8
1
2
3
6
DEPARTAM E
NTO
ADM INISTRA
TIVO
NACIONAL DE
ESTADISTICA
MUESTRA MENSUAL DE COMERCIO DE VEHÍCULOS
AUTOMOTORES Y MOTOCICLETAS, SUS PARTES
PIEZAS Y ACCESORIOS; COMERCIO AL POR MENOR
DE COMBUSTIBLE Y LUBRICANTES
Departa-
mento
Municipi
1. Almacenes nuevos abiertos al público durante el mes; 2. Establecimientos cerrados al público y 3. total de establecimientos con que cuenta la empresa al finalizar el mes.
Relaciona en observaciones la fecha y lugar de cierre o apertura, y el motivo de la clausura.
Se solicita el número de unidades y el valor de las ventas netas (en miles de pesos) de vehículos automotores realizadas por la empresa en el mes, por tipo de vehículo, procedencia,
nuevos y usados. Incluya el valor de las ventas de vehículos usados efectuadas a traves de intermediación (costo + comisión)
i
t
e
m
Tipo de Vehículo
Nacionales (Ensamblados en el país) Importados (Ensamblados en el exterior)
Ventas de origen nacional Ventas al consumidor final
Ventas a otras empresas
Nuevos Usados Nuevos Usados Nuevos
Valor Valor Valor Valor
1. Automóviles particulares
6, Vehículos de carga
8 TOTALES (1 a 7)
9, COMISIONES CAUSADAS POR VENTAS
DE VEHICULOS EN CONSIGNACIÓN
10, TOTAL VALOR IVA CAUSADO
* Hace referencia a tipos de vehículos como: ambulancias, carros de bomberos, recolección de basuras y casas rodantes.
III. VENTAS DE PARTES, PIEZAS Y ACCESORIOS PARA VEHÍCULOS AUTOMOTORES
Relacione las ventas mayoristas y minoristas, de partes, piezas, accesorios, llantas y neumáticos para vehículos automotores en miles de pesos, sin incluir iva y en
forma porcentual la comercilización de mercancías a través de Internet (tiendas virtuales, página web, etc). No incluya las ventas de partes piezas llantas y
neumáticos para bicicletas, maquinaria agricola o industrial, ni los ingresos por servicios de análisis de gases.
Miles de pesosVentas por
internet %
Partes, piezas (autopartes) y accesorios (lujos)para vehículos
Llantas y neumáticos
Otros ingresos operacionales relacionados con la actividad comercial: derivados de la instalación, reparación o
mantenimiento del (los) grupo(s) de mercancías (1 y 2), incluye las comisiones por ventas y por concesiones ubicadas
dentro de los establecimientos de comercio (discrimine en observaciones)
Diligencie el valor total de las ventas minoristas de gasolina, ACPM, lubricantes y gas natural para vehículos, en miles de pesos sin incluir IVA y ningun tipo de
impuestos nacionales, departamentales o municipales (impuestos global, sobretasa, etc).
Galones Miles de pesosVentas por
internet %
Gasolina corriente incluso mezclada con alcohol carburante
Gasolina Extra incluso mezclada con alcohol carburante
ACPM
Lubricantes (grasas, aceites), aditivos y productos de limpieza
Gas natural m3 (para vehículos automotores)
Otros ingresos operacionales relacionados con la actividad comercial: derivados de la
instalación, reparación o mantenimiento del (los) grupo(s) de mercancías (1 a 5), incluye las comisiones por
ventas y por concesiones ubicadas dentro de los establecimientos de comercio (discrimine en observaciones)
TOTAL VALOR IVA CAUSADO
V. PERSONAL OCUPADO PROMEDIO, SUELDOS SALARIOS Y PRESTACIONES SOCIALES CAUSADOS EN EL MES
Se solicita el promedio del personal ocupado por la empresa durante el mes para el desarrollo de la actividad comercial (administración, ventas y
servicios relacionados con esta actividad), los sueldos y prestaciones causadas.
Tipo de vinculacionNumero De
Personas
(Promedio Mes)
Sueldos y Salarios causados
en el mes (Miles de
Pesos)
Prestaciones Sociales
causados en el mes
(Miles de Pesos)
Propietarios, socios y familiares sin remuneracion
Personal permanente o de planta contratado a término indefinido
Personal temporal contratado directamente por la empresa
(contrato a término fijo)
4 Personal temporal contratado a través de empresas
5 Aprendices (Ley 789 de diciembre de 2002)
TOTAL (renglones 1 a 5)
Actualice los datos prediliegenciados trazando una línea sobre la información anterior, No diligencie los espacios sombreado s
Mes de Proceso:
La no presentación oportuna de éste informe acarrea las sanciones establecidas en la Ley 079 de 1993
Actualice los datos prediliegenciados trazando una línea sobre la información anterior, No diligencie los espacios sombreado s
Mes de Proceso:
MPORTANTE: los datos que el DANE solicita en este formulario son estrictamente confidencialesy en ningún caso tienen fines fiscales ni pueden utilizarse como prueba judicial. (Art 5 Ley 79/93)
IMPORTANTE; LOS VALORES PARCIALES DEBEN REPORTARSE SIN IMPUESTOS INDIRECTOS (IVA Y CONSUMO )

Monthly Retail Trade Survey
Methodology-MMCM
CODE: TE-MMCM-TEM–01 VERSION: 02 PAGE: 79 DATE: 07-05-04
BIBLIOGRAPHY1
Statistical Quality, National and Territorial Statistical System (SENT by its acronym in Spanish), Guide for documenting statistical activity, (“Guía para documentar la actividad estadística.”) Printed by the Editions Division of the National Administrative Department of Statistics – DANE, Santafé de Bogotá D.C., Colombia, May, 1988. Trade Code (Código del Comercio) El pensador Editors Ltda. Second edition: January of 1999. Santa Fe de Bogotá D.C., Colombia. Domestic Trade Sampling Design (Diseño Muestral Comercio Interior), Methodology and Statistical Production Division DANE. Estimation and variance specifications of the MMCM, Pg. 8 May 2002, Bogotá D.C., Colombia. FENALCO – Presidency, Economic Blog, January to May of 2002, Bogotá D.C. – Colombia. Managing Group. Quality Management System (SCG by its acronym in Spanish) Quality Manual – DANE based on the requisites of the international standards ISO 9001 – 2000. Pg. 60 July of 2003. Bogotá D.C., Colombia. Statistical Methodology of Domestic Trade “Metodología Estadística Comercio Interior”. Methodology and Statistical Production Division. DANE. Methodology of imputation of novelties in debt “Metodología de imputación de novedades en estado de deuda.” Pg. 10, March of 2002. Bogotá D.C., Colombia Statistical Methodology of Domestic Trade “Metodología Estadística Comercio Interior”. Direction of Methodology and Statistical Production. DANE. “Metodología de rangos de variación para el control de calidad de información de las variables que conforman la MMCM.” Pg. 16, May of 2002. Bogotá D.C., Colombia. Statistical Methodology of Domestic Trade. Direction of Methodology and Statistical Production. DANE. 2 Metodología descriptiva de los archivos para el marco MMCM.” Pg. 16, May of 2002. Bogotá D.C., Colombia. Colombian Labour Regime “Régimen Laboral Colombiano”. Published by Legis editores S.A. Bogotá, Colombia. April of 2002. National and territorial Statistical System, SENT. International Standard Industrial Classification of all economic activities, revision 3 Adapted for Colombia (ISIC REV.3 A.C.). Printed by the Editions Division of the National Administrative Department of Statistics – DANE. Santafé de Bogotá D.C., Colombia – May of 1988. Survey design and development techniques (Técnicas de diseño y desarrollo de encuestas (TDDE by its acronym in Spanish). DANE. Final report. November of 1996. Santa Fe de Bogotá D.C., Colombia.
1 Translation is for reference purposes only