Embed Size (px)
Citation preview
Civil Service Statistics 2019 Cabinet Office National Statistics
Civil Service Statisticsas at 31 March 2019
1
31 March 2019
Published 24 July 2019
Revised 4 October 2019
Next publication in July 2020
ContactsLead Statistician: Tobias Jolly
Press enquiries: Glenn [email protected]
ContentsIntroduction 2
Size and grades 3-5
Location 6-7
Diversity 8-13
Salary and working patterns 14-16
Professions 17-18
Entrants and leavers 19
Notes 20
This bulletin presents headline statistics on the UK Civil Service workforce, including demographic characteristics, earnings, grades, and locations of civil servants.
Key Statistics:
• Civil Service headcount is 445,480, up from 430,080 in 2018. On a full-time equivalent basis (FTE), employment is 413,910, up from 399,150 in 2018.
Of these civil servants:
• 53.9% are women, unchanged from the previous year.
• 12.7% are from an ethnic minority background, up from 12.0% in 2018.
• 11.7% declare themselves as having a disability, up from 10.0% in 2018.
• 4.9% identify as being lesbian, gay, bisexual or recorded their sexual orientation as ‘other’ (LGBO), up from 4.6% in 2018.
• 66.4% are working at Executive Officer (EO) grade and above, up from 64.3% in 2018 and 52.1% in 2009.
• 35.8% are aged under 40, up from 34.6% in 2018.
• 89,100 work in London, up from 83,530 in 2018.
• The median salary is £27,080, up £470 (1.8%)from £26,610 in 2018.
12.7%
11.7%
0%
2%
4%
6%
8%
10%
12%
14%
2009
2010
2011
2012
2013
2014
2015
2016
2017
2018
2019
Ethnic minority
Representation of ethnic minority and
disabled civil servants 2009 to 2019
0%
20%
40%
60%
80%
100%
2009
2010
2011
2012
2013
2014
2015
2016
2017
2018
2019
SCS level
G6/7
HEO/SEO
EO
AA/AO
Civil Service grade structure 2009 to 2019
Disabled
Civil Service Statistics 2019 Cabinet Office National Statistics
Introduction
2
Civil Service Statistics is an annual National Statistics publication describing the
UK Civil Service workforce in terms of its size, demographic characteristics,
salaries, working pattern, grade, and location. The data is drawn from the Annual
Civil Service Employment Survey (ACSES).
These figures count all home Civil Service employees, including those based in
Northern Ireland and overseas. Not included are the Northern Ireland Civil
Service, other Crown servants and employees of the wider public sector, for
example, employees of non-departmental public bodies (NDPBs) and the
National Health Service (NHS).
Notes on the statistics
Unless otherwise specified all figures are calculated on a headcount basis.
Figures are rounded to the nearest 10 in the case of headcounts, FTE, and
salaries, and to one decimal place for percentages. Unless otherwise stated, all
summary statistics exclude unknowns for all variables.
All 2019 data is available in the published Civil Service Statistics tables. Where
time series are used, data have been taken from previous Civil Service Statistics
publications.
Further analysis and methodology
Summary information on the scope and limitations is available at the end of this
bulletin, with full details available in the quality and methodology information
document published on the gov.uk website, along with previous versions of these
statistics:
https://www.gov.uk/government/collections/civil-service-statistics
National Statistics
Civil Service Statistics are designated National Statistics in accordance with the
Statistics and Registration Service Act 2007. National Statistics status means
that official statistics meet the highest standards of trustworthiness, quality, and
public value.
All official statistics should comply with the Code of Practice for Official
Statistics1. They are awarded National Statistics status following an assessment
by the UK Statistics Authority’s regulatory arm. The Authority considers whether
the statistics meet the highest standards of Code compliance, including the value
they add to public decisions and debate.
Responsibility for the collection and publication of Civil Service Statistics
transferred to Cabinet Office from the Office for National Statistics (ONS) on 1
October 2018. The Office for Statistics Regulation (OSR) will be undertaking an
initial compliance check to ensure that the relevant National Statistics standards
have been maintained following the transfer of responsibility.
Request for Feedback
We always welcome user feedback on our publications.
If you would like to provide feedback on any aspect of this publication, please
see our survey feedback form here, or contact us at:
1 Code of Practice for Official Statistics:
https://www.statisticsauthority.gov.uk/wp-content/uploads/2018/02/Code-of-Practice-for-Statistics.pdf
What is the Civil Service?
The Civil Service helps the government of the day develop and implement its
policies as effectively as possible. It provides services directly the public,
including paying benefits and pensions; running employment services; running
prisons and issuing driving licences. Civil Servants also work on policy
development and implementation, including analysts, project managers,
lawyers and economists. The Civil Service is politically impartial and
independent of government. Organisations that make up the Civil Service
include central government departments, their agencies, and crown non-
departmental government bodies (NDPBs).
Further information can be found on gov.uk
Civil Service Statistics 2019 Cabinet Office National Statistics
40501101201201902102102503103204105106107608801,1701,2001,6801,8202,1102,8302,9304,3404,5705,5805,5906,1306,6807,0108,3708,8109,53010,900
14,94018,690
32,67054,900
67,53075,070
85,350
0 20,000 40,000 60,000 80,000 100,000
Wales Office
UK Supreme Court
ESTYN
Northern Ireland Office
Scotland Office
Government Actuary's Department
Office of Qualifications and Examinations Regulation
National Savings and Investments
Water Services Regulation Authority
Office of Rail and Road
UK Export Finance
Charity Commission
The National Archives
Department for Exiting the European Union
Competition and Markets Authority
Office of Gas and Electricity Markets
Department for Digital, Culture, Media and Sport
Food Standards Agency
Office for Standards in Education
Department for International Trade
HM Treasury
Department for International Development
Ministry of Housing, Communities and Local Government
National Crime Agency
United Kingdom Statistics Authority
Welsh Government
HM Land Registry
Foreign and Commonwealth Office
Department for Education
Cabinet Office
Department of Health and Social Care
Attorney General's Departments
Department for Environment, Food and Rural Affairs
Department for Business, Energy and Industrial Strategy
Department for Transport
Scottish Government
Home Office
Ministry of Defence
HM Revenue and Customs
Ministry of Justice
Department for Work and Pensions
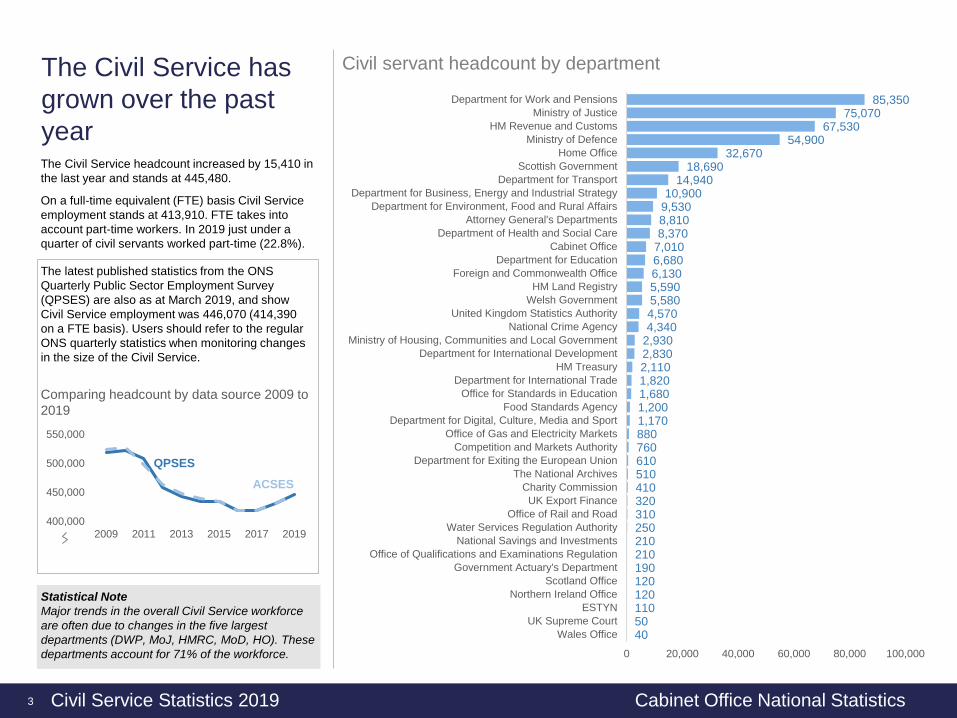
Civil servant headcount by department
QPSES
ACSES
400,000
450,000
500,000
550,000
2009 2011 2013 2015 2017 2019
The Civil Service has
grown over the past
year
3
The Civil Service headcount increased by 15,410 in
the last year and stands at 445,480.
On a full-time equivalent (FTE) basis Civil Service
employment stands at 413,910. FTE takes into
account part-time workers. In 2019 just under a
quarter of civil servants worked part-time (22.8%).
Statistical Note
Major trends in the overall Civil Service workforce
are often due to changes in the five largest
departments (DWP, MoJ, HMRC, MoD, HO). These
departments account for 71% of the workforce.
Comparing headcount by data source 2009 to
2019
The latest published statistics from the ONS
Quarterly Public Sector Employment Survey
(QPSES) are also as at March 2019, and show
Civil Service employment was 446,070 (414,390
on a FTE basis). Users should refer to the regular
ONS quarterly statistics when monitoring changes
in the size of the Civil Service.
Civil Service Statistics 2019 Cabinet Office National Statistics
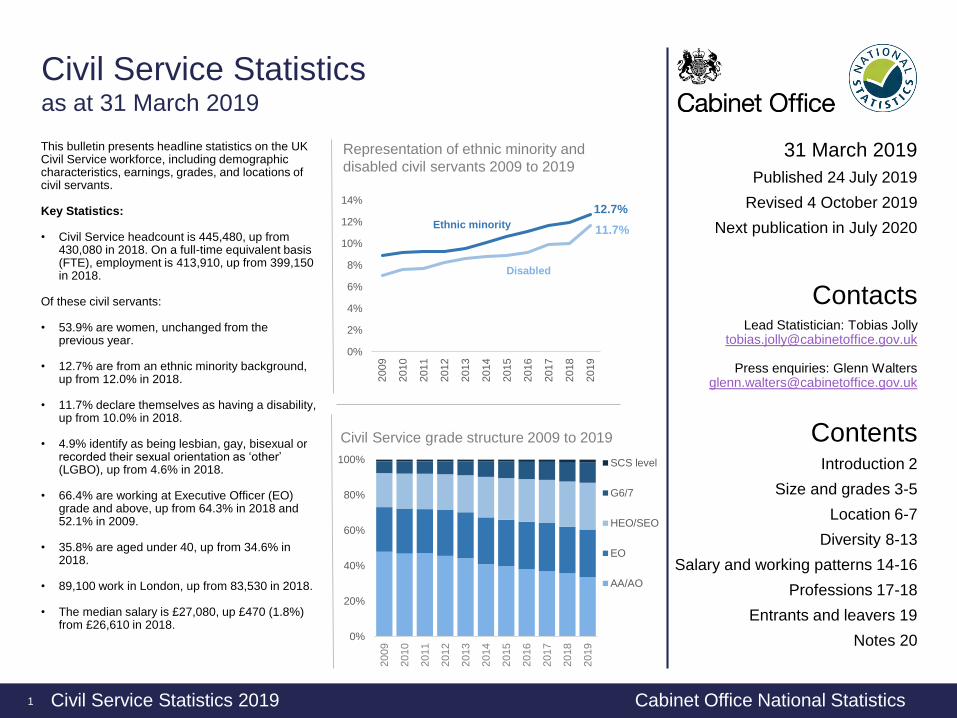
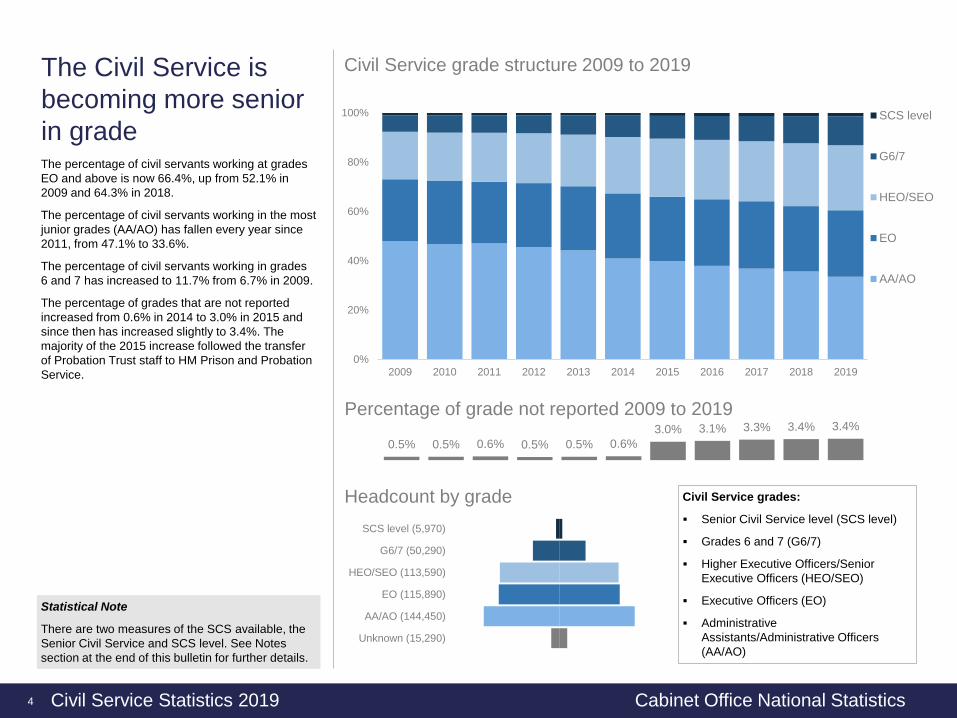
The Civil Service is
becoming more senior
in grade
4
Statistical Note
There are two measures of the SCS available, the
Senior Civil Service and SCS level. See Notes
section at the end of this bulletin for further details.
Civil Service grades:
Senior Civil Service level (SCS level)
Grades 6 and 7 (G6/7)
Higher Executive Officers/Senior
Executive Officers (HEO/SEO)
Executive Officers (EO)
Administrative
Assistants/Administrative Officers
(AA/AO)
The percentage of civil servants working at grades
EO and above is now 66.4%, up from 52.1% in
2009 and 64.3% in 2018.
The percentage of civil servants working in the most
junior grades (AA/AO) has fallen every year since
2011, from 47.1% to 33.6%.
The percentage of civil servants working in grades
6 and 7 has increased to 11.7% from 6.7% in 2009.
The percentage of grades that are not reported
increased from 0.6% in 2014 to 3.0% in 2015 and
since then has increased slightly to 3.4%. The
majority of the 2015 increase followed the transfer
of Probation Trust staff to HM Prison and Probation
Service.
Unknown (15,290)
AA/AO (144,450)
EO (115,890)
HEO/SEO (113,590)
G6/7 (50,290)
SCS level (5,970)
Headcount by grade
0%
20%
40%
60%
80%
100%
2009 2010 2011 2012 2013 2014 2015 2016 2017 2018 2019
Civil Service grade structure 2009 to 2019
SCS level
G6/7
HEO/SEO
EO
AA/AO
0.5% 0.5% 0.6% 0.5% 0.5% 0.6%
3.0% 3.1% 3.3% 3.4% 3.4%
Percentage of grade not reported 2009 to 2019
Civil Service Statistics 2019 Cabinet Office National Statistics
0% 20% 40% 60% 80% 100%
HM Treasury
Competition and Markets Authority
National Savings and Investments
Department for International Trade
Office of Qualifications and Examinations Regulation
Office of Rail and Road
Water Services Regulation Authority
Department for International Development
Department for Digital, Culture, Media and Sport
Cabinet Office
Department for Exiting the European Union
Department for Education
UK Export Finance
Government Actuary's Department
Scotland Office
Northern Ireland Office
Office of Gas and Electricity Markets
Ministry of Housing, Communities and Local Government
Department of Health and Social Care
Foreign and Commonwealth Office
Office for Standards in Education
Department for Business, Energy and Industrial Strategy
Charity Commission
ESTYN
Wales Office
Welsh Government
Attorney General's Departments
The National Archives
Food Standards Agency
Department for Environment, Food and Rural Affairs
UK Supreme Court
United Kingdom Statistics Authority
Ministry of Defence
National Crime Agency
Scottish Government
HM Revenue and Customs
HM Land Registry
Department for Transport
Home Office
Ministry of Justice
Department for Work and Pensions
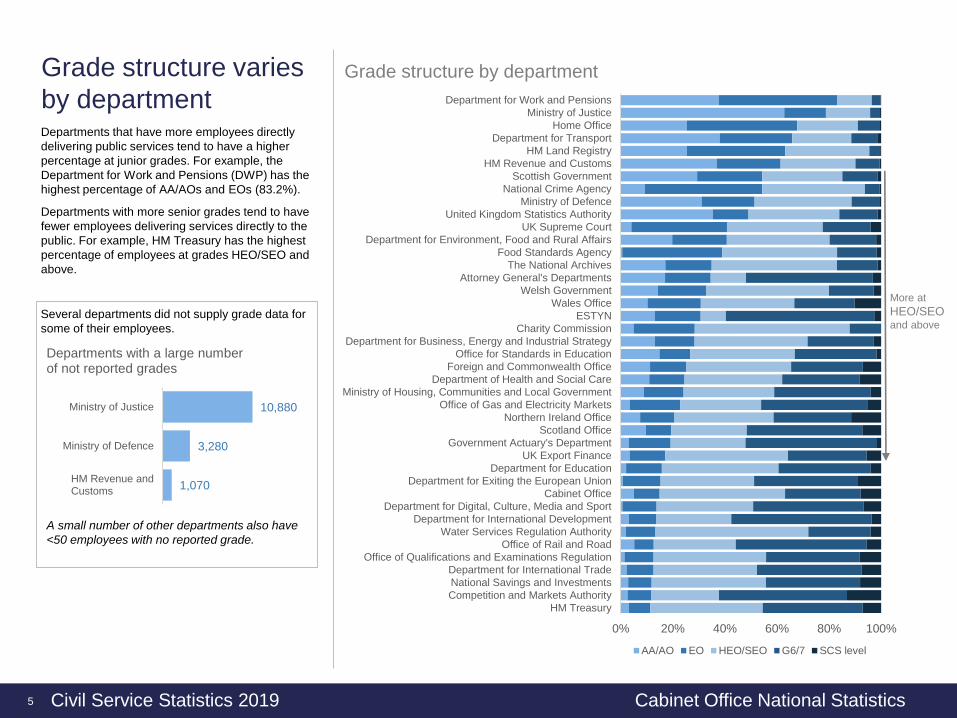
Grade structure by department
AA/AO EO HEO/SEO G6/7 SCS level
Grade structure varies
by department
5
Departments that have more employees directly
delivering public services tend to have a higher
percentage at junior grades. For example, the
Department for Work and Pensions (DWP) has the
highest percentage of AA/AOs and EOs (83.2%).
Departments with more senior grades tend to have
fewer employees delivering services directly to the
public. For example, HM Treasury has the highest
percentage of employees at grades HEO/SEO and
above.
More at
HEO/SEOand above
1,070
3,280
10,880
HM Revenue andCustoms
Ministry of Defence
Ministry of Justice
Departments with a large number of not reported grades
Several departments did not supply grade data for
some of their employees.
A small number of other departments also have
<50 employees with no reported grade.
Civil Service Statistics 2019 Cabinet Office National Statistics
Civil Servants work
across all regions of the
UK, and overseas
6
Statistical Note
These regions are NUTS1 statistical regions as
defined by Eurostat and the Office for National
Statistics (with the exception of “overseas”).
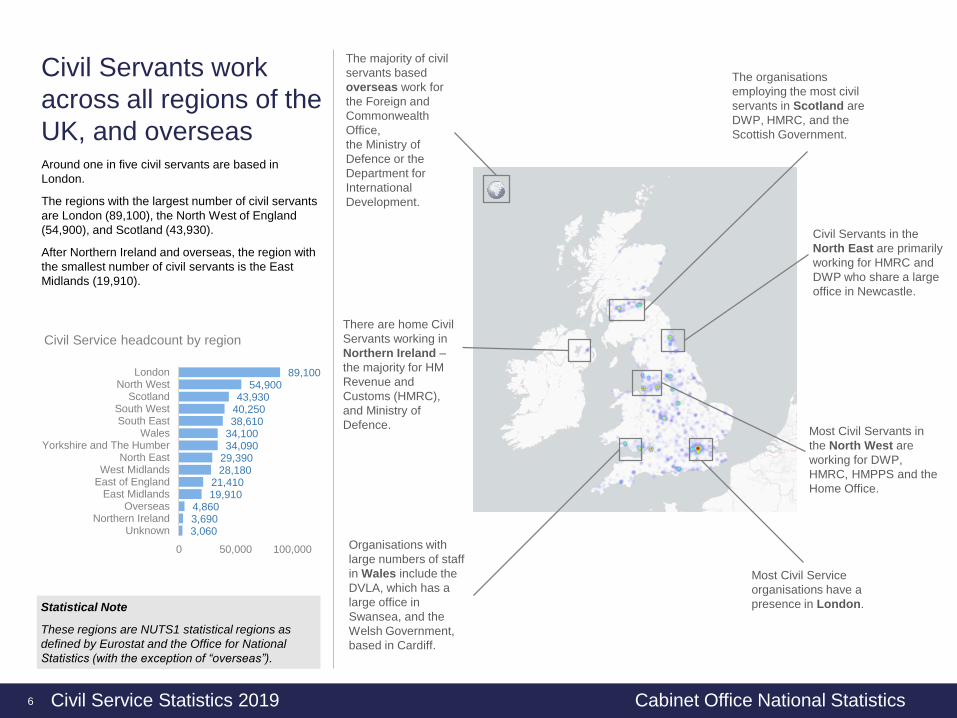
Most Civil Service
organisations have a
presence in London.
Civil Servants in the
North East are primarily
working for HMRC and
DWP who share a large
office in Newcastle.
Around one in five civil servants are based in
London.
The regions with the largest number of civil servants
are London (89,100), the North West of England
(54,900), and Scotland (43,930).
After Northern Ireland and overseas, the region with
the smallest number of civil servants is the East
Midlands (19,910).
The majority of civil
servants based
overseas work for
the Foreign and
Commonwealth
Office,
the Ministry of
Defence or the
Department for
International
Development.
Organisations with
large numbers of staff
in Wales include the
DVLA, which has a
large office in
Swansea, and the
Welsh Government,
based in Cardiff.
The organisations
employing the most civil
servants in Scotland are
DWP, HMRC, and the
Scottish Government.
There are home Civil
Servants working in
Northern Ireland –
the majority for HM
Revenue and
Customs (HMRC),
and Ministry of
Defence.
3,0603,6904,860
19,91021,410
28,18029,39034,09034,10038,61040,25043,930
54,90089,100
0 50,000 100,000
UnknownNorthern Ireland
OverseasEast Midlands
East of EnglandWest Midlands
North EastYorkshire and The Humber
WalesSouth EastSouth West
ScotlandNorth West
London
Civil Service headcount by region
Most Civil Servants in
the North West are
working for DWP,
HMRC, HMPPS and the
Home Office.
Civil Service Statistics 2019 Cabinet Office National Statistics
Nearly all UK regions
have seen increases in
Civil Service
employment
7
Statistical Note
These regions are NUTS1 statistical regions as
defined by Eurostat and the Office for National
Statistics (with the exception of “overseas”).
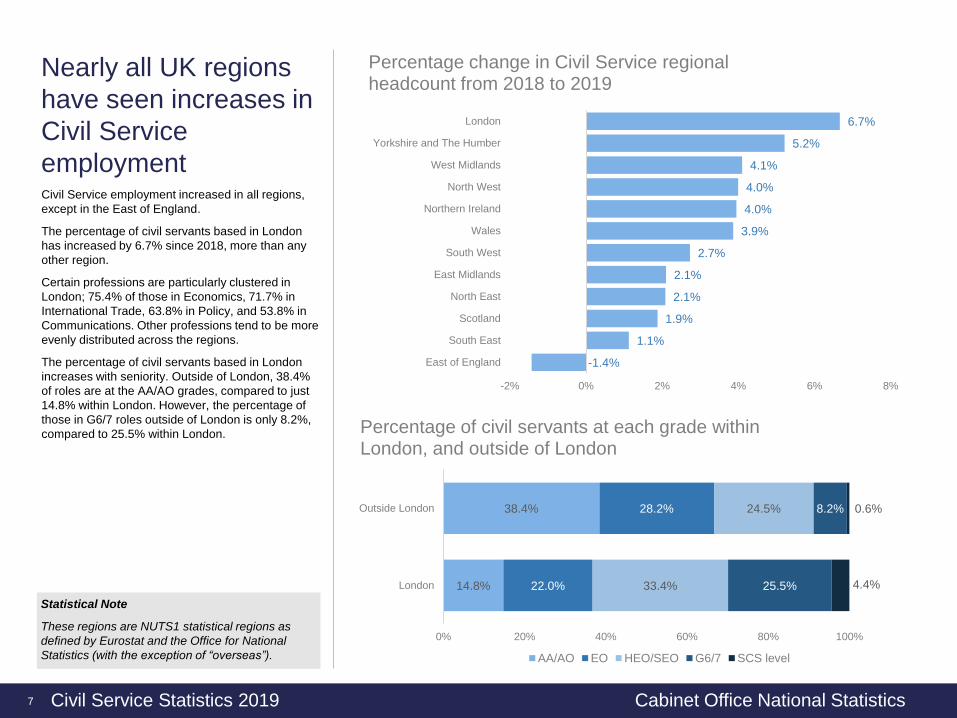
Civil Service employment increased in all regions,
except in the East of England.
The percentage of civil servants based in London
has increased by 6.7% since 2018, more than any
other region.
Certain professions are particularly clustered in
London; 75.4% of those in Economics, 71.7% in
International Trade, 63.8% in Policy, and 53.8% in
Communications. Other professions tend to be more
evenly distributed across the regions.
The percentage of civil servants based in London
increases with seniority. Outside of London, 38.4%
of roles are at the AA/AO grades, compared to just
14.8% within London. However, the percentage of
those in G6/7 roles outside of London is only 8.2%,
compared to 25.5% within London.
-1.4%
1.1%
1.9%
2.1%
2.1%
2.7%
3.9%
4.0%
4.0%
4.1%
5.2%
6.7%
-2% 0% 2% 4% 6% 8%
East of England
South East
Scotland
North East
East Midlands
South West
Wales
Northern Ireland
North West
West Midlands
Yorkshire and The Humber
London
Percentage change in Civil Service regional headcount from 2018 to 2019
14.8%
38.4%
22.0%
28.2%
33.4%
24.5%
25.5%
8.2%
4.4%
0.6%
0% 20% 40% 60% 80% 100%
London
Outside London
Percentage of civil servants at each grade within London, and outside of London
AA/AO EO HEO/SEO G6/7 SCS level
Civil Service Statistics 2019 Cabinet Office National Statistics
Women are still under-
represented in senior
grades
8
Statistical Note
This ACSES data collection that informs these
statistics collects data on sex, not gender. We
therefore refer to sex throughout these statistics.
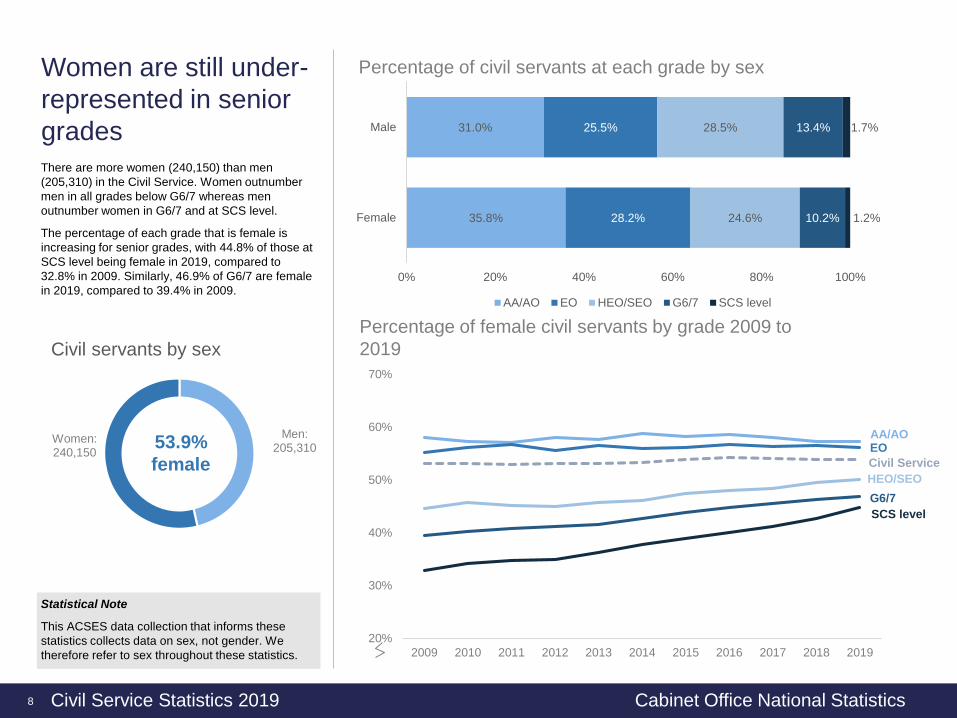
There are more women (240,150) than men
(205,310) in the Civil Service. Women outnumber
men in all grades below G6/7 whereas men
outnumber women in G6/7 and at SCS level.
The percentage of each grade that is female is
increasing for senior grades, with 44.8% of those at
SCS level being female in 2019, compared to
32.8% in 2009. Similarly, 46.9% of G6/7 are female
in 2019, compared to 39.4% in 2009.
AA/AOEO
HEO/SEO
G6/7
SCS level
Civil Service
20%
30%
40%
50%
60%
70%
2009 2010 2011 2012 2013 2014 2015 2016 2017 2018 2019
Men:205,310
Women:240,150
Civil servants by sex
53.9%
female
35.8%
31.0%
28.2%
25.5%
24.6%
28.5%
10.2%
13.4%
1.2%
1.7%
0% 20% 40% 60% 80% 100%
Female
Male
Percentage of civil servants at each grade by sex
AA/AO EO HEO/SEO G6/7 SCS level
Percentage of female civil servants by grade 2009 to
2019
Civil Service Statistics 2019 Cabinet Office National Statistics
The percentage of civil
servants aged under 40
has increased
9
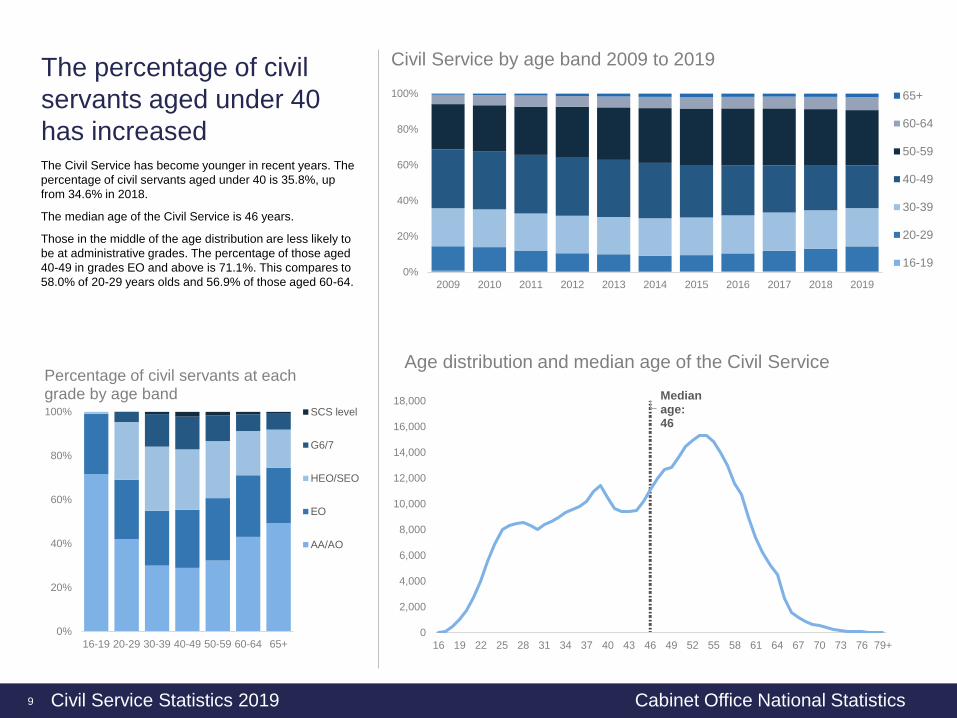
The Civil Service has become younger in recent years. The
percentage of civil servants aged under 40 is 35.8%, up
from 34.6% in 2018.
The median age of the Civil Service is 46 years.
Those in the middle of the age distribution are less likely to
be at administrative grades. The percentage of those aged
40-49 in grades EO and above is 71.1%. This compares to
58.0% of 20-29 years olds and 56.9% of those aged 60-64.
Medianage: 46
0
2,000
4,000
6,000
8,000
10,000
12,000
14,000
16,000
18,000
16 19 22 25 28 31 34 37 40 43 46 49 52 55 58 61 64 67 70 73 76 79+
Age distribution and median age of the Civil Service
0%
20%
40%
60%
80%
100%
2009 2010 2011 2012 2013 2014 2015 2016 2017 2018 2019
Civil Service by age band 2009 to 2019
65+
60-64
50-59
40-49
30-39
20-29
16-19
0%
20%
40%
60%
80%
100%
16-19 20-29 30-39 40-49 50-59 60-64 65+
Percentage of civil servants at each grade by age band
SCS level
G6/7
HEO/SEO
EO
AA/AO
Civil Service Statistics 2019 Cabinet Office National Statistics
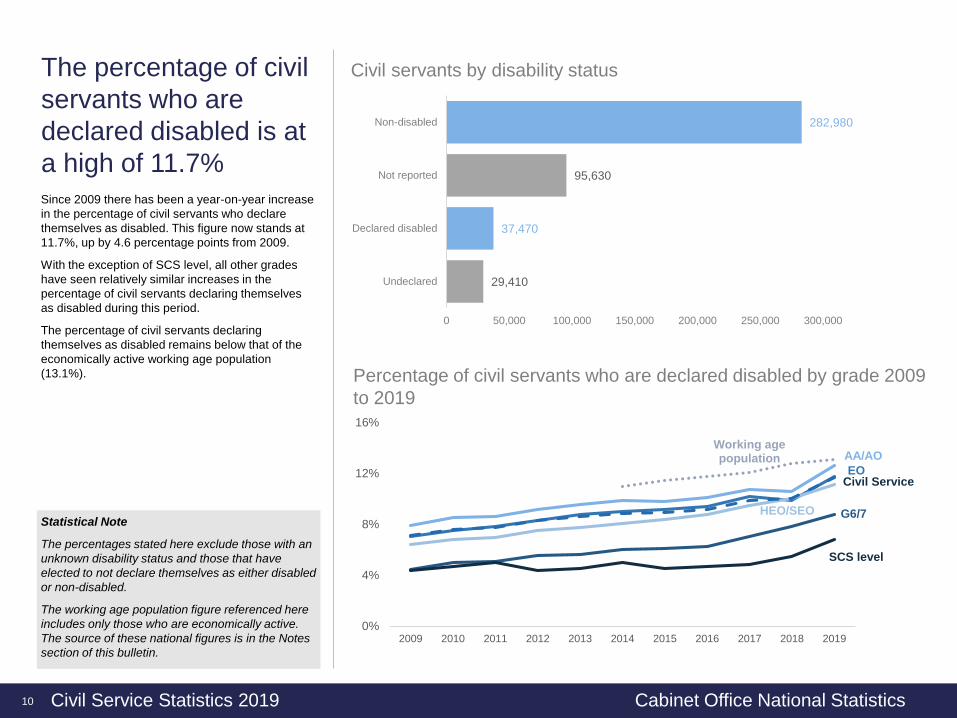
The percentage of civil
servants who are
declared disabled is at
a high of 11.7%
10
Statistical Note
The percentages stated here exclude those with an
unknown disability status and those that have
elected to not declare themselves as either disabled
or non-disabled.
The working age population figure referenced here
includes only those who are economically active.
The source of these national figures is in the Notes
section of this bulletin.
Since 2009 there has been a year-on-year increase
in the percentage of civil servants who declare
themselves as disabled. This figure now stands at
11.7%, up by 4.6 percentage points from 2009.
With the exception of SCS level, all other grades
have seen relatively similar increases in the
percentage of civil servants declaring themselves
as disabled during this period.
The percentage of civil servants declaring
themselves as disabled remains below that of the
economically active working age population
(13.1%).
29,410
37,470
95,630
282,980
0 50,000 100,000 150,000 200,000 250,000 300,000
Undeclared
Declared disabled
Not reported
Non-disabled
Civil servants by disability status
AA/AO
EO
HEO/SEO G6/7
SCS level
Working age population
Civil Service
0%
4%
8%
12%
16%
2009 2010 2011 2012 2013 2014 2015 2016 2017 2018 2019
Percentage of civil servants who are declared disabled by grade 2009
to 2019
Civil Service Statistics 2019 Cabinet Office National Statistics
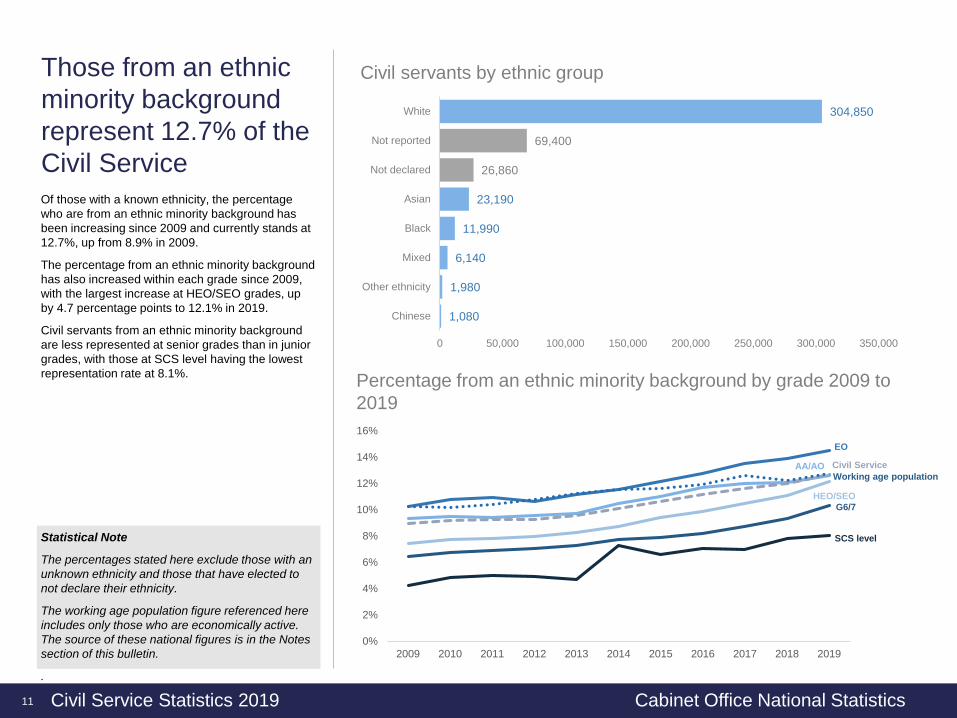
Those from an ethnic
minority background
represent 12.7% of the
Civil Service
11
Of those with a known ethnicity, the percentage
who are from an ethnic minority background has
been increasing since 2009 and currently stands at
12.7%, up from 8.9% in 2009.
The percentage from an ethnic minority background
has also increased within each grade since 2009,
with the largest increase at HEO/SEO grades, up
by 4.7 percentage points to 12.1% in 2019.
Civil servants from an ethnic minority background
are less represented at senior grades than in junior
grades, with those at SCS level having the lowest
representation rate at 8.1%.
1,080
1,980
6,140
11,990
23,190
26,860
69,400
304,850
0 50,000 100,000 150,000 200,000 250,000 300,000 350,000
Chinese
Other ethnicity
Mixed
Black
Asian
Not declared
Not reported
White
Civil servants by ethnic group
Statistical Note
The percentages stated here exclude those with an
unknown ethnicity and those that have elected to
not declare their ethnicity.
The working age population figure referenced here
includes only those who are economically active.
The source of these national figures is in the Notes
section of this bulletin.
.
AA/AO
EO
HEO/SEO
G6/7
SCS level
Civil Service
Working age population
0%
2%
4%
6%
8%
10%
12%
14%
16%
2009 2010 2011 2012 2013 2014 2015 2016 2017 2018 2019
Percentage from an ethnic minority background by grade 2009 to
2019
Civil Service Statistics 2019 Cabinet Office National Statistics
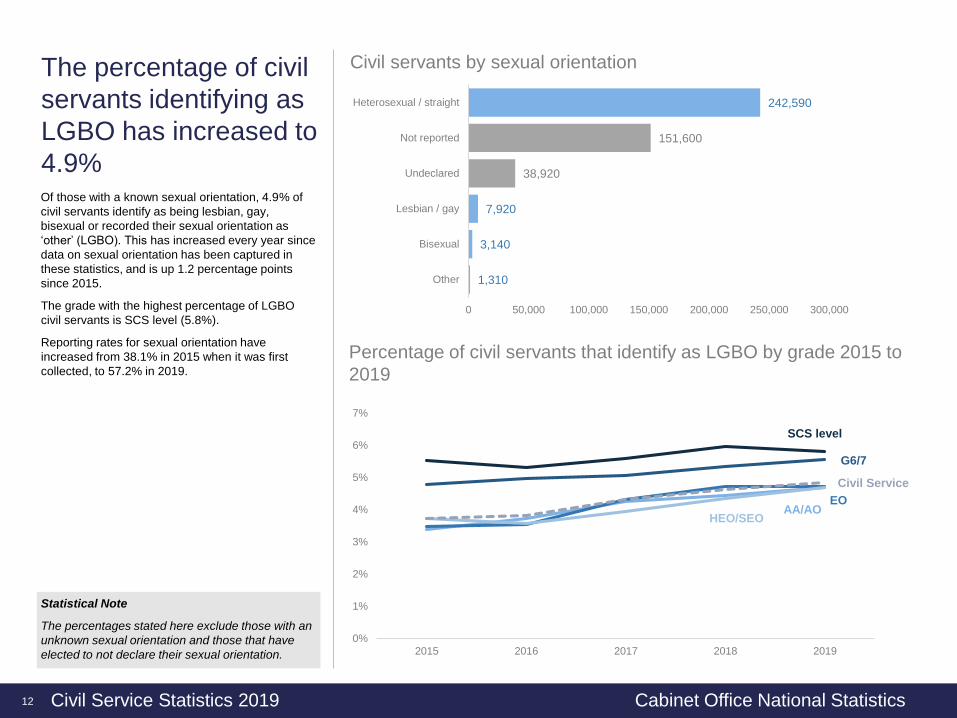
The percentage of civil
servants identifying as
LGBO has increased to
4.9%
12
Statistical Note
The percentages stated here exclude those with an
unknown sexual orientation and those that have
elected to not declare their sexual orientation.
Of those with a known sexual orientation, 4.9% of
civil servants identify as being lesbian, gay,
bisexual or recorded their sexual orientation as
‘other’ (LGBO). This has increased every year since
data on sexual orientation has been captured in
these statistics, and is up 1.2 percentage points
since 2015.
The grade with the highest percentage of LGBO
civil servants is SCS level (5.8%).
Reporting rates for sexual orientation have
increased from 38.1% in 2015 when it was first
collected, to 57.2% in 2019.
1,310
3,140
7,920
38,920
151,600
242,590
0 50,000 100,000 150,000 200,000 250,000 300,000
Other
Bisexual
Lesbian / gay
Undeclared
Not reported
Heterosexual / straight
Civil servants by sexual orientation
AA/AOEO
HEO/SEO
G6/7
SCS level
Civil Service
0%
1%
2%
3%
4%
5%
6%
7%
2015 2016 2017 2018 2019
Percentage of civil servants that identify as LGBO by grade 2015 to
2019
Civil Service Statistics 2019 Cabinet Office National Statistics
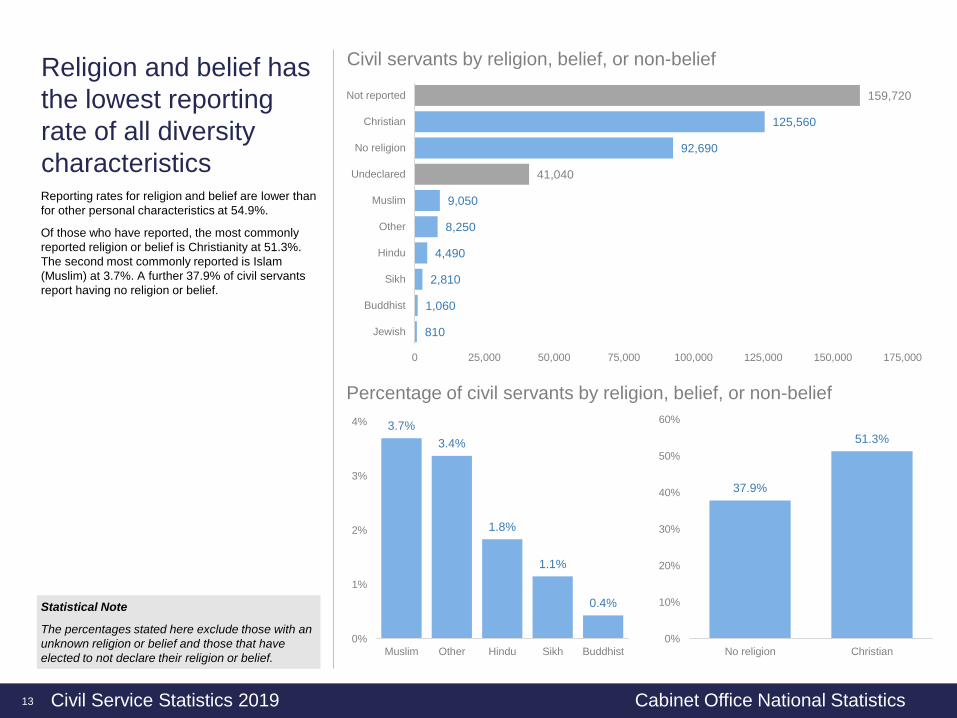
Religion and belief has
the lowest reporting
rate of all diversity
characteristics
13
Statistical Note
The percentages stated here exclude those with an
unknown religion or belief and those that have
elected to not declare their religion or belief.
Reporting rates for religion and belief are lower than
for other personal characteristics at 54.9%.
Of those who have reported, the most commonly
reported religion or belief is Christianity at 51.3%.
The second most commonly reported is Islam
(Muslim) at 3.7%. A further 37.9% of civil servants
report having no religion or belief.
Percentage of civil servants by religion, belief, or non-belief
810
1,060
2,810
4,490
8,250
9,050
41,040
92,690
125,560
159,720
0 25,000 50,000 75,000 100,000 125,000 150,000 175,000
Jewish
Buddhist
Sikh
Hindu
Other
Muslim
Undeclared
No religion
Christian
Not reported
Civil servants by religion, belief, or non-belief
3.7%
3.4%
1.8%
1.1%
0.4%
0%
1%
2%
3%
4%
Muslim Other Hindu Sikh Buddhist
37.9%
51.3%
0%
10%
20%
30%
40%
50%
60%
No religion Christian
Civil Service Statistics 2019 Cabinet Office National Statistics
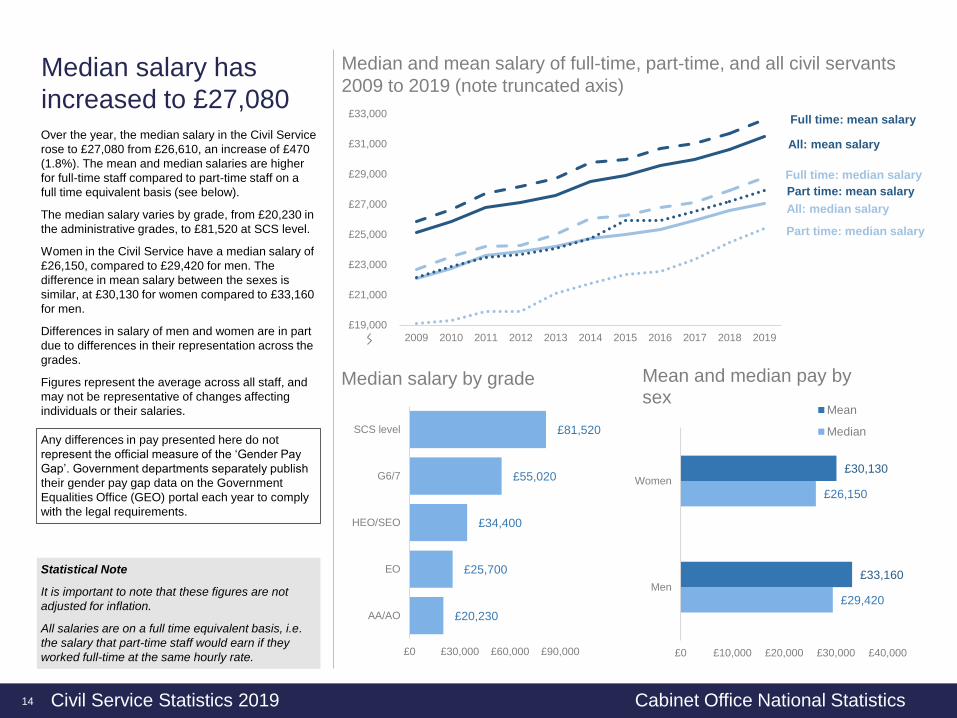
Median salary has
increased to £27,080
14
Statistical Note
It is important to note that these figures are not
adjusted for inflation.
All salaries are on a full time equivalent basis, i.e.
the salary that part-time staff would earn if they
worked full-time at the same hourly rate.
Over the year, the median salary in the Civil Service
rose to £27,080 from £26,610, an increase of £470
(1.8%). The mean and median salaries are higher
for full-time staff compared to part-time staff on a
full time equivalent basis (see below).
The median salary varies by grade, from £20,230 in
the administrative grades, to £81,520 at SCS level.
Women in the Civil Service have a median salary of
£26,150, compared to £29,420 for men. The
difference in mean salary between the sexes is
similar, at £30,130 for women compared to £33,160
for men.
Differences in salary of men and women are in part
due to differences in their representation across the
grades.
Figures represent the average across all staff, and
may not be representative of changes affecting
individuals or their salaries.
£20,230
£25,700
£34,400
£55,020
£81,520
£0 £30,000 £60,000 £90,000
AA/AO
EO
HEO/SEO
G6/7
SCS level
Median salary by grade
£29,420
£26,150
£33,160
£30,130
£0 £10,000 £20,000 £30,000 £40,000
Men
Women
Mean and median pay by sex
Mean
Median
Median and mean salary of full-time, part-time, and all civil servants
2009 to 2019 (note truncated axis)
Any differences in pay presented here do not
represent the official measure of the ‘Gender Pay
Gap’. Government departments separately publish
their gender pay gap data on the Government
Equalities Office (GEO) portal each year to comply
with the legal requirements.
All: mean salary
All: median salary
Full time: mean salary
Full time: median salary
Part time: mean salary
Part time: median salary
£19,000
£21,000
£23,000
£25,000
£27,000
£29,000
£31,000
£33,000
2009 2010 2011 2012 2013 2014 2015 2016 2017 2018 2019
Civil Service Statistics 2019 Cabinet Office National Statistics
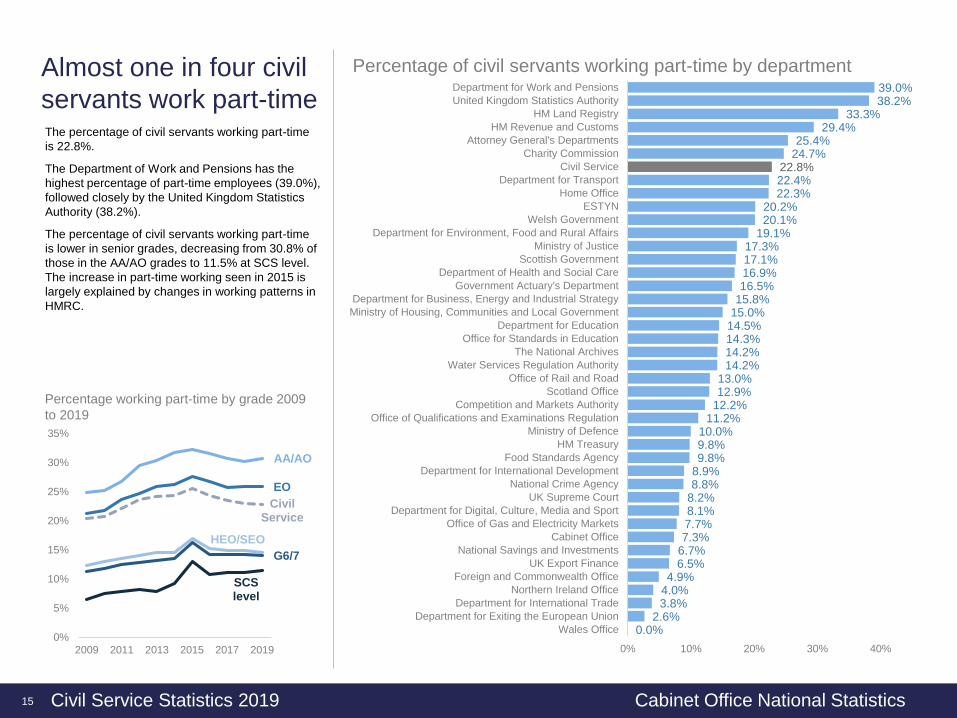
Almost one in four civil
servants work part-time
15
The percentage of civil servants working part-time
is 22.8%.
The Department of Work and Pensions has the
highest percentage of part-time employees (39.0%),
followed closely by the United Kingdom Statistics
Authority (38.2%).
The percentage of civil servants working part-time
is lower in senior grades, decreasing from 30.8% of
those in the AA/AO grades to 11.5% at SCS level.
The increase in part-time working seen in 2015 is
largely explained by changes in working patterns in
HMRC.
AA/AO
EO
HEO/SEO
G6/7
SCS level
Civil Service
0%
5%
10%
15%
20%
25%
30%
35%
2009 2011 2013 2015 2017 2019
0.0%2.6%
3.8%4.0%4.9%
6.5%6.7%7.3%7.7%8.1%8.2%8.8%8.9%9.8%9.8%10.0%
11.2%12.2%12.9%13.0%
14.2%14.2%14.3%14.5%15.0%15.8%16.5%16.9%17.1%17.3%
19.1%20.1%20.2%
22.3%22.4%22.8%
24.7%25.4%
29.4%33.3%
38.2%39.0%
0% 10% 20% 30% 40%
Wales Office
Department for Exiting the European Union
Department for International Trade
Northern Ireland Office
Foreign and Commonwealth Office
UK Export Finance
National Savings and Investments
Cabinet Office
Office of Gas and Electricity Markets
Department for Digital, Culture, Media and Sport
UK Supreme Court
National Crime Agency
Department for International Development
Food Standards Agency
HM Treasury
Ministry of Defence
Office of Qualifications and Examinations Regulation
Competition and Markets Authority
Scotland Office
Office of Rail and Road
Water Services Regulation Authority
The National Archives
Office for Standards in Education
Department for Education
Ministry of Housing, Communities and Local Government
Department for Business, Energy and Industrial Strategy
Government Actuary's Department
Department of Health and Social Care
Scottish Government
Ministry of Justice
Department for Environment, Food and Rural Affairs
Welsh Government
ESTYN
Home Office
Department for Transport
Civil Service
Charity Commission
Attorney General's Departments
HM Revenue and Customs
HM Land Registry
United Kingdom Statistics Authority
Department for Work and Pensions
Percentage of civil servants working part-time by department
Percentage working part-time by grade 2009
to 2019
Civil Service Statistics 2019 Cabinet Office National Statistics
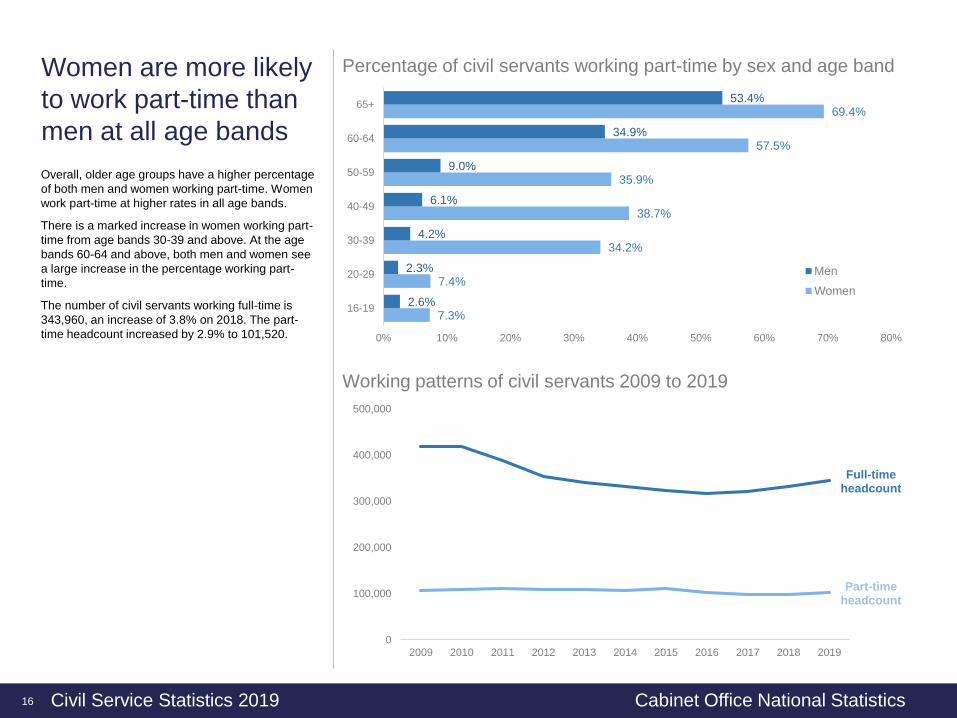
Women are more likely
to work part-time than
men at all age bands
16
Overall, older age groups have a higher percentage
of both men and women working part-time. Women
work part-time at higher rates in all age bands.
There is a marked increase in women working part-
time from age bands 30-39 and above. At the age
bands 60-64 and above, both men and women see
a large increase in the percentage working part-
time.
The number of civil servants working full-time is
343,960, an increase of 3.8% on 2018. The part-
time headcount increased by 2.9% to 101,520.
Full-time headcount
Part-time headcount
0
100,000
200,000
300,000
400,000
500,000
2009 2010 2011 2012 2013 2014 2015 2016 2017 2018 2019
7.3%
7.4%
34.2%
38.7%
35.9%
57.5%
69.4%
2.6%
2.3%
4.2%
6.1%
9.0%
34.9%
53.4%
0% 10% 20% 30% 40% 50% 60% 70% 80%
16-19
20-29
30-39
40-49
50-59
60-64
65+
Men
Women
Percentage of civil servants working part-time by sex and age band
Working patterns of civil servants 2009 to 2019
Civil Service Statistics 2019 Cabinet Office National Statistics
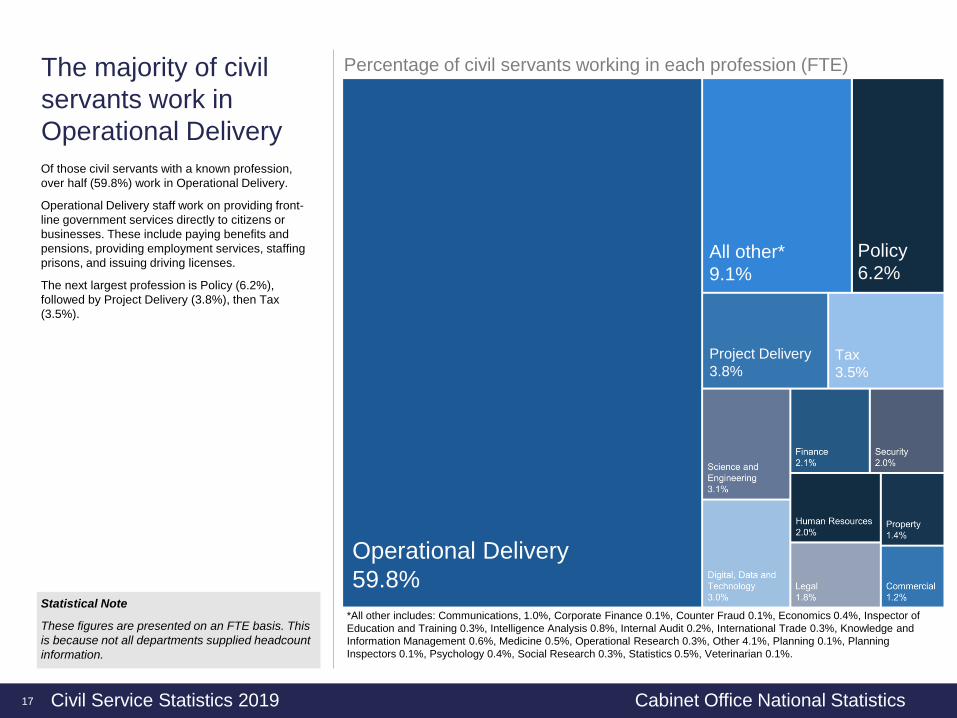
The majority of civil
servants work in
Operational Delivery
17
Statistical Note
These figures are presented on an FTE basis. This
is because not all departments supplied headcount
information.
Of those civil servants with a known profession,
over half (59.8%) work in Operational Delivery.
Operational Delivery staff work on providing front-
line government services directly to citizens or
businesses. These include paying benefits and
pensions, providing employment services, staffing
prisons, and issuing driving licenses.
The next largest profession is Policy (6.2%),
followed by Project Delivery (3.8%), then Tax
(3.5%).
*All other includes: Communications, 1.0%, Corporate Finance 0.1%, Counter Fraud 0.1%, Economics 0.4%, Inspector of
Education and Training 0.3%, Intelligence Analysis 0.8%, Internal Audit 0.2%, International Trade 0.3%, Knowledge and
Information Management 0.6%, Medicine 0.5%, Operational Research 0.3%, Other 4.1%, Planning 0.1%, Planning
Inspectors 0.1%, Psychology 0.4%, Social Research 0.3%, Statistics 0.5%, Veterinarian 0.1%.
Operational
Delivery
59.8%
All other
10.1%
Policy
6.2%
Project Delivery
3.8%
Tax
3.5%
Operational Delivery
59.8%
All other*
9.1%
Policy
6.2%
Project Delivery
3.8%Tax
3.5%
Percentage of civil servants working in each profession (FTE)
Civil Service Statistics 2019 Cabinet Office National Statistics
£0 £20,000 £40,000 £60,000 £80,000 £100,000
Operational Delivery
Counter Fraud
Security
Psychology
Intelligence Analysis
Other
Tax
Property
Knowledge and information Management
Human Resources
Finance
Operational Research
Communications
Commercial
Digital, Data and Technology
Science and Engineering
Corporate Finance
Planning
Project Delivery
Social Research
Statistics
Medicine
Internal Audit
Policy
International Trade
Veterinarian
Inspector of Education and Training
Economics
Legal
Planning Inspectors
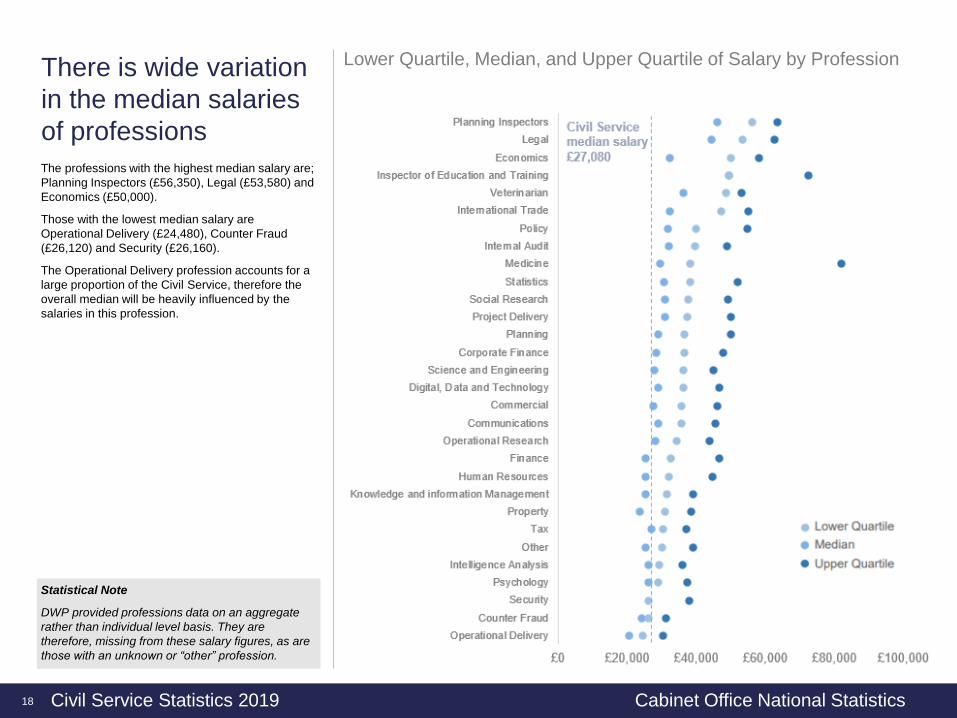
There is wide variation
in the median salaries
of professions
18
Statistical Note
DWP provided professions data on an aggregate
rather than individual level basis. They are
therefore, missing from these salary figures, as are
those with an unknown or “other” profession.
The professions with the highest median salary are;
Planning Inspectors (£56,350), Legal (£53,580) and
Economics (£50,000).
Those with the lowest median salary are
Operational Delivery (£24,480), Counter Fraud
(£26,120) and Security (£26,160).
The Operational Delivery profession accounts for a
large proportion of the Civil Service, therefore the
overall median will be heavily influenced by the
salaries in this profession.
Civil Service
median salary
£27,080
Lower Quartile, Median, and Upper Quartile of Salary by Profession
Civil Service Statistics 2019 Cabinet Office National Statistics
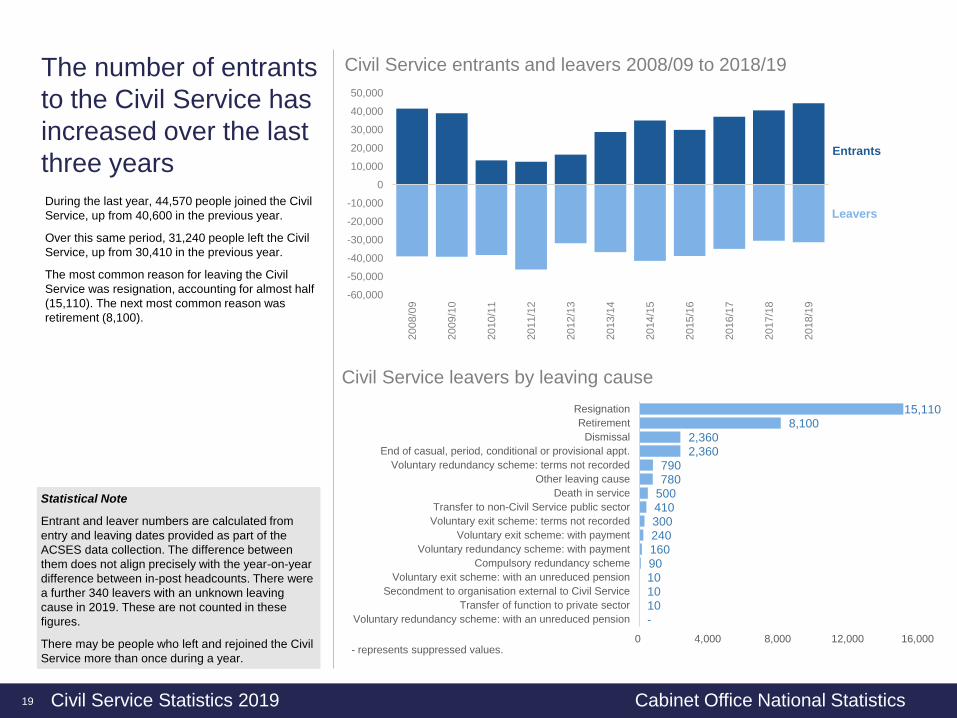
The number of entrants
to the Civil Service has
increased over the last
three years
19
Statistical Note
Entrant and leaver numbers are calculated from
entry and leaving dates provided as part of the
ACSES data collection. The difference between
them does not align precisely with the year-on-year
difference between in-post headcounts. There were
a further 340 leavers with an unknown leaving
cause in 2019. These are not counted in these
figures.
There may be people who left and rejoined the Civil
Service more than once during a year.
During the last year, 44,570 people joined the Civil
Service, up from 40,600 in the previous year.
Over this same period, 31,240 people left the Civil
Service, up from 30,410 in the previous year.
The most common reason for leaving the Civil
Service was resignation, accounting for almost half
(15,110). The next most common reason was
retirement (8,100).
Entrants
Leavers
-60,000
-50,000
-40,000
-30,000
-20,000
-10,000
0
10,000
20,000
30,000
40,000
50,000
2008/0
9
2009/1
0
2010/1
1
2011/1
2
2012/1
3
2013/1
4
2014/1
5
2015/1
6
2016/1
7
2017/1
8
2018/1
9
Civil Service entrants and leavers 2008/09 to 2018/19
-10 10 10 90 160 240 300 410 500 780 790
2,360 2,360
8,100 15,110
0 4,000 8,000 12,000 16,000
Voluntary redundancy scheme: with an unreduced pension
Transfer of function to private sector
Secondment to organisation external to Civil Service
Voluntary exit scheme: with an unreduced pension
Compulsory redundancy scheme
Voluntary redundancy scheme: with payment
Voluntary exit scheme: with payment
Voluntary exit scheme: terms not recorded
Transfer to non-Civil Service public sector
Death in service
Other leaving cause
Voluntary redundancy scheme: terms not recorded
End of casual, period, conditional or provisional appt.
Dismissal
Retirement
Resignation
Civil Service leavers by leaving cause
- represents suppressed values.
Civil Service Statistics 2019 Cabinet Office National Statistics
NotesSee the quality and methodology information document for further detail
20
How the output is created
The statistics in the bulletin are derived from returns completed as part of the
Annual Civil Service Employment Survey (ACSES). Its scope covers all Civil
Service organisations, including all major Departments.
ACSES requests from organisations an individual level record of all their Civil
Service employees ‘in post’ as at the reference date, along with records for
leavers and joiners from/to the Civil Service in the preceding 12 months. ACSES
collects information via a standard Excel template and includes data fields on
pay, contractual hours, grade and location. It also includes personal
characteristics, such as age, sex, religion, and sexual orientation. The data
collected are anonymous in that no employee names are requested. However,
the data is considered and handled as ‘personal data’ because in certain
circumstances individuals may be identifiable.
Where departmental level figures are quoted these will include the main
department and their executive agencies and crown non-departmental public
bodies (NDPBs). Given the varied nature of the HR/pay systems within
departments caution should be exercised in comparing statistics across
departments.
Further information
The Civil Service Statistics data tables, and the quality and methodology
information document are published on gov.uk.
https://www.gov.uk/government/collections/civil-service-statistics
Data up to 2018 are also made available via NOMIS, which is a service provided
by the ONS to give users free access to a range of UK labour market statistics
from official sources. Following the transfer of responsibility for Civil Service
Statistics from ONS to Cabinet Office, the CO team are working on making 2019
data available through the NOMIS tool.
https://www.nomisweb.co.uk/
External Sources
Comparative data for the UK workforce on disability and ethnicity are sourced
from the Office for National Statistics Labour market overview UK, published on
July 2019. Figures in this publication are based on the Labour Force Survey as at
March 2019, and include the UK working age population aged 16-64 who are
economically active.
Technical notes
Organisations within the Civil Service have different grading systems, which have
been mapped to common responsibility levels in the statistics presented in this
bulletin.
For presentational purposes, some of the figures presented in this bulletin are
aggregated up to the main departmental level.
There are two measures of the SCS available, the Senior Civil Service and SCS
level. ACSES measures SCS level employees, including a number of health
professionals, military personnel, and senior diplomats that are not part of the
Senior Civil Service. As such, the Civil Service Statistics release does not contain
the official headline figures used for monitoring diversity, pay and other key
measures of the Senior Civil Service. These are monitored using the Cabinet
Office SCS Database that collects more frequent and comprehensive information
on those individuals that make up the Senior Civil Service.
Religions and beliefs are collected and presented in line with ONS guidelines.
Revisions
A small number of figures in this document have been revised since the first
version was published – please see the associated data tables (here), for full
details of what has changed