Embed Size (px)
Citation preview
U.S. Department of the InteriorU.S. Geological Survey
Open-File Report 2004-1043
National Assessment Of Shoreline Change: Part 1Historical Shoreline Changes And Associated Coastal Land Loss Along The U.S. Gulf Of Mexico
Robert A. Morton, Tara L. Miller, and Laura J. Moore
National Assessment Of Shoreline Change: Part 1Historical Shoreline Changes And Associated Coastal Land Loss Along The U.S. Gulf Of Mexico
Robert A. Morton, Tara L. Miller, and Laura J. Moore
Open File Report 2004-1043
U.S. Geological Survey
Center for Coastal and Watershed Studies
St. Petersburg, FL 33701
This report is preliminary and has not been reviewed for conformity with U.S. Geological Survey editorial standards. Any use of trade names is for descriptive purposes only and does not imply endorsement by the U.S.Government.
Morton, Robert A., Miller, Tara L., and Moore, Laura J., 2004, National assessment of shoreline change: Part 1: Historical shoreline changes and associated coastal land loss along the U.S. Gulf of Mexico: U.S. Geological Survey Open-file Report 2004-1043, 45p.
U.S. Department of the InteriorU.S. Geological Survey
Open-File Report 2004-1043 i
Contents
EXECUTIVE SUMMARY.............................................................................................................................................................................. 4INTRODUCTION .......................................................................................................................................................................................... 4
U.S. Geological Survey National Assessment of Shoreline Change......................................................................................... 4Disclaimer ........................................................................................................................................................................................... 5Acknowledgments ............................................................................................................................................................................. 5
THE ROLE OF STATE AND FEDERAL GOVERNMENTS .......................................................................................................................... 5PRIOR NATIONAL AND GULF COAST SHORELINE ASSESSMENTS.................................................................................................. 6METHODS OF ANALYZING SHORELINE CHANGE................................................................................................................................. 6
Compilation of Historical Shorelines .............................................................................................................................................. 6Delineation of a Modern (lidar-derived) Shoreline ...................................................................................................................... 7Geographic Information System (GIS) Procedures ..................................................................................................................... 9Calculation and Presentation of Rates of Change ..................................................................................................................... 10Shoreline Definitions and Beach Alterations that Influence Rates of Change ..................................................................... 11
Shoreline Definitions.............................................................................................................................................................. 11Human Activities ..................................................................................................................................................................... 12
Reliability of the Results ................................................................................................................................................................. 12GEOMORPHOLOGY OF THE GULF COAST REGION ............................................................................................................................. 14
Gulf of Mexico Mainland Shores .................................................................................................................................................. 16Bays and Lagoons ........................................................................................................................................................................... 16Barrier Islands.................................................................................................................................................................................. 16
Origin and Evolution of Barriers ........................................................................................................................................... 16Morphologies of Gulf Coast Barrier Islands....................................................................................................................... 18
Chenier Plain .................................................................................................................................................................................... 20Tidal Inlets ......................................................................................................................................................................................... 20
GEOLOGIC HISTORY AND SETTING ...................................................................................................................................................... 20Climate ............................................................................................................................................................................................... 21Coastal Processes........................................................................................................................................................................... 21Sand Sources ................................................................................................................................................................................... 24
GENERAL CHARACTERISTICS OF THE GULF SHORES BY STATE..................................................................................................... 25HISTORY OF INFRASTRUCTURE DEVELOPMENT ............................................................................................................................... 26SHORELINE CHANGE AND COASTAL LAND LOSS ............................................................................................................................. 27
West Florida...................................................................................................................................................................................... 27Alabama ............................................................................................................................................................................................ 29Mississippi ........................................................................................................................................................................................ 29Louisiana ........................................................................................................................................................................................... 31Texas ............................................................................................................................................................................................... 31
HUMAN RESPONSES TO COASTAL EROSION AND LAND LOSS..................................................................................................... 32DISCUSSION AND FURTHER CONSIDERATIONS ............................................................................................................................... 38
Summary of Shoreline Changes.................................................................................................................................................... 38Planned Updates and Related Research..................................................................................................................................... 38Influence of Human Activities ....................................................................................................................................................... 39
REFERENCES ............................................................................................................................................................................................ 39
Open-File Report 2004-1043 ii Open-File Report 2004-1043 iii
FiguresFigure 1. Example of a lidar profile from September 26, 1997 at Kitty Hawk, North Carolina for (a) the entire
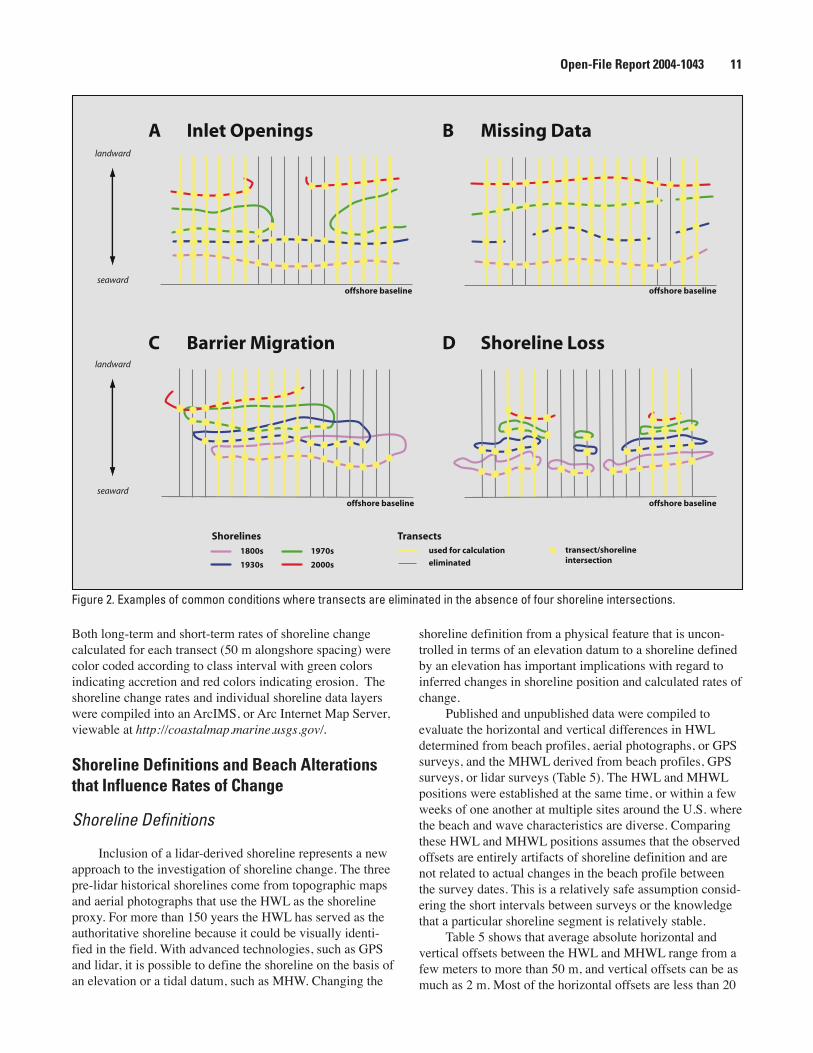
cross-shore region and (b) an expanded view of the foreshore region. .....................................................................9Figure 2. Examples of common conditions where transects are eliminated in the absence of
four shoreline intersections. .............................................................................................................................................. 11Figure 3. Index map of the Gulf Coast region. ..................................................................................................................................15Figure 4. Common coastal landforms of the Gulf Coast region. ...................................................................................................16Figure 5. Conceptual diagram showing possible origins of barrier islands. ..............................................................................17Figure 6. Sea level curve during the past 150,000 years that depicts the general magnitude and timing of
sea level changes in the Gulf of Mexico. Modified from Moore (1982). .....................................................................18Figure 7. Geomorphological characteristics of high and low profile barrier islands. Modified from
White and others (1978). .....................................................................................................................................................19Figure 8. Long linear ridges and swales that characterize some Gulf Coast barrier islands, such as San Jose Island,
Texas mark the former positions of the Gulf shoreline. ................................................................................................22Figure 9. Fields of migrating sand dunes on North Padre Island, Texas may contribute to erosion by removing
sand from the beach. ..........................................................................................................................................................22Figure 10. Long-term trends in average annual sea level at selected tide gauges in the Gulf of Mexico. Data are
from the National Ocean Service. .....................................................................................................................................23Figure 11. A coastal subdivision of nearly 200 homes near Houston, Texas was submerged as a result of subsidence
induced by ground-water production. ..............................................................................................................................24Figure 12. Tracks of some of the most deadly and destructive Atlantic and Gulf hurricanes in the 20th century.
Data are from the National Hurricane Center..................................................................................................................24Figure 13. Property damage near Panama City, Florida caused by Hurricane Eloise in 1975. From Morton (1976)...............25Figure 14. Erosion of the Gulf shore eventually destroyed this beach house at Captiva Island, Florida. ................................28Figure 15. Even where wave energy is normally low, episodic erosion during storms is capable of
destroying roads and eliminating the beach. This example of erosion along the low energy coast is from Lighthouse Point, Florida. ......................................................................................................................................28
Figure 16. This narrow eroding beach in front of a seawall near Clearwater, Florida was used for recreation before beach nourishment. ...............................................................................................................................................29
Figure 17. Many nourished beaches along the west Florida coast, such as this one on Sand Key, have steep erosional escarpments early in the history of the project. ...........................................................................................30
Figure 18. A beach nourishment project near Gulf Shores, Alabama. Accelerated erosion in front of the beach houses was attributed to construction of an artificial channel and jetties................................................................30
Figure 19. The seawall along U.S. 90 at Biloxi, Mississippi extends for nearly 27 miles. ........................................................... 31Figure 20. Long-term Gulf shoreline erosion at Sargent Beach, Texas.........................................................................................32Figure 21. Multiple structures including a seawall, riprap, and failed groin field have been unable to stop erosion at
Longboat Key, Florida. Later these structures were removed and the beach was nourished. ..............................33Figure 22. The breakwater at Redington Shores, Florida has protected the beach fill but has aggravated erosion of
adjacent sand beaches. ......................................................................................................................................................33Figure 23. Rock revetments and groins have been used to control beach erosion at Fort Gaines on the east end of
Dauphin Island, Alabama. ...................................................................................................................................................34Figure 24. Storm waves in the Gulf of Mexico destroyed the interlocking block revetment constructed to protect
Louisiana State Highway 82 near Peveto Beach (Fig. 3). The revetment structure was replaced with 85 segmented breakwaters. ...................................................................................................................................................35
Figure 25. West end of the seawall at Galveston, Texas. ...............................................................................................................36Figure 26. Visitor’s center at Padre Island National Seashore, Texas in 1982 and 1992. The concrete reinforced
structure built on the beach was torn down and a wooden structure was built landward of the dunes.............37
Open-File Report 2004-1043 ii Open-File Report 2004-1043 iii
Table 1. Prior reports of long-term historical shoreline movement. ...............................................................................................7
Table 2. Providers and original sources of historical shorelines. ...................................................................................................8
Table 3. Dates of compiled shorelines for selected periods............................................................................................................8
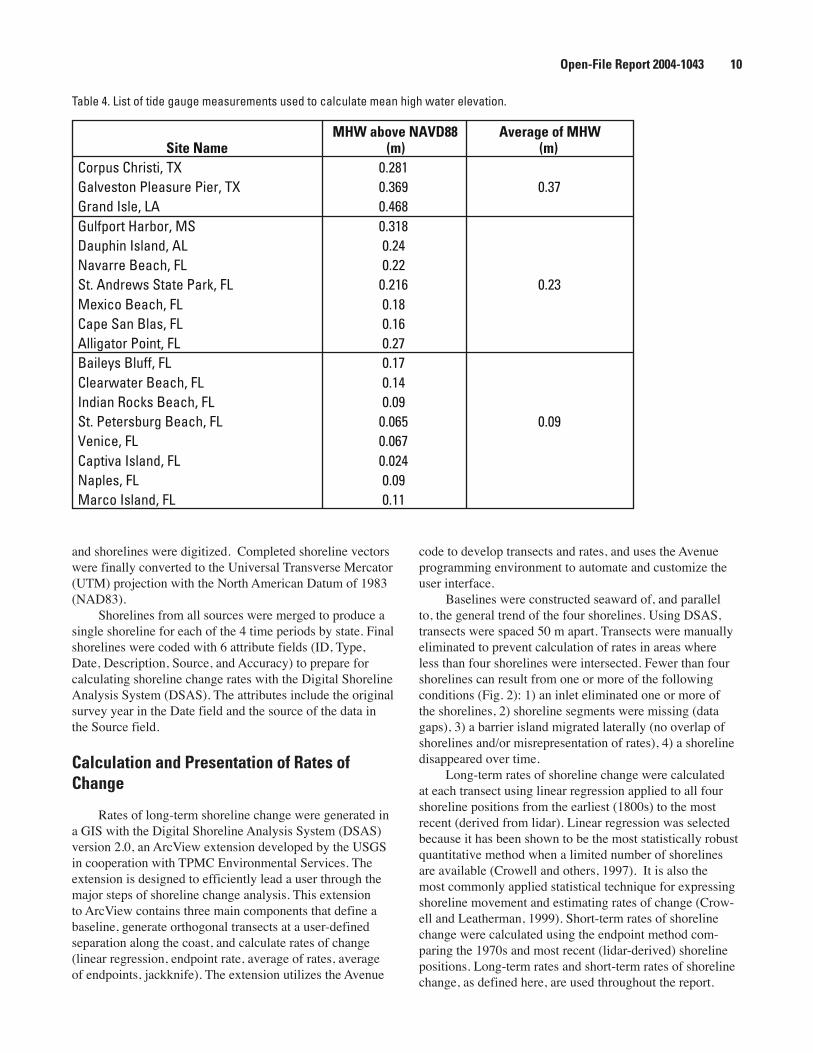
Table 4. List of tide gauge measurements used to calculate mean high water elevation........................................................10
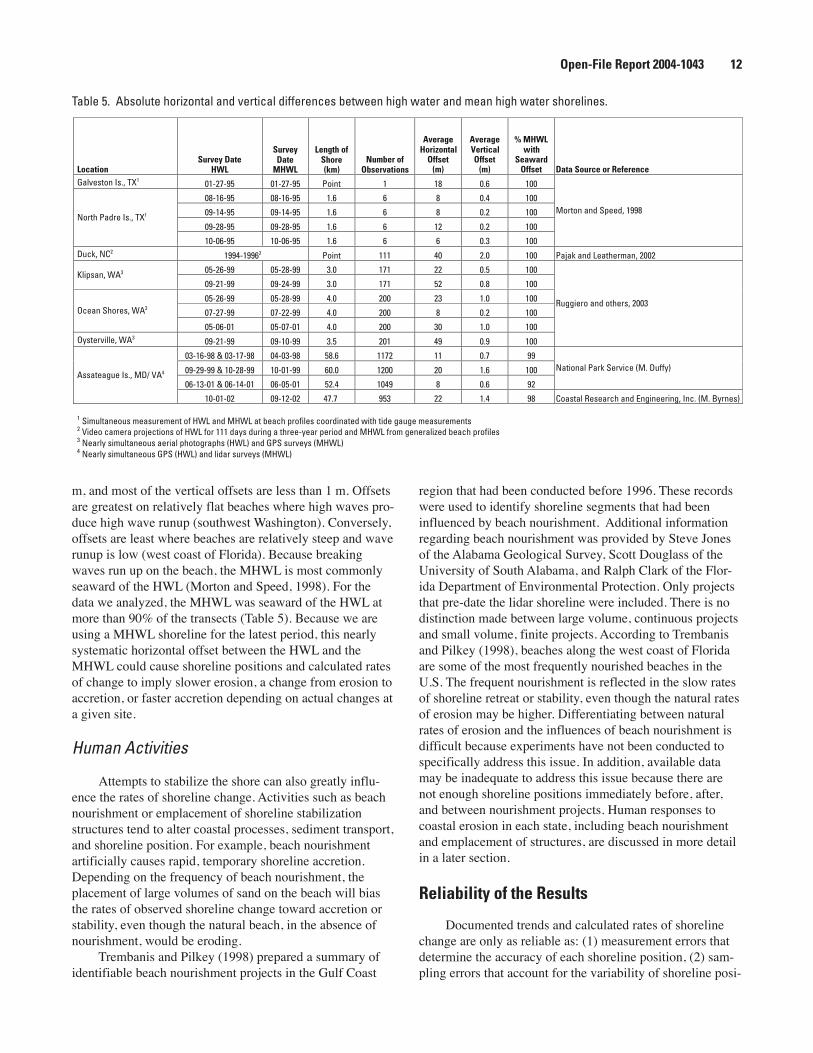
Table 5. Horizontal and vertical differences between high water and mean high water shorelines. ....................................12
Table 6. Maximum estimated measurement errors for Gulf of Mexico shorelines....................................................................13
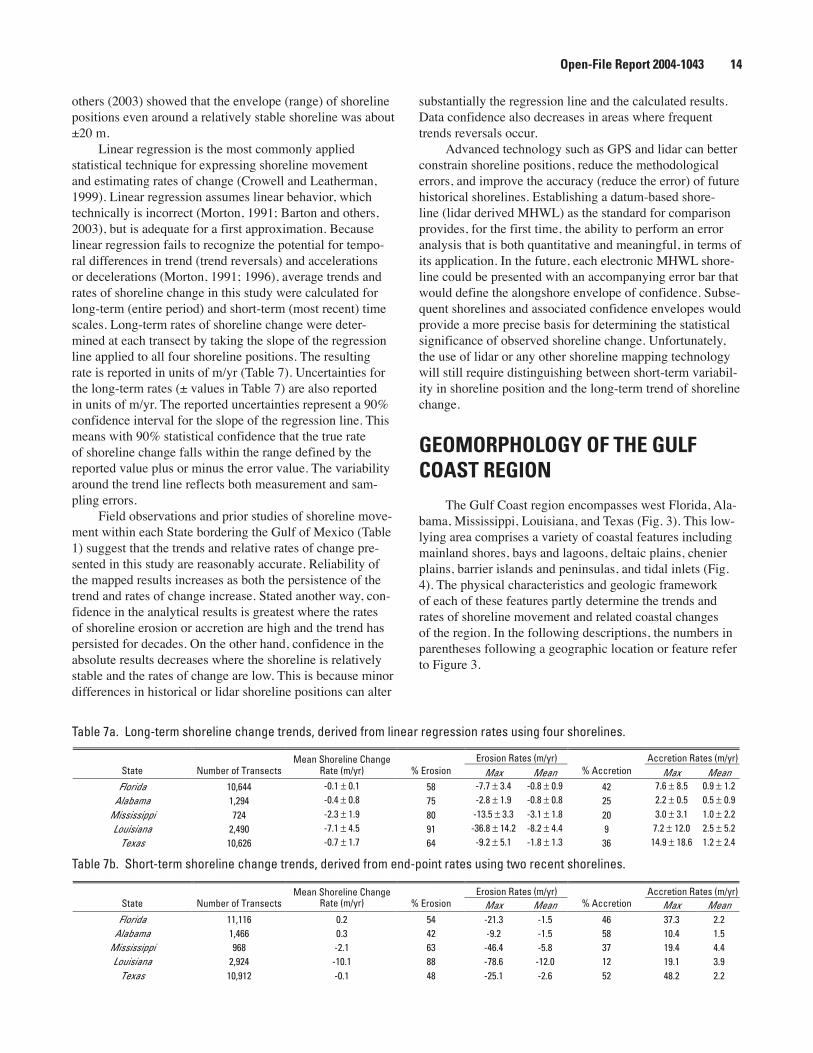
Table 7a. Long-term shoreline change trends, 1800s to post-1998. ................................................................................................14
Table 7b. Short-term shoreline change trends, 1970s to post-1998. ...............................................................................................14
Table 8. Historical hurricane inlet openings and associated surge elevations, west coast of Florida. ................................. 21
Table 9. Technical responses to erosion and land loss in the Gulf Coast region. ......................................................................32
Tables
Open-File Report 2004-1043 4
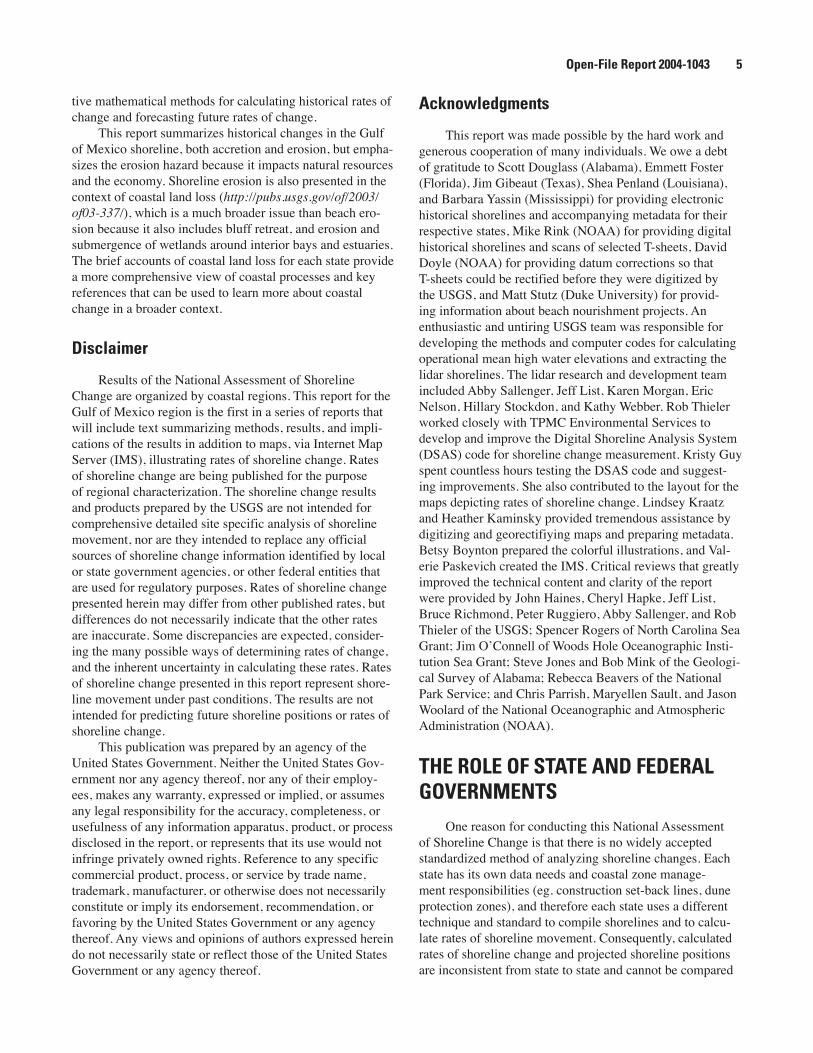
EXECUTIVE SUMMARYBeach erosion is a chronic problem along most open-
ocean shores of the United States. As coastal populations con-tinue to grow and community infrastructures are threatened by erosion, there is increased demand for accurate informa-tion regarding past and present trends and rates of shore-line movement. There is also a need for a comprehensive analysis of shoreline movement that is consistent from one coastal region to another. To meet these national needs, the U.S. Geological Survey is conducting an analysis of histori-cal shoreline changes along open-ocean sandy shores of the conterminous United States and parts of Hawaii and Alaska. One purpose of this work is to develop standard repeatable methods for mapping and analyzing shoreline movement so that periodic updates regarding coastal erosion and land loss can be made nationally that are systematic and internally consistent.
This report on states bordering the Gulf of Mexico (Florida, Alabama, Mississippi, Louisiana, and Texas) rep-resents the first in a series that will eventually include the Atlantic Coast, Pacific Coast, and parts of Hawaii and Alaska. The report summarizes the methods of analysis, interprets the results, provides explanations regarding the historical and present trends and rates of change, and describes how differ-ent coastal communities are responding to coastal erosion. Shoreline change evaluations are based on comparing three historical shorelines with a recent shoreline derived from lidar (Light Detection and Ranging) topographic surveys. The his-torical shorelines generally represent the following periods: 1800s, 1920s-1930s, and 1970s, whereas the lidar shoreline is 1998-2002. Long-term rates of change are calculated using all four shorelines (1800s to lidar shoreline), whereas short-term rates of change are calculated for the most recent period (1970s to lidar shoreline). The historical rates of change presented in this report represent past conditions and there-fore are not intended for predicting future shoreline positions or rates of change.
Rates of erosion for the Gulf of Mexico region are gen-erally highest in Louisiana along barrier island and headland shores associated with the Mississippi delta. Erosion is also rapid along some barrier islands and headlands in Texas, and barrier islands in Mississippi are migrating laterally. Highest rates of erosion in Florida are generally localized around tidal inlets. The most stable Gulf beaches are along the west coast of Florida where low wave energy and frequent beach nour-ishment minimize erosion. Some beach segments in Texas have accreted as a result of net longshore drift convergence, and around tidal inlets that have been stabilized by long jet-ties.
Seawalls and riprap revetments were constructed in all the Gulf Coast states as initial community responses to long-
term beach erosion. Although some states, such as Florida, still permit shoreline stabilization structures, beach nourish-ment has become the preferred method of mitigating long-term erosion.
INTRODUCTION
U.S. Geological Survey National Assessment of Shoreline Change
Sandy ocean beaches of the United States represent some of the most popular tourist and recreational destinations, and they also constitute some of the most valuable real estate in the country. These ephemeral interfaces between water and land are the sites of intense residential and commercial development even though they are frequently subjected to natural hazards including flooding, storm impacts, and coastal erosion. Because population centers continue to shift toward the coast where valuable coastal property is vulnerable to erosion, the U.S. Geological Survey (USGS) is conducting a National Assessment of Coastal Change. One aspect of this effort, the National Assessment of Shoreline Change, uses shoreline position as a proxy for coastal change because shoreline position is one of the most commonly monitored indicators of environmental change (Morton, 1996), and it is easily understood by those who are interested in historical movement of beaches.
A principal purpose of the USGS shoreline change research is to develop a repeatable surveying methodology so that shorelines for the continental U.S., and portions of Hawaii, and Alaska can be periodically and systematically updated in an internally consistent manner. In addition, new methods for developing datum based shorelines and assessing coastal change will provide the opportunity to achieve more comprehensive assessments of error in the future. USGS pri-mary objectives of this project are: (1) to develop and imple-ment improved methods of assessing and monitoring shore-line movement, (2) to obtain a better understanding of the processes controlling shoreline movement, and (3) to enter into strategic partnerships to facilitate data dissemination.
Achieving these ongoing long-term objectives requires research that (1) examines the original sources of shoreline data (maps, air photos, global positioning system (GPS), lidar), (2) evaluates the utility of different shoreline prox-ies (geomorphic feature, water mark, tidal datum, elevation) including the errors associated with each method, (3) investi-gates the bias and potential errors associated with integrating different shoreline proxies from different sources, (4) devel-ops standard uniform methods of shoreline change analysis, (5) determines the effects of human activities on shoreline movement and rates of change, and (6) investigates alterna-
Open-File Report 2004-1043 5 Open-File Report 2004-1043 6
tive mathematical methods for calculating historical rates of change and forecasting future rates of change.
This report summarizes historical changes in the Gulf of Mexico shoreline, both accretion and erosion, but empha-sizes the erosion hazard because it impacts natural resources and the economy. Shoreline erosion is also presented in the context of coastal land loss (http://pubs.usgs.gov/of/2003/of03-337/), which is a much broader issue than beach ero-sion because it also includes bluff retreat, and erosion and submergence of wetlands around interior bays and estuaries. The brief accounts of coastal land loss for each state provide a more comprehensive view of coastal processes and key references that can be used to learn more about coastal change in a broader context.
Disclaimer
Results of the National Assessment of Shoreline Change are organized by coastal regions. This report for the Gulf of Mexico region is the first in a series of reports that will include text summarizing methods, results, and impli-cations of the results in addition to maps, via Internet Map Server (IMS), illustrating rates of shoreline change. Rates of shoreline change are being published for the purpose of regional characterization. The shoreline change results and products prepared by the USGS are not intended for comprehensive detailed site specific analysis of shoreline movement, nor are they intended to replace any official sources of shoreline change information identified by local or state government agencies, or other federal entities that are used for regulatory purposes. Rates of shoreline change presented herein may differ from other published rates, but differences do not necessarily indicate that the other rates are inaccurate. Some discrepancies are expected, consider-ing the many possible ways of determining rates of change, and the inherent uncertainty in calculating these rates. Rates of shoreline change presented in this report represent shore-line movement under past conditions. The results are not intended for predicting future shoreline positions or rates of shoreline change.
This publication was prepared by an agency of the United States Government. Neither the United States Gov-ernment nor any agency thereof, nor any of their employ-ees, makes any warranty, expressed or implied, or assumes any legal responsibility for the accuracy, completeness, or usefulness of any information apparatus, product, or process disclosed in the report, or represents that its use would not infringe privately owned rights. Reference to any specific commercial product, process, or service by trade name, trademark, manufacturer, or otherwise does not necessarily constitute or imply its endorsement, recommendation, or favoring by the United States Government or any agency thereof. Any views and opinions of authors expressed herein do not necessarily state or reflect those of the United States Government or any agency thereof.
Acknowledgments
This report was made possible by the hard work and generous cooperation of many individuals. We owe a debt of gratitude to Scott Douglass (Alabama), Emmett Foster (Florida), Jim Gibeaut (Texas), Shea Penland (Louisiana), and Barbara Yassin (Mississippi) for providing electronic historical shorelines and accompanying metadata for their respective states, Mike Rink (NOAA) for providing digital historical shorelines and scans of selected T-sheets, David Doyle (NOAA) for providing datum corrections so that T-sheets could be rectified before they were digitized by the USGS, and Matt Stutz (Duke University) for provid-ing information about beach nourishment projects. An enthusiastic and untiring USGS team was responsible for developing the methods and computer codes for calculating operational mean high water elevations and extracting the lidar shorelines. The lidar research and development team included Abby Sallenger, Jeff List, Karen Morgan, Eric Nelson, Hillary Stockdon, and Kathy Webber. Rob Thieler worked closely with TPMC Environmental Services to develop and improve the Digital Shoreline Analysis System (DSAS) code for shoreline change measurement. Kristy Guy spent countless hours testing the DSAS code and suggest-ing improvements. She also contributed to the layout for the maps depicting rates of shoreline change. Lindsey Kraatz and Heather Kaminsky provided tremendous assistance by digitizing and georectifiying maps and preparing metadata. Betsy Boynton prepared the colorful illustrations, and Val-erie Paskevich created the IMS. Critical reviews that greatly improved the technical content and clarity of the report were provided by John Haines, Cheryl Hapke, Jeff List, Bruce Richmond, Peter Ruggiero, Abby Sallenger, and Rob Thieler of the USGS; Spencer Rogers of North Carolina Sea Grant; Jim OʼConnell of Woods Hole Oceanographic Insti-tution Sea Grant; Steve Jones and Bob Mink of the Geologi-cal Survey of Alabama; Rebecca Beavers of the National Park Service; and Chris Parrish, Maryellen Sault, and Jason Woolard of the National Oceanographic and Atmospheric Administration (NOAA).
THE ROLE OF STATE AND FEDERAL GOVERNMENTS
One reason for conducting this National Assessment of Shoreline Change is that there is no widely accepted standardized method of analyzing shoreline changes. Each state has its own data needs and coastal zone manage-ment responsibilities (eg. construction set-back lines, dune protection zones), and therefore each state uses a different technique and standard to compile shorelines and to calcu-late rates of shoreline movement. Consequently, calculated rates of shoreline change and projected shoreline positions are inconsistent from state to state and cannot be compared
Open-File Report 2004-1043 5 Open-File Report 2004-1043 6
directly. These inconsistencies were clearly demonstrated by the Federal Emergency Management Agency (FEMA) sponsored erosion studies (Crowell and Leatherman, 1999) that were used as the basis for evaluating erosion hazards (The Heinz Center, 2000). The USGS National Assessment of Shoreline Change represents the first time that shorelines from original data sources have been compiled and rates of shoreline change have been calculated on a national scale using internally consistent methods. The results of this analysis allow direct comparison of rates of change from one coastal segment to another and form the basis for future comparison of shoreline position.
Several federal agencies (USGS, FEMA, NOAA, U.S. Army Corps of Engineers (USACE)) have regulatory or administrative responsibilities pertaining to shorelines. Yet these responsibilities are quite different, requiring differ-ent approaches and offering substantial opportunities for cooperation. For example, the USACE is authorized and funded by Congress to report on the economic and envi-ronmental implications of shoreline change and the costs of erosion mitigation. Their National Shoreline Management Study (Stauble and Brumbaugh, 2003) is being conducted using existing shoreline data. The USGS will share data and information, such as the lidar-derived shoreline and rates of change, in support of their effort. NOAA has the mandate to establish the official shoreline boundary for the nation using tidal datums. Their emphasis is on safe navigation and using the shoreline to generate nautical charts. NOAA also has a developing program (V datum), which will greatly assist other agencies in establishing alternative shorelines for a variety of purposes where the official shoreline is inappropriate. Congress authorized and funded FEMA to report on the economic impact of erosion hazards on coastal communities, and on claims to the National Flood Insurance Fund. To accomplish this, FEMA contracted state agencies and academic researchers to conduct a pilot study of ero-sion hazards that included shoreline change data for limited geographic areas. The USGS is responsible for conducting research pertaining to coastal change hazards including shoreline change, understanding the processes that cause coastal change, and developing models to predict future change. The USGS is the only government agency that has a dedicated program to monitor coastal change into the future using consistent methods nationwide. Such a program is critically important to assess national issues, such as the coastal impacts of sea level rise.
PRIOR NATIONAL AND GULF COAST SHORELINE ASSESSMENTS
The USACE (1971) conducted the first national assess-ment of coastal erosion that included the Gulf of Mexico Region. That study identified areas of critical and non-critical erosion on the basis of economic development and potential for property loss, but rates of shoreline movement
were not evaluated. Dolan and others (1985) conducted a comprehensive analysis of shoreline changes for the U.S. Their analysis was based on compilation of rates of shore-line change provided by other contributors and derived from their own studies of the middle Atlantic region. Rates of change were presented on maps, and the long-term trends of erosion and accretion were summarized in an accompanying text.
A previous quantitative analysis of shoreline movement that focused entirely on the U.S. shores bordering the Gulf of Mexico was conducted for the Environmental Protection Agency (EPA) Gulf of Mexico Program. From that study, a map entitled “Historical Shoreline Change in the Northern Gulf of Mexico” was published in 1991. The map (scale 1:2,000,000) depicted rates of shoreline change that were prepared by a contributor for each state. The EPA map was revised and reissued in 1996 (Coastal Erosion Subcom-mittee, 1996). There have been numerous local studies of shoreline movement in each of the Gulf Coast states. Rather than attempting to summarize all of these studies, Table 1 recognizes most statewide or regional studies and provides appropriate references.
Since the work of Dolan and others (1985), methods of obtaining, analyzing, displaying, and storing shoreline data have improved substantially, and coastal change has contin-ued. Furthermore, coastal scientists have not agreed on stan-dard methods for analyzing and reporting shoreline changes, nor have they identified rigorous mathematical tests that are widely accepted for quantifying the change and associ-ated errors. Consequently, there are critical needs for (1) a nationwide compilation of reliable shoreline data including the most recent shoreline position, and (2) a standardization of methods for obtaining and comparing shoreline positions and mathematically analyzing the trends.
METHODS OF ANALYZING SHORELINE CHANGE
Compilation of Historical Shorelines
Coastal scientists in universities and government agen-cies have been quantifying rates of shoreline movement and studying coastal change for decades. Before GPS and lidar technologies were developed, the most commonly used sources of historical shoreline position were NOAA Topo-graphic Sheets (T-sheets, see Shalowitz, 1964) and aerial photographs. Ideally, extraction of shoreline position from these data sources involves geo-referencing and removing distortions from maps or aerial photographs, followed by digitizing shoreline position. Depending on coastal loca-tion, data source, and scientific preference, different proxies for shoreline position are used to document coastal change, including the high water line (for discussion of the high water line (HWL) see Shalowitz, 1964), wet-dry line, veg-
Open-File Report 2004-1043 7 Open-File Report 2004-1043 8
etation line, dune toe or crest, toe of the beach, cliff base or top, and the line of mean high water (MHWL).
In addition to deriving a modern shoreline from lidar data, the USGS National Assessment of Shoreline Change Project incorporates shoreline positions from pre-existing historical shoreline databases. Numerous organizations and individuals have provided the USGS with digital shoreline data (Table 2). To maintain consistency at a national scale, shorelines from four periods (mid- to late1800s, 1920s-1930s, 1970s, and post-1998) were selected for analysis regardless of the number of shorelines available from exist-ing data sets. Any remaining data gaps were filled using scans of historical T-sheets provided by the NOAA Vector-ization Project.
Shorelines were compiled for each state following the guidelines established for selected periods (mid- to late 1800s, 1920s-1930s, 1970s, and post-1998) as closely as possible. Table 3 lists the final range of years for shorelines compiled for each period by state. A few notable exceptions include a second-period shoreline for Florida covering years up to 1953, a second-period shoreline for Alabama covering years up to 1957, and a third-period shoreline for Missis-sippi covering the years 1986-1987. The Florida shoreline incorporates a small segment in West Florida dated 1957 and a few additional segments from the early 1940s due to a lack of alternatives for those specific areas. In Alabama, a 1917 shoreline for the westernmost 8 km of Dauphin Island was disregarded because the island was severely impacted by a storm in 1917. A 1957 shoreline segment was included as an alternative. The 1980s Mississippi shoreline was selected due to a lack of alternatives closer to the 1970s period.
Delineation of a Modern (lidar-derived) Shoreline
The most recent shoreline used in this National Assess-ment (post-1998) was derived from lidar (light detection and ranging) data. The USGS, in collaboration with NASA, has been using the NASA Airborne Topographic Mapper (ATM) to map coastal areas since 1997 (Krabill and others, 2000; Sallenger and others, 2003). The ATM surveys ground elevation using an elliptically rotating blue-green laser. GPS (global positioning system) positions and inertial naviga-tion systems are used to correct for aircraft pitch, roll, and heading, providing ground elevations with accuracies of about ±15 cm (Sallenger and others, 2003). Most of the lidar surveys used to extract shorelines for this report were con-ducted in 2001 (Table 3). This includes the NASA surveys as well as additional lidar data for the Texas coast, which was provided by The University of Texas at Austin Bureau of Economic Geology (Table 2).
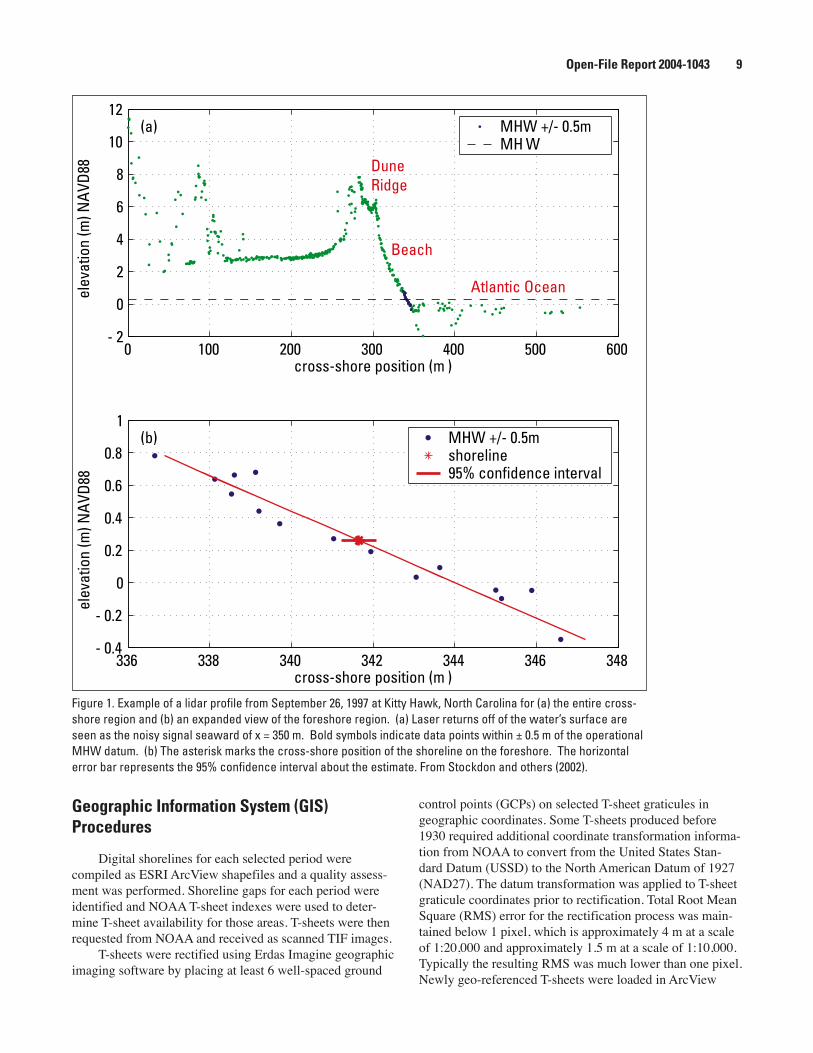
To compare with historical shorelines, an operational MHW shoreline was extracted from the lidar surveys using a method developed by Stockdon and others (2002)(Fig. 1). Shorelines were extracted from cross-shore profiles which consist of bands of lidar data 2-4 m wide in the alongshore direction and spaced every 20 m along the coast. A least-squares linear regression line is passed through the cluster of data that encompasses the operational MHW datum (Table 4) and is limited to the seaward-sloping beach foreshore. The regression equation is then used to derive the horizontal intersection of the operational MHW datum with the profile, giving the shoreline position for that profile. Repeating this procedure at successive profiles 20 m apart generates a continuous shoreline.
To determine the operational MHW elevation, the Gulf of Mexico region was divided into 3 subregions. For each subregion, the operational MHW elevation represents an average of MHW elevations from individual open-ocean or
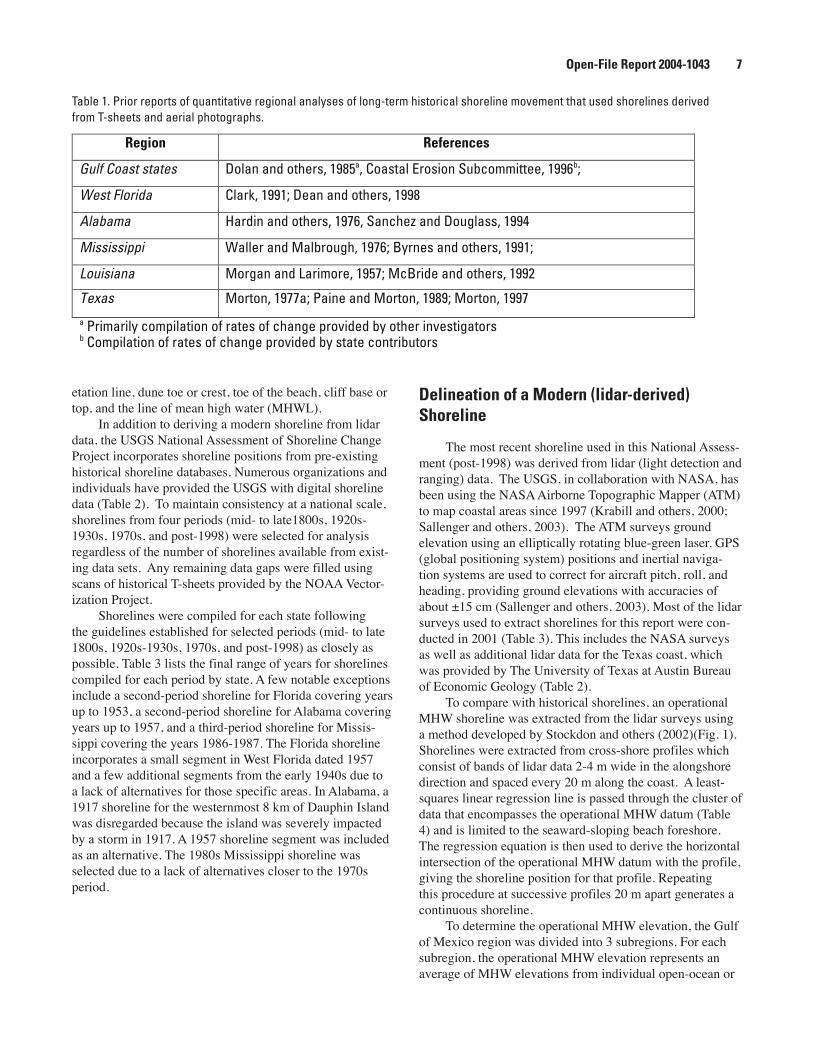
a Primarily compilation of rates of change provided by other investigatorsb Compilation of rates of change provided by state contributors
Region References
Gulf Coast states Dolan and others, 1985a, Coastal Erosion Subcommittee, 1996b;
West Florida Clark, 1991; Dean and others, 1998
Alabama Hardin and others, 1976, Sanchez and Douglass, 1994
Mississippi Waller and Malbrough, 1976; Byrnes and others, 1991;
Louisiana Morgan and Larimore, 1957; McBride and others, 1992
Texas Morton, 1977a; Paine and Morton, 1989; Morton, 1997
Table 1. Prior reports of quantitative regional analyses of long-term historical shoreline movement that used shorelines derived from T-sheets and aerial photographs.
Open-File Report 2004-1043 7 Open-File Report 2004-1043 8
near open-ocean tide gauges. A list of tide gauges and MHW elevations used in each subregion is presented in Table 4. The lidar-extracted MHW shoreline is not the same as a MHW shoreline surveyed by a licensed land surveyor. This is because the operational MHW elevation used for the lidar shoreline is an average of the MHW elevations at several tide gauges. Furthermore, the lidar-extracted shoreline is intended only as a reference feature for measuring shoreline change. It is not intended to establish legal boundaries.
Because wetlands generally are not suitable sites for extraction of a lidar shoreline, extensive wetland areas such as the mangrove swamps of south Florida, Big Bend marsh of Florida, and much of the Mississippi delta were not included in the shoreline change analysis. Also, lidar surveys were not available for sandy beaches in west Florida from Cape Romano to Sanibel Island, and along the chenier plain in southwestern Louisiana. When lidar data are avail-able for these gaps, the shoreline change analyses will be conducted and provided in future reports and as on-line updates.
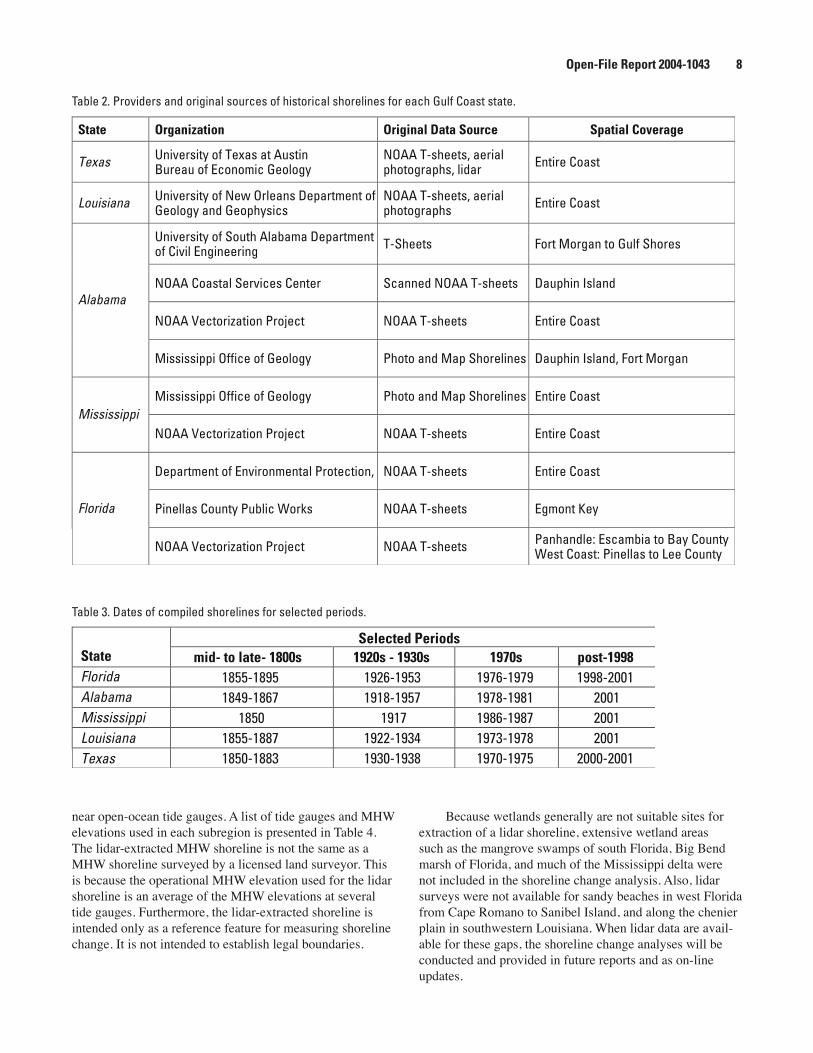
Texas University of Texas at AustinBureau of Economic Geology
NOAA T-sheets, aerialphotographs, lidar Entire Coast
Louisiana University of New Orleans Department ofGeology and Geophysics
NOAA T-sheets, aerialphotographs Entire Coast
University of South Alabama Departmentof Civil Engineering T-Sheets Fort Morgan to Gulf Shores
NOAA Coastal Services Center Scanned NOAA T-sheets Dauphin Island
NOAA Vectorization Project NOAA T-sheets Entire Coast
Alabama
Mississippi Office of Geology Photo and Map Shorelines Dauphin Island, Fort Morgan
Mississippi Office of Geology Photo and Map Shorelines Entire CoastMississippi
NOAA Vectorization Project NOAA T-sheets Entire Coast
Department of Environmental Protection, NOAA T-sheets Entire Coast
Pinellas County Public Works NOAA T-sheets Egmont KeyFlorida
NOAA Vectorization Project NOAA T-sheets Panhandle: Escambia to Bay CountyWest Coast: Pinellas to Lee County
State Organization Original Data Source Spatial Coverage
Table 2. Providers and original sources of historical shorelines for each Gulf Coast state.
Selected PeriodsState mid- to late- 1800s 1920s - 1930s 1970s post-1998Florida 1855-1895 1926-1953 1976-1979 1998-2001Alabama 1849-1867 1918-1957 1978-1981 2001Mississippi 1850 1917 1986-1987 2001Louisiana 1855-1887 1922-1934 1973-1978 2001Texas 1850-1883 1930-1938 1970-1975 2000-2001
Table 3. Dates of compiled shorelines for selected periods.
Open-File Report 2004-1043 9 Open-File Report 2004-1043 10
Geographic Information System (GIS) Procedures
Digital shorelines for each selected period were compiled as ESRI ArcView shapefiles and a quality assess-ment was performed. Shoreline gaps for each period were identified and NOAA T-sheet indexes were used to deter-mine T-sheet availability for those areas. T-sheets were then requested from NOAA and received as scanned TIF images.
T-sheets were rectified using Erdas Imagine geographic imaging software by placing at least 6 well-spaced ground
control points (GCPs) on selected T-sheet graticules in geographic coordinates. Some T-sheets produced before 1930 required additional coordinate transformation informa-tion from NOAA to convert from the United States Stan-dard Datum (USSD) to the North American Datum of 1927 (NAD27). The datum transformation was applied to T-sheet graticule coordinates prior to rectification. Total Root Mean Square (RMS) error for the rectification process was main-tained below 1 pixel, which is approximately 4 m at a scale of 1:20,000 and approximately 1.5 m at a scale of 1:10,000. Typically the resulting RMS was much lower than one pixel. Newly geo-referenced T-sheets were loaded in ArcView
� ��� ��� ��� ��� ��� ���� �
�
�
�
�
�
��
��
����������� �������� �� �
�������������
����
�
��� ��� ��� �������
��� ��� ��� ��� ��� ��� ���� ���
� ���
�
���
���
���
���
�
����������� �������� �� �
�������������
����
�
��� ��� ��� ���������������� ���������� ��������
���������
�����
�������� �����
Figure 1. Example of a lidar profile from September 26, 1997 at Kitty Hawk, North Carolina for (a) the entire cross-shore region and (b) an expanded view of the foreshore region. (a) Laser returns off of the water’s surface are seen as the noisy signal seaward of x = 350 m. Bold symbols indicate data points within ± 0.5 m of the operational MHW datum. (b) The asterisk marks the cross-shore position of the shoreline on the foreshore. The horizontal error bar represents the 95% confidence interval about the estimate. From Stockdon and others (2002).
Open-File Report 2004-1043 9 Open-File Report 2004-1043 10
and shorelines were digitized. Completed shoreline vectors were finally converted to the Universal Transverse Mercator (UTM) projection with the North American Datum of 1983 (NAD83).
Shorelines from all sources were merged to produce a single shoreline for each of the 4 time periods by state. Final shorelines were coded with 6 attribute fields (ID, Type, Date, Description, Source, and Accuracy) to prepare for calculating shoreline change rates with the Digital Shoreline Analysis System (DSAS). The attributes include the original survey year in the Date field and the source of the data in the Source field.
Calculation and Presentation of Rates of Change
Rates of long-term shoreline change were generated in a GIS with the Digital Shoreline Analysis System (DSAS) version 2.0, an ArcView extension developed by the USGS in cooperation with TPMC Environmental Services. The extension is designed to efficiently lead a user through the major steps of shoreline change analysis. This extension to ArcView contains three main components that define a baseline, generate orthogonal transects at a user-defined separation along the coast, and calculate rates of change (linear regression, endpoint rate, average of rates, average of endpoints, jackknife). The extension utilizes the Avenue
code to develop transects and rates, and uses the Avenue programming environment to automate and customize the user interface.
Baselines were constructed seaward of, and parallel to, the general trend of the four shorelines. Using DSAS, transects were spaced 50 m apart. Transects were manually eliminated to prevent calculation of rates in areas where less than four shorelines were intersected. Fewer than four shorelines can result from one or more of the following conditions (Fig. 2): 1) an inlet eliminated one or more of the shorelines, 2) shoreline segments were missing (data gaps), 3) a barrier island migrated laterally (no overlap of shorelines and/or misrepresentation of rates), 4) a shoreline disappeared over time.
Long-term rates of shoreline change were calculated at each transect using linear regression applied to all four shoreline positions from the earliest (1800s) to the most recent (derived from lidar). Linear regression was selected because it has been shown to be the most statistically robust quantitative method when a limited number of shorelines are available (Crowell and others, 1997). It is also the most commonly applied statistical technique for expressing shoreline movement and estimating rates of change (Crow-ell and Leatherman, 1999). Short-term rates of shoreline change were calculated using the endpoint method com-paring the 1970s and most recent (lidar-derived) shoreline positions. Long-term rates and short-term rates of shoreline change, as defined here, are used throughout the report.
Site NameMHW above NAVD88
(m) (m)Average of MHW
Corpus Christi, TX 0.281Galveston Pleasure Pier, TX 0.369 0.37Grand Isle, LA 0.468Gulfport Harbor, MS 0.318Dauphin Island, AL 0.24Navarre Beach, FL 0.22St. Andrews State Park, FL 0.216 0.23Mexico Beach, FL 0.18Cape San Blas, FL 0.16Alligator Point, FL 0.27Baileys Bluff, FL 0.17Clearwater Beach, FL 0.14Indian Rocks Beach, FL 0.09St. Petersburg Beach, FL 0.065 0.09Venice, FL 0.067Captiva Island, FL 0.024Naples, FL 0.09Marco Island, FL 0.11
Table 4. List of tide gauge measurements used to calculate mean high water elevation.
Open-File Report 2004-1043 11 Open-File Report 2004-1043 12
Both long-term and short-term rates of shoreline change calculated for each transect (50 m alongshore spacing) were color coded according to class interval with green colors indicating accretion and red colors indicating erosion. The shoreline change rates and individual shoreline data layers were compiled into an ArcIMS, or Arc Internet Map Server, viewable at http://coastalmap.marine.usgs.gov/.
Shoreline Definitions and Beach Alterations that Influence Rates of Change
Shoreline Definitions
Inclusion of a lidar-derived shoreline represents a new approach to the investigation of shoreline change. The three pre-lidar historical shorelines come from topographic maps and aerial photographs that use the HWL as the shoreline proxy. For more than 150 years the HWL has served as the authoritative shoreline because it could be visually identi-fied in the field. With advanced technologies, such as GPS and lidar, it is possible to define the shoreline on the basis of an elevation or a tidal datum, such as MHW. Changing the
shoreline definition from a physical feature that is uncon-trolled in terms of an elevation datum to a shoreline defined by an elevation has important implications with regard to inferred changes in shoreline position and calculated rates of change.
Published and unpublished data were compiled to evaluate the horizontal and vertical differences in HWL determined from beach profiles, aerial photographs, or GPS surveys, and the MHWL derived from beach profiles, GPS surveys, or lidar surveys (Table 5). The HWL and MHWL positions were established at the same time, or within a few weeks of one another at multiple sites around the U.S. where the beach and wave characteristics are diverse. Comparing these HWL and MHWL positions assumes that the observed offsets are entirely artifacts of shoreline definition and are not related to actual changes in the beach profile between the survey dates. This is a relatively safe assumption consid-ering the short intervals between surveys or the knowledge that a particular shoreline segment is relatively stable.
Table 5 shows that average absolute horizontal and vertical offsets between the HWL and MHWL range from a few meters to more than 50 m, and vertical offsets can be as much as 2 m. Most of the horizontal offsets are less than 20
landward
seaward
landward
seaward
A Inlet Openings B Missing Data
C Barrier Migration D Shoreline Loss
offshore baseline offshore baseline
offshore baseline offshore baseline
Shorelines Transects
eliminated
used for calculation1800s
2000s
1970s
1930s
transect/shorelineintersection
Figure 2. Examples of common conditions where transects are eliminated in the absence of four shoreline intersections.
Open-File Report 2004-1043 11 Open-File Report 2004-1043 12
m, and most of the vertical offsets are less than 1 m. Offsets are greatest on relatively flat beaches where high waves pro-duce high wave runup (southwest Washington). Conversely, offsets are least where beaches are relatively steep and wave runup is low (west coast of Florida). Because breaking waves run up on the beach, the MHWL is most commonly seaward of the HWL (Morton and Speed, 1998). For the data we analyzed, the MHWL was seaward of the HWL at more than 90% of the transects (Table 5). Because we are using a MHWL shoreline for the latest period, this nearly systematic horizontal offset between the HWL and the MHWL could cause shoreline positions and calculated rates of change to imply slower erosion, a change from erosion to accretion, or faster accretion depending on actual changes at a given site.
Human Activities
Attempts to stabilize the shore can also greatly influ-ence the rates of shoreline change. Activities such as beach nourishment or emplacement of shoreline stabilization structures tend to alter coastal processes, sediment transport, and shoreline position. For example, beach nourishment artificially causes rapid, temporary shoreline accretion. Depending on the frequency of beach nourishment, the placement of large volumes of sand on the beach will bias the rates of observed shoreline change toward accretion or stability, even though the natural beach, in the absence of nourishment, would be eroding.
Trembanis and Pilkey (1998) prepared a summary of identifiable beach nourishment projects in the Gulf Coast
region that had been conducted before 1996. These records were used to identify shoreline segments that had been influenced by beach nourishment. Additional information regarding beach nourishment was provided by Steve Jones of the Alabama Geological Survey, Scott Douglass of the University of South Alabama, and Ralph Clark of the Flor-ida Department of Environmental Protection. Only projects that pre-date the lidar shoreline were included. There is no distinction made between large volume, continuous projects and small volume, finite projects. According to Trembanis and Pilkey (1998), beaches along the west coast of Florida are some of the most frequently nourished beaches in the U.S. The frequent nourishment is reflected in the slow rates of shoreline retreat or stability, even though the natural rates of erosion may be higher. Differentiating between natural rates of erosion and the influences of beach nourishment is difficult because experiments have not been conducted to specifically address this issue. In addition, available data may be inadequate to address this issue because there are not enough shoreline positions immediately before, after, and between nourishment projects. Human responses to coastal erosion in each state, including beach nourishment and emplacement of structures, are discussed in more detail in a later section.
Reliability of the Results
Documented trends and calculated rates of shoreline change are only as reliable as: (1) measurement errors that determine the accuracy of each shoreline position, (2) sam-pling errors that account for the variability of shoreline posi-
LocationSurvey Date
HWL
SurveyDate
MHWL
Length ofShore(km)
Number ofObservations
AverageHorizontal
Offset(m)
AverageVerticalOffset
(m)
% MHWLwith
SeawardOffset Data Source or Reference
1 Simultaneous measurement of HWL and MHWL at beach profiles coordinated with tide gauge measurements2 Video camera projections of HWL for 111 days during a three-year period and MHWL from generalized beach profiles3 Nearly simultaneous aerial photographs (HWL) and GPS surveys (MHWL)4 Nearly simultaneous GPS (HWL) and lidar surveys (MHWL)
Galveston Is., TX1 01-27-95 01-27-95 Point 1 18 0.6 100
08-16-95 08-16-95 1.6 6 8 0.4 100
09-14-95 09-14-95 1.6 6 8 0.2 100
09-28-95 09-28-95 1.6 6 12 0.2 100North Padre Is., TX1
10-06-95 10-06-95 1.6 6 6 0.3 100
Morton and Speed, 1998
Duck, NC2 1994-19962 Point 111 40 2.0 100 Pajak and Leatherman, 2002
05-26-99 05-28-99 3.0 171 22 0.5 100Klipsan, WA3
09-21-99 09-24-99 3.0 171 52 0.8 100
05-26-99 05-28-99 4.0 200 23 1.0 100
07-27-99 07-22-99 4.0 200 8 0.2 100Ocean Shores, WA3
05-06-01 05-07-01 4.0 200 30 1.0 100Oysterville, WA3 09-21-99 09-10-99 3.5 201 49 0.9 100
Ruggiero and others, 2003
03-16-98 & 03-17-98 04-03-98 58.6 1172 11 0.7 99
09-29-99 & 10-28-99 10-01-99 60.0 1200 20 1.6 100
06-13-01 & 06-14-01 06-05-01 52.4 1049 8 0.6 92
National Park Service (M. Duffy)Assateague Is., MD/ VA4
10-01-02 09-12-02 47.7 953 22 1.4 98 Coastal Research and Engineering, Inc. (M. Byrnes)
Table 5. Absolute horizontal and vertical differences between high water and mean high water shorelines.

Open-File Report 2004-1043 13 Open-File Report 2004-1043 14 Open-File Report 2004-1043 15
tion, and (3) statistical errors associated with compiling and comparing shoreline positions. Anders and Byrnes (1991), Crowell and others (1991), Thieler and Danforth (1994), and Moore (2000), provided general estimates of the typi-cal measurement errors associated with mapping methods and materials for historical shorelines, registry of shoreline position relative to geographic coordinates, and shoreline digitizing. The largest errors were positioning errors of ±10 m, which were attributed to scales and inaccuracies in the original surveys (T-sheets and aerial photographs). However, the influence of large shoreline position errors on long-term rates of change can be reduced because the period of analysis is so long (>100 yrs). Stockdon and others (2002) provided estimates of GPS positioning errors (±1 m) and regression errors (±1.5 m) associated with shorelines derived from lidar data.
Estimates of the maximum measurement errors for this study are provided in Table 6 to show how each error contributes to uncertainty in the shoreline position and in the rates of change. A total shoreline position error (Esp)(equation 1) incorporates all of the measurement errors by taking the square root of the sum of the squares of: recti-fication error (Er), digitizing error (Ed), T-sheet survey error (Et), shoreline proxy offset (Eo), and lidar position error (El). Rectification error represents the elected maximum accept-able RMS error for T-sheets at a scale of 1:20,000 in this study. We assume data from outside sources conforms to similar standards. The rectification error is applied to the historical shorelines only. Digitizing error reflects the maxi-mum digitizing error specified in past studies (Anders and Byrnes, 1991; Crowell and others, 1991; Moore, 2000). The digitizing error is applied to the historical shorelines only. The maximum T-sheet survey error, determined by Sha-lowitz (1964), incorporates all of the errors associated with the mapping process including distance to rodded points, plane table position, and identification of the HWL. The T-sheet survey error is applied only to historical shorelines from time periods 1 and 2 (1800s shoreline and 1920-1930s shoreline, respectively), as it is assumed that more recent
shorelines are derived from aerial photos or other sources. The shoreline proxy offset reflects the maximum horizontal offset between high water and mean high water shorelines in the Gulf of Mexico (see Table 5). The offset error pertains only to the lidar-derived shoreline. Lidar position error reflects the maximum error associated with the derivation of a lidar shoreline (Stockdon and others, 2002). The lidar position error is applied only to the lidar-derived shoreline. Thus, total shoreline position error is expressed by equation 1:
A separate Esp can be calculated for each period. Finally, the position errors for each period can be incor-porated into an error for each transect. That value can be annualized to provide an error estimation for the shoreline change rate at any given transect. The annualized error (Ea) is expressed by equation 2:
The maximum annualized error using best estimates for Gulf of Mexico shorelines is 0.2 m/yr (Table 6).
Sampling errors relating to the local short-term vari-ability of true shoreline positions (Morton, 1991; Douglas and Crowell, 2000) are less well known. Temporally dense data are required to evaluate short-term shoreline variability resulting from seasonal cycles and from rapid storm erosion and subsequent recovery. Moreover, most data sets include some apparent shoreline movement caused by changes in water level (HWL) and not changes in sediment volume (Morton, 1991). Lack of reliable high frequency data regard-ing short-term variability of true shoreline position at most coastal sites limits the ability to quantify and incorporate the associated uncertainty into the overall shoreline position uncertainty. An exception is the 20-year record of beach profiles surveyed by the COE at Duck, N.C. Using 460 shoreline positions from the Duck profile data, Barton and
*Time periods: 1=1800s; 2=1920s-1930s; 3=1970s; 4=post-1995
Time Period*Measurement Errors (m)
1 2 3 4Rectification error (Er) 4 4 4 0
Digitizing error (Ed) 1 1 1 0T-sheet survey error (Et) 10 10 0 0
Shoreline proxy offset (Eo) 0 0 0 18Lidar position error (El) 0 0 0 1.5
Total shoreline position error (Esp) (m) 10.8 10.8 4.1 18.1Annualized transect error (Ea) (m/yr) 0.2
Table 6. Maximum estimated measurement errors for Gulf of Mexico shorelines.
Open-File Report 2004-1043 13 Open-File Report 2004-1043 14 Open-File Report 2004-1043 15
others (2003) showed that the envelope (range) of shoreline positions even around a relatively stable shoreline was about ±20 m.
Linear regression is the most commonly applied statistical technique for expressing shoreline movement and estimating rates of change (Crowell and Leatherman, 1999). Linear regression assumes linear behavior, which technically is incorrect (Morton, 1991; Barton and others, 2003), but is adequate for a first approximation. Because linear regression fails to recognize the potential for tempo-ral differences in trend (trend reversals) and accelerations or decelerations (Morton, 1991; 1996), average trends and rates of shoreline change in this study were calculated for long-term (entire period) and short-term (most recent) time scales. Long-term rates of shoreline change were deter-mined at each transect by taking the slope of the regression line applied to all four shoreline positions. The resulting rate is reported in units of m/yr (Table 7). Uncertainties for the long-term rates (± values in Table 7) are also reported in units of m/yr. The reported uncertainties represent a 90% confidence interval for the slope of the regression line. This means with 90% statistical confidence that the true rate of shoreline change falls within the range defined by the reported value plus or minus the error value. The variability around the trend line reflects both measurement and sam-pling errors.
Field observations and prior studies of shoreline move-ment within each State bordering the Gulf of Mexico (Table 1) suggest that the trends and relative rates of change pre-sented in this study are reasonably accurate. Reliability of the mapped results increases as both the persistence of the trend and rates of change increase. Stated another way, con-fidence in the analytical results is greatest where the rates of shoreline erosion or accretion are high and the trend has persisted for decades. On the other hand, confidence in the absolute results decreases where the shoreline is relatively stable and the rates of change are low. This is because minor differences in historical or lidar shoreline positions can alter
substantially the regression line and the calculated results. Data confidence also decreases in areas where frequent trends reversals occur.
Advanced technology such as GPS and lidar can better constrain shoreline positions, reduce the methodological errors, and improve the accuracy (reduce the error) of future historical shorelines. Establishing a datum-based shore-line (lidar derived MHWL) as the standard for comparison provides, for the first time, the ability to perform an error analysis that is both quantitative and meaningful, in terms of its application. In the future, each electronic MHWL shore-line could be presented with an accompanying error bar that would define the alongshore envelope of confidence. Subse-quent shorelines and associated confidence envelopes would provide a more precise basis for determining the statistical significance of observed shoreline change. Unfortunately, the use of lidar or any other shoreline mapping technology will still require distinguishing between short-term variabil-ity in shoreline position and the long-term trend of shoreline change.
GEOMORPHOLOGY OF THE GULF COAST REGION
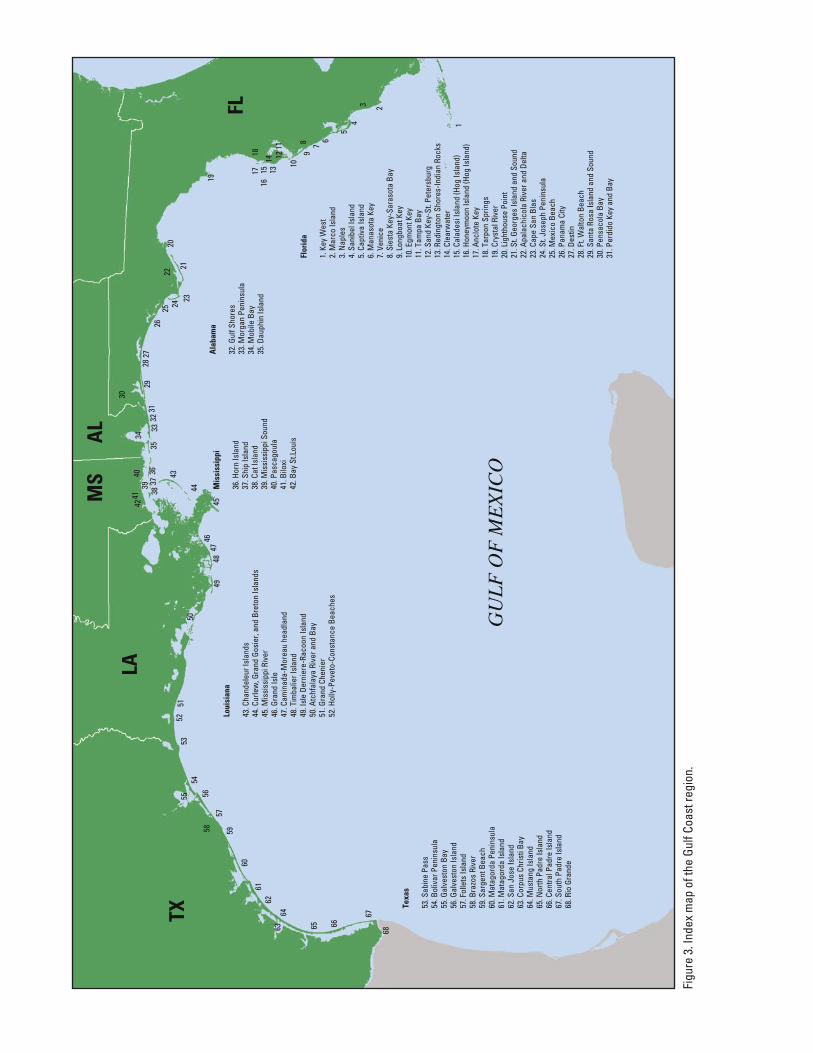
The Gulf Coast region encompasses west Florida, Ala-bama, Mississippi, Louisiana, and Texas (Fig. 3). This low-lying area comprises a variety of coastal features including mainland shores, bays and lagoons, deltaic plains, chenier plains, barrier islands and peninsulas, and tidal inlets (Fig. 4). The physical characteristics and geologic framework of each of these features partly determine the trends and rates of shoreline movement and related coastal changes of the region. In the following descriptions, the numbers in parentheses following a geographic location or feature refer to Figure 3.
Table 7a. Long-term shoreline change trends, derived from linear regression rates using 4 shorelines.Erosion Rates (m/yr) Accretion Rates (m/yr)
State Number of TransectsMean Shoreline Change
Rate (m/yr) % Erosion Max Mean % Accretion Max MeanFlorida 10,644 -0.1 ± 0.1 58 -7.7 ± 3.4 -0.8 ± 0.9 42 7.6 ± 8.5 0.9 ± 1.2
Alabama 1,294 -0.4 ± 0.8 75 -2.8 ± 1.9 -0.8 ± 0.8 25 2.2 ± 0.5 0.5 ± 0.9Mississippi 724 -2.3 ± 1.9 80 -13.5 ± 3.3 -3.1 ± 1.8 20 3.0 ± 3.1 1.0 ± 2.2Louisiana 2,490 -7.1 ± 4.5 91 -36.8 ± 14.2 -8.2 ± 4.4 9 7.2 ± 12.0 2.5 ± 5.2
Texas 10,626 -0.7 ± 1.7 64 -9.2 ± 5.1 -1.8 ± 1.3 36 14.9 ± 18.6 1.2 ± 2.4
Table 7b. Short-term shoreline change trends, derived from end-point rates using 2 recent shorelines.Erosion Rates (m/yr) Accretion Rates (m/yr)
State Number of TransectsMean Shoreline Change
Rate (m/yr) % Erosion Max Mean % Accretion Max MeanFlorida 11,116 0.2 54 -21.3 -1.5 46 37.3 2.2
Alabama 1,466 0.3 42 -9.2 -1.5 58 10.4 1.5Mississippi 968 -2.1 63 -46.4 -5.8 37 19.4 4.4Louisiana 2,924 -10.1 88 -78.6 -12.0 12 19.1 3.9
Texas 10,912 -0.1 48 -25.1 -2.6 52 48.2 2.2
Table 7a. Long-term shoreline change trends, derived from linear regression rates using four shorelines.
Table 7b. Short-term shoreline change trends, derived from end-point rates using two recent shorelines.
Open-File Report 2004-1043 13 Open-File Report 2004-1043 14 Open-File Report 2004-1043 15
Figu
re 3
. Ind
ex m
ap o
f the
Gul
f Coa
st re
gion
.
68
67
6665
64
6261
60
595857
5654
55
63
5352
5150
4847
4645
44
43
4241
40
373936
3533
3231
2827
2625
2324
21
20
19
1817 15 13
16
121411
9
108 76
54
23
1
30
2934
3822
49
GU
LF
OF
ME
XIC
O
TX
LA
MS
AL
FL
Texa
s
53. S
abin
e Pa
ss54
. Bol
ivar
Pen
insu
la55
. Gal
vest
on B
ay56
. Gal
vest
on Is
land
57. F
olle
ts Is
land
58. B
razo
s Ri
ver
59. S
arge
nt B
each
60. M
atag
orda
Pen
insu
la61
. Mat
agor
da Is
land
62. S
an J
ose
Isla
nd63
. Cor
pus
Chris
ti Ba
y64
. Mus
tang
Isla
n d65
. Nor
th P
adre
Isla
nd66
. Cen
tral P
adre
Isla
nd67
. Sou
th P
adre
Isla
nd68
. Rio
Gra
nde
Loui
sian
a
43. C
hand
eleu
r Isl
ands
44. C
urle
w, G
rand
Gos
ier,
and
Bret
on Is
land
s45
. Mis
siss
ippi
Riv
er46
. Gra
nd Is
le47
. Cam
inad
a-M
orea
u he
adla
nd48
. Tim
balie
r Isl
and
49. I
sle
Dern
iere
-Rac
oon
Isla
nd50
. Atc
hfal
aya
Rive
r and
Bay
51. G
rand
Che
nier
52. H
olly
-Pev
eto-
Cons
tanc
e Be
ache
s
Mis
siss
ippi
36. H
orn
Isla
nd37
. Shi
p Is
land
38. C
at Is
land
39. M
issi
ssip
pi S
ound
40. P
asca
goul
a41
. Bilo
xi42
. Bay
St.L
ouis
Ala
bam
a
32. G
ulf S
hore
s33
. Mor
gan
Peni
nsul
a34
. Mob
ile B
ay35
. Dau
phin
Isla
nd
Flor
ida
1. K
ey W
est
2. M
arco
Isla
nd3.
Nap
les
4. S
anib
el Is
land
5. C
aptiv
a Is
land
6. M
anas
ota
Key
7. V
enic
e8.
Sie
sta
Key-
Sara
sota
Ba y
9. L
ongb
oat K
ey10
. Egm
ont K
ey11
. Tam
pa B
ay12
. San
d Ke
y-St
. Pet
ersb
urg
13. R
edin
gton
Sho
res-
Indi
an R
ocks
14. C
lear
wat
er15
. Cal
ades
i Isl
and
(Hog
Isla
nd)
16. H
oney
moo
n Is
land
(Hog
Isla
nd)
17. A
nclo
te K
ey18
. Tar
pon
Sprin
gs19
. Cry
stal
Riv
er20
. Lig
htho
use
Poin
t21
. St.
Geor
ges
Isla
nd a
nd S
ound
22. A
pala
chic
ola
Rive
r and
Del
ta23
. Cap
e Sa
n Bl
as24
. St.
Jose
ph P
enin
sula
25. M
exic
o Be
ach
26. P
anam
a Ci
ty27
. Des
tin28
. Ft.
Wal
ton
Beac
h29
. San
ta R
osa
Isla
nd a
nd S
ound
30. P
ensa
cola
Bay
31. P
erdi
do K
ey a
nd B
ay

Open-File Report 2004-1043 16 Open-File Report 2004-1043 17
Gulf of Mexico Mainland Shores
The U.S. coast bordering the Gulf of Mexico con-sists mainly of barrier islands, but there are some seg-ments where the mainland shore meets the Gulf without an intervening bay or lagoon. For example, in Florida sandy mainland shores are exposed to Gulf waves near Mexico Beach (25), Venice (7), and Naples (3); a sandy bluff shore extends from Panama City (26) to Ft. Walton Beach (28); and a marsh shore is found from Tarpon Springs (18) to Apalachicola (22). The only mainland shore in Alabama is a sandy stretch of beach near Gulf Shores (32). In Mis-sissippi, sandy and marsh mainland shores extend from Pascagoula (40) westward to the Louisiana state line. There are mainland shores along the Caminada-Moreau headland (47) and chenier plain (51) of southwestern Louisiana. In Texas, Gulf mainland shores are located between Sabine Pass (53) and Bolivar Peninsula (54), between Follets Island (57) and Matagorda Peninsula (60), and near the mouth of the Rio Grande (68). The mainland Gulf shores in Louisiana and Texas generally are locally underlain with mud and the beaches are narrow.
Bays and Lagoons
Most large coastal bays bordering the Gulf of Mexico are drowned river valleys that have remained unfilled
because the rivers emptying into the bays are transporting very little sediment. Bays are oriented perpendicular to the Gulf shoreline, whereas lagoons are parallel to the Gulf shoreline. Some lagoons are locally named bays or sounds such as Sarasota Bay, Florida (8) and Santa Rosa Sound, Florida (29). The coastal lagoons formed when the uplands between the river valleys were flooded by rising sea level, so the lagoons separate the barrier islands from the main-land.
Bay and lagoon shores account for the longest stretches of eroding shoreline (Smith, 1990; Doyle and others, 1984; Canis and others, 1985; Morton and Paine, 1990; Penland and others, 1990). They are also the most complex in terms of land loss because they have different orientations and relief, and they cut across sediments with different eleva-tions and resistance to erosion. Bay shores can be composed of sand, shell, or mud and they can form low beaches, tall bluffs, or marshes. Analyses of shoreline changes in bays and lagoons are not included because the focus of this report is on the Gulf shoreline.
Barrier Islands
Origin and Evolution of Barriers
The origins and related morphologies of barrier islands can influence shoreline movement because the thicknesses
River
Bayhead DeltaMainland
Shore
Peninsula
Tidal Inlet
Bay(estuary)
River
Delta
pla
in
Lagoon
BarrierIsland
Tidal Inlet
Waves
LongshoreCurrents
Chenie
r plain
Figure 4. Common coastal landforms of the Gulf Coast region.
Open-File Report 2004-1043 16 Open-File Report 2004-1043 17
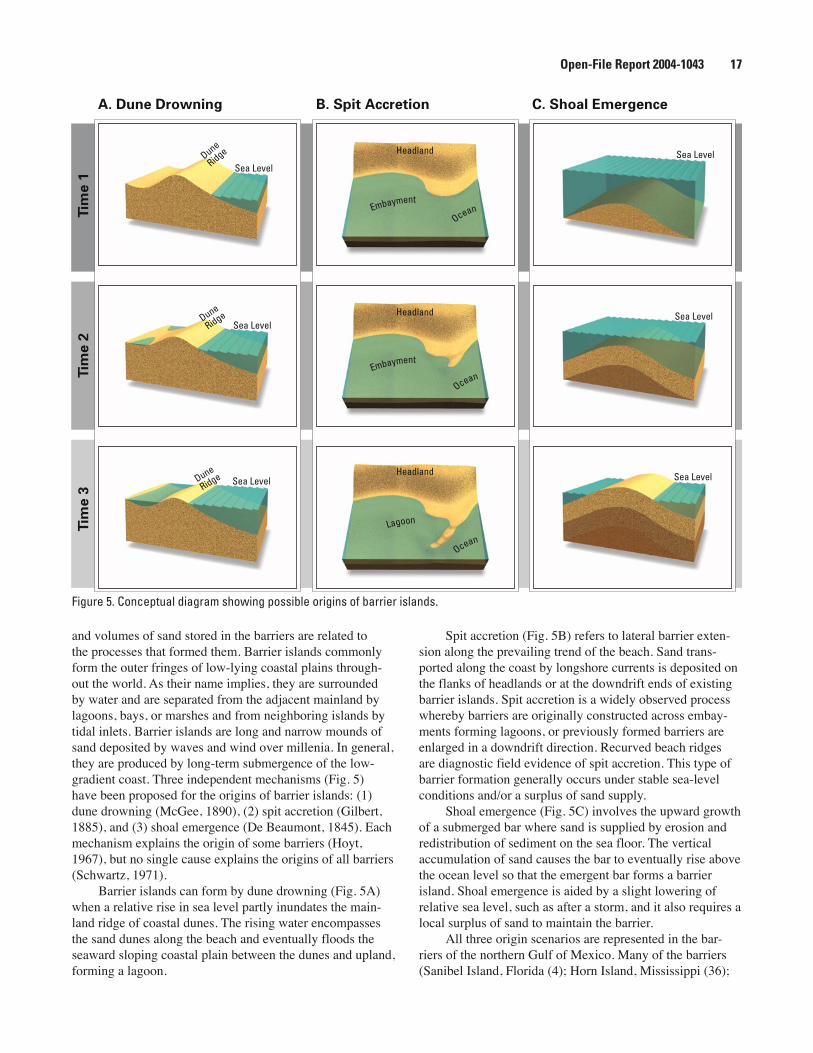
and volumes of sand stored in the barriers are related to the processes that formed them. Barrier islands commonly form the outer fringes of low-lying coastal plains through-out the world. As their name implies, they are surrounded by water and are separated from the adjacent mainland by lagoons, bays, or marshes and from neighboring islands by tidal inlets. Barrier islands are long and narrow mounds of sand deposited by waves and wind over millenia. In general, they are produced by long-term submergence of the low-gradient coast. Three independent mechanisms (Fig. 5) have been proposed for the origins of barrier islands: (1) dune drowning (McGee, 1890), (2) spit accretion (Gilbert, 1885), and (3) shoal emergence (De Beaumont, 1845). Each mechanism explains the origin of some barriers (Hoyt, 1967), but no single cause explains the origins of all barriers (Schwartz, 1971).
Barrier islands can form by dune drowning (Fig. 5A) when a relative rise in sea level partly inundates the main-land ridge of coastal dunes. The rising water encompasses the sand dunes along the beach and eventually floods the seaward sloping coastal plain between the dunes and upland, forming a lagoon.
Spit accretion (Fig. 5B) refers to lateral barrier exten-sion along the prevailing trend of the beach. Sand trans-ported along the coast by longshore currents is deposited on the flanks of headlands or at the downdrift ends of existing barrier islands. Spit accretion is a widely observed process whereby barriers are originally constructed across embay-ments forming lagoons, or previously formed barriers are enlarged in a downdrift direction. Recurved beach ridges are diagnostic field evidence of spit accretion. This type of barrier formation generally occurs under stable sea-level conditions and/or a surplus of sand supply.
Shoal emergence (Fig. 5C) involves the upward growth of a submerged bar where sand is supplied by erosion and redistribution of sediment on the sea floor. The vertical accumulation of sand causes the bar to eventually rise above the ocean level so that the emergent bar forms a barrier island. Shoal emergence is aided by a slight lowering of relative sea level, such as after a storm, and it also requires a local surplus of sand to maintain the barrier.
All three origin scenarios are represented in the bar-riers of the northern Gulf of Mexico. Many of the barriers (Sanibel Island, Florida (4); Horn Island, Mississippi (36);
A. Dune Drowning B. Spit Accretion C. Shoal EmergenceTi
me
1Ti
me
2Ti
me
3
Dune
Ridge
Sea Level
Dune
RidgeSea Level
Dune
Ridge Sea Level
Sea Level
Sea Level
Sea Level
Headland
Headland
Headland
Embayment
Embayment
Lagoon
Ocean
Ocean
Ocean
Figure 5. Conceptual diagram showing possible origins of barrier islands.
Open-File Report 2004-1043 18 Open-File Report 2004-1043 19
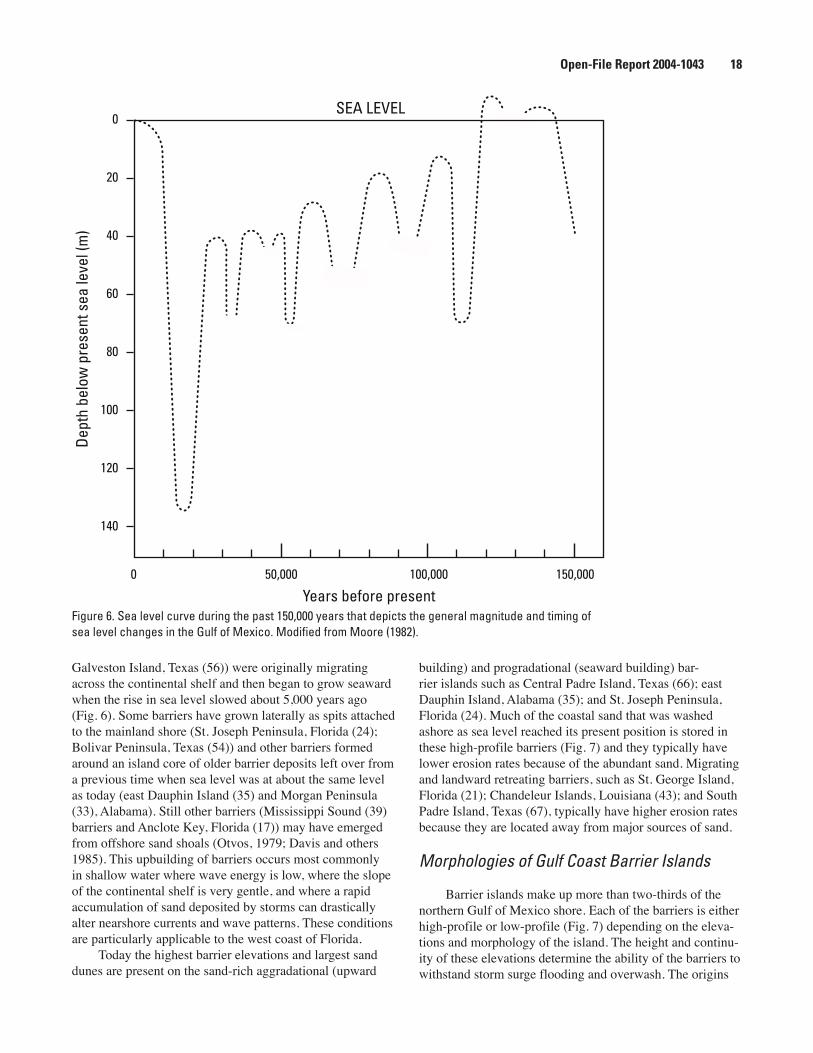
Galveston Island, Texas (56)) were originally migrating across the continental shelf and then began to grow seaward when the rise in sea level slowed about 5,000 years ago (Fig. 6). Some barriers have grown laterally as spits attached to the mainland shore (St. Joseph Peninsula, Florida (24); Bolivar Peninsula, Texas (54)) and other barriers formed around an island core of older barrier deposits left over from a previous time when sea level was at about the same level as today (east Dauphin Island (35) and Morgan Peninsula (33), Alabama). Still other barriers (Mississippi Sound (39) barriers and Anclote Key, Florida (17)) may have emerged from offshore sand shoals (Otvos, 1979; Davis and others 1985). This upbuilding of barriers occurs most commonly in shallow water where wave energy is low, where the slope of the continental shelf is very gentle, and where a rapid accumulation of sand deposited by storms can drastically alter nearshore currents and wave patterns. These conditions are particularly applicable to the west coast of Florida.
Today the highest barrier elevations and largest sand dunes are present on the sand-rich aggradational (upward
building) and progradational (seaward building) bar-rier islands such as Central Padre Island, Texas (66); east Dauphin Island, Alabama (35); and St. Joseph Peninsula, Florida (24). Much of the coastal sand that was washed ashore as sea level reached its present position is stored in these high-profile barriers (Fig. 7) and they typically have lower erosion rates because of the abundant sand. Migrating and landward retreating barriers, such as St. George Island, Florida (21); Chandeleur Islands, Louisiana (43); and South Padre Island, Texas (67), typically have higher erosion rates because they are located away from major sources of sand.
Morphologies of Gulf Coast Barrier Islands
Barrier islands make up more than two-thirds of the northern Gulf of Mexico shore. Each of the barriers is either high-profile or low-profile (Fig. 7) depending on the eleva-tions and morphology of the island. The height and continu-ity of these elevations determine the ability of the barriers to withstand storm surge flooding and overwash. The origins
0
20
40
60
80
100
120
140
0 50,000 100,000 150,000
Years before present
SEA LEVEL
Dept
h be
low
pre
sent
sea
leve
l (m
)
Figure 6. Sea level curve during the past 150,000 years that depicts the general magnitude and timing of sea level changes in the Gulf of Mexico. Modified from Moore (1982).

Open-File Report 2004-1043 18 Open-File Report 2004-1043 19
and profiles of the barriers also partly determine the stability of the shoreline (Morton, 1979).
Low-profile barriers, such as South Padre Island, Texas (67), the Chandeleur Islands of Louisiana (43), western Dauphin Island, Alabama (35), and St. George Island, Florida (21), are typically narrow and characterized by discontinuous frontal dunes that are lower than and inun-dated by extreme storm surges. This makes the entire barrier subject to frequent overwash during storms. Overwash also creates channels and fans that transfer sand from the ocean onto the barrier or into the adjacent lagoon. Barrier upbuilding is a response to a rise in relative sea level, and the transfer of sand from the ocean to the lagoon is how the barrier migrates landward and still retains its general shape
and sand volume. Island migration is enhanced if there is a deficit in the sand supply or if there is a rapid rise in relative sea level. However, if the rate of sea level rise is too great, then the barrier island is drowned in place and left as a sub-merged sand shoal on the continental shelf.
High-profile barriers, such as Sanibel Island, Florida (4), Matagorda Island, Texas (61), and Central Padre Island, Texas (66) are the result of abundant sand supply for thou-sands of years. These barriers are typically wide and have continuous, well-vegetated dune ridges. The high elevations effectively block storm surges and prevent island overwash, even during the most severe storms. For high-profile barri-ers, enough sand is stored in the dunes that they are able to withstand prolonged erosion without being breached, which
High-Profile Barrier Island
Low-Profile Barrier Island
OceanFo
re beach
Back beach
Hummocky ve
getated
fore -is
land dunes
Foredune rid
ge
Intervening sw
ale
Foredune rid
ge
Vegetated barrier fl
at
MarshLa
goon
OceanFo
re beach
Back beach
Hummocky
disc
ontinuous d
unes
Overw
ash fa
ns
Lagoon
Figure 7. Geomorphological characteristics of high and low profile barrier islands. Modified from White and others (1978).
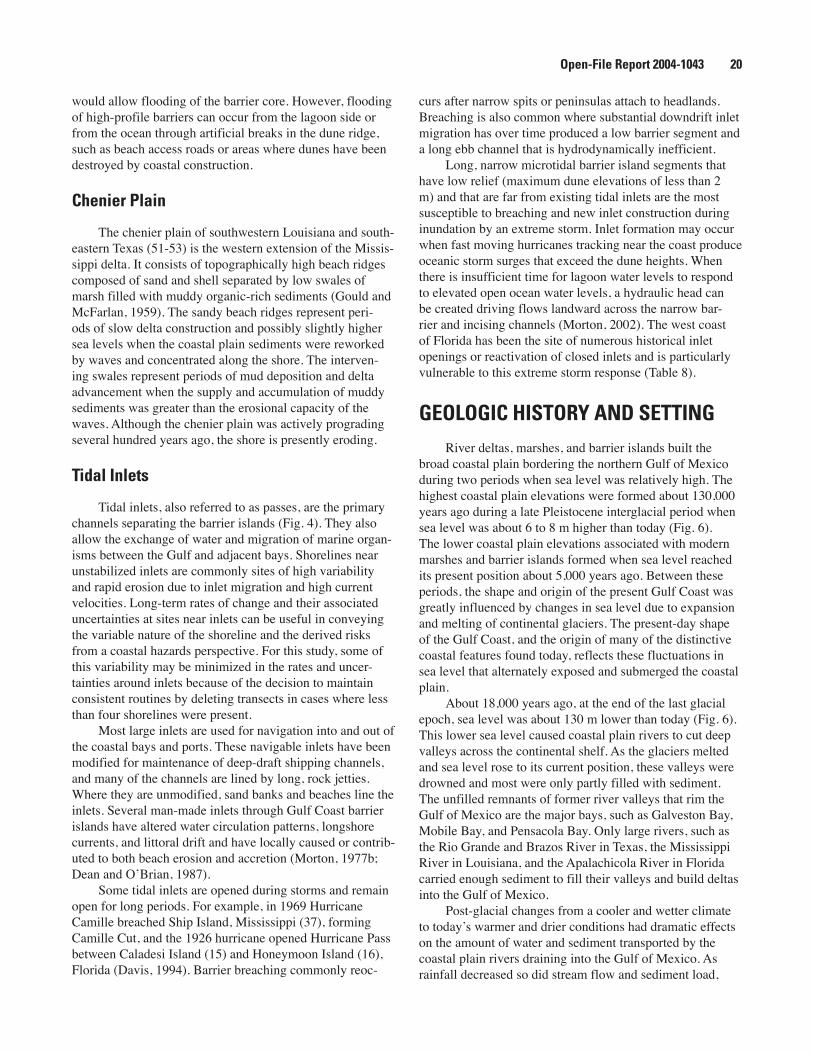
Open-File Report 2004-1043 20 Open-File Report 2004-1043 21
would allow flooding of the barrier core. However, flooding of high-profile barriers can occur from the lagoon side or from the ocean through artificial breaks in the dune ridge, such as beach access roads or areas where dunes have been destroyed by coastal construction.
Chenier Plain
The chenier plain of southwestern Louisiana and south-eastern Texas (51-53) is the western extension of the Missis-sippi delta. It consists of topographically high beach ridges composed of sand and shell separated by low swales of marsh filled with muddy organic-rich sediments (Gould and McFarlan, 1959). The sandy beach ridges represent peri-ods of slow delta construction and possibly slightly higher sea levels when the coastal plain sediments were reworked by waves and concentrated along the shore. The interven-ing swales represent periods of mud deposition and delta advancement when the supply and accumulation of muddy sediments was greater than the erosional capacity of the waves. Although the chenier plain was actively prograding several hundred years ago, the shore is presently eroding.
Tidal Inlets
Tidal inlets, also referred to as passes, are the primary channels separating the barrier islands (Fig. 4). They also allow the exchange of water and migration of marine organ-isms between the Gulf and adjacent bays. Shorelines near unstabilized inlets are commonly sites of high variability and rapid erosion due to inlet migration and high current velocities. Long-term rates of change and their associated uncertainties at sites near inlets can be useful in conveying the variable nature of the shoreline and the derived risks from a coastal hazards perspective. For this study, some of this variability may be minimized in the rates and uncer-tainties around inlets because of the decision to maintain consistent routines by deleting transects in cases where less than four shorelines were present.
Most large inlets are used for navigation into and out of the coastal bays and ports. These navigable inlets have been modified for maintenance of deep-draft shipping channels, and many of the channels are lined by long, rock jetties. Where they are unmodified, sand banks and beaches line the inlets. Several man-made inlets through Gulf Coast barrier islands have altered water circulation patterns, longshore currents, and littoral drift and have locally caused or contrib-uted to both beach erosion and accretion (Morton, 1977b; Dean and OʼBrian, 1987).
Some tidal inlets are opened during storms and remain open for long periods. For example, in 1969 Hurricane Camille breached Ship Island, Mississippi (37), forming Camille Cut, and the 1926 hurricane opened Hurricane Pass between Caladesi Island (15) and Honeymoon Island (16), Florida (Davis, 1994). Barrier breaching commonly reoc-
curs after narrow spits or peninsulas attach to headlands. Breaching is also common where substantial downdrift inlet migration has over time produced a low barrier segment and a long ebb channel that is hydrodynamically inefficient.
Long, narrow microtidal barrier island segments that have low relief (maximum dune elevations of less than 2 m) and that are far from existing tidal inlets are the most susceptible to breaching and new inlet construction during inundation by an extreme storm. Inlet formation may occur when fast moving hurricanes tracking near the coast produce oceanic storm surges that exceed the dune heights. When there is insufficient time for lagoon water levels to respond to elevated open ocean water levels, a hydraulic head can be created driving flows landward across the narrow bar-rier and incising channels (Morton, 2002). The west coast of Florida has been the site of numerous historical inlet openings or reactivation of closed inlets and is particularly vulnerable to this extreme storm response (Table 8).
GEOLOGIC HISTORY AND SETTINGRiver deltas, marshes, and barrier islands built the
broad coastal plain bordering the northern Gulf of Mexico during two periods when sea level was relatively high. The highest coastal plain elevations were formed about 130,000 years ago during a late Pleistocene interglacial period when sea level was about 6 to 8 m higher than today (Fig. 6). The lower coastal plain elevations associated with modern marshes and barrier islands formed when sea level reached its present position about 5,000 years ago. Between these periods, the shape and origin of the present Gulf Coast was greatly influenced by changes in sea level due to expansion and melting of continental glaciers. The present-day shape of the Gulf Coast, and the origin of many of the distinctive coastal features found today, reflects these fluctuations in sea level that alternately exposed and submerged the coastal plain.
About 18,000 years ago, at the end of the last glacial epoch, sea level was about 130 m lower than today (Fig. 6). This lower sea level caused coastal plain rivers to cut deep valleys across the continental shelf. As the glaciers melted and sea level rose to its current position, these valleys were drowned and most were only partly filled with sediment. The unfilled remnants of former river valleys that rim the Gulf of Mexico are the major bays, such as Galveston Bay, Mobile Bay, and Pensacola Bay. Only large rivers, such as the Rio Grande and Brazos River in Texas, the Mississippi River in Louisiana, and the Apalachicola River in Florida carried enough sediment to fill their valleys and build deltas into the Gulf of Mexico.
Post-glacial changes from a cooler and wetter climate to todayʼs warmer and drier conditions had dramatic effects on the amount of water and sediment transported by the coastal plain rivers draining into the Gulf of Mexico. As rainfall decreased so did stream flow and sediment load,
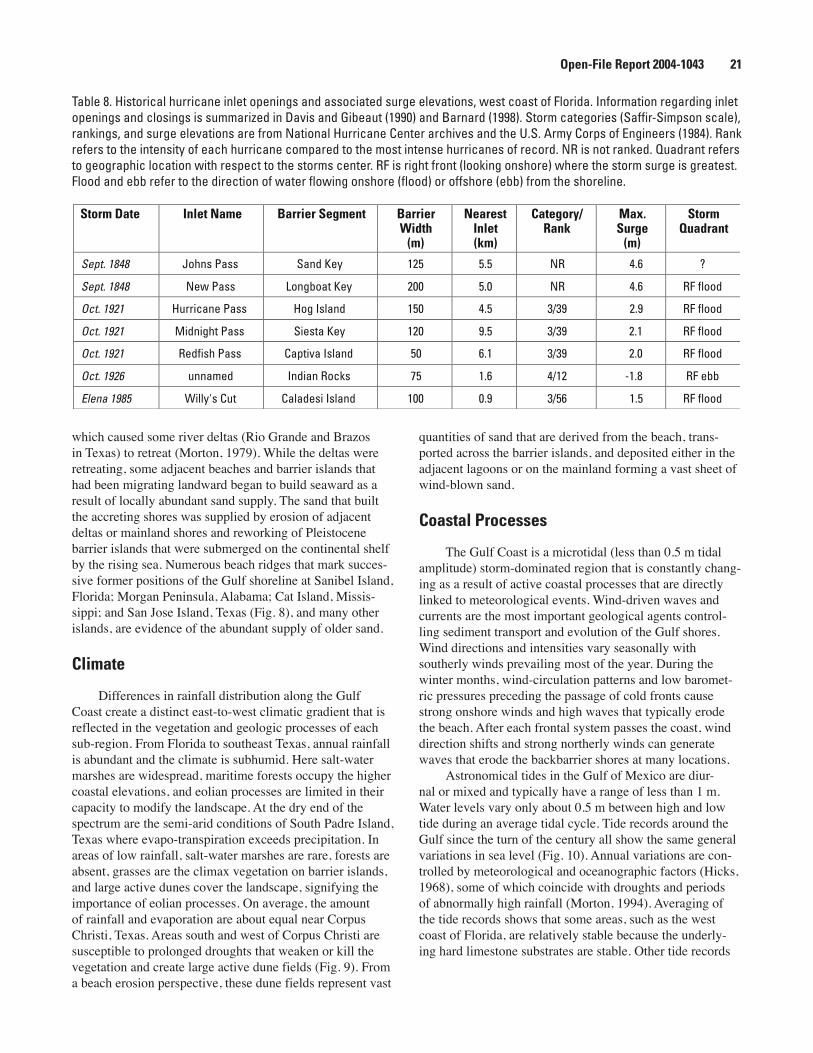
Open-File Report 2004-1043 20 Open-File Report 2004-1043 21
which caused some river deltas (Rio Grande and Brazos in Texas) to retreat (Morton, 1979). While the deltas were retreating, some adjacent beaches and barrier islands that had been migrating landward began to build seaward as a result of locally abundant sand supply. The sand that built the accreting shores was supplied by erosion of adjacent deltas or mainland shores and reworking of Pleistocene barrier islands that were submerged on the continental shelf by the rising sea. Numerous beach ridges that mark succes-sive former positions of the Gulf shoreline at Sanibel Island, Florida; Morgan Peninsula, Alabama; Cat Island, Missis-sippi; and San Jose Island, Texas (Fig. 8), and many other islands, are evidence of the abundant supply of older sand.
Climate
Differences in rainfall distribution along the Gulf Coast create a distinct east-to-west climatic gradient that is reflected in the vegetation and geologic processes of each sub-region. From Florida to southeast Texas, annual rainfall is abundant and the climate is subhumid. Here salt-water marshes are widespread, maritime forests occupy the higher coastal elevations, and eolian processes are limited in their capacity to modify the landscape. At the dry end of the spectrum are the semi-arid conditions of South Padre Island, Texas where evapo-transpiration exceeds precipitation. In areas of low rainfall, salt-water marshes are rare, forests are absent, grasses are the climax vegetation on barrier islands, and large active dunes cover the landscape, signifying the importance of eolian processes. On average, the amount of rainfall and evaporation are about equal near Corpus Christi, Texas. Areas south and west of Corpus Christi are susceptible to prolonged droughts that weaken or kill the vegetation and create large active dune fields (Fig. 9). From a beach erosion perspective, these dune fields represent vast
quantities of sand that are derived from the beach, trans-ported across the barrier islands, and deposited either in the adjacent lagoons or on the mainland forming a vast sheet of wind-blown sand.
Coastal Processes
The Gulf Coast is a microtidal (less than 0.5 m tidal amplitude) storm-dominated region that is constantly chang-ing as a result of active coastal processes that are directly linked to meteorological events. Wind-driven waves and currents are the most important geological agents control-ling sediment transport and evolution of the Gulf shores. Wind directions and intensities vary seasonally with southerly winds prevailing most of the year. During the winter months, wind-circulation patterns and low baromet-ric pressures preceding the passage of cold fronts cause strong onshore winds and high waves that typically erode the beach. After each frontal system passes the coast, wind direction shifts and strong northerly winds can generate waves that erode the backbarrier shores at many locations.
Astronomical tides in the Gulf of Mexico are diur-nal or mixed and typically have a range of less than 1 m. Water levels vary only about 0.5 m between high and low tide during an average tidal cycle. Tide records around the Gulf since the turn of the century all show the same general variations in sea level (Fig. 10). Annual variations are con-trolled by meteorological and oceanographic factors (Hicks, 1968), some of which coincide with droughts and periods of abnormally high rainfall (Morton, 1994). Averaging of the tide records shows that some areas, such as the west coast of Florida, are relatively stable because the underly-ing hard limestone substrates are stable. Other tide records
Storm Date Inlet Name Barrier Segment BarrierWidth
(m)
NearestInlet(km)
Category/Rank
Max.Surge
(m)
StormQuadrant
Sept. 1848 Johns Pass Sand Key 125 5.5 NR 4.6 ?
Sept. 1848 New Pass Longboat Key 200 5.0 NR 4.6 RF flood
Oct. 1921 Hurricane Pass Hog Island 150 4.5 3/39 2.9 RF flood
Oct. 1921 Midnight Pass Siesta Key 120 9.5 3/39 2.1 RF flood
Oct. 1921 Redfish Pass Captiva Island 50 6.1 3/39 2.0 RF flood
Oct. 1926 unnamed Indian Rocks 75 1.6 4/12 -1.8 RF ebb
Elena 1985 Willy's Cut Caladesi Island 100 0.9 3/56 1.5 RF flood
Table 8. Historical hurricane inlet openings and associated surge elevations, west coast of Florida. Information regarding inlet openings and closings is summarized in Davis and Gibeaut (1990) and Barnard (1998). Storm categories (Saffir-Simpson scale), rankings, and surge elevations are from National Hurricane Center archives and the U.S. Army Corps of Engineers (1984). Rank refers to the intensity of each hurricane compared to the most intense hurricanes of record. NR is not ranked. Quadrant refers to geographic location with respect to the storms center. RF is right front (looking onshore) where the storm surge is greatest. Flood and ebb refer to the direction of water flowing onshore (flood) or offshore (ebb) from the shoreline.
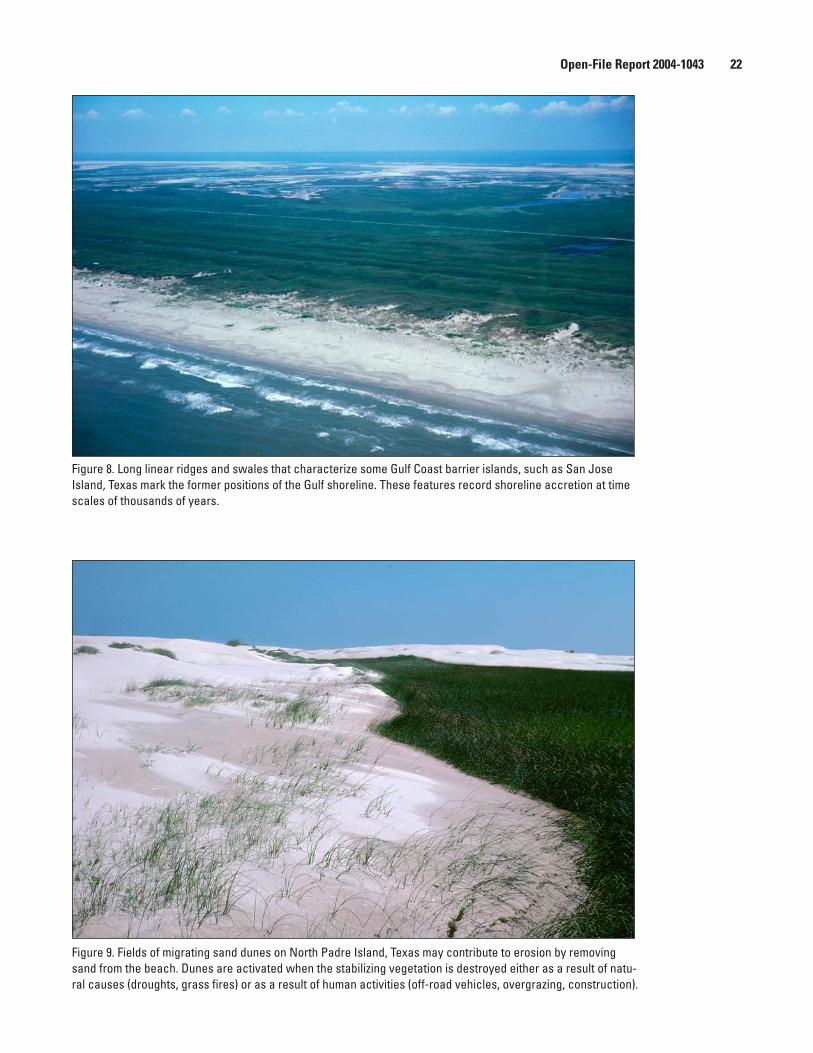
Open-File Report 2004-1043 22 Open-File Report 2004-1043 23
Figure 8. Long linear ridges and swales that characterize some Gulf Coast barrier islands, such as San Jose Island, Texas mark the former positions of the Gulf shoreline. These features record shoreline accretion at time scales of thousands of years.
Figure 9. Fields of migrating sand dunes on North Padre Island, Texas may contribute to erosion by removing sand from the beach. Dunes are activated when the stabilizing vegetation is destroyed either as a result of natu-ral causes (droughts, grass fires) or as a result of human activities (off-road vehicles, overgrazing, construction).

Open-File Report 2004-1043 22 Open-File Report 2004-1043 23
at Galveston Island, Texas and Grand Isle, Louisiana show a relative rise in sea level of about 0.3 to 0.6 m during the 20th century (Lyles and others, 1988). This rate of rise is about 3 times faster than the global rise in sea level, which recently has averaged about 0.18 m per century (Gornitz and Lebedeff, 1987).
The difference between recorded rates of submergence along the Gulf Coast and the global rate of sea level rise is caused mostly by subsidence (Swanson and Thurlow, 1973). Releveling surveys show that the subsidence is related to regional tilting of the coastal plain; areas near and seaward of the shoreline are sinking while inland areas are being uplifted (Swanson and Thurlow, 1973, Holdahl and Mor-rison, 1974, and Jurkowski and others, 1984). Within the regional trend are areas where subsidence rates are high, such as the Houston-Galveston area (Fig. 11) and the Mis-sissippi delta where accelerated sinking is attributed respec-tively to ground-water withdrawal (Gabrysch, 1984), and sediment compaction and oil and gas production (Roberts and others, 1994; Morton and others, 2002).
Fair-weather waves in the Gulf of Mexico are normally less than 0.6 m high (Bretschneider, 1954; U.S. Army Corps of Engineers, 1983). The largest waves and highest sus-tained wind speeds in the Gulf of Mexico accompany major hurricanes. They also are responsible for the most property
damage and loss of lives. Hurricanes entering or originat-ing in the Gulf normally follow a northward or westward path (Fig. 12). The preferred paths of the storms determine the likelihood that a storm will make landfall at a particular site. Using historical sites of hurricane landfall, the National Hurricane Center has shown that the areas at greatest risk are around Galveston, Texas, southeastern Louisiana, and the Mississippi/Alabama coast (Simpson and Lawrence, 1971). Because hurricanes seldom recurve and make land-fall near St. Petersburg Florida, this part of the west Florida coast has the lowest probability of a storm in any year. However, because of the high density of development and population, this area has one of the highest potentials for a storm-related catastrophe.
Before crossing the northern Gulf Coast, the counter-clockwise circulation of hurricane wind drives nearshore currents and large volumes of beach and shoreface sand alongshore. High tides, large waves, and strong currents that accompany the storms can leave semi-permanent marks on the barrier islands and beaches. For example, the erosional escarpment carved by Hurricane Elena in 1985 is still vis-ible along the northern shore of St. George Sound, Florida. Storm channels that breached Dauphin Island, Alabama in the early 1900s and again in 1948 were reoccupied in 1979 when Hurricane Frederic completely washed over
1905 1925 1945 1965 1985 2005
Year
Sea
Leve
l (m
m)
6600
6800
7000
7200
7400
7600
7800
Key West, FL
Pensacola, FL
Galveston, TX
Grand Isle, LA
Figure 10. Long-term trends in average annual sea level at selected tide gauges in the Gulf of Mexico. Data are from the National Ocean Service.
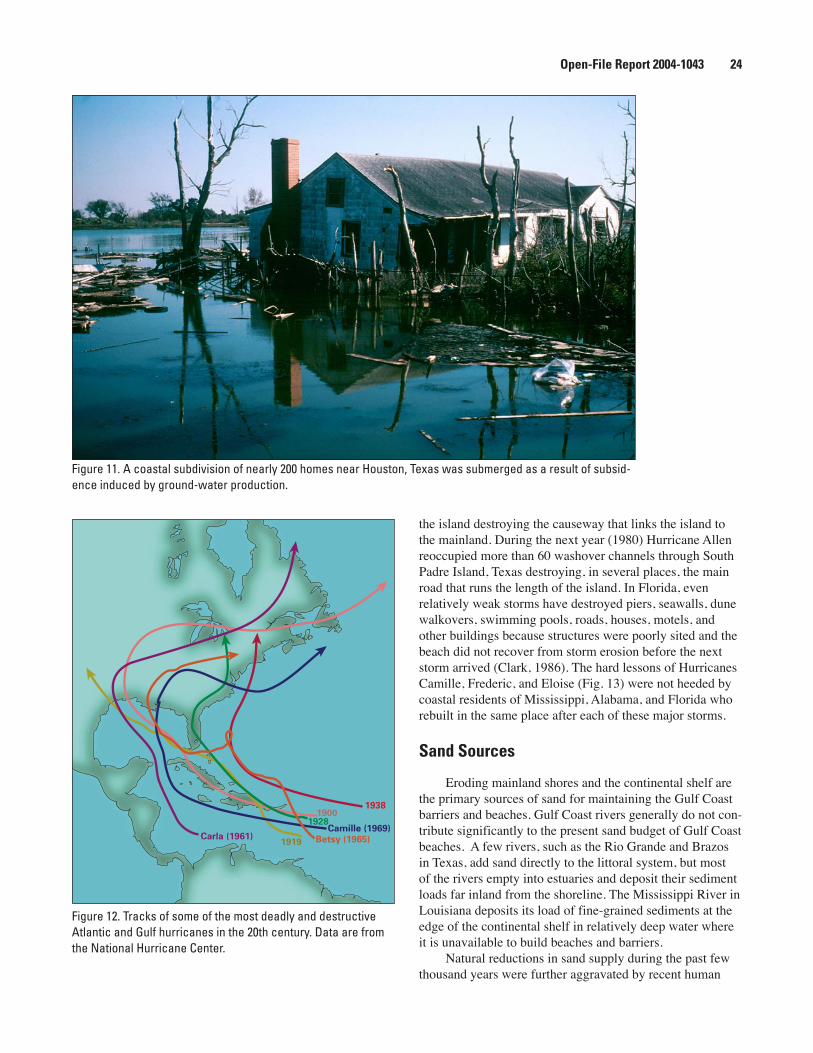
Open-File Report 2004-1043 24 Open-File Report 2004-1043 25
the island destroying the causeway that links the island to the mainland. During the next year (1980) Hurricane Allen reoccupied more than 60 washover channels through South Padre Island, Texas destroying, in several places, the main road that runs the length of the island. In Florida, even relatively weak storms have destroyed piers, seawalls, dune walkovers, swimming pools, roads, houses, motels, and other buildings because structures were poorly sited and the beach did not recover from storm erosion before the next storm arrived (Clark, 1986). The hard lessons of Hurricanes Camille, Frederic, and Eloise (Fig. 13) were not heeded by coastal residents of Mississippi, Alabama, and Florida who rebuilt in the same place after each of these major storms.
Sand Sources
Eroding mainland shores and the continental shelf are the primary sources of sand for maintaining the Gulf Coast barriers and beaches. Gulf Coast rivers generally do not con-tribute significantly to the present sand budget of Gulf Coast beaches. A few rivers, such as the Rio Grande and Brazos in Texas, add sand directly to the littoral system, but most of the rivers empty into estuaries and deposit their sediment loads far inland from the shoreline. The Mississippi River in Louisiana deposits its load of fine-grained sediments at the edge of the continental shelf in relatively deep water where it is unavailable to build beaches and barriers.
Natural reductions in sand supply during the past few thousand years were further aggravated by recent human
Figure 11. A coastal subdivision of nearly 200 homes near Houston, Texas was submerged as a result of subsid-ence induced by ground-water production.
19381900
1928Camille (1969)
Betsy (1965)1919Carla (1961)
Figure 12. Tracks of some of the most deadly and destructive Atlantic and Gulf hurricanes in the 20th century. Data are from the National Hurricane Center.

Open-File Report 2004-1043 24 Open-File Report 2004-1043 25
activities such as damming rivers, dredging channels, and constructing jetties. Flood-control structures caused most rivers to lose their capacity to transport sediment, thus dramatically decreasing the amount of sediment delivered directly to the Gulf shoreline or the bayhead deltas. Even if some river-borne sediment reaches the Gulf shore, the jetties at inlets disrupt the longshore currents and compart-mentalize the coast, preventing sediment exchange from one coastal segment to another. Before the littoral drift system was altered, sand was naturally bypassed around tidal inlets and shared between neighboring coastal segments. Now there are many coastal compartments isolated by long impermeable jetties or deep navigation channels like those maintained at the entrance to Tampa, Mobile, Galveston, and Corpus Christi Bays. This human interference with litto-ral drift has caused some formerly accreting or stable shores to begin eroding (Morton, 1979).
GENERAL CHARACTERISTICS OF THE GULF SHORES BY STATE
The southwest, west, and panhandle coasts of Florida offer a rich diversity of shoreline types, compositions, and degrees of economic development. This coastal region contains mangrove swamps, sandy barriers and mainland beaches, irregular drowned karst topography, and marshes. Barrier islands occupy much of the shore from Marcos Island to Anclote Key and from Destin to Perdido Key (Fig.
3). Exceptions are the topographically high sandy uplands that extend from Marco Island to Sanibel Island and from St. Joseph Peninsula to Destin. Barrier islands also fringe the Apalachicola Delta, but it forms a large promontory that abruptly changes the shoreline orientation. The delta also marks the northern limit of the low wave-energy coast, which coincides with the drowned karst topography that extends southward to Anclote Key (Price, 1953; Tanner, 1960). Marsh and upland hammocks cover the drowned limestone segment. It lacks well-developed surface drain-age, and the tidal creeks are largely controlled by fracture patterns in the underlying limestone bedrock. Streams in this karst region do not transport any significant load of sedi-ment suitable for building or maintaining beaches. Large linear oyster reefs grow in the Gulf of Mexico where brack-ish salinities are maintained by freshwater inflows from underground springs and surface streams such as the Crystal River in Florida. The few pocket beaches fronting marsh of the low wave-energy coast are composed mostly of broken shells derived from the oyster reefs and offshore shoals (Davis and others, 1985).
Alabama has the least amount of ocean shore of the Gulf Coast states. In terms of landforms, the Alabama coast is similar to that of Texas and Florida where sandy barrier islands (Dauphin Island, Morgan Peninsula, Perdido Key) are close to but separated from the mainland by lagoons. Other features in Alabama that are similar to the other coasts are the unfilled river valleys (Mobile Bay, Perdido Bay) that dominate the landscape.
Figure 13. Property damage near Panama City, Florida caused by Hurricane Eloise in 1975. From Morton (1976).
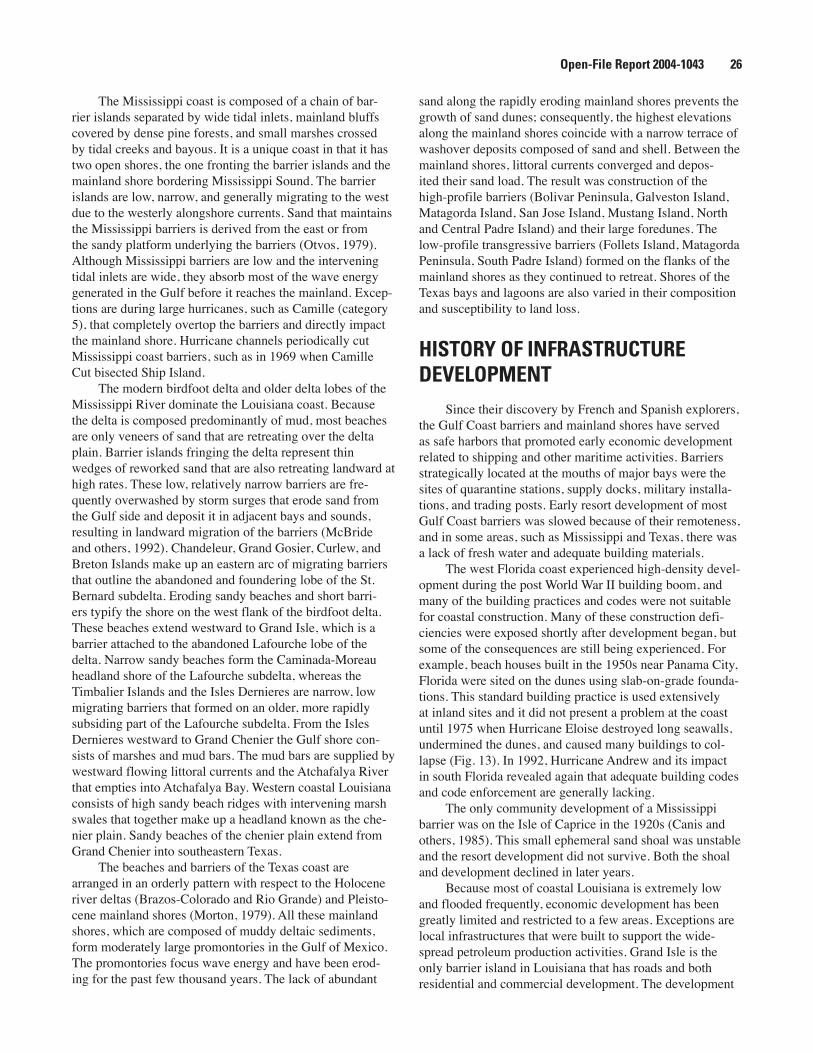
Open-File Report 2004-1043 26 Open-File Report 2004-1043 27
The Mississippi coast is composed of a chain of bar-rier islands separated by wide tidal inlets, mainland bluffs covered by dense pine forests, and small marshes crossed by tidal creeks and bayous. It is a unique coast in that it has two open shores, the one fronting the barrier islands and the mainland shore bordering Mississippi Sound. The barrier islands are low, narrow, and generally migrating to the west due to the westerly alongshore currents. Sand that maintains the Mississippi barriers is derived from the east or from the sandy platform underlying the barriers (Otvos, 1979). Although Mississippi barriers are low and the intervening tidal inlets are wide, they absorb most of the wave energy generated in the Gulf before it reaches the mainland. Excep-tions are during large hurricanes, such as Camille (category 5), that completely overtop the barriers and directly impact the mainland shore. Hurricane channels periodically cut Mississippi coast barriers, such as in 1969 when Camille Cut bisected Ship Island.
The modern birdfoot delta and older delta lobes of the Mississippi River dominate the Louisiana coast. Because the delta is composed predominantly of mud, most beaches are only veneers of sand that are retreating over the delta plain. Barrier islands fringing the delta represent thin wedges of reworked sand that are also retreating landward at high rates. These low, relatively narrow barriers are fre-quently overwashed by storm surges that erode sand from the Gulf side and deposit it in adjacent bays and sounds, resulting in landward migration of the barriers (McBride and others, 1992). Chandeleur, Grand Gosier, Curlew, and Breton Islands make up an eastern arc of migrating barriers that outline the abandoned and foundering lobe of the St. Bernard subdelta. Eroding sandy beaches and short barri-ers typify the shore on the west flank of the birdfoot delta. These beaches extend westward to Grand Isle, which is a barrier attached to the abandoned Lafourche lobe of the delta. Narrow sandy beaches form the Caminada-Moreau headland shore of the Lafourche subdelta, whereas the Timbalier Islands and the Isles Dernieres are narrow, low migrating barriers that formed on an older, more rapidly subsiding part of the Lafourche subdelta. From the Isles Dernieres westward to Grand Chenier the Gulf shore con-sists of marshes and mud bars. The mud bars are supplied by westward flowing littoral currents and the Atchafalya River that empties into Atchafalya Bay. Western coastal Louisiana consists of high sandy beach ridges with intervening marsh swales that together make up a headland known as the che-nier plain. Sandy beaches of the chenier plain extend from Grand Chenier into southeastern Texas.
The beaches and barriers of the Texas coast are arranged in an orderly pattern with respect to the Holocene river deltas (Brazos-Colorado and Rio Grande) and Pleisto-cene mainland shores (Morton, 1979). All these mainland shores, which are composed of muddy deltaic sediments, form moderately large promontories in the Gulf of Mexico. The promontories focus wave energy and have been erod-ing for the past few thousand years. The lack of abundant
sand along the rapidly eroding mainland shores prevents the growth of sand dunes; consequently, the highest elevations along the mainland shores coincide with a narrow terrace of washover deposits composed of sand and shell. Between the mainland shores, littoral currents converged and depos-ited their sand load. The result was construction of the high-profile barriers (Bolivar Peninsula, Galveston Island, Matagorda Island, San Jose Island, Mustang Island, North and Central Padre Island) and their large foredunes. The low-profile transgressive barriers (Follets Island, Matagorda Peninsula, South Padre Island) formed on the flanks of the mainland shores as they continued to retreat. Shores of the Texas bays and lagoons are also varied in their composition and susceptibility to land loss.
HISTORY OF INFRASTRUCTURE DEVELOPMENT
Since their discovery by French and Spanish explorers, the Gulf Coast barriers and mainland shores have served as safe harbors that promoted early economic development related to shipping and other maritime activities. Barriers strategically located at the mouths of major bays were the sites of quarantine stations, supply docks, military installa-tions, and trading posts. Early resort development of most Gulf Coast barriers was slowed because of their remoteness, and in some areas, such as Mississippi and Texas, there was a lack of fresh water and adequate building materials.
The west Florida coast experienced high-density devel-opment during the post World War II building boom, and many of the building practices and codes were not suitable for coastal construction. Many of these construction defi-ciencies were exposed shortly after development began, but some of the consequences are still being experienced. For example, beach houses built in the 1950s near Panama City, Florida were sited on the dunes using slab-on-grade founda-tions. This standard building practice is used extensively at inland sites and it did not present a problem at the coast until 1975 when Hurricane Eloise destroyed long seawalls, undermined the dunes, and caused many buildings to col-lapse (Fig. 13). In 1992, Hurricane Andrew and its impact in south Florida revealed again that adequate building codes and code enforcement are generally lacking.
The only community development of a Mississippi barrier was on the Isle of Caprice in the 1920s (Canis and others, 1985). This small ephemeral sand shoal was unstable and the resort development did not survive. Both the shoal and development declined in later years.
Because most of coastal Louisiana is extremely low and flooded frequently, economic development has been greatly limited and restricted to a few areas. Exceptions are local infrastructures that were built to support the wide-spread petroleum production activities. Grand Isle is the only barrier island in Louisiana that has roads and both residential and commercial development. The development
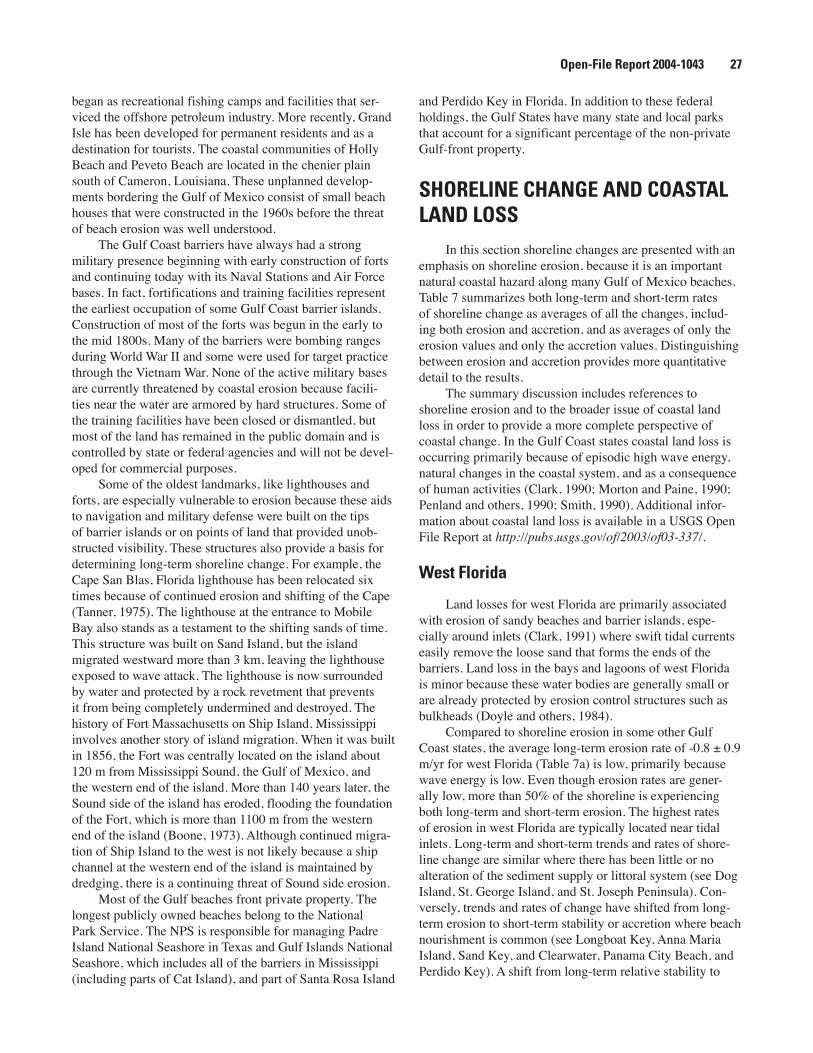
Open-File Report 2004-1043 26 Open-File Report 2004-1043 27
began as recreational fishing camps and facilities that ser-viced the offshore petroleum industry. More recently, Grand Isle has been developed for permanent residents and as a destination for tourists. The coastal communities of Holly Beach and Peveto Beach are located in the chenier plain south of Cameron, Louisiana. These unplanned develop-ments bordering the Gulf of Mexico consist of small beach houses that were constructed in the 1960s before the threat of beach erosion was well understood.
The Gulf Coast barriers have always had a strong military presence beginning with early construction of forts and continuing today with its Naval Stations and Air Force bases. In fact, fortifications and training facilities represent the earliest occupation of some Gulf Coast barrier islands. Construction of most of the forts was begun in the early to the mid 1800s. Many of the barriers were bombing ranges during World War II and some were used for target practice through the Vietnam War. None of the active military bases are currently threatened by coastal erosion because facili-ties near the water are armored by hard structures. Some of the training facilities have been closed or dismantled, but most of the land has remained in the public domain and is controlled by state or federal agencies and will not be devel-oped for commercial purposes.
Some of the oldest landmarks, like lighthouses and forts, are especially vulnerable to erosion because these aids to navigation and military defense were built on the tips of barrier islands or on points of land that provided unob-structed visibility. These structures also provide a basis for determining long-term shoreline change. For example, the Cape San Blas, Florida lighthouse has been relocated six times because of continued erosion and shifting of the Cape (Tanner, 1975). The lighthouse at the entrance to Mobile Bay also stands as a testament to the shifting sands of time. This structure was built on Sand Island, but the island migrated westward more than 3 km, leaving the lighthouse exposed to wave attack. The lighthouse is now surrounded by water and protected by a rock revetment that prevents it from being completely undermined and destroyed. The history of Fort Massachusetts on Ship Island, Mississippi involves another story of island migration. When it was built in 1856, the Fort was centrally located on the island about 120 m from Mississippi Sound, the Gulf of Mexico, and the western end of the island. More than 140 years later, the Sound side of the island has eroded, flooding the foundation of the Fort, which is more than 1100 m from the western end of the island (Boone, 1973). Although continued migra-tion of Ship Island to the west is not likely because a ship channel at the western end of the island is maintained by dredging, there is a continuing threat of Sound side erosion.
Most of the Gulf beaches front private property. The longest publicly owned beaches belong to the National Park Service. The NPS is responsible for managing Padre Island National Seashore in Texas and Gulf Islands National Seashore, which includes all of the barriers in Mississippi (including parts of Cat Island), and part of Santa Rosa Island
and Perdido Key in Florida. In addition to these federal holdings, the Gulf States have many state and local parks that account for a significant percentage of the non-private Gulf-front property.
SHORELINE CHANGE AND COASTAL LAND LOSS
In this section shoreline changes are presented with an emphasis on shoreline erosion, because it is an important natural coastal hazard along many Gulf of Mexico beaches. Table 7 summarizes both long-term and short-term rates of shoreline change as averages of all the changes, includ-ing both erosion and accretion, and as averages of only the erosion values and only the accretion values. Distinguishing between erosion and accretion provides more quantitative detail to the results.
The summary discussion includes references to shoreline erosion and to the broader issue of coastal land loss in order to provide a more complete perspective of coastal change. In the Gulf Coast states coastal land loss is occurring primarily because of episodic high wave energy, natural changes in the coastal system, and as a consequence of human activities (Clark, 1990; Morton and Paine, 1990; Penland and others, 1990; Smith, 1990). Additional infor-mation about coastal land loss is available in a USGS Open File Report at http://pubs.usgs.gov/of/2003/of03-337/.
West Florida
Land losses for west Florida are primarily associated with erosion of sandy beaches and barrier islands, espe-cially around inlets (Clark, 1991) where swift tidal currents easily remove the loose sand that forms the ends of the barriers. Land loss in the bays and lagoons of west Florida is minor because these water bodies are generally small or are already protected by erosion control structures such as bulkheads (Doyle and others, 1984).
Compared to shoreline erosion in some other Gulf Coast states, the average long-term erosion rate of -0.8 ± 0.9 m/yr for west Florida (Table 7a) is low, primarily because wave energy is low. Even though erosion rates are gener-ally low, more than 50% of the shoreline is experiencing both long-term and short-term erosion. The highest rates of erosion in west Florida are typically located near tidal inlets. Long-term and short-term trends and rates of shore-line change are similar where there has been little or no alteration of the sediment supply or littoral system (see Dog Island, St. George Island, and St. Joseph Peninsula). Con-versely, trends and rates of change have shifted from long-term erosion to short-term stability or accretion where beach nourishment is common (see Longboat Key, Anna Maria Island, Sand Key, and Clearwater, Panama City Beach, and Perdido Key). A shift from long-term relative stability to

Open-File Report 2004-1043 28 Open-File Report 2004-1043 29
Figure 15. Even where wave energy is normally low, episodic erosion during storms is capable of destroying roads and eliminating the beach. This example of erosion along the low energy coast is from Lighthouse Point, Florida.
Figure 14. Erosion of the Gulf shore eventually destroyed this beach house at Captiva Island, Florida.
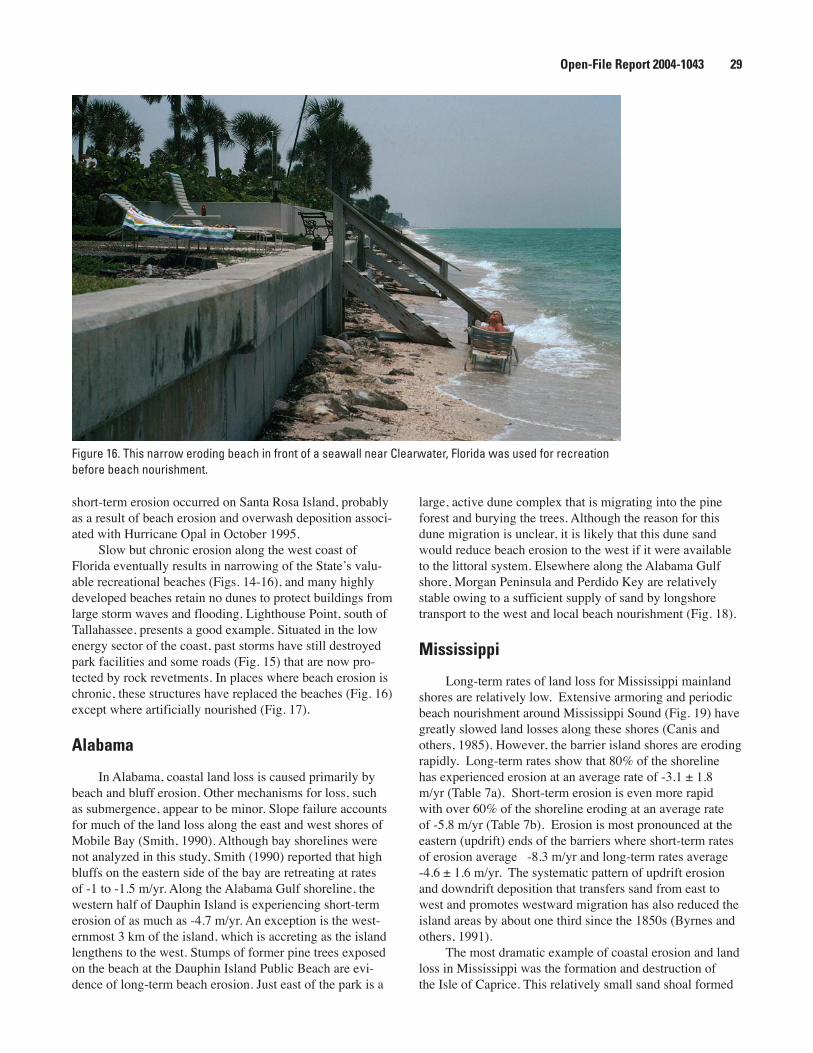
Open-File Report 2004-1043 28 Open-File Report 2004-1043 29
short-term erosion occurred on Santa Rosa Island, probably as a result of beach erosion and overwash deposition associ-ated with Hurricane Opal in October 1995.
Slow but chronic erosion along the west coast of Florida eventually results in narrowing of the Stateʼs valu-able recreational beaches (Figs. 14-16), and many highly developed beaches retain no dunes to protect buildings from large storm waves and flooding. Lighthouse Point, south of Tallahassee, presents a good example. Situated in the low energy sector of the coast, past storms have still destroyed park facilities and some roads (Fig. 15) that are now pro-tected by rock revetments. In places where beach erosion is chronic, these structures have replaced the beaches (Fig. 16) except where artificially nourished (Fig. 17).
Alabama
In Alabama, coastal land loss is caused primarily by beach and bluff erosion. Other mechanisms for loss, such as submergence, appear to be minor. Slope failure accounts for much of the land loss along the east and west shores of Mobile Bay (Smith, 1990). Although bay shorelines were not analyzed in this study, Smith (1990) reported that high bluffs on the eastern side of the bay are retreating at rates of -1 to -1.5 m/yr. Along the Alabama Gulf shoreline, the western half of Dauphin Island is experiencing short-term erosion of as much as -4.7 m/yr. An exception is the west-ernmost 3 km of the island, which is accreting as the island lengthens to the west. Stumps of former pine trees exposed on the beach at the Dauphin Island Public Beach are evi-dence of long-term beach erosion. Just east of the park is a
large, active dune complex that is migrating into the pine forest and burying the trees. Although the reason for this dune migration is unclear, it is likely that this dune sand would reduce beach erosion to the west if it were available to the littoral system. Elsewhere along the Alabama Gulf shore, Morgan Peninsula and Perdido Key are relatively stable owing to a sufficient supply of sand by longshore transport to the west and local beach nourishment (Fig. 18).
Mississippi
Long-term rates of land loss for Mississippi mainland shores are relatively low. Extensive armoring and periodic beach nourishment around Mississippi Sound (Fig. 19) have greatly slowed land losses along these shores (Canis and others, 1985). However, the barrier island shores are eroding rapidly. Long-term rates show that 80% of the shoreline has experienced erosion at an average rate of -3.1 ± 1.8 m/yr (Table 7a). Short-term erosion is even more rapid with over 60% of the shoreline eroding at an average rate of -5.8 m/yr (Table 7b). Erosion is most pronounced at the eastern (updrift) ends of the barriers where short-term rates of erosion average -8.3 m/yr and long-term rates average -4.6 ± 1.6 m/yr. The systematic pattern of updrift erosion and downdrift deposition that transfers sand from east to west and promotes westward migration has also reduced the island areas by about one third since the 1850s (Byrnes and others, 1991).
The most dramatic example of coastal erosion and land loss in Mississippi was the formation and destruction of the Isle of Caprice. This relatively small sand shoal formed
Figure 16. This narrow eroding beach in front of a seawall near Clearwater, Florida was used for recreation before beach nourishment.
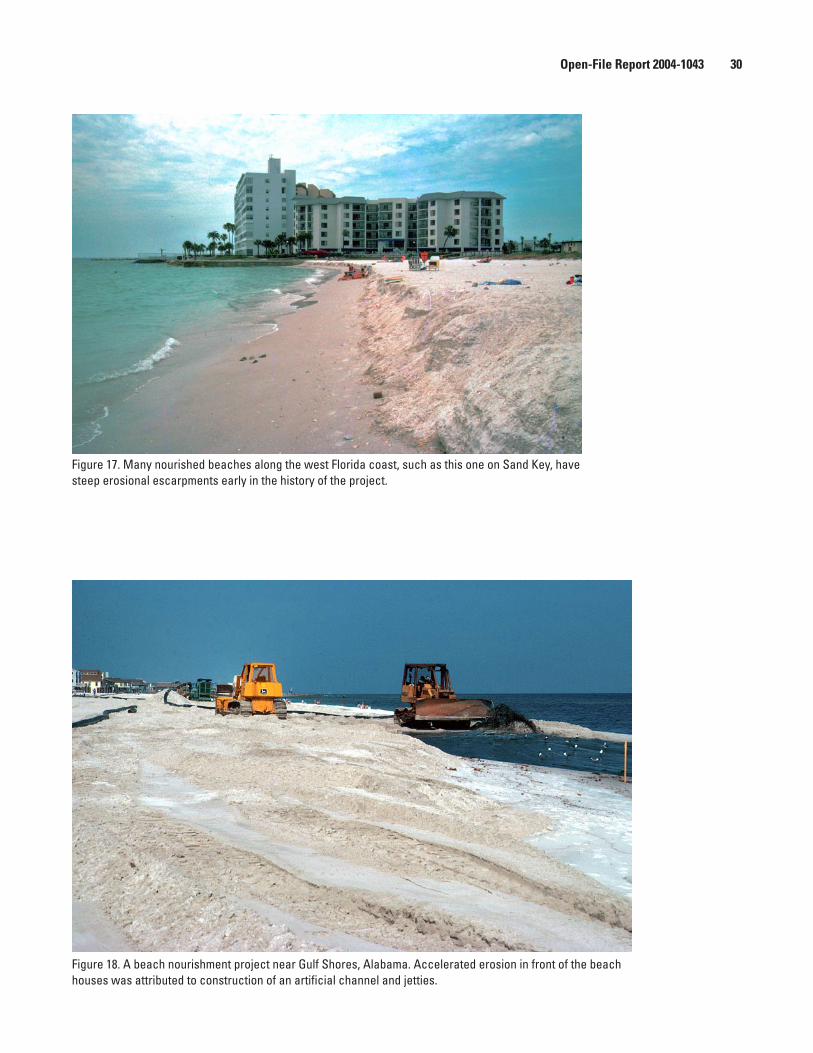
Open-File Report 2004-1043 30 Open-File Report 2004-1043 31
Figure 17. Many nourished beaches along the west Florida coast, such as this one on Sand Key, have steep erosional escarpments early in the history of the project.
Figure 18. A beach nourishment project near Gulf Shores, Alabama. Accelerated erosion in front of the beach houses was attributed to construction of an artificial channel and jetties.
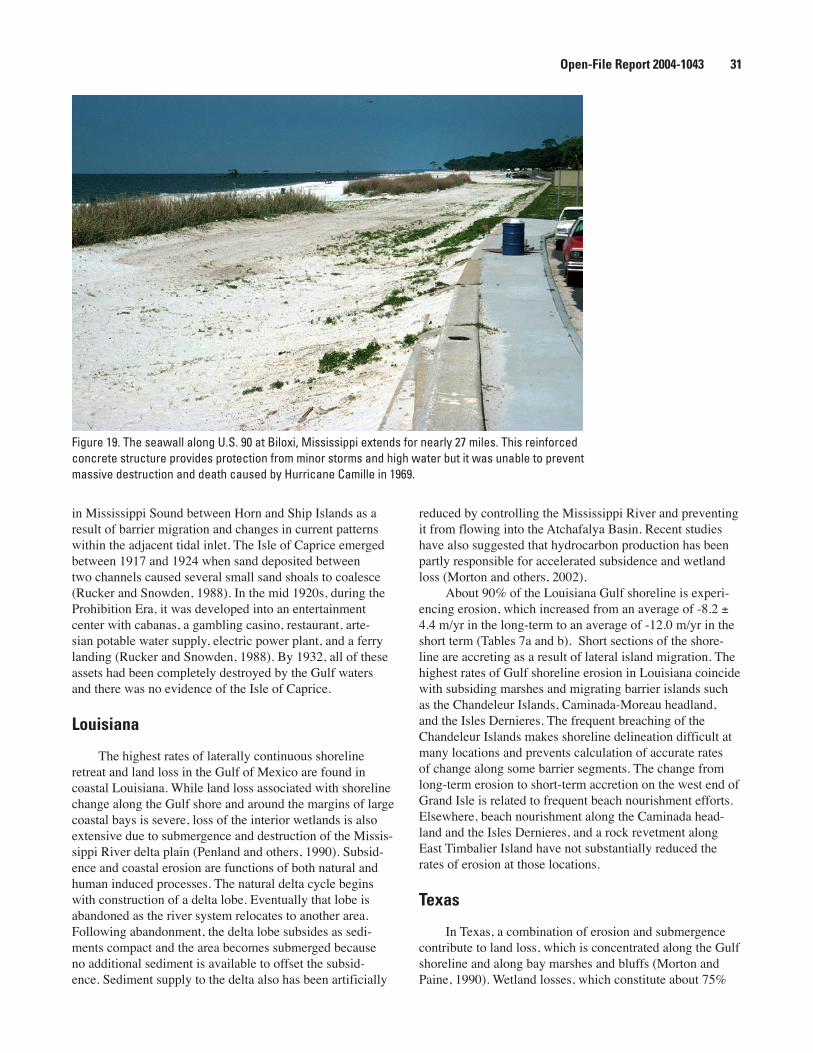
Open-File Report 2004-1043 30 Open-File Report 2004-1043 31
in Mississippi Sound between Horn and Ship Islands as a result of barrier migration and changes in current patterns within the adjacent tidal inlet. The Isle of Caprice emerged between 1917 and 1924 when sand deposited between two channels caused several small sand shoals to coalesce (Rucker and Snowden, 1988). In the mid 1920s, during the Prohibition Era, it was developed into an entertainment center with cabanas, a gambling casino, restaurant, arte-sian potable water supply, electric power plant, and a ferry landing (Rucker and Snowden, 1988). By 1932, all of these assets had been completely destroyed by the Gulf waters and there was no evidence of the Isle of Caprice.
Louisiana
The highest rates of laterally continuous shoreline retreat and land loss in the Gulf of Mexico are found in coastal Louisiana. While land loss associated with shoreline change along the Gulf shore and around the margins of large coastal bays is severe, loss of the interior wetlands is also extensive due to submergence and destruction of the Missis-sippi River delta plain (Penland and others, 1990). Subsid-ence and coastal erosion are functions of both natural and human induced processes. The natural delta cycle begins with construction of a delta lobe. Eventually that lobe is abandoned as the river system relocates to another area. Following abandonment, the delta lobe subsides as sedi-ments compact and the area becomes submerged because no additional sediment is available to offset the subsid-ence. Sediment supply to the delta also has been artificially
reduced by controlling the Mississippi River and preventing it from flowing into the Atchafalya Basin. Recent studies have also suggested that hydrocarbon production has been partly responsible for accelerated subsidence and wetland loss (Morton and others, 2002).
About 90% of the Louisiana Gulf shoreline is experi-encing erosion, which increased from an average of -8.2 ± 4.4 m/yr in the long-term to an average of -12.0 m/yr in the short term (Tables 7a and b). Short sections of the shore-line are accreting as a result of lateral island migration. The highest rates of Gulf shoreline erosion in Louisiana coincide with subsiding marshes and migrating barrier islands such as the Chandeleur Islands, Caminada-Moreau headland, and the Isles Dernieres. The frequent breaching of the Chandeleur Islands makes shoreline delineation difficult at many locations and prevents calculation of accurate rates of change along some barrier segments. The change from long-term erosion to short-term accretion on the west end of Grand Isle is related to frequent beach nourishment efforts. Elsewhere, beach nourishment along the Caminada head-land and the Isles Dernieres, and a rock revetment along East Timbalier Island have not substantially reduced the rates of erosion at those locations.
Texas
In Texas, a combination of erosion and submergence contribute to land loss, which is concentrated along the Gulf shoreline and along bay marshes and bluffs (Morton and Paine, 1990). Wetland losses, which constitute about 75%
Figure 19. The seawall along U.S. 90 at Biloxi, Mississippi extends for nearly 27 miles. This reinforced concrete structure provides protection from minor storms and high water but it was unable to prevent massive destruction and death caused by Hurricane Camille in 1969.
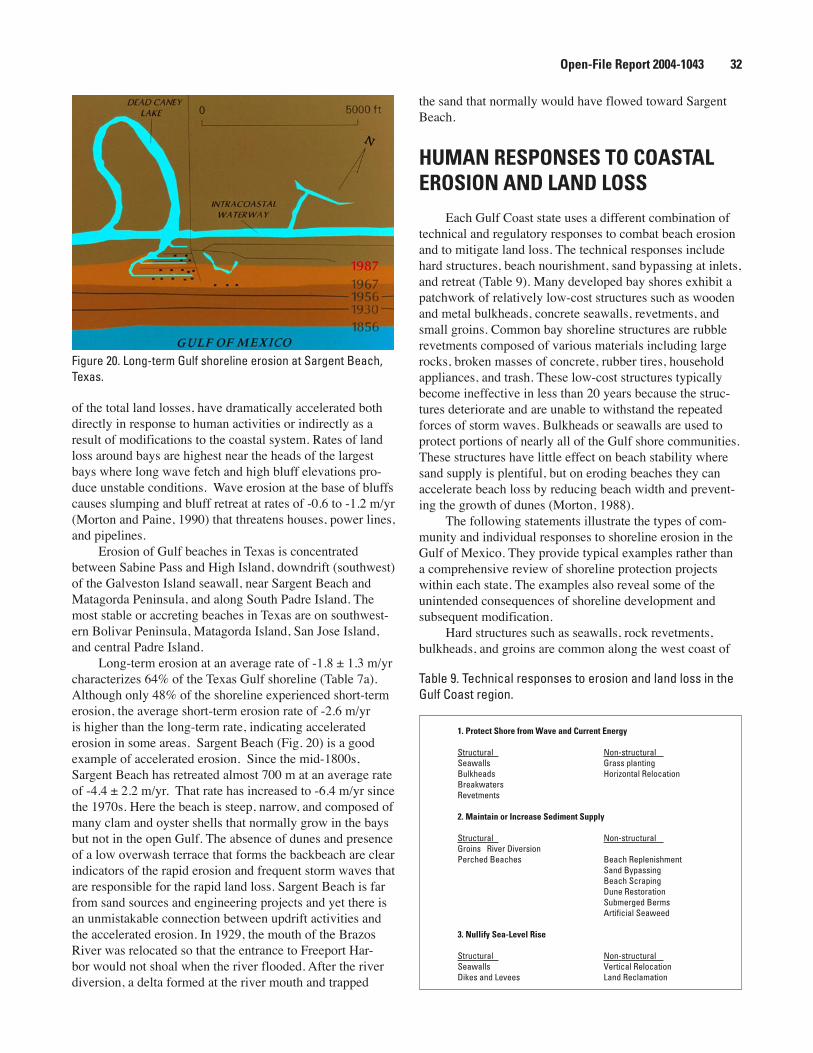
Open-File Report 2004-1043 32 Open-File Report 2004-1043 33
of the total land losses, have dramatically accelerated both directly in response to human activities or indirectly as a result of modifications to the coastal system. Rates of land loss around bays are highest near the heads of the largest bays where long wave fetch and high bluff elevations pro-duce unstable conditions. Wave erosion at the base of bluffs causes slumping and bluff retreat at rates of -0.6 to -1.2 m/yr (Morton and Paine, 1990) that threatens houses, power lines, and pipelines.
Erosion of Gulf beaches in Texas is concentrated between Sabine Pass and High Island, downdrift (southwest) of the Galveston Island seawall, near Sargent Beach and Matagorda Peninsula, and along South Padre Island. The most stable or accreting beaches in Texas are on southwest-ern Bolivar Peninsula, Matagorda Island, San Jose Island, and central Padre Island.
Long-term erosion at an average rate of -1.8 ± 1.3 m/yr characterizes 64% of the Texas Gulf shoreline (Table 7a). Although only 48% of the shoreline experienced short-term erosion, the average short-term erosion rate of -2.6 m/yr is higher than the long-term rate, indicating accelerated erosion in some areas. Sargent Beach (Fig. 20) is a good example of accelerated erosion. Since the mid-1800s, Sargent Beach has retreated almost 700 m at an average rate of -4.4 ± 2.2 m/yr. That rate has increased to -6.4 m/yr since the 1970s. Here the beach is steep, narrow, and composed of many clam and oyster shells that normally grow in the bays but not in the open Gulf. The absence of dunes and presence of a low overwash terrace that forms the backbeach are clear indicators of the rapid erosion and frequent storm waves that are responsible for the rapid land loss. Sargent Beach is far from sand sources and engineering projects and yet there is an unmistakable connection between updrift activities and the accelerated erosion. In 1929, the mouth of the Brazos River was relocated so that the entrance to Freeport Har-bor would not shoal when the river flooded. After the river diversion, a delta formed at the river mouth and trapped
the sand that normally would have flowed toward Sargent Beach.
HUMAN RESPONSES TO COASTAL EROSION AND LAND LOSS
Each Gulf Coast state uses a different combination of technical and regulatory responses to combat beach erosion and to mitigate land loss. The technical responses include hard structures, beach nourishment, sand bypassing at inlets, and retreat (Table 9). Many developed bay shores exhibit a patchwork of relatively low-cost structures such as wooden and metal bulkheads, concrete seawalls, revetments, and small groins. Common bay shoreline structures are rubble revetments composed of various materials including large rocks, broken masses of concrete, rubber tires, household appliances, and trash. These low-cost structures typically become ineffective in less than 20 years because the struc-tures deteriorate and are unable to withstand the repeated forces of storm waves. Bulkheads or seawalls are used to protect portions of nearly all of the Gulf shore communities. These structures have little effect on beach stability where sand supply is plentiful, but on eroding beaches they can accelerate beach loss by reducing beach width and prevent-ing the growth of dunes (Morton, 1988).
The following statements illustrate the types of com-munity and individual responses to shoreline erosion in the Gulf of Mexico. They provide typical examples rather than a comprehensive review of shoreline protection projects within each state. The examples also reveal some of the unintended consequences of shoreline development and subsequent modification.
Hard structures such as seawalls, rock revetments, bulkheads, and groins are common along the west coast of
Structural Non-structural Seawalls Grass plantingBulkheads Horizontal RelocationBreakwatersRevetments
Structural Non-structural Groins River DiversionPerched Beaches Beach Replenishment
Sand BypassingBeach ScrapingDune RestorationSubmerged BermsArtificial Seaweed
Structural Non-structural Seawalls Vertical RelocationDikes and Levees Land Reclamation
1. Protect Shore from Wave and Current Energy
2. Maintain or Increase Sediment Supply
3. Nullify Sea-Level Rise
Figure 20. Long-term Gulf shoreline erosion at Sargent Beach, Texas.
Table 9. Technical responses to erosion and land loss in the Gulf Coast region.
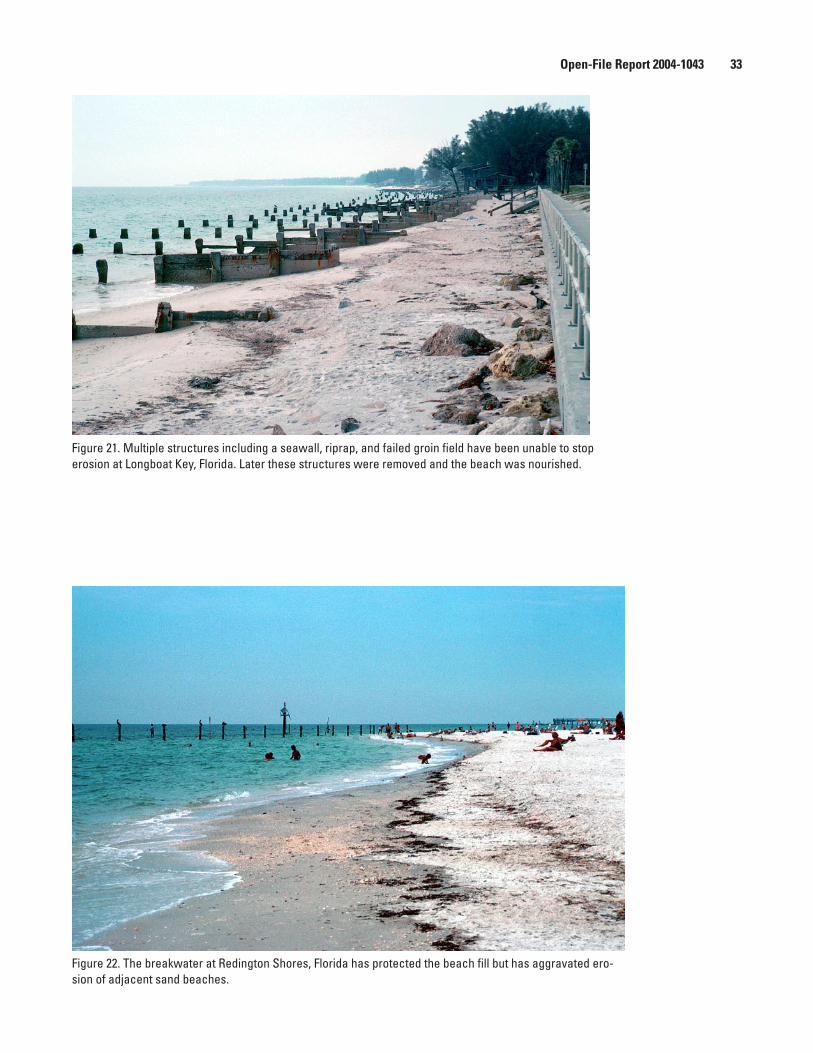
Open-File Report 2004-1043 32 Open-File Report 2004-1043 33
Figure 21. Multiple structures including a seawall, riprap, and failed groin field have been unable to stop erosion at Longboat Key, Florida. Later these structures were removed and the beach was nourished.
Figure 22. The breakwater at Redington Shores, Florida has protected the beach fill but has aggravated ero-sion of adjacent sand beaches.
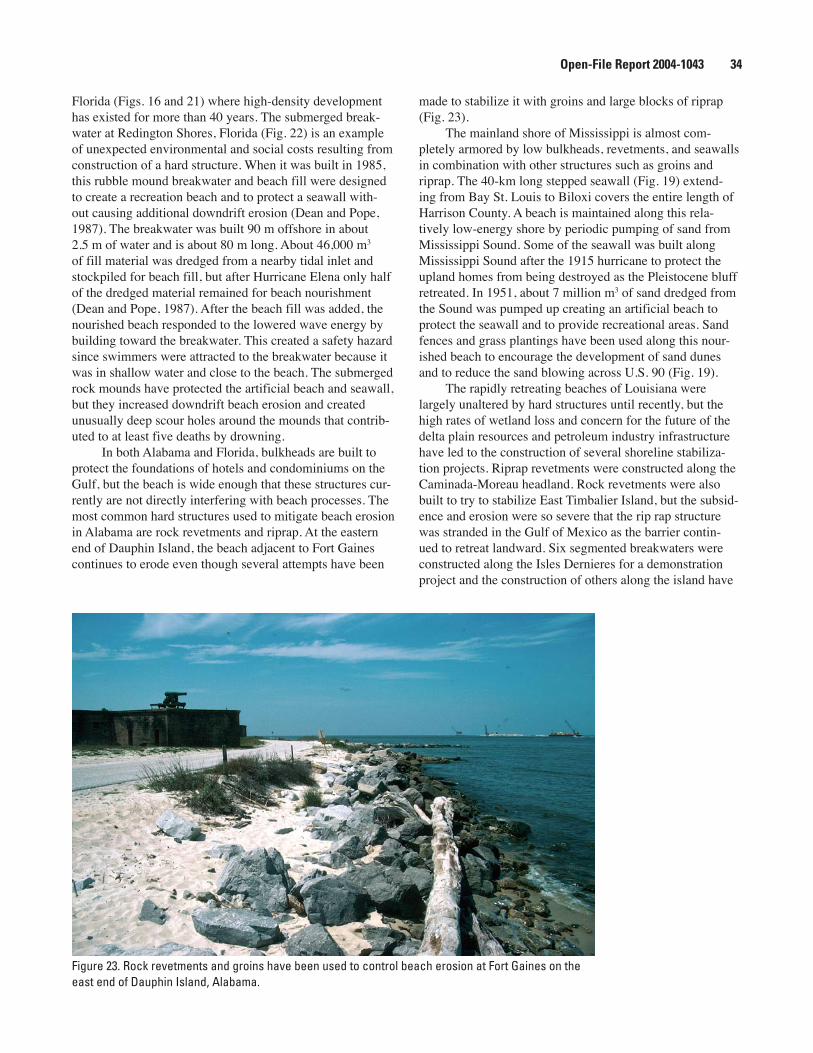
Open-File Report 2004-1043 34 Open-File Report 2004-1043 35
Florida (Figs. 16 and 21) where high-density development has existed for more than 40 years. The submerged break-water at Redington Shores, Florida (Fig. 22) is an example of unexpected environmental and social costs resulting from construction of a hard structure. When it was built in 1985, this rubble mound breakwater and beach fill were designed to create a recreation beach and to protect a seawall with-out causing additional downdrift erosion (Dean and Pope, 1987). The breakwater was built 90 m offshore in about 2.5 m of water and is about 80 m long. About 46,000 m3 of fill material was dredged from a nearby tidal inlet and stockpiled for beach fill, but after Hurricane Elena only half of the dredged material remained for beach nourishment (Dean and Pope, 1987). After the beach fill was added, the nourished beach responded to the lowered wave energy by building toward the breakwater. This created a safety hazard since swimmers were attracted to the breakwater because it was in shallow water and close to the beach. The submerged rock mounds have protected the artificial beach and seawall, but they increased downdrift beach erosion and created unusually deep scour holes around the mounds that contrib-uted to at least five deaths by drowning.
In both Alabama and Florida, bulkheads are built to protect the foundations of hotels and condominiums on the Gulf, but the beach is wide enough that these structures cur-rently are not directly interfering with beach processes. The most common hard structures used to mitigate beach erosion in Alabama are rock revetments and riprap. At the eastern end of Dauphin Island, the beach adjacent to Fort Gaines continues to erode even though several attempts have been
made to stabilize it with groins and large blocks of riprap (Fig. 23).
The mainland shore of Mississippi is almost com-pletely armored by low bulkheads, revetments, and seawalls in combination with other structures such as groins and riprap. The 40-km long stepped seawall (Fig. 19) extend-ing from Bay St. Louis to Biloxi covers the entire length of Harrison County. A beach is maintained along this rela-tively low-energy shore by periodic pumping of sand from Mississippi Sound. Some of the seawall was built along Mississippi Sound after the 1915 hurricane to protect the upland homes from being destroyed as the Pleistocene bluff retreated. In 1951, about 7 million m3 of sand dredged from the Sound was pumped up creating an artificial beach to protect the seawall and to provide recreational areas. Sand fences and grass plantings have been used along this nour-ished beach to encourage the development of sand dunes and to reduce the sand blowing across U.S. 90 (Fig. 19).
The rapidly retreating beaches of Louisiana were largely unaltered by hard structures until recently, but the high rates of wetland loss and concern for the future of the delta plain resources and petroleum industry infrastructure have led to the construction of several shoreline stabiliza-tion projects. Riprap revetments were constructed along the Caminada-Moreau headland. Rock revetments were also built to try to stabilize East Timbalier Island, but the subsid-ence and erosion were so severe that the rip rap structure was stranded in the Gulf of Mexico as the barrier contin-ued to retreat landward. Six segmented breakwaters were constructed along the Isles Dernieres for a demonstration project and the construction of others along the island have
Figure 23. Rock revetments and groins have been used to control beach erosion at Fort Gaines on the east end of Dauphin Island, Alabama.
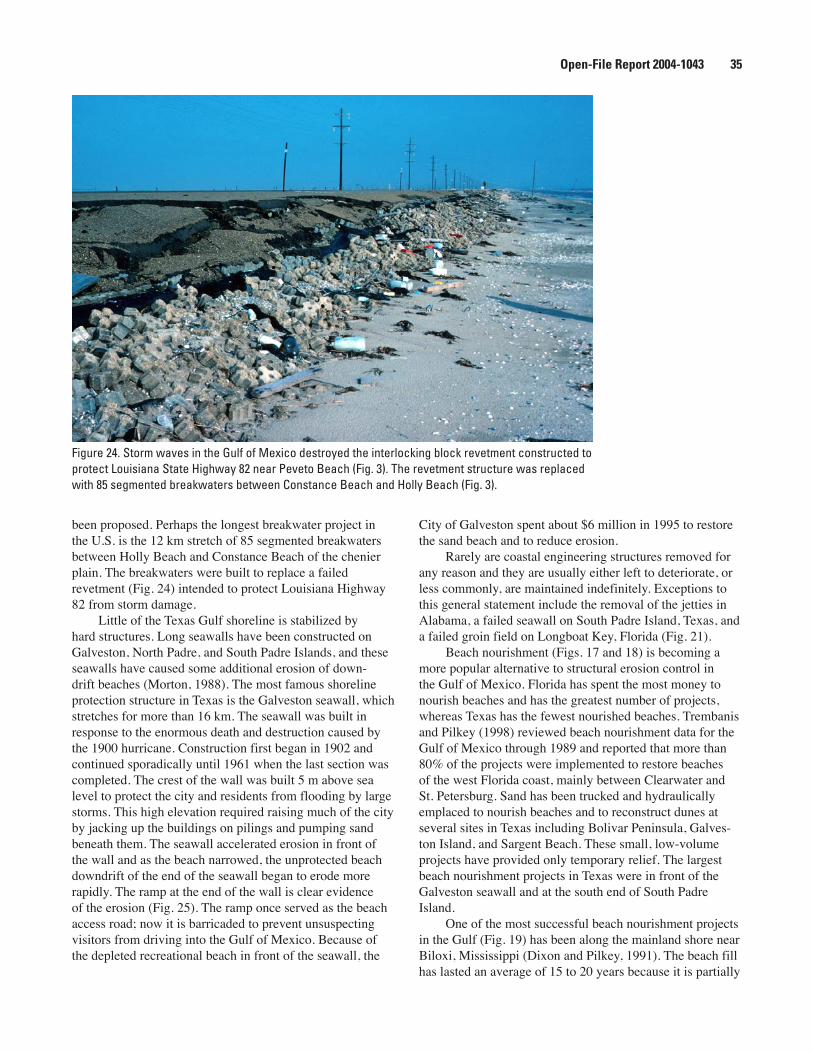
Open-File Report 2004-1043 34 Open-File Report 2004-1043 35
been proposed. Perhaps the longest breakwater project in the U.S. is the 12 km stretch of 85 segmented breakwaters between Holly Beach and Constance Beach of the chenier plain. The breakwaters were built to replace a failed revetment (Fig. 24) intended to protect Louisiana Highway 82 from storm damage.
Little of the Texas Gulf shoreline is stabilized by hard structures. Long seawalls have been constructed on Galveston, North Padre, and South Padre Islands, and these seawalls have caused some additional erosion of down-drift beaches (Morton, 1988). The most famous shoreline protection structure in Texas is the Galveston seawall, which stretches for more than 16 km. The seawall was built in response to the enormous death and destruction caused by the 1900 hurricane. Construction first began in 1902 and continued sporadically until 1961 when the last section was completed. The crest of the wall was built 5 m above sea level to protect the city and residents from flooding by large storms. This high elevation required raising much of the city by jacking up the buildings on pilings and pumping sand beneath them. The seawall accelerated erosion in front of the wall and as the beach narrowed, the unprotected beach downdrift of the end of the seawall began to erode more rapidly. The ramp at the end of the wall is clear evidence of the erosion (Fig. 25). The ramp once served as the beach access road; now it is barricaded to prevent unsuspecting visitors from driving into the Gulf of Mexico. Because of the depleted recreational beach in front of the seawall, the
City of Galveston spent about $6 million in 1995 to restore the sand beach and to reduce erosion.
Rarely are coastal engineering structures removed for any reason and they are usually either left to deteriorate, or less commonly, are maintained indefinitely. Exceptions to this general statement include the removal of the jetties in Alabama, a failed seawall on South Padre Island, Texas, and a failed groin field on Longboat Key, Florida (Fig. 21).
Beach nourishment (Figs. 17 and 18) is becoming a more popular alternative to structural erosion control in the Gulf of Mexico. Florida has spent the most money to nourish beaches and has the greatest number of projects, whereas Texas has the fewest nourished beaches. Trembanis and Pilkey (1998) reviewed beach nourishment data for the Gulf of Mexico through 1989 and reported that more than 80% of the projects were implemented to restore beaches of the west Florida coast, mainly between Clearwater and St. Petersburg. Sand has been trucked and hydraulically emplaced to nourish beaches and to reconstruct dunes at several sites in Texas including Bolivar Peninsula, Galves-ton Island, and Sargent Beach. These small, low-volume projects have provided only temporary relief. The largest beach nourishment projects in Texas were in front of the Galveston seawall and at the south end of South Padre Island.
One of the most successful beach nourishment projects in the Gulf (Fig. 19) has been along the mainland shore near Biloxi, Mississippi (Dixon and Pilkey, 1991). The beach fill has lasted an average of 15 to 20 years because it is partially
Figure 24. Storm waves in the Gulf of Mexico destroyed the interlocking block revetment constructed to protect Louisiana State Highway 82 near Peveto Beach (Fig. 3). The revetment structure was replaced with 85 segmented breakwaters between Constance Beach and Holly Beach (Fig. 3).

Open-File Report 2004-1043 36 Open-File Report 2004-1043 37
protected by the barrier islands. Another durable nourished beach is at Captiva Island, Florida where fill is obtained from maintenance dredging of a nearby inlet. In general, nourished beaches last longer in the Gulf of Mexico than on either the Atlantic or Pacific shores because of the lower wave energy. Even though beach nourishment is a favored method of controlling beach erosion, it can lead to some unfavorable results, such as steep scarps (Fig. 17) and shelly or rocky beach material. A specific example of undesirable consequences of beach nourishment is the Egmont Key, Florida project that derived its fill from maintenance dredg-ing of a nearby tidal inlet (Egmont Channel). The beach fill material was composed mostly of broken shell, which is less suitable than sand for beach durability and recreational comfort.
Sand bypassing is another engineering response to beach erosion at inlets where jetties are constructed to help maintain the inlet for boat traffic. At Perdido Key and Mexico Beach, Florida, small fixed bypassing plants have been constructed to transfer sand from the updrift side to the downdrift side of the inlet. Although these bypassing operations may reduce erosion at the inlets, they are unable to transfer the sand as efficiently as the natural unimpeded waves and currents. Therefore, sand bypassing does not entirely compensate for the erosion caused by the channel dredging and jetty construction.
Submerged berms (Table 9) are non-structural solu-tions to beach erosion near tidal inlets. They are constructed of sediment dredged from navigation channels and are currently being promoted as a solution to two problems, dis-posal of dredged spoil and mitigation of beach erosion. The
dredged material is deposited under water in a low mound parallel to the beach and in relatively shallow water. The berm acts as a submerged breakwater causing large waves to break offshore, thus reducing storm beach erosion. If the berms are oriented properly and built in shallow water, the waves may transfer some of the sand onshore and add to the forebeach. In the Gulf of Mexico, the Corps of Engineers has constructed submerged berms to reduce erosion and storm damage of Dauphin Island, Alabama and South Padre Island, Texas. These projects are not as efficient in control-ling beach erosion as direct placement of the dredged mate-rial on the beach, but they are also less costly than beach nourishment.
Deliberate relocation of buildings is not a common response to beach erosion and attendant coastal land loss in the Gulf Coast region. Nevertheless, there are several examples of voluntary relocation. Relocation of the visitorʼs center at Padre Island National Seashore (Fig. 26A and B) is a classic example of what happens when conventional wis-dom is ignored at the coast. Optimistic planners projected that many visitors would come to Padre Island National Seashore each year. In response, a large visitorʼs center was built that included bathhouses, observation decks, offices, a restaurant, and a nature display describing the processes and ecology of the barrier island. Park officials, ignoring the possible consequences of building too close to the water, constructed the large concrete pile-supported building on the beach so that beach users would not be inconvenienced. Fur-thermore, the tall sand dunes that formed the highest barrier island elevations were destroyed to construct a parking lot and to provide access to the facilities. After about 20 years
Figure 25. West end of the seawall at Galveston, Texas. The concrete ramp (right foreground) was the road leading to the beach in the mid 1960s. Since then the beach has eroded more than 150 m.
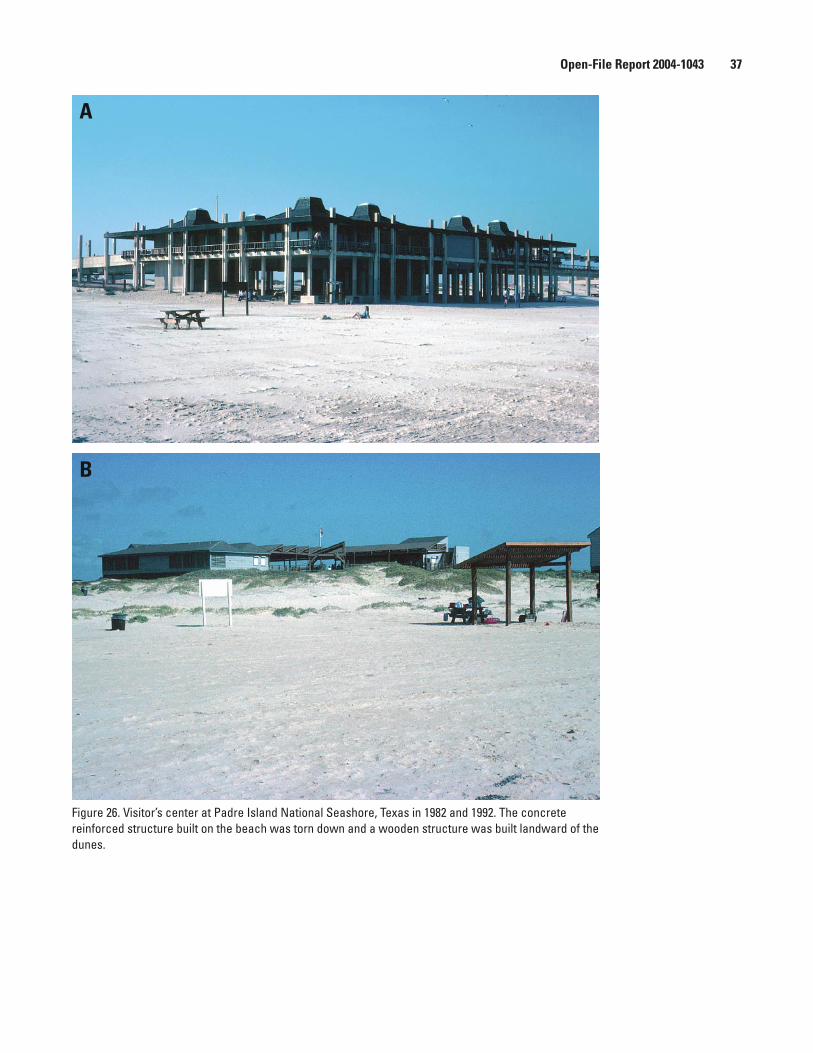
Open-File Report 2004-1043 36 Open-File Report 2004-1043 37
A
B
Figure 26. Visitor’s center at Padre Island National Seashore, Texas in 1982 and 1992. The concrete reinforced structure built on the beach was torn down and a wooden structure was built landward of the dunes.
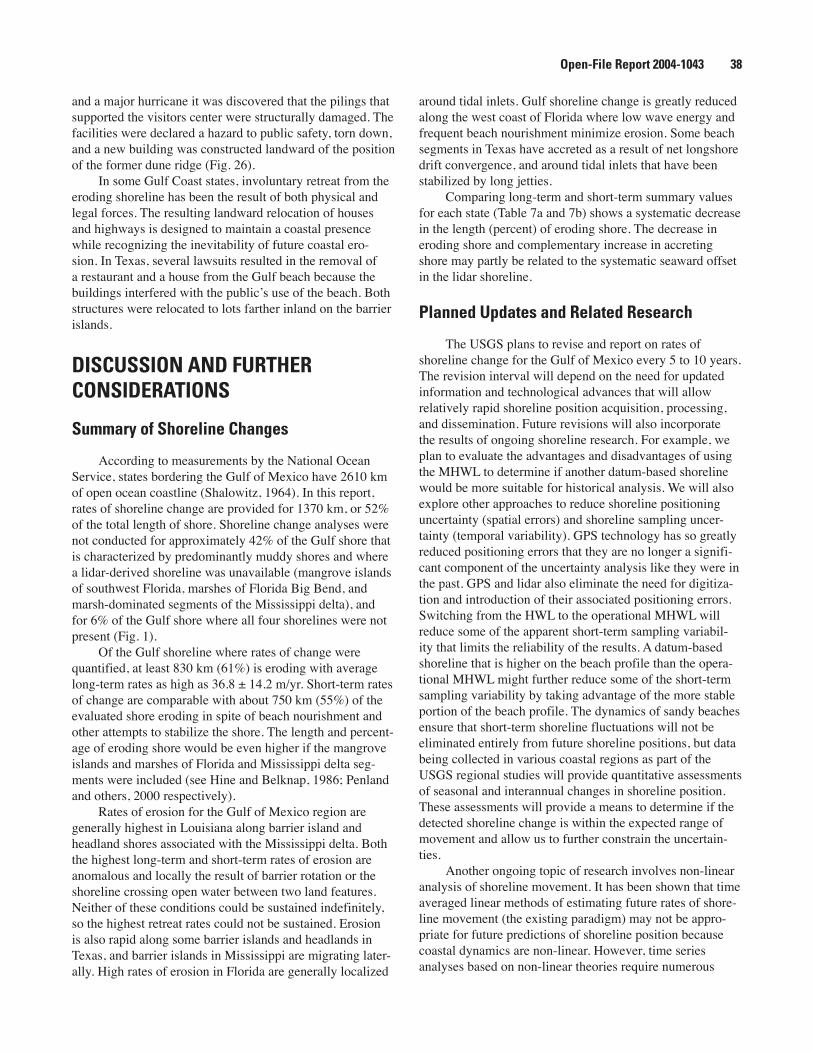
Open-File Report 2004-1043 38 Open-File Report 2004-1043 39
and a major hurricane it was discovered that the pilings that supported the visitors center were structurally damaged. The facilities were declared a hazard to public safety, torn down, and a new building was constructed landward of the position of the former dune ridge (Fig. 26).
In some Gulf Coast states, involuntary retreat from the eroding shoreline has been the result of both physical and legal forces. The resulting landward relocation of houses and highways is designed to maintain a coastal presence while recognizing the inevitability of future coastal ero-sion. In Texas, several lawsuits resulted in the removal of a restaurant and a house from the Gulf beach because the buildings interfered with the publicʼs use of the beach. Both structures were relocated to lots farther inland on the barrier islands.
DISCUSSION AND FURTHER CONSIDERATIONS
Summary of Shoreline Changes
According to measurements by the National Ocean Service, states bordering the Gulf of Mexico have 2610 km of open ocean coastline (Shalowitz, 1964). In this report, rates of shoreline change are provided for 1370 km, or 52% of the total length of shore. Shoreline change analyses were not conducted for approximately 42% of the Gulf shore that is characterized by predominantly muddy shores and where a lidar-derived shoreline was unavailable (mangrove islands of southwest Florida, marshes of Florida Big Bend, and marsh-dominated segments of the Mississippi delta), and for 6% of the Gulf shore where all four shorelines were not present (Fig. 1).
Of the Gulf shoreline where rates of change were quantified, at least 830 km (61%) is eroding with average long-term rates as high as 36.8 ± 14.2 m/yr. Short-term rates of change are comparable with about 750 km (55%) of the evaluated shore eroding in spite of beach nourishment and other attempts to stabilize the shore. The length and percent-age of eroding shore would be even higher if the mangrove islands and marshes of Florida and Mississippi delta seg-ments were included (see Hine and Belknap, 1986; Penland and others, 2000 respectively).
Rates of erosion for the Gulf of Mexico region are generally highest in Louisiana along barrier island and headland shores associated with the Mississippi delta. Both the highest long-term and short-term rates of erosion are anomalous and locally the result of barrier rotation or the shoreline crossing open water between two land features. Neither of these conditions could be sustained indefinitely, so the highest retreat rates could not be sustained. Erosion is also rapid along some barrier islands and headlands in Texas, and barrier islands in Mississippi are migrating later-ally. High rates of erosion in Florida are generally localized
around tidal inlets. Gulf shoreline change is greatly reduced along the west coast of Florida where low wave energy and frequent beach nourishment minimize erosion. Some beach segments in Texas have accreted as a result of net longshore drift convergence, and around tidal inlets that have been stabilized by long jetties.
Comparing long-term and short-term summary values for each state (Table 7a and 7b) shows a systematic decrease in the length (percent) of eroding shore. The decrease in eroding shore and complementary increase in accreting shore may partly be related to the systematic seaward offset in the lidar shoreline.
Planned Updates and Related Research
The USGS plans to revise and report on rates of shoreline change for the Gulf of Mexico every 5 to 10 years. The revision interval will depend on the need for updated information and technological advances that will allow relatively rapid shoreline position acquisition, processing, and dissemination. Future revisions will also incorporate the results of ongoing shoreline research. For example, we plan to evaluate the advantages and disadvantages of using the MHWL to determine if another datum-based shoreline would be more suitable for historical analysis. We will also explore other approaches to reduce shoreline positioning uncertainty (spatial errors) and shoreline sampling uncer-tainty (temporal variability). GPS technology has so greatly reduced positioning errors that they are no longer a signifi-cant component of the uncertainty analysis like they were in the past. GPS and lidar also eliminate the need for digitiza-tion and introduction of their associated positioning errors. Switching from the HWL to the operational MHWL will reduce some of the apparent short-term sampling variabil-ity that limits the reliability of the results. A datum-based shoreline that is higher on the beach profile than the opera-tional MHWL might further reduce some of the short-term sampling variability by taking advantage of the more stable portion of the beach profile. The dynamics of sandy beaches ensure that short-term shoreline fluctuations will not be eliminated entirely from future shoreline positions, but data being collected in various coastal regions as part of the USGS regional studies will provide quantitative assessments of seasonal and interannual changes in shoreline position. These assessments will provide a means to determine if the detected shoreline change is within the expected range of movement and allow us to further constrain the uncertain-ties.
Another ongoing topic of research involves non-linear analysis of shoreline movement. It has been shown that time averaged linear methods of estimating future rates of shore-line movement (the existing paradigm) may not be appro-priate for future predictions of shoreline position because coastal dynamics are non-linear. However, time series analyses based on non-linear theories require numerous
Open-File Report 2004-1043 38 Open-File Report 2004-1043 39
shoreline positions (high sampling frequency) that generally are unavailable for most coastal areas.
Influence of Human Activities
As coastal communities expand along eroding shores of the Gulf of Mexico, potential conflicts may arise between preservation of upland property (typically privately owned) and conservation of the beach (typically publicly owned). Past social responses indicate that these conflicts most likely will be resolved through a combination of beach nourish-ment projects and shoreline protection structures. Both of these engineering responses to erosion alter the natural beach processes and eventually lead to shoreline positions that are not related to the natural unaltered rates of beach erosion.
Adding sand to eroding beaches is the most com-mon method to mitigate storm damage and to maintain a
Clark, R., 1986, The impact of Hurricane Elena and tropi-cal storm Juan on coastal construction in Florida: Florida Department of Natural Resources, Division of Beaches and Shores, Report 85-3, 140p.
Clark, R., 1990, Coastal land loss in Florida: Transactions Gulf Coast Association of Geological Societies, v. 40, p. 117.
Clark, R., 1991, Beach conditions in Florida: Florida Department of Natural Resources, Division of Beaches and Shores, Technical Memorandum 89-1, 200p.
Coastal Erosion Subcommittee, 1996, Historical shoreline change in the northern Gulf of Mexico: U.S. Environ-mental Protection Agency, Gulf of Mexico Program, map scale 1:2,000,000.
Crowell, M., and Leatherman, S.P., eds., 1999, Coastal erosion mapping and management: Journal of Coastal Research, Special Issue 28, 196p.
Crowell, M., Douglas, B.C., and Leatherman, S.P., 1997, On forecasting future U.S. shoreline positions: A test of algo-rithms: Journal of Coastal Research, v. 13, p. 1245-1255.
Crowell, M., Leatherman, S.P., and Buckley, M.K., 1991, Historical shoreline change; Error analysis and mapping accuracy: Journal of Coastal Research, v. 7, p. 839-852.
Davis, R.A., 1994, Barriers of the Florida Gulf peninsula, in Davis, R.A., ed., Geology of Holocene Barrier Islands: Springer-Verlag, Berlin, p. 167-205.
REFERENCES
Anders, F.J., and Byrnes, M.R., 1991, Accuracy of shoreline change rates as determined from maps and aerial photo-graphs: Shore and Beach, v. 59, p. 17-26.
Barnard, P.L., 1998. Historical morphodynamics of inlet channels, west-central Florida. MS Thesis, University of South Florida, Tampa.
Barton, C.C., Dismukes, J.S., and Morton, R.A., 2003, Complexity analysis of the change in shoreline position at Duck, NC: Proceedings Coastal Sediments ʻ03, 7p.
Boone, P.A., 1973, Depositional systems of the Alabama, Mississippi, and western Florida coastal zone: Transac-tions Gulf Coast Association of Geological Societies, v. 23, p. 266-277.
Bretschneider, C.L., 1954, Field investigation of wave energy loss of shallow water ocean waves: Beach Erosion Board Technical Memorandum No. 46, 21p.
Byrnes, M.R., McBride, R.A., Penland, S., Hiland, M.W., and Westphal, K.A., 1991, Historical changes in shore-line position along the Mississippi Sound barrier islands: Proceedings Gulf Coast Section SEPM Twelfth Annual Research Conference, p. 43-55.
Canis, W.F., Pilkey, O.H., Jr., Neal, W.J., Pilkey, O.H., Sr., Martin, D., and Belknap, D. F., 1985, Living with the Ala-bama-Mississippi shore: Duke University Press, Durham, N.C., 215p.
recreational beach. Beach nourishment alters the rates of retreat by causing rapid artificial accretion of the shoreline. In those areas where nourishment is frequent, the trends of shoreline change will be biased toward accretion or stabil-ity, even though the beach is still eroding. Because many beaches are already altered by shoreline protection projects and many more will be altered in the future, the methods of analyzing shoreline movement will need to take shoreline stabilization activities into account so that the documented trends and derived rates of change can be expressed in their proper context.
Distinguishing between natural rates of shoreline movement and those influenced directly by human activi-ties is crucial when historical rates of change are used for planning and to project future shoreline positions. Improved methods of analyzing shoreline movement will be needed to document the natural rates of shoreline change.
Open-File Report 2004-1043 40 Open-File Report 2004-1043 41
Davis, R.A., Hine, A.C., and Belknap, D.F., eds., 1985, Geology of the barrier island and marsh-dominated coast, west-central Florida: Geological Society of America, Annual Meeting Field Trip Guidebook, 119 p.
Davis, R.A., Jr., and Gibeaut, J.C., 1990. Historical mor-phodynamics of inlets in Florida, Models for coastal zone planning. Sea Grant College Technical Paper 55, 81p.
Dean, R.G., and OʼBrian, M.P., 1987, Floridaʼs west coast inlets: Shoreline effects and recommended action: Coastal and Oceanographic Engineering Department, University of Florida, Rept. 87/016, 100p.
Dean, J.L., and Pope, J., 1987, The Redington Shores break-water project: initial response: Coastal Sediments ʻ87, American Society of Civil Engineers, v. 2, p. 1369-1384.
Dean, R.G., Cheng, J., and Malakar, S.B., 1998, Character-istics of the shoreline change along the sandy beaches of the state of Florida: An atlas: Florida Sea Grant Report UFL/COEL-98/015, variable pagination.
De Beaumont, L.E., 1845, Lecons de geologie practique: Septieme lecon, Bertrand Paris, p. 221-252.
Dixon, K.L., and Pilkey, O.H., 1991, Summary of beach replenishment on the U.S. Gulf of Mexico shoreline: Journal of Coastal Research, v. 7, p. 249-256.
Dolan, R., Anders, F., and Kimball, S., 1985, Coastal ero-sion and accretion, in National Atlas of the United Sates of America: U.S. Geological Survey, Reston, Va.
Douglas, B.C., and Crowell, M., 2000, Long-term shore-line position prediction and error propagation: Journal of Coastal Research, v. 16, p. 145-152.
Doyle, L.J., Sharma, D.C., Hine, A.C., Pilkey, O.H., Jr., Neal, W.J., Pilkey, O.H., Sr., Martin, D., Belknap, D.F., 1984, Living with the West Florida shore: Duke Univer-sity Press, Durham, N.C., 222p.
Gabrysch, R.K., 1984, Ground-water withdrawals and land-surface subsidence in the Houston-Galveston region, Texas: Texas Department of Water Resources Report 287, 64p.
Gilbert, G.K., 1885, The topographic features of lake shores: U.S. Geological Survey 5th Annual Rept., p. 69-123.
Gould, H.R., and McFarlan, E., Jr., 1959, Geologic history of the chenier plain southwestern Louisiana: Transactions Gulf Coast Association of Geological Societies, v. 9, p. 261-270.
Gornitz, V., and Lebedeff, S., 1987, Global sea level changes during the last century, in Nummedal, D., Pilkey, O. H., and Howard, J. D., eds., Sea-level fluctuation and coastal evolution: Society of Economic Paleontologists and Mineralogists, Special Publication 41, p. 3-16.
Hardin, J.D., Sapp, C.D., Emplaincourt, J.L., and Richter, K.E., 1976, Shoreline and bathymetric changes in the coastal area of Alabama: Geological Survey of Alabama, Information Series 50, 123 p.
The Heinz Center, 2000, Evaluation of erosion hazards: The H. John Heinz III Center for Science, Economics and the Environment, Washington, D.C., 203p.
Hicks, S.D., 1968, Long-period variations in secular sea level trends; Shore and Beach, v. 36, p. 32-36.
Hine, A.C., and Belknap, D.F., 1986, recent geologic history and modern sedimentary processes of the Pasco, Her-nando, and Citrus County coastline, West Central Florida: Florida Sea Grant, Technical Report No. 79, 166 p.
Holdahl, S.R., and Morrison, N.L., 1974, Regional inves-tigations of vertical crustal movements in the U.S using precise relevelings and mareograph data: Tectonophysics, v. 23, p. 373-390.
Hoyt, J.H., 1967, Barrier island formation: Geological Soci-ety of America Bulletin, v. 78. p. 1125-1135.
Jurkowski, G., Ni, J., and Brown, L., 1984, Modern uparch-ing of the Gulf Coastal plain: Journal of Geophysical Research, v. 89, p. 6247-6255.
Krabill, W., Wright, C., Swift, R., Frederick, E., Man-izade, S., Yungel, J., Martin, C., Sonntag, J., Duffy, M., Hulslander, W., and Brock, J., 2000. Airborne laser map-ping of Assateague National Seashore Beach. Photogram-metric Engineering & Remote Sensing, v. 66, p. 65-71.
Lyles, S.D., Hickman L.E., Jr., Debaugh, H.A., Jr., 1988, Sea-level variations for the United States 1855-1986: U.S. Department of Commerce, NOAA-NOS, Rockville Md., 182p.
McBride, R.A., Penland, S., Hiland, M.W., Williams, S.J., Westphal, K.A., Jaffee, B.E., and Sallenger, A.H., 1992, Analysis of barrier shoreline change in Louisiana from 1853 to 1989, in Williams, S.J., Penland, S., and Sal-lenger, A.H., eds., Atlas of shoreline changes in Louisiana from 1853 to 1989: U.S. Geological Survey Miscella-neous Investigation Series I-2150-A, p. 36-97.
McGee, W.D., 1890, Encroachments of the sea: The Forum, v. 9, p. 437-449.
Moore, L. J., 2000, Shoreline mapping techniques: Journal of Coastal Research, v. 16, p. 111-124
Open-File Report 2004-1043 40 Open-File Report 2004-1043 41
Moore, W.S., 1982, Late Pleistocene sea-level history, in Ivanovitch, M., and Harmon, R.S., eds., Uranium series disequilibrium: applications to environmental problems: Oxford, Claredon, p. 481-506.
Morgan, J.P., and Larimore, P.B., 1957, Changes in the Louisiana shoreline: Gulf Coast Association of Geologi-cal Societies Transactions, v. 7, p. 303-310.
Morton, R.A., 1976, Effects of Hurricane Eloise on beach and coastal structures, Florida Panhandle: Geology, v. 4, p. 277-280.
Morton, R.A., 1977a, Historical shoreline changes and their causes, Texas Gulf Coast: Gulf Coast Association of Geo-logical Societies Transactions, v. 27, p.352–364.
Morton, R.A., 1977b, Shoreline changes at jettied inlets, Texas Gulf Coast: Coastal Sediments ʻ77, American Soci-ety of Civil Engineers, p. 267-286.
Morton, R.A., 1979, Temporal and spatial variations in shoreline changes, Texas Gulf Coast: Journal of Sedimen-tary Petrology, v. 49, p. 1101-1111.
Morton, R.A., 1988, Interactions of storms, seawalls and beaches of the Texas coast, in Kraus, N.C., and Pilkey, O.H., Effects of seawalls on the beach: Journal of Coastal Research, Special Issue 4, p. 113-134.
Morton, R.A., 1991, Accurate shoreline mapping: past, present, and future: American Society of Civil Engineers, Coastal Sediments ʻ91, v. 1, p. 997-1010.
Morton, R.A., 1994, Texas Barriers, in Davis, R.A., ed., Geology of Holocene Barrier Islands: Springer-Verlag, Berlin, p. 75-114.
Morton, R.A., 1996, Geoindicators of coastal wetlands and shorelines, in Berger, A.R., and Iams, W.J., eds., Geoin-dicators: Assessing rapid environmental changes in earth systems: A.A. Balkema, Rotterdam, p. 207-230.
Morton, R.A., 1997, Gulf shoreline movement between Sabine Pass and the Brazos River, Texas: 1974-1996: Univ. of Texas Austin, Bureau of Economic Geology Geological Circular 97-3, 46p.
Morton, R.A., 2002, Factors controlling storm impacts on coastal barriers and beaches – A preliminary basis for real-time forecasting: Journal of Coastal Research, v. 18, p. 486-501.
Morton, R.A., and Paine, J.G., 1990, Coastal land loss in Texas - An overview: Transactions Gulf Coast Associa-tion of Geological Societies, v. 40, p. 625-634.
Morton, R.A., Buster, N.A., and Krohn, M.D., 2002, Sub-surface controls on historical subsidence rates and associ-ated wetland loss in southcentral Louisiana: Transactions Gulf Coast Association of Geological Societies, v. 52, p. 767-778.
Morton, R.A., and Speed, F.M., 1998, Evaluation of shore-lines and legal boundaries controlled by water levels on sandy beaches: Journal of Coastal Research, v. 14, p. 1373-1384.
Otvos, E.G., 1979, Barrier island evolution and history of migration, north central Gulf Coast, in Leatherman, S.P. ed., Barrier islands from the Gulf of St. Lawrence to the Gulf of Mexico: Academic Press, New York, p. 291-319.
Paine, J.G., and Morton, R.A., 1989, Shoreline and vegeta-tion line movement, Texas Gulf Coast, 1974-1982: The University of Texas at Austin, Bureau of Economic Geol-ogy, Geological Circular 89-1, 50p.
Pajak, M.J., and Leatherman, S.P., 2002, The high water line as shoreline indicator: Journal of Coastal Research, v. 18, p. 329-337.
Penland, S., Roberts, H.H., Williams, S.J., Sallenger, A.H., Cahoon, D.R., Davis, D.W., and Groat, C.G., 1990 Coastal land loss in Louisiana: Transactions Gulf Coast Association of Geological Societies, v. 40, p. 685-699.
Penland, S., Wayne, L., Britsch, L.D., Williams, S.J., Beall, A.D., and Caridas, V., 2000, Process Classification of Coastal Land Loss between 1932 and 1990 in the Missis-sippi River Delta Plain, Southeastern Louisiana: USGS Open-file Report 00-418.
Price, W.A., 1953, Shorelines and coasts of the Gulf of Mexico: U.S. Fish and Wildlife Service Fishery Bulletin No. 89, p. 39-65.
Roberts, H.H., Bailey, A., and Kuecher, G.J., 1994, Subsid-ence in the Mississippi River delta – Important influences of valley filling by cyclic deposition, primary consoli-dation phenomena, and early diagenesis: Gulf Coast Association of Geological Societies Transactions, v. 44, p. 619-629.
Rucker, J.B., and Snowden, J.O., 1988, Recent morphologi-cal changes at Dog Key Pass, Mississippi: The formation and disappearance of The Isle of Caprice: Gulf Coast Association of Geological Societies Transactions, v. 38, p. 343-349.
Ruggiero, P., Kaminsky, G.M., and Gelfenbaum, G., 2003, Linking proxy-based and datum-based shorelines on a high-energy coastline: Implications for shoreline change analyses: Journal of Coastal Research Special Issue 38, p. 57-82.
Open-File Report 2004-1043 42
Sallenger, A.H., Krabill, W., Swift, R., Brock, J., List, J., Hansen, M., Holman, R.A., Manizade, S., Sontag, J., Meredith, A., Morgan, K., Yunkel, J.K., Frederick, E. and Stockdon, H., 2003. Evaluation of airborne scanning lidar for coastal change applications: Journal of Coastal Research, v.19, p. 125-133.
Sanchez, T.A., and Douglass, S.L., 1994. Alabama shoreline change rates: 1970-1993: University of South Alabama College of Engineering Report 94-1.
Schwartz, M.L., 1971, The multiple causality of barrier islands: Journal of Geology, v. 79, p. 91-94.
Shalowitz, A.L., 1964, Shore and sea boundaries. Publica-tion 10-1, U.S. Department of Commerce, Washington, DC, 749p.
Simpson, R.H., and Lawrence, M.B., 1971, Atlantic hur-ricane frequencies along the U.S. coastline: National Oce-anic and Atmospheric Administration, NOAA Technical Memorandum NWS SR-581, 15p.
Smith, E., 1990, Regimes contributory to progressive loss of Alabama coastal shoreline and wetlands: Transactions Gulf Coast Association of Geological Societies, v. 40, p. 793-796.
Stauble, D.K., and Brumbaugh, R.W., 2003, An assessment of the nationʼs shorelines, USA: Shore and Beach, v. 71, p. 11-18.
Stockdon, H.F., Sallenger, A.H., List, J.H. and Holman, R.A., 2002, Estimation of shoreline position and change from airborne topographic lidar data. Journal of Coastal Research, v. 18, p. 502-513.
Swanson, R.L., and Thurlow, C.L., 1973, Recent subsidence rates along the Texas and Louisiana coasts as deter-mined from tide measurements: Journal of Geophysical Research, v. 78, 2665-2671.
Tanner, W.F., 1960, Florida coastal classification: Transac-tions Gulf Coast Association of Geological Societies, v. 10, p. 259-265.
Tanner, W.F., 1975, Historical beach changes, Floridaʼs Big Bend Coast: Transactions Gulf Coast Association of Geological Societies, v. 25, p. 379-381.
Thieler, E.R., and Danforth, W.W., 1994, Historical shore-line mapping (1). Improving techniques and reducing positioning errors: Journal of Coastal Research, v. 10, p. 549-563.
Trembanis, A.C., and Pilkey, O.H., 1998, Summary of beach nourishment along the U.S. Gulf of Mexico shoreline: Journal of Coastal Research, v. 14, p. 407-417.
U.S. Army Corps of Engineers, 1971, National shoreline study: Washington, D.C.
U.S. Army Corps of Engineers, 1983, Galveston County shore erosion study-feasibility report and environmental impact statement: Gulf shoreline study site report, v. 2, Galveston District Corps of Engineers, 44p.
U.S. Army Corps of Engineers, 1984, Beach erosion control project review study and environmental impact statement for Pinellas County, Florida: U. S. Army Engineer Jack-sonville District, various pagination.
Waller, T.H., and Malbrough, L.P., 1976, Temporal changes in the offshore islands of Mississippi: Mississippi State University Water Resources Institute, 109 p.
White, W.A., Morton, R.A., Kerr, R.S., Kuenzi, W.D., and Brogden, W.B., 1978, Land and water resources, histori-cal changes, and dune criticality, Mustang and North Padre Islands, Texas: The University of Texas at Austin, Bureau of Economic Geology Report of Investigations No. 92, 46p.