Embed Size (px)
Citation preview

U.S. Department of the InteriorU.S. Geological Survey
Open-File Report 2006-1219
National Assessment of Shoreline Change Part 3: Historical Shoreline Change and Associated Coastal Land Loss Along Sandy Shorelines of the California Coast
Cheryl J. Hapke, David Reid, Bruce M. Richmond, Peter Ruggiero and Jeff List
National Assessment of Shoreline Change Part 3: Historical Shoreline Change and Associated Coastal Land Loss Along Sandy Shorelines of the California Coast
Cheryl J. Hapke1, David Reid2, Bruce M. Richmond2, Peter Ruggiero3, and Jeff List4
Open File Report 2006-1219
Any use of trade, firm, or product names is for descriptive purposes only and does not imply endorsement by the U.S. Government.
Hapke, C.J., Reid, D., Richmond, B.M., Ruggiero, P., and List, J., 2006, National assessment of shoreline change: Part 3: Historical shoreline changes and associated coastal land loss along the sandy shorelines of the California coast: U.S. Geological Survey Open-file Report 2006-1219.
U.S. Department of the InteriorU.S. Geological Survey
1U.S. Geological Survey, Coastal Field Station, Department of Geosciences, University of Rhode Island, Kingston, RI 02881
2U.S. Geological Survey, Pacific Science Center, Santa Cruz, CA 950603Dept. of Geosciences, Oregon State University, Corvallis, OR 973314U.S. Geological Survey, Woods Hole Science Center, Woods Hole, MA 02543
Open-File Report 2006-1219 i
Contents
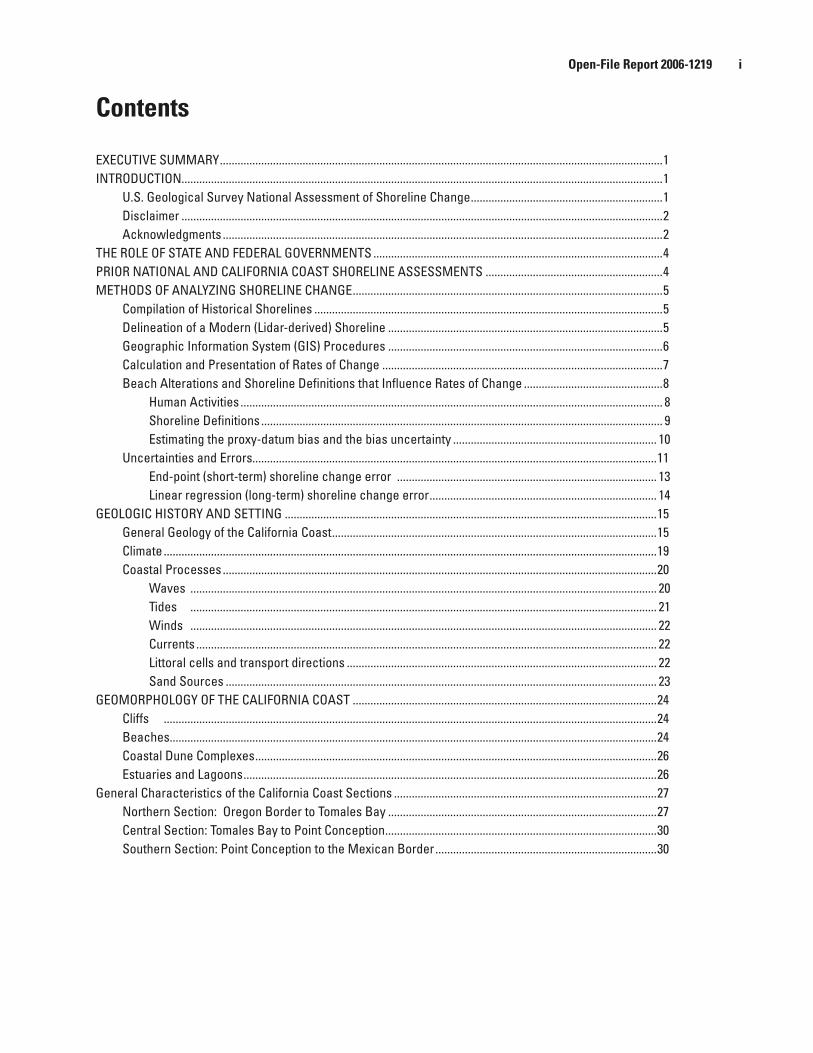
EXECUTIVE SUMMARY ......................................................................................................................................................1INTRODUCTION...................................................................................................................................................................1
U.S. Geological Survey National Assessment of Shoreline Change .................................................................1Disclaimer ...................................................................................................................................................................2Acknowledgments .....................................................................................................................................................2
THE ROLE OF STATE AND FEDERAL GOVERNMENTS ..................................................................................................4PRIOR NATIONAL AND CALIFORNIA COAST SHORELINE ASSESSMENTS ............................................................4METHODS OF ANALYZING SHORELINE CHANGE .........................................................................................................5
Compilation of Historical Shorelines ......................................................................................................................5Delineation of a Modern (Lidar-derived) Shoreline .............................................................................................5Geographic Information System (GIS) Procedures .............................................................................................6Calculation and Presentation of Rates of Change ...............................................................................................7Beach Alterations and Shoreline Definitions that Influence Rates of Change ...............................................8
Human Activities ............................................................................................................................................... 8Shoreline Definitions ........................................................................................................................................ 9Estimating the proxy-datum bias and the bias uncertainty ..................................................................... 10
Uncertainties and Errors.........................................................................................................................................11End-point (short-term) shoreline change error ........................................................................................ 13Linear regression (long-term) shoreline change error ............................................................................. 14
GEOLOGIC HISTORY AND SETTING ..............................................................................................................................15General Geology of the California Coast ..............................................................................................................15Climate .......................................................................................................................................................................19Coastal Processes ...................................................................................................................................................20
Waves .............................................................................................................................................................. 20Tides .............................................................................................................................................................. 21Winds .............................................................................................................................................................. 22Currents ............................................................................................................................................................ 22Littoral cells and transport directions ......................................................................................................... 22Sand Sources .................................................................................................................................................. 23
GEOMORPHOLOGY OF THE CALIFORNIA COAST .......................................................................................................24Cliffs .......................................................................................................................................................................24Beaches.....................................................................................................................................................................24Coastal Dune Complexes ........................................................................................................................................26Estuaries and Lagoons ............................................................................................................................................26
General Characteristics of the California Coast Sections .........................................................................................27Northern Section: Oregon Border to Tomales Bay ...........................................................................................27Central Section: Tomales Bay to Point Conception ............................................................................................30Southern Section: Point Conception to the Mexican Border ...........................................................................30

Open-File Report 2006-1219 ii
HISTORY OF INFRASTRUCTURE DEVELOPMENT .......................................................................................................30HISTORICAL SHORELINE CHANGE ANALYSIS ............................................................................................................33
Northern California ..................................................................................................................................................33Klamath Region ............................................................................................................................................... 33Eureka Region.................................................................................................................................................. 34Navarro Region ............................................................................................................................................... 36Russian River Region ..................................................................................................................................... 40
Central California .....................................................................................................................................................42San Francisco North Region ......................................................................................................................... 43San Francisco South Region ......................................................................................................................... 43Monterey Bay Region .................................................................................................................................... 47Big Sur Region ................................................................................................................................................. 50Morro Bay Region ........................................................................................................................................... 50Santa Barbara North ...................................................................................................................................... 54
Southern California ..................................................................................................................................................56Santa Barbara South Region ........................................................................................................................ 57Santa Monica Region ................................................................................................................................... 57San Pedro Region ........................................................................................................................................... 61Oceanside Region ........................................................................................................................................... 63San Diego Region ........................................................................................................................................... 65
DISCUSSION AND FURTHER CONSIDERATIONS........................................................................................................67Summary of Shoreline Changes ............................................................................................................................67Planned Updates and Related Research .............................................................................................................68Influence of Human Activities ...............................................................................................................................68
REFERENCES......................................................................................................................................................................68
Open-File Report 2006-1219 iii
Figures
Figure 1. Index map of California showing the fifteen regions discussed in the text. ................................................................3
Figure 2. Example of a lidar profile from April 10, 1998 at Santa Cruz, California ........................................................................7
Figure 3. Examples of common conditions where transects are eliminated in the absence of four shoreline intersections. ................................................................................................................................................9
Figure 4. Major tectonic elements and geomorphic provinces of California ............................................................................16
Figure 5. Index map showing locations of place names discussed in Geologic History and Geomorphology section. .....17
Figure 6. Simplified geologic map of California ...............................................................................................................................18
Figure 7. General wave directions for central California based on offshore wave buoy data ................................................20
Figure 8. Monthly mean sea level for selected tide gauges along the California coast ...........................................................21
Figure 9. Map showing major littoral cell boundaries, coastal watersheds, and conceptual net longshore drift directions for the California coast .............................................................................................................................23
Figure 10. Average annual sand and gravel discharge from major rivers in California. ............................................................25
Figure 11. Sketch of common coastal landforms of California. ......................................................................................................26
Figure 12. Beach profiles from Cowells Beach in Santa Cruz illustrating beach erosion over an El Niño winter and the subsequent recovery the following summer .....................................................................................................27
Figure 13. Map showing the major coastal dune complexes of California...................................................................................28
Figure 14A. Index map showing the four analysis regions in Northern California and various locations ..............................29
Figure 14B. Index map showing the six analysis regions in Central California and various locations ...................................31
Figure 14C. Index map showing the five analysis regions in Southern California and various locations ...............................32
Figure 15. Shoreline change rates for the Klamath region ..............................................................................................................35
Figure 17. Shoreline change rates for the Eureka region ................................................................................................................37
Figure 18. Spit and jetty on north side of Humboldt Bay Harbor in photograph taken in June 1987 ........................................38
Figure 19. Shoreline change rates for the Navarro region ..............................................................................................................39
Figure 20. Photographs from 1972 (top) and 2002 (bottom) show the widening of the spit beach at the Ten Mile River mouth ...........................................................................................................................................................40
Figure 21. Shoreline change rates for the Russian River region ....................................................................................................41
Figure 22. Many of the large rivers in Northern California have well-developed sandy spits such as this one extending across the mouth of the Russian River ..........................................................................................................42
Figure 23. Shoreline change rates for the San Francisco North region .......................................................................................44
Figure 24. Houses on the spit at Stinson Beach are partially buried by sand during an El Niño winter storm in 1983 .........45
Figure 25. Shoreline change rates for the San Francisco South region .......................................................................................46
Figure 26. A riprap revetment protects an apartment building that overlooks a narrow beach near Pillar Point Harbor in a photograph taken in February, 2002 ........................................................................................47
Figure 27. Shoreline change rates for the Monterey Bay region ...................................................................................................48
Figure 28. Aerial photographs of the Santa Cruz Yacht Harbor show the impoundment of sand against the constructed jetties ...............................................................................................................................................................49
Figure 29. Shoreline change rates for the Big Sur region ...............................................................................................................51
Figure 30. JP Burns waterfall shows the beach that formed as a result of the sediment added to the system from the 1983 landslide .......................................................................................................................................................52
Figures continued
Open-File Report 2006-1219 iv
Figure 31. Shoreline change rates for the Morro Bay region ........................................................................................................53
Figure 32. Development of a tombolo at Morro Rock after a causeway was built in the 1930s ..............................................54
Figure 33. Shoreline change rates for the Santa Barbara North region ......................................................................................55
Figure 34. Photographs from January 1989 shows the well-developed dune field at Guadalupe Dunes ..............................56
Figure 35. Shoreline change rates for the Santa Barbara South region ......................................................................................58
Figure 36. Dredging of spit at Santa Barbara Harbor ......................................................................................................................59
Figure 37. Shoreline change rates for the Santa Monica region ..................................................................................................60
Figure 38. Oblique aerial photograph of a breakwater along the highly engineered Santa Monica coastline. ....................61
Figure 39. Shoreline change rates for the San Pedro region .........................................................................................................62
Figure 40. Oblique aerial photograph of the Los Angeles Harbor .................................................................................................63
Figure 41. Shoreline change rates for the Oceanside region ........................................................................................................64
Figure 42. Narrow beach fronting tall coastal bluffs at Torrey Pines City Beach .......................................................................65
Figure 43. Shoreline change rates for the San Diego region .........................................................................................................66
Figure 44. Oblique aerial photograph of Zuniga Point and breakwater at the entrance to the San Diego Harbor ...............67

Open-File Report 2006-1219 v
Tables
Table 1. Providers and original sources of historical shorelines for each California region. ....................................................5
Table 2. Dates of compiled shorelines in different regions for selected periods. ........................................................................6
Table 3. List of tide gauge measurements used to calculate mean high water elevation. .........................................................8
Table 4. Absolute horizontal and vertical differences between high water and mean high water shorelines .....................10
Table 5. Maximum estimated measurement errors for California shorelines. ............................................................................11
Table 6A. Average shoreline change rates for Northern California ................................................................................................12
Table 6B. Average shoreline change rates for Central California ...................................................................................................12
Table 6C. Average shoreline change rates for Southern California ................................................................................................12
Table 7. Coastal cliff rock type along the California coast (from Runyan and Griggs, 2002). ...................................................19
Table 8. Estimated annual littoral drift rates and directions along the California Coast ...........................................................24
Table 9A. Maximum and minimum shoreline change rates: Northern California .........................................................................34
Table 9B. Maximum and minimum shoreline change rates: Central California ............................................................................45
Table 9C. Maximum and minimum shoreline change rates: Southern California .........................................................................59
EXECUTIVE SUMMARYBeach erosion is a chronic problem along many open-
ocean shores of the United States. As coastal populations con-tinue to grow and community infrastructures are threatened by erosion, there is increased demand for accurate informa-tion regarding past and present trends and rates of shore-line movement. There is also a need for a comprehensive analysis of shoreline movement that is consistent from one coastal region to another. To meet these national needs, the U.S. Geological Survey is conducting an analysis of histori-cal shoreline changes along open-ocean sandy shores of the conterminous United States and parts of Hawaii and Alaska. One purpose of this work is to develop standard repeatable methods for mapping and analyzing shoreline movement so that periodic updates regarding coastal erosion and land loss can be made nationally that are systematic and internally con-sistent. In the case of this study, the shoreline being measured is the boundary between the ocean water surface and the sandy beach.
This report on the California Coast represents the first of two reports on long-term sandy shoreline change for the western U.S., the second of which will include the coast of the Pacific NW, including Oregon and Washington. A report for the Gulf of Mexico shoreline was completed in 2004 and is available at: http://pubs.usgs.gov/of/2004/1043/. This report summarizes the methods of analysis, interprets the results, provides explanations regarding long-term and short-term trends and rates of change, and describes how different coastal communities are responding to coastal erosion. Shore-line change evaluations are based on comparing three histori-cal shorelines digitized from maps, with a recent shoreline derived from lidar (Light Detection and Ranging) topographic surveys. The historical shorelines generally represent the following periods: 1800s, 1920s-1930s, and 1950s-1970s, whereas the lidar shoreline is from 1998-2002. Long-term rates of change are calculated using all four shorelines (1800s to lidar shoreline), whereas short-term rates of change are calculated for only the most recent period (1950s-1970s to lidar shoreline). The rates of change presented in this report represent past conditions and therefore are not intended for predicting future shoreline positions or rates of change. Due to the geomorphology of the California Coast (rocky coastline instead of beach) as well as to data gaps in some areas, this report presents beach erosion rates for 45% of California’s 1100 km of coast.
The average rate of long-term shoreline change for the State of California was 0.2±0.1 m/yr, an accretional trend. This is based on shoreline change rates averaged from 14,562 individual transects, of which 40% were eroding. Of the transects on which the shoreline was eroding, the long-term erosion rates were generally lowest in Southern California
where coastal engineering projects have greatly altered the natural shoreline movement. On a regional scale, long-term accretion rates were either equal to (Central California) or greater than (Northern and Southern California) the long-term erosion rates, yielding the net accretional trend for the entire state. This accretional trend is most likely due to changes in the large volumes of sediment that are added to the system from large rivers and to the impact from coastal engineering and beach nourishment projects.
The average rate of short-term shoreline change for the state was erosional. The net short-term rate as averaged along 16,142 transects was -0.2±0.4 m/yr. Of the transects used to measure short-term change, 66% had erosional trends. In addition erosion rates were higher in the short-term period, possibly related to the localized artificial nourishment that occurred over much of the 20th century but that has recently slowed or stopped (Flick, 1993; Wiegel, 1994). Short-term accretion rates were highest in Northern California where the overall magnitudes of shoreline change are systematically higher than in Central and Southern California. The most stable (low erosion and accretion rates) California beaches were most commonly found in Central California.
Seawalls and/or riprap revetments have been constructed in all three sections of California, although many of these structures were built to protect houses and infrastructures from the erosion of coastal cliffs and bluffs rather than to protect against long-term beach erosion. California permits shoreline stabilization structures where homes, buildings or other community infrastructure are imminently threatened by erosion.
A second California report that is following this publica-tion will include analyses and reports on long-term coastal cliff erosion, as this hazard is of equal or greater concern to coastal communities in many areas along the California Coast.
INTRODUCTION
U.S. Geological Survey National Assessment of Shoreline Change
Sandy ocean beaches represent some of the most popular tourist and recreational destinations in the United States, and also constitute some of the most valuable real estate in the country. These changing and ephemeral interfaces between water and land are the sites of intense residential and commercial development even though they are frequently subjected to a range of natural hazards that can include flood-ing, storm impacts, coastal erosion and tsunami inundation. Because population and economic trends have made the coasts so valuable, the U.S. Geological Survey (USGS) is conducting a National Assessment of Coastal Change Haz-
Open-File Report 2006-1219 1
ards. One component of this effort, the National Assessment of Shoreline Change, documents changes in shoreline posi-tion as a proxy for coastal change. Shoreline position is one of the most commonly monitored indicators of environmen-tal change (Morton, 1996), and it is easily understood by those who are interested in historical movement of beaches.
A principal purpose of the USGS shoreline change research is to develop a repeatable surveying methodology so that shorelines for the continental U.S., and portions of Hawaii and Alaska, can be periodically and systematically updated in an internally consistent manner. In addition, new methods for developing datum-based shorelines and assess-ing coastal change can provide the opportunity to achieve more comprehensive assessments of error in the future. The primary objectives of this effort are: (1) to develop and implement improved methods of assessing and monitoring shoreline movement, (2) to obtain a better understanding of the processes controlling shoreline movement, and (3) to enter into partnerships to facilitate data dissemination.
Achieving these ongoing objectives requires research that (1) examines the original sources of shoreline data (maps, air photos, global positioning system (GPS), lidar), (2) evaluates the utility of different shoreline proxies (geomorphic feature, water mark, tidal datum, elevation contour) including the errors associated with each method, (3) investigates the bias and potential errors associated with integrating different shoreline proxies from different sources, (4) develops standard uniform methods of shoreline change analysis, (5) determines the effects of human activi-ties on shoreline movement and rates of change, and (6) investigates alternative mathematical methods for calculat-ing historical rates of change and forecasting future rates of change.
This report summarizes historical changes in the California sandy shoreline, both accretion and erosion, but emphasizes the erosion hazard because of its impacts on natural resources and the economy. The descriptions of coastal land loss for each region (Figure 1) within the state provide a more comprehensive view of coastal processes and key references that can be used to learn more about coastal change in a regional context.
Disclaimer
Results of the National Assessment of Shoreline Change are organized by coastal regions. This report for California is part of a series of reports that will include text summarizing methods, results, and implications of the results in addition to maps, via Internet Map Server (IMS), illustrating rates of shoreline change. Rates of shoreline change are being published for the purpose of regional characterization. The shoreline change results and products prepared by the USGS are not intended for comprehensive detailed site specific analysis of shoreline movement, nor are they intended to replace any official sources of shoreline change information identified by local or state government
agencies, or other federal entities that are used for regulatory purposes. Rates of shoreline change presented herein may differ from other published rates, and differences do not necessarily indicate that the other rates are inaccurate. Some discrepancies are expected, considering the many possible ways of determining shoreline positions and rates of change, and the inherent uncertainty in calculating these rates. Rates of shoreline change presented in this report represent shore-line movement under past conditions. The results are not intended for predicting future shoreline positions or future rates of shoreline change.
This publication was prepared by an agency of the United States Government. Neither the United States Gov-ernment nor any agency thereof, nor any of their employ-ees, makes any warranty, expressed or implied, or assumes any legal responsibility for the accuracy, completeness, or usefulness of any information apparatus, product, or process disclosed in the report, or represents that its use would not infringe privately owned rights. Reference to any specific commercial product, process, or service by trade name, trademark, manufacturer, or otherwise does not necessarily constitute or imply its endorsement, recommendation, or favoring by the United States Government or any agency thereof. Any views and opinions of authors expressed herein do not necessarily state or reflect those of the United States Government or any agency thereof.
Acknowledgments
This report was made possible by the hard work and generous cooperation of many individuals. We owe a debt of gratitude to Mike Rink (NOAA) and Paul Frascione (Information Manufacturing Corporation) for providing digital historical shorelines and scans of selected T-sheets, and David Doyle (NOAA) for providing datum corrections so that T-sheets could be rectified before they were digitized by the USGS. An enthusiastic and untiring USGS team was responsible for developing the methods and computer codes for calculating operational mean high water elevations and extracting the lidar shorelines. The lidar research and development team included Abby Sallenger, Jeff List, Karen Morgan, Eric Nelson, Hillary Stockdon, and Kathy Webber. Tara Miller and Kathy Webber provided invaluable help in data processing and analysis. Rob Thieler worked closely with TPMC Environmental Services to develop and improve the Digital Shoreline Analysis System (DSAS) code for shoreline change measurement. Brian Spear (UCSC) and Evan Lindenbach (UCSC) provided assistance by digitizing shorelines and cliff edges, georectifiying maps and prepar-ing metadata. Bruce Rogers provided valuable assistance in the drafting of figures, and Ben Melosh (UCSC) helped with background data compilation. Ann Gibbs provided excellent advice and input regarding data presentation. Comments from and discussions with Ed Thornton, Bob Guza, Dick Seymour, Bob Wiegel, Mark Crowell, Lesley Ewing, Bob Morton and Sam Johnson were also very helpful. Finally, a
Open-File Report 2006-1219 2
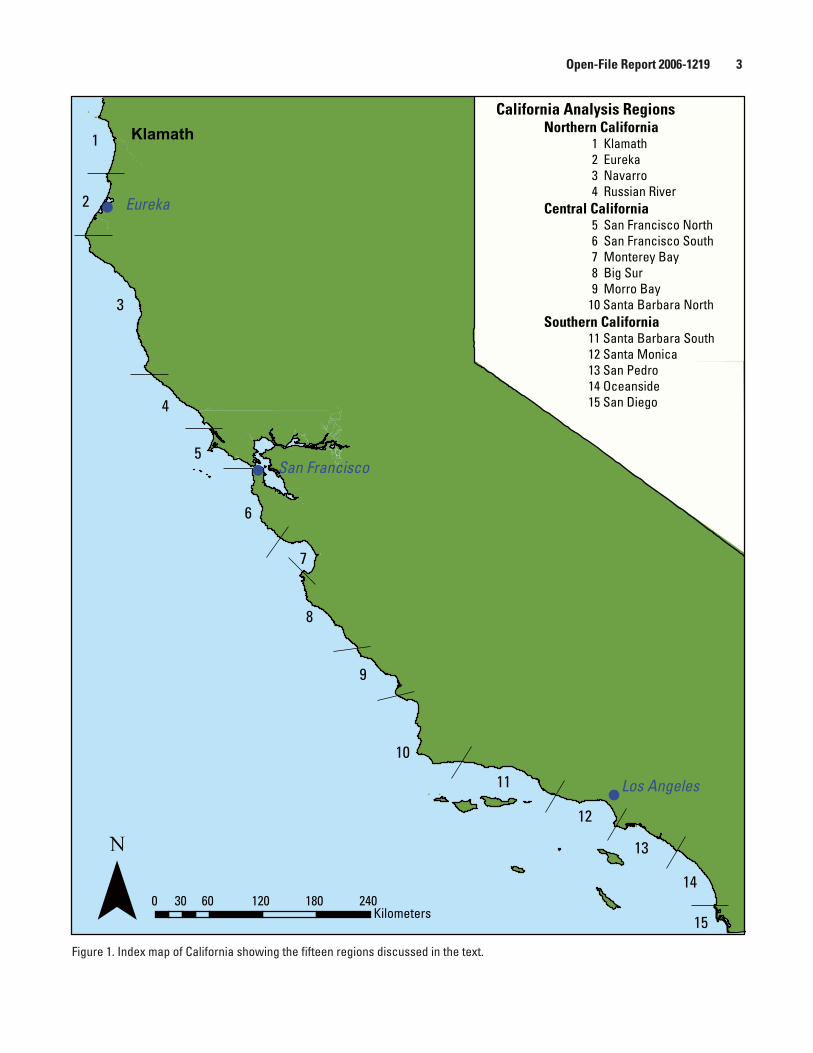
Figure 1. Index map of California showing the fifteen regions discussed in the text.
California Analysis RegionsNorthern California
1 Klamath 2 Eureka 3 Navarro 4 Russian River
Central California 5 San Francisco North 6 San Francisco South 7 Monterey Bay 8 Big Sur 9 Morro Bay 10 Santa Barbara North
Southern California 11 Santa Barbara South 12 Santa Monica 13 San Pedro 14 Oceanside 15 San Diego
Klamath1
2
3
4
5
6
7
8
9
10
11
12
13
14
150 60 120 180 24030
Kilometers
San Francisco
Los Angeles
Eureka
Open-File Report 2006-1219 3
detailed review by Gary Griggs was invaluable and greatly improved the report.
THE ROLE OF STATE AND FEDERAL GOVERNMENTS
One reason for conducting this National Assessment of Shoreline Change is that there is no widely accepted standardized method of analyzing shoreline changes. Each state or region has its own data needs and coastal zone man-agement responsibilities (e.g. construction set-back lines), and therefore different techniques and standards are used to compile shorelines and to calculate rates of shoreline move-ment. Consequently, existing calculated rates of shoreline change and projected shoreline positions are inconsistent from state to state and even within states, such as in Califor-nia, and cannot be compared directly. These inconsisten-cies were clearly demonstrated by the Federal Emergency Management Agency (FEMA) sponsored erosion studies (Crowell and Leatherman, 1999) that were used as the basis for evaluating erosion hazards (The Heinz Center, 2000). Within California, the FEMA sponsored erosion studies only addressed coastal cliff erosion, not sandy shoreline ero-sion. The USGS National Assessment of Shoreline Change represents the first time that shorelines from original data sources have been compiled and rates of shoreline change have been calculated on a national scale using internally consistent methods. The results of this analysis allow direct comparison of rates of change from one coastal segment to another and form the basis for future comparison of shore-line position.
Several federal agencies (USGS, FEMA, NOAA, U.S. Army Corps of Engineers (USACE) have regulatory or administrative responsibilities pertaining to shorelines. Yet these responsibilities are quite different, requiring differ-ent approaches and offering substantial opportunities for cooperation. For example, the USACE is authorized and funded by Congress to report on the economic and envi-ronmental implications of shoreline change and the costs of erosion mitigation. Their National Shoreline Management Study (Stauble and Brumbaugh, 2003) is being conducted using existing shoreline data. The USGS will share data and information, such as the lidar-derived shoreline and rates of change, in support of their effort. NOAA has the mandate to establish the official shoreline boundary for the nation using tidal datums. Their emphasis is on safe navigation and using the shoreline to generate nautical charts. NOAA also has a developing program (V datum), which will greatly assist other agencies in establishing alternative shorelines for a variety of purposes where the official shoreline is inappropriate. FEMA is authorized and partially funded by Congress to map coastal (and riverine) flood hazard areas. These maps and associated information are used for flood risk assessment, floodplain management, and setting insur-ance rates through the National Flood Insurance Program
(NFIP). Because of perceived deficiencies in the way the NFIP considers coastal erosion, Congress authorized FEMA to report on the economic impact of erosion hazards on coastal communities, and on the NFIP. To accomplish this, FEMA contracted state agencies and academic researchers to conduct a pilot study of erosion hazards that included shoreline change data for limited geographic areas. The USGS is responsible for conducting research pertain-ing to coastal change hazards including shoreline change, understanding the processes that cause coastal change, and developing models to predict future change. The USGS is the only government agency that has a dedicated program to monitor coastal change into the future using consistent methods nationwide. Such a program is critically important to assess national issues, such as the coastal impacts of sea level rise.
PRIOR NATIONAL AND CALIFORNIA COAST SHORELINE ASSESSMENTS
There are very few studies of regional sandy shoreline erosion for California. The USACE (1971) conducted the first national assessment of coastal erosion that included California. That study identified areas of critical and non-critical erosion on the basis of economic development and potential for property loss, but rates of shoreline movement were not quantified. Numerous analyses have been con-ducted for specific sites by private consultants or contrac-tors, or cities and counties where erosion rates have been required for regulatory or management purposes. Some of these analyses were incorporated into Dolan and others (1985), and Griggs and Savoy (1985), where rates of change were presented on maps, and the long-term trends of erosion and accretion were summarized in an accompanying text. The Griggs and Savoy (1985) compilation has recently been updated (Griggs and others, 2005a), although most of the erosion hazards addressed therein pertain to coastal cliff and bluff erosion, with the exception of Southern California.
Since these earlier works, methods of obtaining, analyzing, displaying, and storing shoreline data have improved substantially, and coastal change has continued. Furthermore, coastal scientists have not agreed on standard methods for analyzing and reporting shoreline changes, nor have they identified rigorous mathematical tests that are widely accepted for quantifying the change and associ-ated errors. Consequently, there are critical needs for (1) a nationwide compilation of reliable shoreline data including the most recent shoreline position, and (2) a standardization of methods for obtaining and comparing shoreline positions and mathematically analyzing the trends.
Open-File Report 2006-1219 �

METHODS OF ANALYZING SHORELINE CHANGE
Compilation of Historical Shorelines
Coastal scientists in U.S. universities and government agencies have been quantifying rates of shoreline movement and studying coastal change for decades. Before GPS and lidar technologies were developed, the most commonly used sources of historical shoreline position were NOAA Topo-graphic Sheets (T-sheets, see Shalowitz, 1964) and aerial photographs. Ideally, extraction of shoreline position from these data sources involves geo-referencing and removing distortions from maps or aerial photographs, followed by digitizing shoreline position. Depending on coastal loca-tion, data source, and scientific preference, different proxies for shoreline position are used to document coastal change, including the high water line (for discussion of the high water line (HWL) see Shalowitz, 1964), wet-dry line, veg-etation line, dune toe or crest, toe or berm of the beach, cliff base or top, and the line of mean high water (MHW).
The USGS National Assessment of Shoreline Change analysis for California incorporates shoreline positions from 4 time periods and three unique data sources. To main-tain consistency at a national scale, these four periods are mid- to late1800s, 1920s-1930s, 1950s-1970s, and post-1997. Several organizations have provided the USGS with digital maps and/or shoreline data (Table 1). The historical shorelines from the 1850-1890s and 1920s-1930s were digi-tized from scanned and georeferenced historical T-sheets. In addition, shorelines were digitized from USGS Digital Raster Graphic (DRG) maps where data gaps in the T-sheets existed, as these were the only source of shoreline data that could be located for the data gap areas. These occurred for the third period (1950s-1970s) for most of Central and Northern California. The modern (post-1997) shoreline represents a MHW elevation derived from lidar data.
Shorelines were compiled for the state following the guidelines established for selected periods (mid- to late 1800s, 1920s-1930s, 1950s-1970s, and post-1997) as closely as possible. Table 2 lists the final range of years (and months where known) for shorelines compiled for each period by region.
Delineation of a Modern (Lidar-derived) Shoreline
The most recent shoreline used in this National Assess-ment (post-1997) was derived from lidar (Light Detec-tion and Ranging) data. The USGS, in collaboration with NASA, has been using the NASA Airborne Topographic Mapper (ATM) to map coastal areas since 1997 (Krabill and others, 2000; Sallenger and others, 2003). The ATM surveys ground elevation using an elliptically rotating blue-green laser. GPS (global positioning system) positions and inertial navigation systems are used to correct for aircraft pitch, roll, and heading, providing ground elevations with accuracies of about ±15 cm (Sallenger and others, 2003). The lidar surveys used to extract shorelines for this report were conducted either in 1998 or 2002 (Table 2).
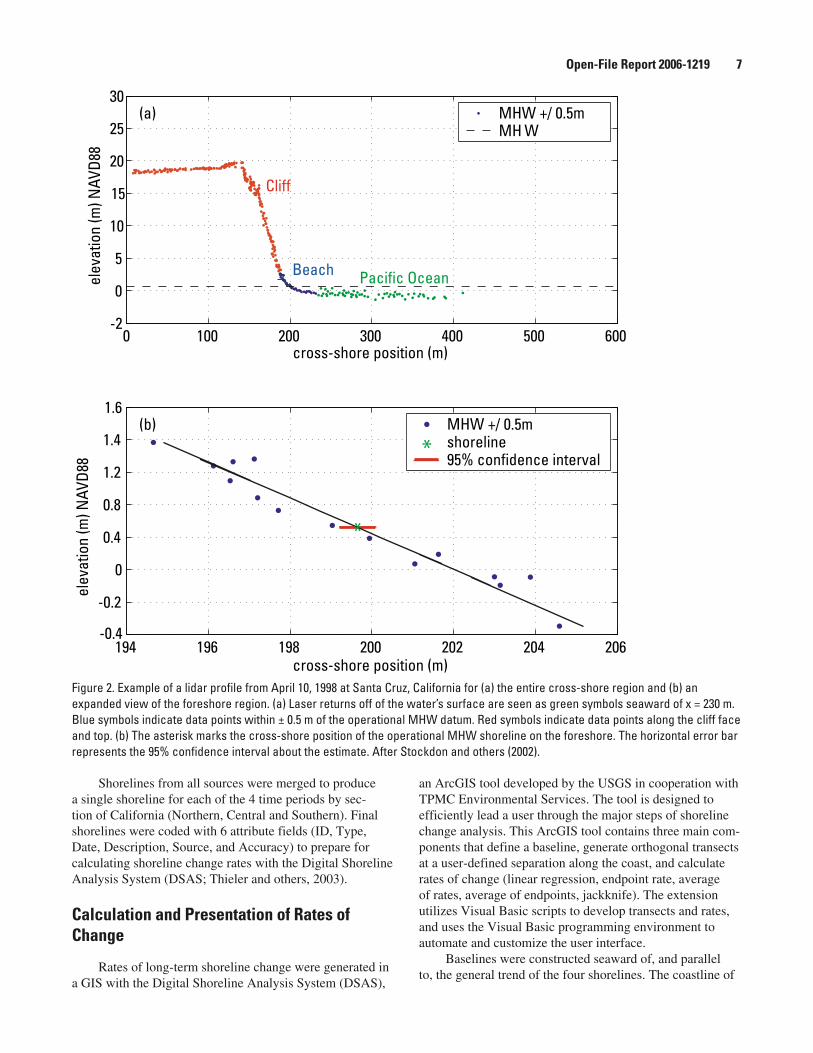
To compare with historical shorelines, an operational MHW shoreline was extracted from the lidar surveys using a method developed by Stockdon and others (2002) (Fig-ure 2). Shorelines were extracted from cross-shore pro-files which consist of bands of lidar data 10 m wide in the alongshore direction and spaced every 20 m along the coast. A least-squares linear regression line is passed through the 2-D cluster of data that encompasses the operational MHW datum (Table 3) and is limited to the seaward-sloping foreshore. The regression equation is then used to derive the horizontal intersection of the operational MHW datum with the profile, giving the shoreline position for that profile. Repeating this procedure at successive profiles 20 m apart generates points that can be connected to create a continu-ous shoreline.
Table 1. Providers and original sources of historical shorelines for each California region.
Section Organization Original Data Source Spatial Coverage
Northern
California
NOAA Coastal Services Center NOAA T-sheets
Oregon Border to Tomales PointU.S. Geological Survey DRGs
NOAA Vectorization Project NOAA T-sheets
Central California
NOAA Coastal Services Center Scanned NOAA T-sheets Tomales Point to El Capitan BeachNOAA Vectorization Project NOAA T-sheetsU.S. Geological Survey DRGs Tomales Point to Point Estero
Southern California
NOAA Coastal Services Center Scanned NOAA T-sheets
El Capitan Beach to Mexico Border
NOAA Vectorization Project NOAA T-sheets
Open-File Report 2006-1219 �
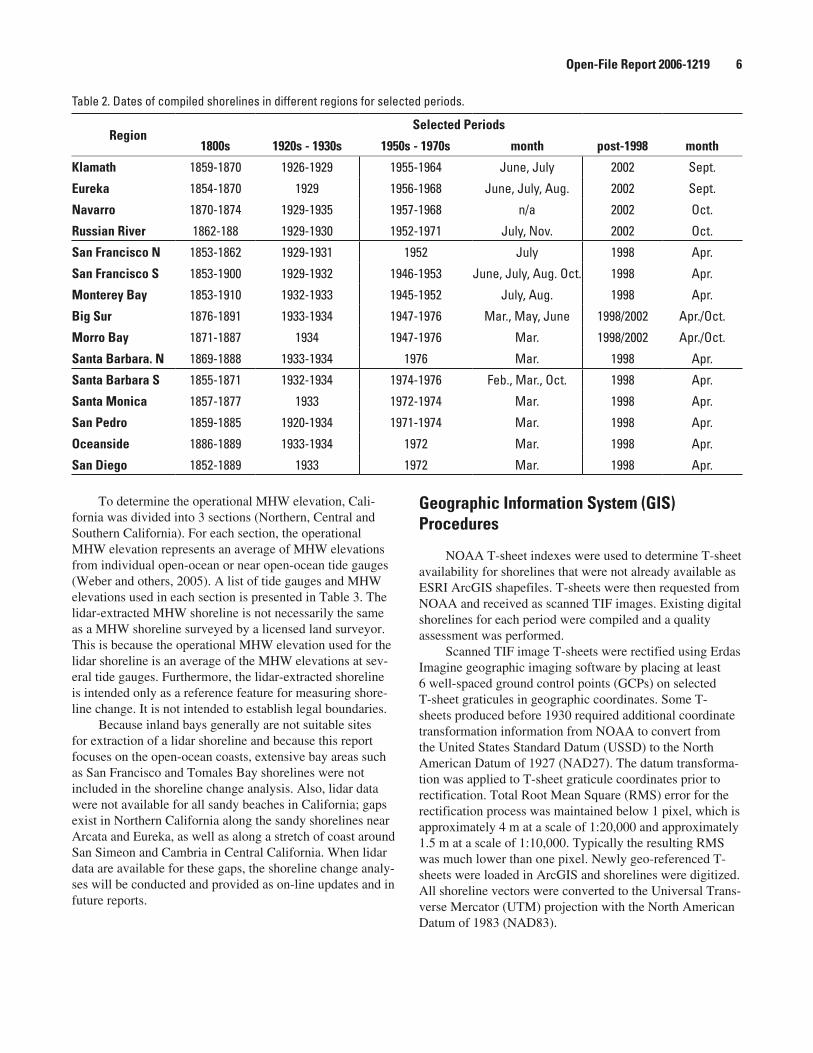
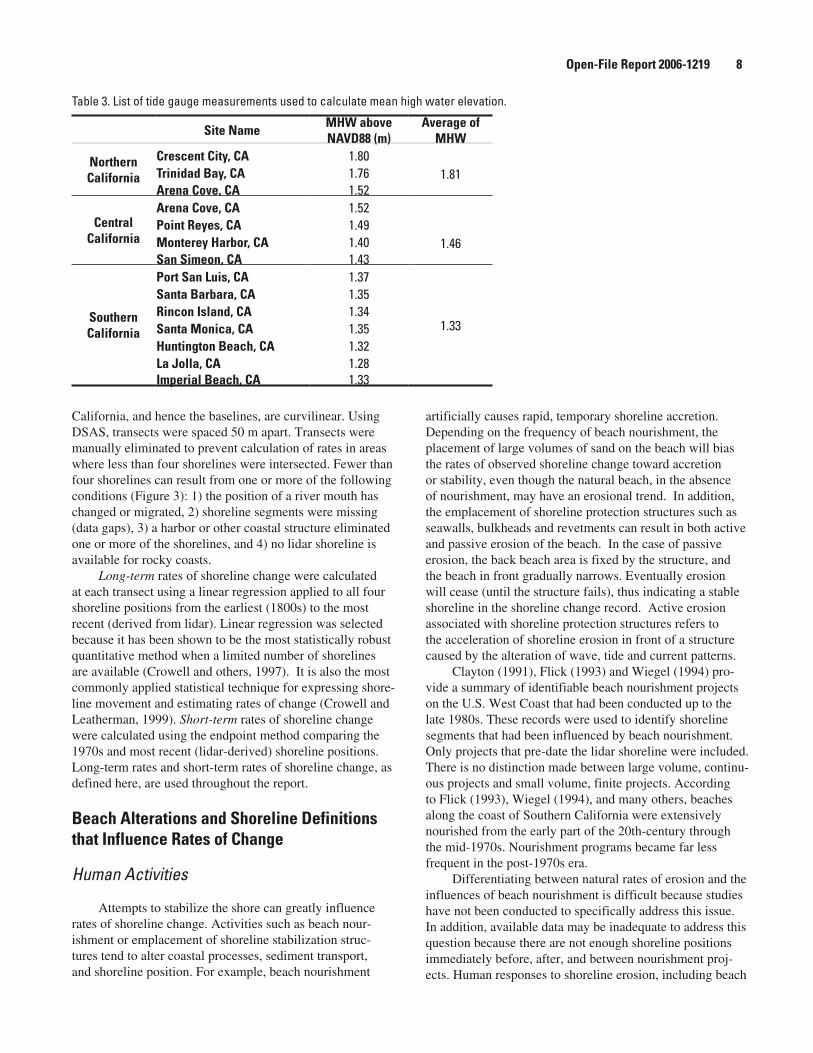
To determine the operational MHW elevation, Cali-fornia was divided into 3 sections (Northern, Central and Southern California). For each section, the operational MHW elevation represents an average of MHW elevations from individual open-ocean or near open-ocean tide gauges (Weber and others, 2005). A list of tide gauges and MHW elevations used in each section is presented in Table 3. The lidar-extracted MHW shoreline is not necessarily the same as a MHW shoreline surveyed by a licensed land surveyor. This is because the operational MHW elevation used for the lidar shoreline is an average of the MHW elevations at sev-eral tide gauges. Furthermore, the lidar-extracted shoreline is intended only as a reference feature for measuring shore-line change. It is not intended to establish legal boundaries.
Because inland bays generally are not suitable sites for extraction of a lidar shoreline and because this report focuses on the open-ocean coasts, extensive bay areas such as San Francisco and Tomales Bay shorelines were not included in the shoreline change analysis. Also, lidar data were not available for all sandy beaches in California; gaps exist in Northern California along the sandy shorelines near Arcata and Eureka, as well as along a stretch of coast around San Simeon and Cambria in Central California. When lidar data are available for these gaps, the shoreline change analy-ses will be conducted and provided as on-line updates and in future reports.
Geographic Information System (GIS) Procedures
NOAA T-sheet indexes were used to determine T-sheet availability for shorelines that were not already available as ESRI ArcGIS shapefiles. T-sheets were then requested from NOAA and received as scanned TIF images. Existing digital shorelines for each period were compiled and a quality assessment was performed.
Scanned TIF image T-sheets were rectified using Erdas Imagine geographic imaging software by placing at least 6 well-spaced ground control points (GCPs) on selected T-sheet graticules in geographic coordinates. Some T-sheets produced before 1930 required additional coordinate transformation information from NOAA to convert from the United States Standard Datum (USSD) to the North American Datum of 1927 (NAD27). The datum transforma-tion was applied to T-sheet graticule coordinates prior to rectification. Total Root Mean Square (RMS) error for the rectification process was maintained below 1 pixel, which is approximately 4 m at a scale of 1:20,000 and approximately 1.5 m at a scale of 1:10,000. Typically the resulting RMS was much lower than one pixel. Newly geo-referenced T-sheets were loaded in ArcGIS and shorelines were digitized. All shoreline vectors were converted to the Universal Trans-verse Mercator (UTM) projection with the North American Datum of 1983 (NAD83).
Table 2. Dates of compiled shorelines in different regions for selected periods.
RegionSelected Periods
1800s 1920s - 1930s 19�0s - 1970s month post-1998 month
Klamath 1859-1870 1926-1929 1955-1964 June, July 2002 Sept.
Eureka 1854-1870 1929 1956-1968 June, July, Aug. 2002 Sept.
Navarro 1870-1874 1929-1935 1957-1968 n/a 2002 Oct.
Russian River 1862-188 1929-1930 1952-1971 July, Nov. 2002 Oct.
San Francisco N 1853-1862 1929-1931 1952 July 1998 Apr.
San Francisco S 1853-1900 1929-1932 1946-1953 June, July, Aug. Oct. 1998 Apr.
Monterey Bay 1853-1910 1932-1933 1945-1952 July, Aug. 1998 Apr.
Big Sur 1876-1891 1933-1934 1947-1976 Mar., May, June 1998/2002 Apr./Oct.
Morro Bay 1871-1887 1934 1947-1976 Mar. 1998/2002 Apr./Oct.
Santa Barbara. N 1869-1888 1933-1934 1976 Mar. 1998 Apr.
Santa Barbara S 1855-1871 1932-1934 1974-1976 Feb., Mar., Oct. 1998 Apr.
Santa Monica 1857-1877 1933 1972-1974 Mar. 1998 Apr.
San Pedro 1859-1885 1920-1934 1971-1974 Mar. 1998 Apr.
Oceanside 1886-1889 1933-1934 1972 Mar. 1998 Apr.
San Diego 1852-1889 1933 1972 Mar. 1998 Apr.
Open-File Report 2006-1219 6
Shorelines from all sources were merged to produce a single shoreline for each of the 4 time periods by sec-tion of California (Northern, Central and Southern). Final shorelines were coded with 6 attribute fields (ID, Type, Date, Description, Source, and Accuracy) to prepare for calculating shoreline change rates with the Digital Shoreline Analysis System (DSAS; Thieler and others, 2003).
Calculation and Presentation of Rates of Change
Rates of long-term shoreline change were generated in a GIS with the Digital Shoreline Analysis System (DSAS),
an ArcGIS tool developed by the USGS in cooperation with TPMC Environmental Services. The tool is designed to efficiently lead a user through the major steps of shoreline change analysis. This ArcGIS tool contains three main com-ponents that define a baseline, generate orthogonal transects at a user-defined separation along the coast, and calculate rates of change (linear regression, endpoint rate, average of rates, average of endpoints, jackknife). The extension utilizes Visual Basic scripts to develop transects and rates, and uses the Visual Basic programming environment to automate and customize the user interface.
Baselines were constructed seaward of, and parallel to, the general trend of the four shorelines. The coastline of
Figure 2. Example of a lidar profile from April 10, 1998 at Santa Cruz, California for (a) the entire cross-shore region and (b) an expanded view of the foreshore region. (a) Laser returns off of the water’s surface are seen as green symbols seaward of x = 230 m. Blue symbols indicate data points within ± 0.5 m of the operational MHW datum. Red symbols indicate data points along the cliff face and top. (b) The asterisk marks the cross-shore position of the operational MHW shoreline on the foreshore. The horizontal error bar represents the 95% confidence interval about the estimate. After Stockdon and others (2002).
0 100 200 300 400 500 600-2
0
5
10
15
20
25
30
cross-shore position (m)
elev
atio
n (m
) NAV
D88
(a) MHW +/ 0.5mMH W
194 196 198 200 202 204 206-0.4
-0.2
0
0.4
0.8
1.2
1.4
1.6
cross-shore position (m)
elev
atio
n (m
) NAV
D88
(b) MHW +/ 0.5mshoreline95% confidence interval*
*
Cliff
Pacific OceanBeach
Open-File Report 2006-1219 7
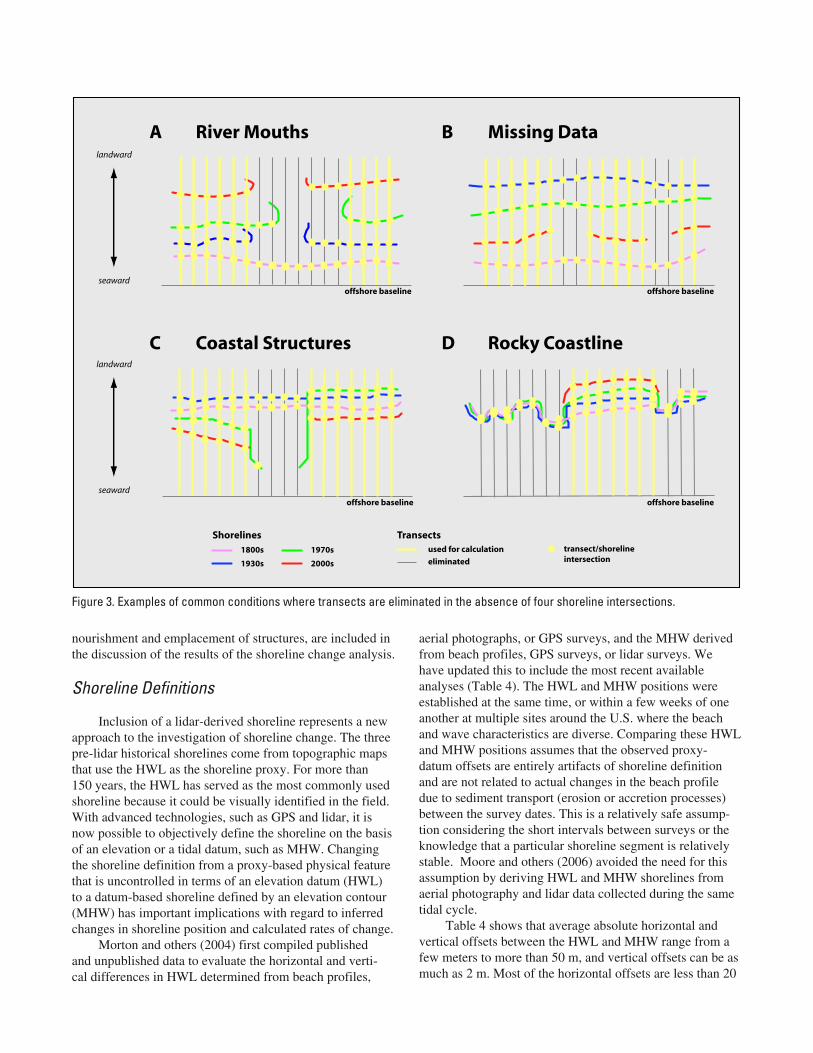
California, and hence the baselines, are curvilinear. Using DSAS, transects were spaced 50 m apart. Transects were manually eliminated to prevent calculation of rates in areas where less than four shorelines were intersected. Fewer than four shorelines can result from one or more of the following conditions (Figure 3): 1) the position of a river mouth has changed or migrated, 2) shoreline segments were missing (data gaps), 3) a harbor or other coastal structure eliminated one or more of the shorelines, and 4) no lidar shoreline is available for rocky coasts.
Long-term rates of shoreline change were calculated at each transect using a linear regression applied to all four shoreline positions from the earliest (1800s) to the most recent (derived from lidar). Linear regression was selected because it has been shown to be the most statistically robust quantitative method when a limited number of shorelines are available (Crowell and others, 1997). It is also the most commonly applied statistical technique for expressing shore-line movement and estimating rates of change (Crowell and Leatherman, 1999). Short-term rates of shoreline change were calculated using the endpoint method comparing the 1970s and most recent (lidar-derived) shoreline positions. Long-term rates and short-term rates of shoreline change, as defined here, are used throughout the report.
Beach Alterations and Shoreline Definitions that Influence Rates of Change
Human Activities
Attempts to stabilize the shore can greatly influence rates of shoreline change. Activities such as beach nour-ishment or emplacement of shoreline stabilization struc-tures tend to alter coastal processes, sediment transport, and shoreline position. For example, beach nourishment
artificially causes rapid, temporary shoreline accretion. Depending on the frequency of beach nourishment, the placement of large volumes of sand on the beach will bias the rates of observed shoreline change toward accretion or stability, even though the natural beach, in the absence of nourishment, may have an erosional trend. In addition, the emplacement of shoreline protection structures such as seawalls, bulkheads and revetments can result in both active and passive erosion of the beach. In the case of passive erosion, the back beach area is fixed by the structure, and the beach in front gradually narrows. Eventually erosion will cease (until the structure fails), thus indicating a stable shoreline in the shoreline change record. Active erosion associated with shoreline protection structures refers to the acceleration of shoreline erosion in front of a structure caused by the alteration of wave, tide and current patterns.
Clayton (1991), Flick (1993) and Wiegel (1994) pro-vide a summary of identifiable beach nourishment projects on the U.S. West Coast that had been conducted up to the late 1980s. These records were used to identify shoreline segments that had been influenced by beach nourishment. Only projects that pre-date the lidar shoreline were included. There is no distinction made between large volume, continu-ous projects and small volume, finite projects. According to Flick (1993), Wiegel (1994), and many others, beaches along the coast of Southern California were extensively nourished from the early part of the 20th-century through the mid-1970s. Nourishment programs became far less frequent in the post-1970s era.
Differentiating between natural rates of erosion and the influences of beach nourishment is difficult because studies have not been conducted to specifically address this issue. In addition, available data may be inadequate to address this question because there are not enough shoreline positions immediately before, after, and between nourishment proj-ects. Human responses to shoreline erosion, including beach
Table 3. List of tide gauge measurements used to calculate mean high water elevation.
Site Name MHW above NAVD88 (m)
Average of MHW
Northern California
Crescent City, CA 1.80 1.81
Trinidad Bay, CA 1.76Arena Cove, CA 1.52
Central California
Arena Cove, CA 1.52
1.46
Point Reyes, CA 1.49Monterey Harbor, CA 1.40San Simeon, CA 1.43
Southern California
Port San Luis, CA 1.37
1.33
Santa Barbara, CA 1.35Rincon Island, CA 1.34Santa Monica, CA 1.35Huntington Beach, CA 1.32La Jolla, CA 1.28Imperial Beach, CA 1.33
Open-File Report 2006-1219 8
nourishment and emplacement of structures, are included in the discussion of the results of the shoreline change analysis.
Shoreline Definitions
Inclusion of a lidar-derived shoreline represents a new approach to the investigation of shoreline change. The three pre-lidar historical shorelines come from topographic maps that use the HWL as the shoreline proxy. For more than 150 years, the HWL has served as the most commonly used shoreline because it could be visually identified in the field. With advanced technologies, such as GPS and lidar, it is now possible to objectively define the shoreline on the basis of an elevation or a tidal datum, such as MHW. Changing the shoreline definition from a proxy-based physical feature that is uncontrolled in terms of an elevation datum (HWL) to a datum-based shoreline defined by an elevation contour (MHW) has important implications with regard to inferred changes in shoreline position and calculated rates of change.
Morton and others (2004) first compiled published and unpublished data to evaluate the horizontal and verti-cal differences in HWL determined from beach profiles,
aerial photographs, or GPS surveys, and the MHW derived from beach profiles, GPS surveys, or lidar surveys. We have updated this to include the most recent available analyses (Table 4). The HWL and MHW positions were established at the same time, or within a few weeks of one another at multiple sites around the U.S. where the beach and wave characteristics are diverse. Comparing these HWL and MHW positions assumes that the observed proxy-datum offsets are entirely artifacts of shoreline definition and are not related to actual changes in the beach profile due to sediment transport (erosion or accretion processes) between the survey dates. This is a relatively safe assump-tion considering the short intervals between surveys or the knowledge that a particular shoreline segment is relatively stable. Moore and others (2006) avoided the need for this assumption by deriving HWL and MHW shorelines from aerial photography and lidar data collected during the same tidal cycle.
Table 4 shows that average absolute horizontal and vertical offsets between the HWL and MHW range from a few meters to more than 50 m, and vertical offsets can be as much as 2 m. Most of the horizontal offsets are less than 20
landward
seaward
landward
seaward
A River Mouths B Missing Data
C Coastal Structures D Rocky Coastline
offshore baseline offshore baseline
offshore baseline offshore baseline
Shorelines Transects
eliminated
used for calculation1800s
2000s
1970s
1930s
transect/shorelineintersection
Figure 3. Examples of common conditions where transects are eliminated in the absence of four shoreline intersections.
m, and most of the vertical offsets are less than 1 m. Offsets are typically greatest on relatively flat beaches where high waves produce high wave runup (i.e. southwest Washing-ton). Conversely, offsets are least where beaches are rela-tively steep and wave runup is low. For the data analyzed by Morton and others (2004), the MHW was seaward of the HWL on virtually all of the transects (Table 4). This nearly systematic horizontal offset between the HWL and the MHW causes shoreline positions and calculated rates of change to imply slower erosion, a change from erosion to accretion, or faster accretion than actual shoreline move-ment can account for.
The recent study by Moore and others (2006) illus-trated that overall, the importance of incorporating a proxy-datum offset into shoreline change analysis depends on several factors including the magnitude of the offset, the length of time over which rates are being measured and the statistical significance of the shoreline change rates. This proxy-datum offset is particularly important when averaging shoreline change rates alongshore. Since the proxy-datum offset is a bias, virtually always acting in the same direction, the error associated with the apparent shoreline change rate shift does not cancel during averaging and it is important to
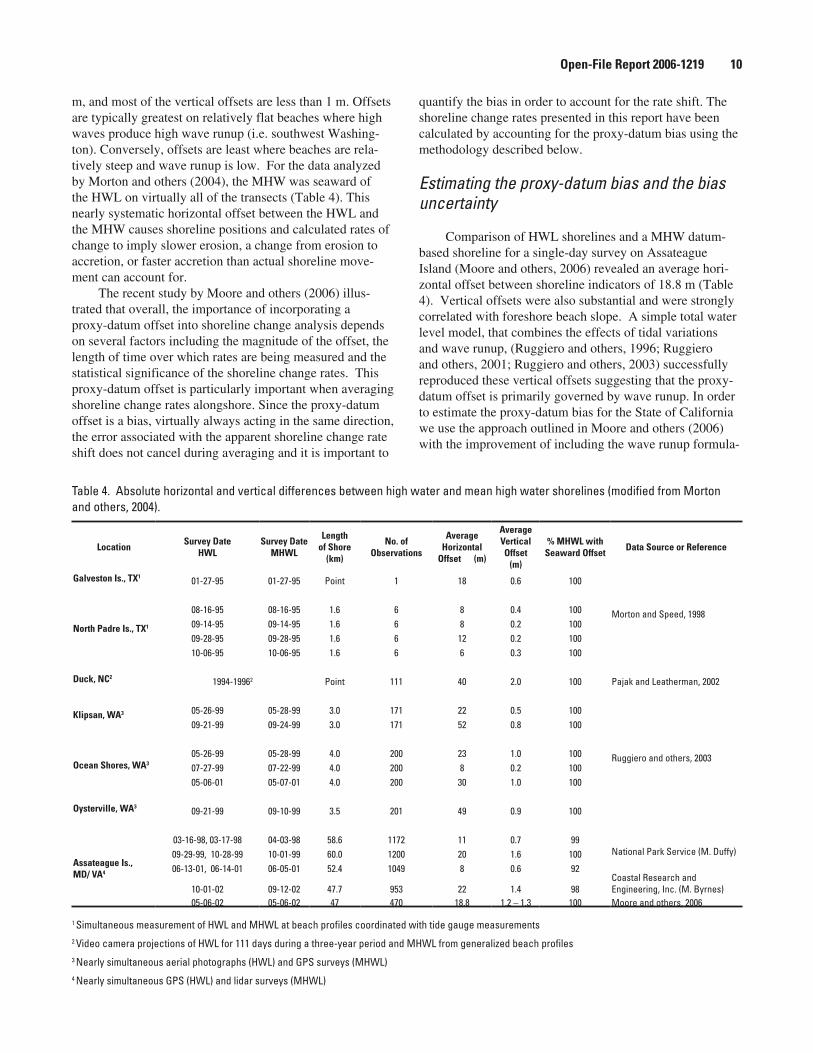
quantify the bias in order to account for the rate shift. The shoreline change rates presented in this report have been calculated by accounting for the proxy-datum bias using the methodology described below.
Estimating the proxy-datum bias and the bias uncertainty
Comparison of HWL shorelines and a MHW datum-based shoreline for a single-day survey on Assateague Island (Moore and others, 2006) revealed an average hori-zontal offset between shoreline indicators of 18.8 m (Table 4). Vertical offsets were also substantial and were strongly correlated with foreshore beach slope. A simple total water level model, that combines the effects of tidal variations and wave runup, (Ruggiero and others, 1996; Ruggiero and others, 2001; Ruggiero and others, 2003) successfully reproduced these vertical offsets suggesting that the proxy-datum offset is primarily governed by wave runup. In order to estimate the proxy-datum bias for the State of California we use the approach outlined in Moore and others (2006) with the improvement of including the wave runup formula-
1 Simultaneous measurement of HWL and MHWL at beach profiles coordinated with tide gauge measurements2 Video camera projections of HWL for 111 days during a three-year period and MHWL from generalized beach profiles3 Nearly simultaneous aerial photographs (HWL) and GPS surveys (MHWL) 4 Nearly simultaneous GPS (HWL) and lidar surveys (MHWL)
Table 4. Absolute horizontal and vertical differences between high water and mean high water shorelines (modified from Morton and others, 2004).
Location Survey Date HWL
Survey Date MHWL
Length of Shore
(km)
No. of Observations
Average Horizontal
Offset (m)
Average Vertical Offset
(m)
% MHWL with Seaward Offset Data Source or Reference
Galveston Is., TX1 01-27-95 01-27-95 Point 1 18 0.6 100
Morton and Speed, 1998North Padre Is., TX1
08-16-95 08-16-95 1.6 6 8 0.4 10009-14-95 09-14-95 1.6 6 8 0.2 10009-28-95 09-28-95 1.6 6 12 0.2 10010-06-95 10-06-95 1.6 6 6 0.3 100
Duck, NC2 1994-19962 Point 111 40 2.0 100 Pajak and Leatherman, 2002
Klipsan, WA3 05-26-99 05-28-99 3.0 171 22 0.5 100
Ruggiero and others, 2003
09-21-99 09-24-99 3.0 171 52 0.8 100
Ocean Shores, WA305-26-99 05-28-99 4.0 200 23 1.0 10007-27-99 07-22-99 4.0 200 8 0.2 10005-06-01 05-07-01 4.0 200 30 1.0 100
Oysterville, WA3 09-21-99 09-10-99 3.5 201 49 0.9 100
Assateague Is., MD/ VA�
03-16-98, 03-17-98 04-03-98 58.6 1172 11 0.7 99National Park Service (M. Duffy)09-29-99, 10-28-99 10-01-99 60.0 1200 20 1.6 100
06-13-01, 06-14-01 06-05-01 52.4 1049 8 0.6 92
10-01-02 09-12-02 47.7 953 22 1.4 98Coastal Research and Engineering, Inc. (M. Byrnes)
05-06-02 05-06-02 47 470 18.8 1.2 – 1.3 100 Moore and others, 2006
Open-File Report 2006-1219 10
tion of Stockdon and others (2006). The horizontal offset between HWL and MWH shorelines can be estimated by:
Equation (1)
where ZT is the tide level, tan b is the beach slope, Ho is the deepwater significant wave height, and Lo is the deep-water wave length given by linear theory as gT2/2p, where g is the acceleration due to gravity and T is the peak wave period.
In order to calculate the bias, as well as the bias uncer-tainty, for this regional shoreline change analysis, long-term best estimates and measures of uncertainty are derived for beach slope, wave height, wave length, and tide level. The best estimate for beach slope was derived by averaging individual lidar transect slope estimates within 1-km blocks along the coast. We take the long-term mean wave height and length to be the best estimate to use in the bias calcu-lation. The long-term mean wave height is derived from USACE Wave Information Studies (WIS) hindcasts while the long-term mean wave length is derived from long-term buoy records (NDBC and CDIP) along the California Coast. Finally, the best estimate of the tide level responsible for generating HWL shorelines is taken as the elevation of MHW (see Table 3) (Weber and List, 2005). The mea-sures of uncertainty for the beach slope, wave height, and wave length are estimated as the difference between the 95% exceedance statistic and the 50% exceedance statistic of the cumulative distributions. This gives a 90% confi-dence interval on each of the cumulative distributions. The uncertainty of assuming that the tide responsible for leaving HWL-type shorelines was at MHW is calculated simply by MHHW-MHW
The proxy-datum bias, and the associated uncertainty, is calculated at each of the 1-km blocks in which the aver-age beach slope has been calculated. The nearest WIS station, wave buoy, and tide gage to each individual 1-km block were used in the application of Equation 1. Once the bias was calculated, it was incorporated into DSAS and applied on a transect-by-transect basis, so that the estimated bias is removed from the final long- and short-term shore-line change rates. The bias, averaged over 815 1-km sec-
tions of the California coast, was approximately 18 m with an average uncertainty of approximately 8.7m.
Uncertainties and Errors
Documented trends and calculated rates of shoreline change are only as reliable as: (1) measurement errors that determine the accuracy of each shoreline position, (2) sampling errors that account for the variability of shoreline position, and (3) statistical errors associated with compil-ing and comparing shoreline positions. Anders and Byrnes (1991), Crowell and others (1991), Thieler and Danforth (1994), and Moore (2000), provided general estimates of the typical measurement errors associated with mapping methods and materials for historical shorelines, registry of shoreline position relative to geographic coordinates, and shoreline digitizing.
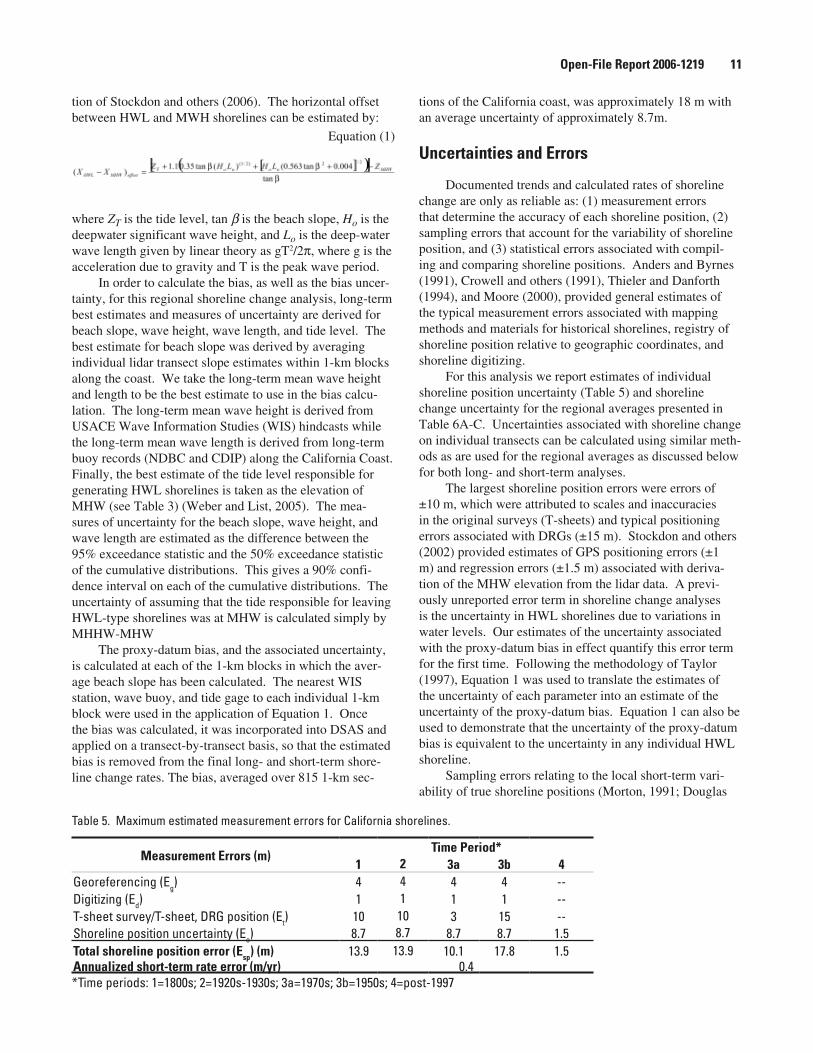
For this analysis we report estimates of individual shoreline position uncertainty (Table 5) and shoreline change uncertainty for the regional averages presented in Table 6A-C. Uncertainties associated with shoreline change on individual transects can be calculated using similar meth-ods as are used for the regional averages as discussed below for both long- and short-term analyses.
The largest shoreline position errors were errors of ±10 m, which were attributed to scales and inaccuracies in the original surveys (T-sheets) and typical positioning errors associated with DRGs (±15 m). Stockdon and others (2002) provided estimates of GPS positioning errors (±1 m) and regression errors (±1.5 m) associated with deriva-tion of the MHW elevation from the lidar data. A previ-ously unreported error term in shoreline change analyses is the uncertainty in HWL shorelines due to variations in water levels. Our estimates of the uncertainty associated with the proxy-datum bias in effect quantify this error term for the first time. Following the methodology of Taylor (1997), Equation 1 was used to translate the estimates of the uncertainty of each parameter into an estimate of the uncertainty of the proxy-datum bias. Equation 1 can also be used to demonstrate that the uncertainty of the proxy-datum bias is equivalent to the uncertainty in any individual HWL shoreline.
Sampling errors relating to the local short-term vari-ability of true shoreline positions (Morton, 1991; Douglas
Table 5. Maximum estimated measurement errors for California shorelines.
Measurement Errors (m)Time Period*
1 2 3a 3b �Georeferencing (Eg) 4 4 4 4 --Digitizing (Ed) 1 1 1 1 --T-sheet survey/T-sheet, DRG position (Et) 10 10 3 15 --Shoreline position uncertainty (Eo) 8.7 8.7 8.7 8.7 1.5Total shoreline position error (Esp) (m) 13.9 13.9 10.1 17.8 1.5Annualized short-term rate error (m/yr) 0.4*Time periods: 1=1800s; 2=1920s-1930s; 3a=1970s; 3b=1950s; 4=post-1997
Open-File Report 2006-1219 11

Open-File Report 2006-1219 12
Table 6A. Average shoreline change rates for Northern California
Table 6B. Average shoreline change rates for Central California
Table 6C. Average shoreline change rates for Southern California
Note: LT = long-term; ST = short-term
Note: LT = long-term; ST = short-term
Note: LT = long-term; ST = short-term
No. of Transects Average of Rates (m/yr) Erosion Rate (m/yr) % Erosion Accretion Rate (m/yr) % Accretion
Analysis
RegionLT ST LT ST LT ST LT ST LT ST LT ST
Klamath 1430 1573 0.7+0.1 0.4+0.4 -0.4+0.1 -0.6+0.4 25 48 1.0+0.1 1.3+0.4 75 52
Eureka 493 652 0.7+0.2 0.4+0.4 -0.2+0.3 -0.9+0.4 4 51 0.7+0.2 1.8+0.4 96 49
Navarro 608 656 0.1+0.1 0.0+0.4 -0.1+0.1 -0.5+0.4 28 50 0.2+0.1 0.6+0.4 72 50
Russian River 435 483 0.2+0.1 0.4+0.4 -0.2+0.1 -0.4+0.4 28 35 0.3+0.1 0.8+0.4 72 65
No. California 2966 3364 0.5+0.1 0.3+0.4 -0.3+0.1 -0.6+0.4 23 47 0.7+0.1 1.2+0.4 77 53
No. of Transects Average of Rates (m/yr) Erosion Rate (m/yr) % Erosion Accretion Rate (m/yr) % Accretion
Analysis Region LT ST LT ST LT ST LT ST LT ST LT ST
San Francisco N 902 1039 0.1+0.1 -0.5+0.4 -0.2+0.1 -0.7+0.4 46 81 0.3+0.1 0.5+0.4 54 19
San Francisco S 1125 1150 -0.2+0.1 -0.5+0.4 -0.4+0.1 -0.7+0.4 76 81 0.1+0.1 0.5+0.4 24 19
Monterey Bay 1013 1031 -0.2+0.1 -0.6+0.4 -0.6+0.1 -0.8+0.4 41 77 0.4+0.1 0.3+0.4 59 23
Big Sur 512 533 0.0+0.1 -0.2+0.4 -0.1+0.1 -0.5+0.4 39 65 0.2+0.1 0.4+0.4 61 35
Morro Bay 447 458 0.1+0.1 -0.7+0.4 -0.1+0.1 -1.0+0.4 35 80 0.3+0.1 0.4+0.4 65 20
Santa Barbara N 1983 2267 0.0+0.1 -0.6+0.4 -0.2+0.1 -1.0+0.4 56 80 0.2+0.1 0.9+0.4 44 20
Central California 5982 6478 0.0+0.1 -0.5+0.4 -0.3+0.1 -0.8+0.4 53 79 0.2+0.1 0.6+0.4 47 21
No. of Transects Average of Rates (m/yr) Erosion Rate (m/yr) % Erosion Accretion Rate (m/yr) % Accretion
Analysis Region LT ST LT ST LT ST LT ST LT ST LT ST
Santa Barbara S 1692 1760 0.1+0.1 -0.5+0.4 -0.2+0.1 -1.2+0.4 56 72 0.5+0.1 1.1+0.4 44 28
Santa Monica 1319 1504 0.4+0.1 -0.1+0.4 -0.1+0.1 -0.5+0.4 31 60 0.7+0.1 0.9+0.4 69 40
San Pedro 605 925 0.5+0.1 0.5+0.4 -0.3+0.2 -0.5+0.4 12 35 0.6+0.1 1.0+0.4 88 65
Oceanside 1561 1587 0.2+0.1 -0.1+0.4 -0.1+0.1 -0.6+0.4 31 67 0.3+0.1 0.9+0.4 69 33
San Diego 437 524 0.9+0.1 -0.8+0.4 -0.1+0.1 -1.0+0.4 21 90 1.2+0.2 0.5+0.4 79 10
So. California 5614 6300 0.3+0.1 -0.1+0.4 -0.2+0.1 -0.8+0.4 36 64 0.6+0.1 0.9+0.4 64 35
and Crowell, 2000) are less well known. Along the Califor-nia coast, as in many locales worldwide, there is pronounced cyclical erosion and accretion of the shoreline. This variability is driven by variations in wave conditions from summer to winter, years with severe versus average storms or swells, and episodic events like El Niños or hurricanes. In addition, the seasonal shoreline variability also has a high spatial variability, depending on the orientation of the coast with respect to the wave direction and effects of refraction or reflection from headlands, offshore islands and manmade structures. As a result, an uncertainty term quantifying sea-sonal shoreline variability for regionally averaged shore-line change rates is a rough estimate at best. Site specific, temporally dense data are required to evaluate short-term shoreline variability. The lack of reliable high frequency data regarding short-term variability (of true shoreline position) at most coastal sites limits the ability to quantify this uncertainty into the overall shoreline position uncer-tainty. Studies that do exist for California (Shepard, 1950; Bascom, 1954; Johnson, 1971) focus on changes in beach width or profile. An estimate of the variability in the posi-tion of the MSL intersect on the beach from eleven profile envelopes from La Jolla (Shepard, 1950) is approximately 9 m. In Monterey Bay, similar qualitative estimates from 9 profiles, surveyed over 15 years (Dingler and Reiss, 2002), suggests an average variability envelope of the MHW of approximately 40 m. However, these data include both the 1982-83 and 1997-98 El Niños and thus incorporate extreme conditions. One of the most extensive records to date is the 20-year record of beach profiles surveyed by the Army Corps of Engineers at Duck, N.C. Using 460 shoreline posi-tions from the Duck profile data, Barton and others (2003) showed that the envelope of shoreline positions around a relatively stable shoreline was about ±20 m.
Due to the lack of accurate, systematic data regarding the seasonal variation of the shoreline along the California coast, the error values reported here do not include an uncer-tainty term for the seasonal shoreline position variability in the quantification of errors associated with the regionally averaged shoreline change rates. For the long-term shoreline change analysis we assume that the seasonal variability in each shoreline is random and uncorrelated to the others and that the regression error will account for this uncertainty (see Linear regression (long-term) shoreline change error below). For the short-term analysis it is likely, at least in Northern and Central California, that due to the length of time over which our rates are calculated, the seasonal variability uncertainty term has a negligible impact on the total error value. In Northern and Central California, the shorelines from the most recent historical shoreline DRGs are based on aerial photographs from the 1940s and 1950s. Table 2 includes not only the years of the data sources, but also the months of the photography on which the T-sheet maps were based for the most recent historical shoreline. In Southern California nearly all of the source data are from the winter months, as is the lidar data. Therefore, the sea-
sonal variability term is again assumed not to have a mea-surable impact on the error term for the regionally averaged rates presented in this report. Independent comparisons of our shoreline change results with published rates in South-ern Monterey Bay (Thornton and others, 2006) are in close agreement, even in the short-term. However, we recommend that anyone using the data associated with this report for a more site-specific analysis incorporate an error term to account for seasonal shoreline position variability.
Estimates of the maximum positional errors for this study are provided in Table 5 to show how each error con-tributes to inaccuracy in the shoreline position. The annual-ized error for short-term shoreline change is calculated and subsequently incorporated into the shoreline change rate calculations as outlined below. The uncertainty on the short-term (end-point) rates, using a best estimate for California shorelines is ±0.4 m/yr (Table 5 and Table 6A-C).
End-point (short-term) shoreline change error
The total error for the end-point shoreline change rate, (Esp)(Equation 2), is calculated by taking the square root of the sum of the squares (or adding in quadrature) of: georef-erencing error (Eg), digitizing error (Ed), T-sheet survey or DRG error (Et), and shoreline position error (Ep), similar to the methods outlined by Crowell and others (1993). Values for each of the error terms are given in Table 5. The georeferencing error represents the elected maximum acceptable RMS error for T-sheets at a scale of 1:20,000 in this study. The georeferencing error is applied to the historical shorelines that are derived from T-sheets only. The digitizing error reflects the maximum error specified in past studies (Anders and Byrnes, 1991; Crowell and others, 1991; Moore, 2000), and is applied to the historical shore-lines only. The maximum T-sheet survey error, determined by Shalowitz (1964), incorporates all of the errors associ-ated with the mapping process including distance to rodded points, plane table position, and identification of the HWL. The maximum DRG error is the stated accuracy of USGS Topographic Quadrangle maps from which the DRGs are derived; National Map Accuracy Standards give ±15 m as the maximum acceptable error. The T-sheet survey error is applied to all historical shorelines; however, note that the error associated with the 1950s-1970s era T-sheets is considerably lower than the older T-sheets; this difference is based on findings by Ruggiero and others (2003), as well as the fact that more recent shorelines are derived from aerial photos or other sources. Shoreline position error is the maximum error associated with the derivation of the lidar shoreline (Stockdon and others, 2002) for lidar data and the average bias uncertainty (8.7 m) for the historical shore-
Open-File Report 2006-1219 13
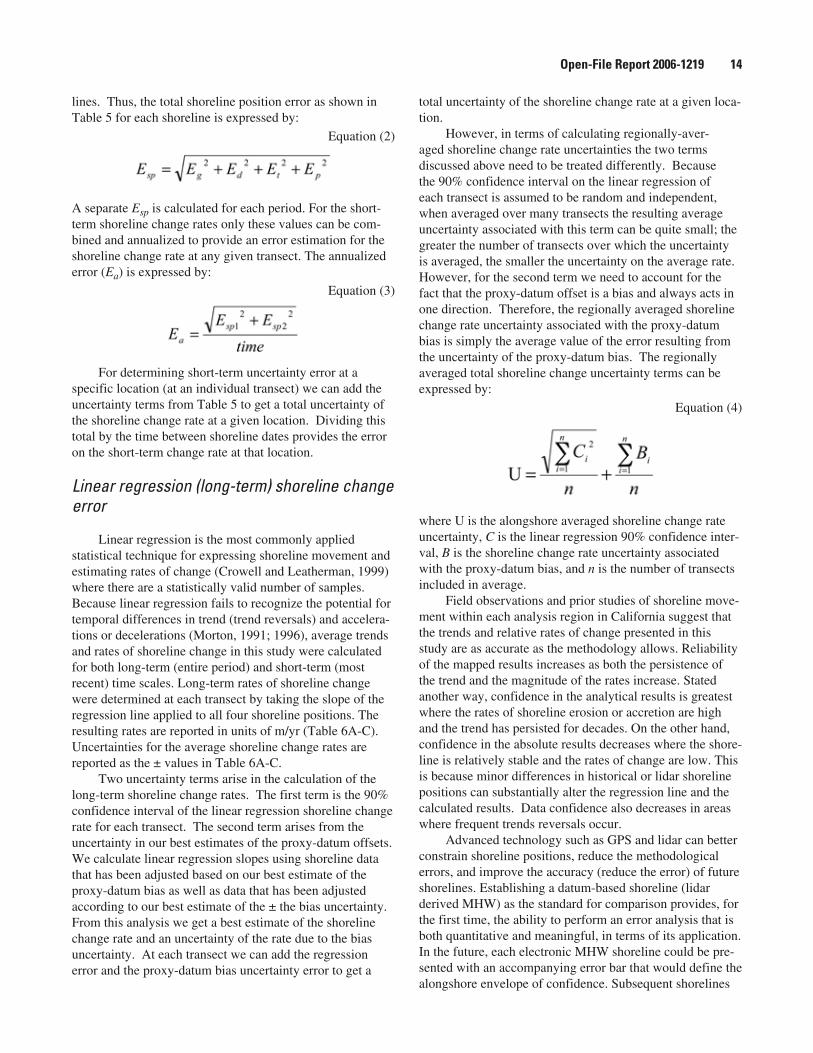
lines. Thus, the total shoreline position error as shown in Table 5 for each shoreline is expressed by:
Equation (2)
A separate Esp is calculated for each period. For the short-term shoreline change rates only these values can be com-bined and annualized to provide an error estimation for the shoreline change rate at any given transect. The annualized error (Ea) is expressed by:
Equation (3)
For determining short-term uncertainty error at a specific location (at an individual transect) we can add the uncertainty terms from Table 5 to get a total uncertainty of the shoreline change rate at a given location. Dividing this total by the time between shoreline dates provides the error on the short-term change rate at that location.
Linear regression (long-term) shoreline change error
Linear regression is the most commonly applied statistical technique for expressing shoreline movement and estimating rates of change (Crowell and Leatherman, 1999) where there are a statistically valid number of samples. Because linear regression fails to recognize the potential for temporal differences in trend (trend reversals) and accelera-tions or decelerations (Morton, 1991; 1996), average trends and rates of shoreline change in this study were calculated for both long-term (entire period) and short-term (most recent) time scales. Long-term rates of shoreline change were determined at each transect by taking the slope of the regression line applied to all four shoreline positions. The resulting rates are reported in units of m/yr (Table 6A-C). Uncertainties for the average shoreline change rates are reported as the ± values in Table 6A-C.
Two uncertainty terms arise in the calculation of the long-term shoreline change rates. The first term is the 90% confidence interval of the linear regression shoreline change rate for each transect. The second term arises from the uncertainty in our best estimates of the proxy-datum offsets. We calculate linear regression slopes using shoreline data that has been adjusted based on our best estimate of the proxy-datum bias as well as data that has been adjusted according to our best estimate of the ± the bias uncertainty. From this analysis we get a best estimate of the shoreline change rate and an uncertainty of the rate due to the bias uncertainty. At each transect we can add the regression error and the proxy-datum bias uncertainty error to get a
total uncertainty of the shoreline change rate at a given loca-tion.
However, in terms of calculating regionally-aver-aged shoreline change rate uncertainties the two terms discussed above need to be treated differently. Because the 90% confidence interval on the linear regression of each transect is assumed to be random and independent, when averaged over many transects the resulting average uncertainty associated with this term can be quite small; the greater the number of transects over which the uncertainty is averaged, the smaller the uncertainty on the average rate. However, for the second term we need to account for the fact that the proxy-datum offset is a bias and always acts in one direction. Therefore, the regionally averaged shoreline change rate uncertainty associated with the proxy-datum bias is simply the average value of the error resulting from the uncertainty of the proxy-datum bias. The regionally averaged total shoreline change uncertainty terms can be expressed by:
Equation (4)
where U is the alongshore averaged shoreline change rate uncertainty, C is the linear regression 90% confidence inter-val, B is the shoreline change rate uncertainty associated with the proxy-datum bias, and n is the number of transects included in average.
Field observations and prior studies of shoreline move-ment within each analysis region in California suggest that the trends and relative rates of change presented in this study are as accurate as the methodology allows. Reliability of the mapped results increases as both the persistence of the trend and the magnitude of the rates increase. Stated another way, confidence in the analytical results is greatest where the rates of shoreline erosion or accretion are high and the trend has persisted for decades. On the other hand, confidence in the absolute results decreases where the shore-line is relatively stable and the rates of change are low. This is because minor differences in historical or lidar shoreline positions can substantially alter the regression line and the calculated results. Data confidence also decreases in areas where frequent trends reversals occur.
Advanced technology such as GPS and lidar can better constrain shoreline positions, reduce the methodological errors, and improve the accuracy (reduce the error) of future shorelines. Establishing a datum-based shoreline (lidar derived MHW) as the standard for comparison provides, for the first time, the ability to perform an error analysis that is both quantitative and meaningful, in terms of its application. In the future, each electronic MHW shoreline could be pre-sented with an accompanying error bar that would define the alongshore envelope of confidence. Subsequent shorelines
Open-File Report 2006-1219 1�
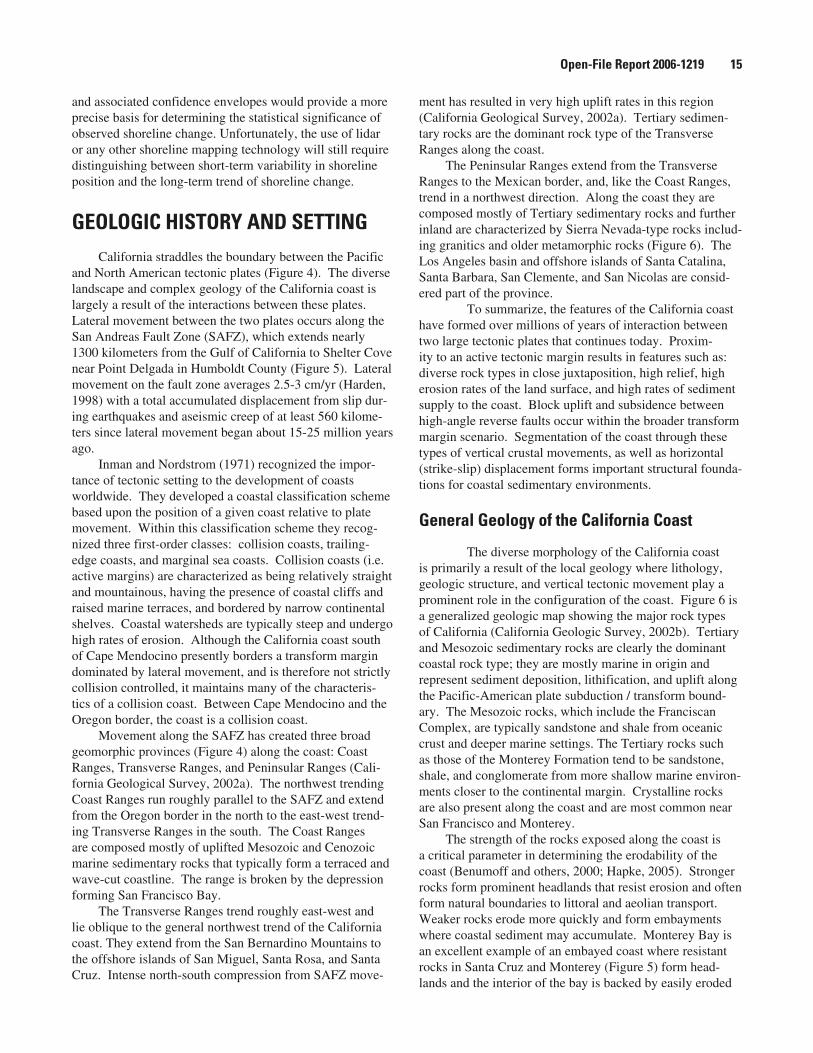
and associated confidence envelopes would provide a more precise basis for determining the statistical significance of observed shoreline change. Unfortunately, the use of lidar or any other shoreline mapping technology will still require distinguishing between short-term variability in shoreline position and the long-term trend of shoreline change.
GEOLOGIC HISTORY AND SETTINGCalifornia straddles the boundary between the Pacific
and North American tectonic plates (Figure 4). The diverse landscape and complex geology of the California coast is largely a result of the interactions between these plates. Lateral movement between the two plates occurs along the San Andreas Fault Zone (SAFZ), which extends nearly 1300 kilometers from the Gulf of California to Shelter Cove near Point Delgada in Humboldt County (Figure 5). Lateral movement on the fault zone averages 2.5-3 cm/yr (Harden, 1998) with a total accumulated displacement from slip dur-ing earthquakes and aseismic creep of at least 560 kilome-ters since lateral movement began about 15-25 million years ago.
Inman and Nordstrom (1971) recognized the impor-tance of tectonic setting to the development of coasts worldwide. They developed a coastal classification scheme based upon the position of a given coast relative to plate movement. Within this classification scheme they recog-nized three first-order classes: collision coasts, trailing-edge coasts, and marginal sea coasts. Collision coasts (i.e. active margins) are characterized as being relatively straight and mountainous, having the presence of coastal cliffs and raised marine terraces, and bordered by narrow continental shelves. Coastal watersheds are typically steep and undergo high rates of erosion. Although the California coast south of Cape Mendocino presently borders a transform margin dominated by lateral movement, and is therefore not strictly collision controlled, it maintains many of the characteris-tics of a collision coast. Between Cape Mendocino and the Oregon border, the coast is a collision coast.
Movement along the SAFZ has created three broad geomorphic provinces (Figure 4) along the coast: Coast Ranges, Transverse Ranges, and Peninsular Ranges (Cali-fornia Geological Survey, 2002a). The northwest trending Coast Ranges run roughly parallel to the SAFZ and extend from the Oregon border in the north to the east-west trend-ing Transverse Ranges in the south. The Coast Ranges are composed mostly of uplifted Mesozoic and Cenozoic marine sedimentary rocks that typically form a terraced and wave-cut coastline. The range is broken by the depression forming San Francisco Bay.
The Transverse Ranges trend roughly east-west and lie oblique to the general northwest trend of the California coast. They extend from the San Bernardino Mountains to the offshore islands of San Miguel, Santa Rosa, and Santa Cruz. Intense north-south compression from SAFZ move-
ment has resulted in very high uplift rates in this region (California Geological Survey, 2002a). Tertiary sedimen-tary rocks are the dominant rock type of the Transverse Ranges along the coast.
The Peninsular Ranges extend from the Transverse Ranges to the Mexican border, and, like the Coast Ranges, trend in a northwest direction. Along the coast they are composed mostly of Tertiary sedimentary rocks and further inland are characterized by Sierra Nevada-type rocks includ-ing granitics and older metamorphic rocks (Figure 6). The Los Angeles basin and offshore islands of Santa Catalina, Santa Barbara, San Clemente, and San Nicolas are consid-ered part of the province.
To summarize, the features of the California coast have formed over millions of years of interaction between two large tectonic plates that continues today. Proxim-ity to an active tectonic margin results in features such as: diverse rock types in close juxtaposition, high relief, high erosion rates of the land surface, and high rates of sediment supply to the coast. Block uplift and subsidence between high-angle reverse faults occur within the broader transform margin scenario. Segmentation of the coast through these types of vertical crustal movements, as well as horizontal (strike-slip) displacement forms important structural founda-tions for coastal sedimentary environments.
General Geology of the California Coast
The diverse morphology of the California coast is primarily a result of the local geology where lithology, geologic structure, and vertical tectonic movement play a prominent role in the configuration of the coast. Figure 6 is a generalized geologic map showing the major rock types of California (California Geologic Survey, 2002b). Tertiary and Mesozoic sedimentary rocks are clearly the dominant coastal rock type; they are mostly marine in origin and represent sediment deposition, lithification, and uplift along the Pacific-American plate subduction / transform bound-ary. The Mesozoic rocks, which include the Franciscan Complex, are typically sandstone and shale from oceanic crust and deeper marine settings. The Tertiary rocks such as those of the Monterey Formation tend to be sandstone, shale, and conglomerate from more shallow marine environ-ments closer to the continental margin. Crystalline rocks are also present along the coast and are most common near San Francisco and Monterey.
The strength of the rocks exposed along the coast is a critical parameter in determining the erodability of the coast (Benumoff and others, 2000; Hapke, 2005). Stronger rocks form prominent headlands that resist erosion and often form natural boundaries to littoral and aeolian transport. Weaker rocks erode more quickly and form embayments where coastal sediment may accumulate. Monterey Bay is an excellent example of an embayed coast where resistant rocks in Santa Cruz and Monterey (Figure 5) form head-lands and the interior of the bay is backed by easily eroded
Open-File Report 2006-1219 1�
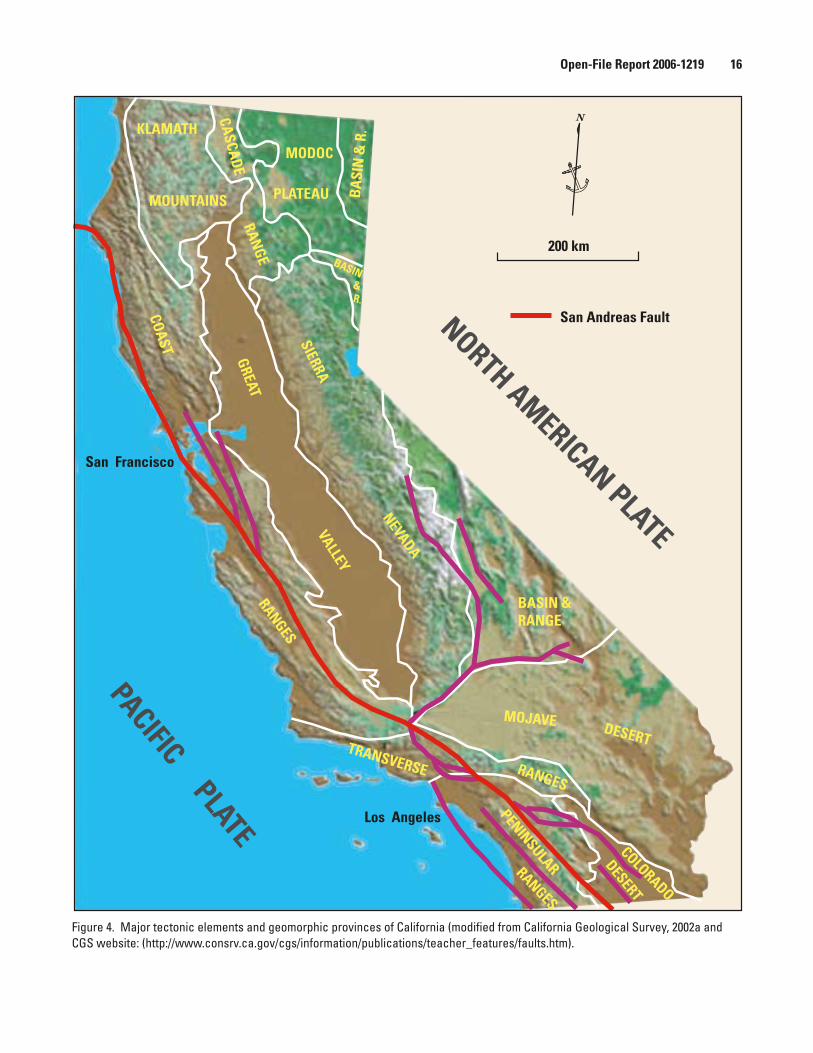
Figure 4. Major tectonic elements and geomorphic provinces of California (modified from California Geological Survey, 2002a and CGS website: (http://www.consrv.ca.gov/cgs/information/publications/teacher_features/faults.htm).
GREAT
VALLEY
MODOC
PLATEAU
BASIN &RANGE
BASI
N &
R.
BASIN
SIERRA
NEVADA
MOJAVE DESERT
COLORADO
DESERT
PENINSULARRANGES
COAST
RANGES
TRANSVERSE RANGES
KLAMATH
MOUNTAINS
CASCADERAN
GE
&R.
200 km
San Andreas FaultNORTH AMERICAN PLATE
PACIFIC PLATE
N
San Francisco
Los Angeles
Open-File Report 2006-1219 16
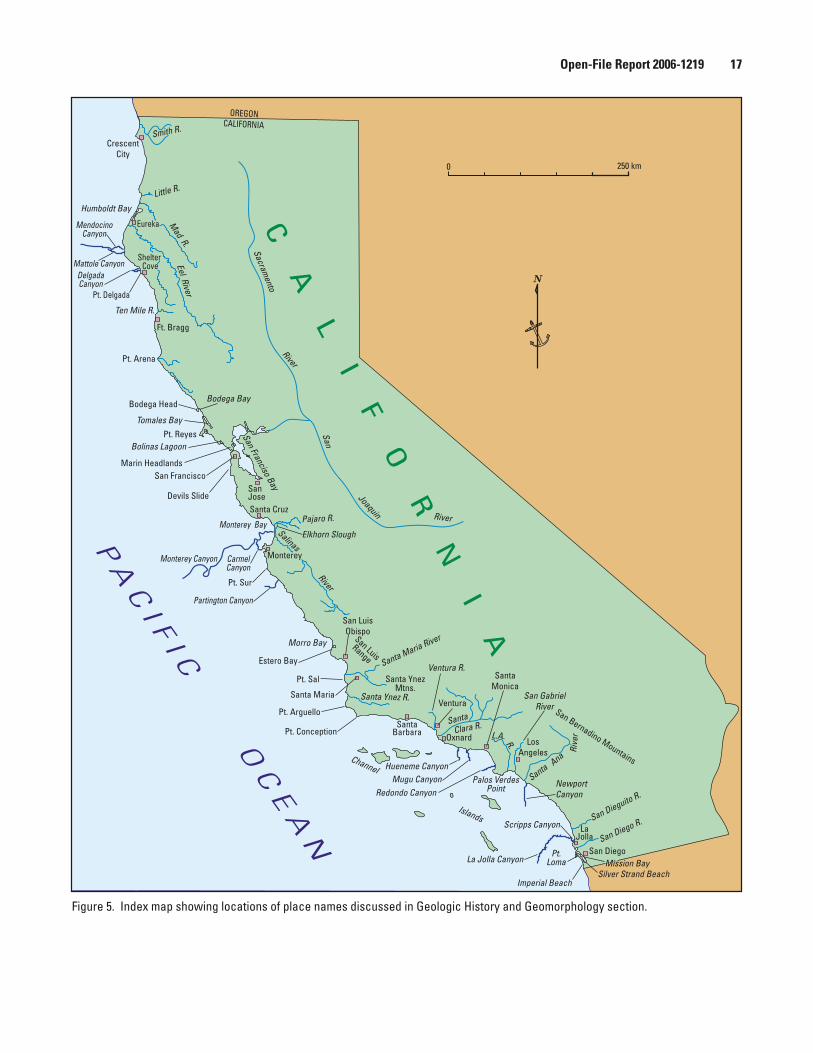
Figure 5. Index map showing locations of place names discussed in Geologic History and Geomorphology section.
VenturaRiver
San DiegoPt.Loma
Silver Strand Beach
San Dieguito R.
San Diego R.
Santa Ynez R.
Santa Maria River
SantaBarbara
Santa Maria
San LuisObispo
LosAngeles
Palos VerdesPoint
SantaMonica
L.A. R.
CrescentCity
Mad R.
Eel River
Little R.
Monterey Bay Pajaro R.Salinas
Channel Islands
Pt. Conception
Ft. Bragg
SanJoseSanta Cruz
Monterey
Ventura
Eureka
250 km
N
C A
L I F
O R
N I A
Smith R.
Ten Mile R.
Pt. Arena
ShelterCove
Pt. Reyes
Humboldt Bay
Tomales Bay
Bolinas Lagoon
Bodega Bay
San Franciso BayElkhorn Slough
Pt. Sur
Morro Bay
Oxnard
LaJolla
OREGONCALIFORNIA
Sacramento
River
San
Joaquin River
SantaAna
Rive
r
SantaClara R.
Ventura R.
San Bernadino Mountains
Bodega Head
Marin HeadlandsSan Francisco
Devils Slide
Santa YnezMtns.
Estero Bay
Pt. Delgada
Pt. Sal
Pt. Arguello
Imperial Beach
San GabrielRiver
River
0
PA
CI F
I C O
CE
AN
San LuisRange
DelgadaCanyon
MendocinoCanyon
Mattole Canyon
Monterey Canyon CarmelCanyon
Partington Canyon
Hueneme Canyon
Redondo Canyon
Scripps Canyon
La Jolla Canyon
Mugu Canyon
Mission Bay
NewportCanyon
Open-File Report 2006-1219 17
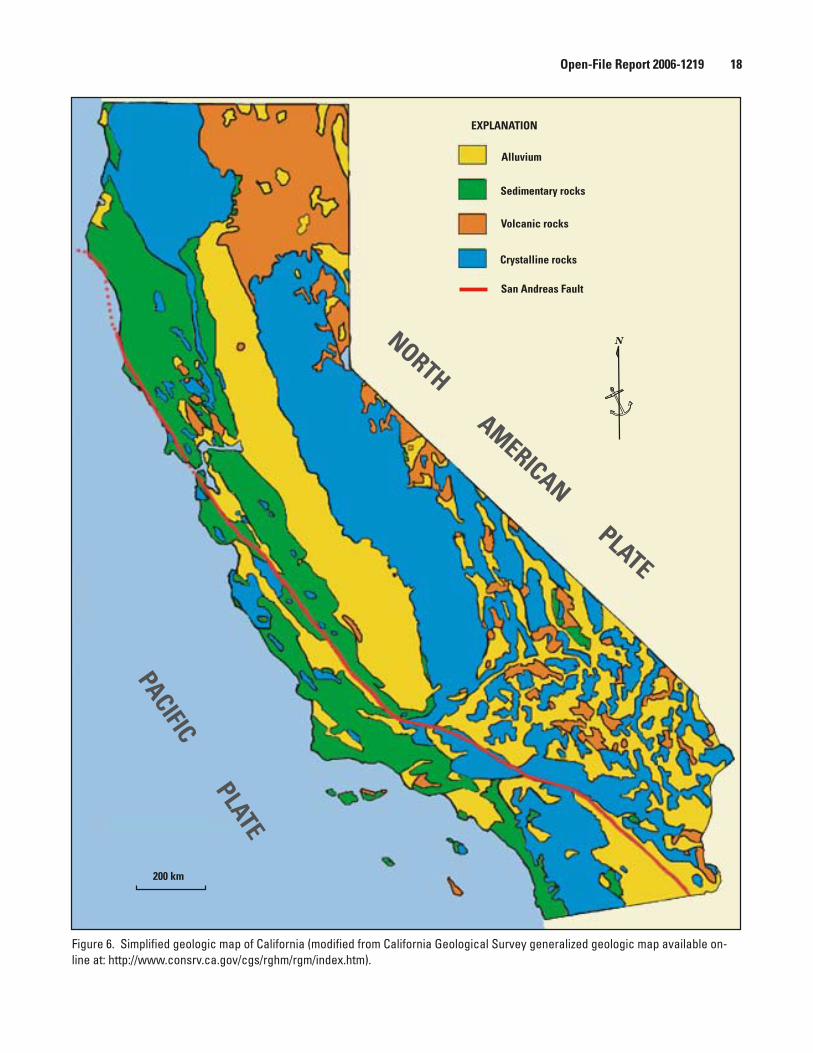
Alluvium
Sedimentary rocks
Volcanic rocks
Crystalline rocks
EXPLANATION
200 km
San Andreas Fault
PACIFIC PLATE
NORTH AMERICAN PLATE
N
Figure 6. Simplified geologic map of California (modified from California Geological Survey generalized geologic map available on-line at: http://www.consrv.ca.gov/cgs/rghm/rgm/index.htm).
Open-File Report 2006-1219 18
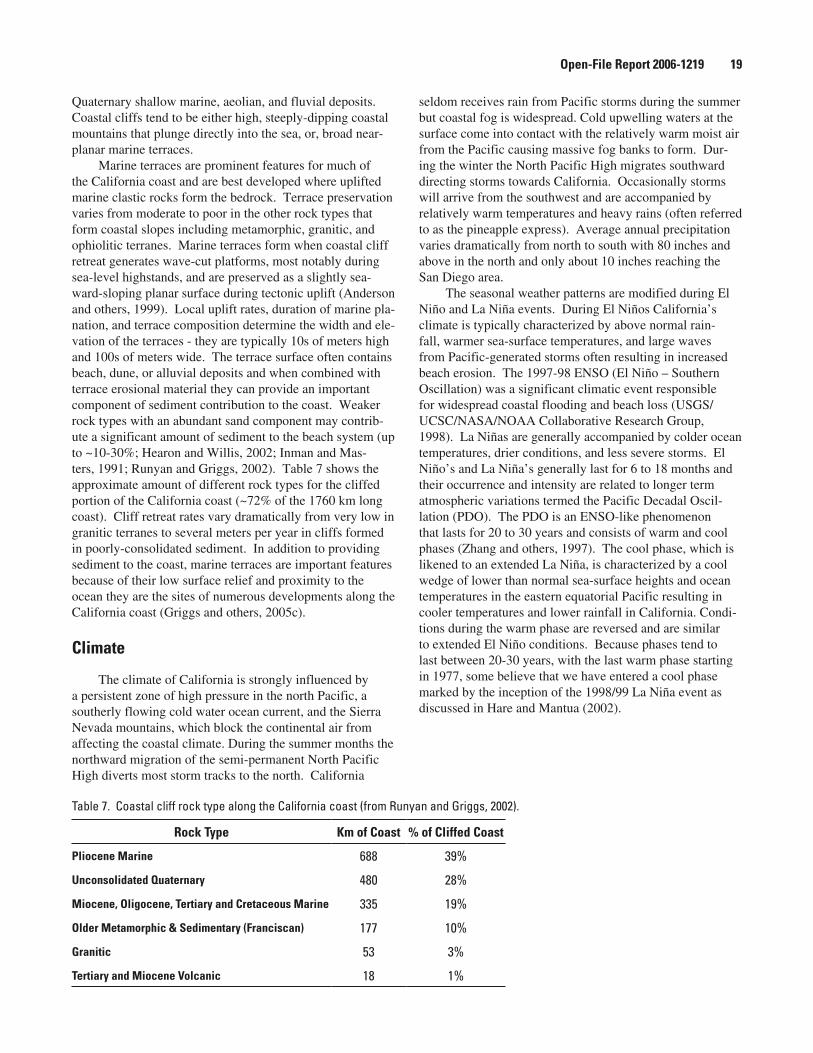
Quaternary shallow marine, aeolian, and fluvial deposits. Coastal cliffs tend to be either high, steeply-dipping coastal mountains that plunge directly into the sea, or, broad near- planar marine terraces.
Marine terraces are prominent features for much of the California coast and are best developed where uplifted marine clastic rocks form the bedrock. Terrace preservation varies from moderate to poor in the other rock types that form coastal slopes including metamorphic, granitic, and ophiolitic terranes. Marine terraces form when coastal cliff retreat generates wave-cut platforms, most notably during sea-level highstands, and are preserved as a slightly sea-ward-sloping planar surface during tectonic uplift (Anderson and others, 1999). Local uplift rates, duration of marine pla-nation, and terrace composition determine the width and ele-vation of the terraces - they are typically 10s of meters high and 100s of meters wide. The terrace surface often contains beach, dune, or alluvial deposits and when combined with terrace erosional material they can provide an important component of sediment contribution to the coast. Weaker rock types with an abundant sand component may contrib-ute a significant amount of sediment to the beach system (up to ~10-30%; Hearon and Willis, 2002; Inman and Mas-ters, 1991; Runyan and Griggs, 2002). Table 7 shows the approximate amount of different rock types for the cliffed portion of the California coast (~72% of the 1760 km long coast). Cliff retreat rates vary dramatically from very low in granitic terranes to several meters per year in cliffs formed in poorly-consolidated sediment. In addition to providing sediment to the coast, marine terraces are important features because of their low surface relief and proximity to the ocean they are the sites of numerous developments along the California coast (Griggs and others, 2005c).
Climate
The climate of California is strongly influenced by a persistent zone of high pressure in the north Pacific, a southerly flowing cold water ocean current, and the Sierra Nevada mountains, which block the continental air from affecting the coastal climate. During the summer months the northward migration of the semi-permanent North Pacific High diverts most storm tracks to the north. California
seldom receives rain from Pacific storms during the summer but coastal fog is widespread. Cold upwelling waters at the surface come into contact with the relatively warm moist air from the Pacific causing massive fog banks to form. Dur-ing the winter the North Pacific High migrates southward directing storms towards California. Occasionally storms will arrive from the southwest and are accompanied by relatively warm temperatures and heavy rains (often referred to as the pineapple express). Average annual precipitation varies dramatically from north to south with 80 inches and above in the north and only about 10 inches reaching the San Diego area.
The seasonal weather patterns are modified during El Niño and La Niña events. During El Niños California’s climate is typically characterized by above normal rain-fall, warmer sea-surface temperatures, and large waves from Pacific-generated storms often resulting in increased beach erosion. The 1997-98 ENSO (El Niño – Southern Oscillation) was a significant climatic event responsible for widespread coastal flooding and beach loss (USGS/UCSC/NASA/NOAA Collaborative Research Group, 1998). La Niñas are generally accompanied by colder ocean temperatures, drier conditions, and less severe storms. El Niño’s and La Niña’s generally last for 6 to 18 months and their occurrence and intensity are related to longer term atmospheric variations termed the Pacific Decadal Oscil-lation (PDO). The PDO is an ENSO-like phenomenon that lasts for 20 to 30 years and consists of warm and cool phases (Zhang and others, 1997). The cool phase, which is likened to an extended La Niña, is characterized by a cool wedge of lower than normal sea-surface heights and ocean temperatures in the eastern equatorial Pacific resulting in cooler temperatures and lower rainfall in California. Condi-tions during the warm phase are reversed and are similar to extended El Niño conditions. Because phases tend to last between 20-30 years, with the last warm phase starting in 1977, some believe that we have entered a cool phase marked by the inception of the 1998/99 La Niña event as discussed in Hare and Mantua (2002).
Table 7. Coastal cliff rock type along the California coast (from Runyan and Griggs, 2002).
Rock Type Km of Coast % of Cliffed Coast
Pliocene Marine 688 39%
Unconsolidated Quaternary 480 28%
Miocene, Oligocene, Tertiary and Cretaceous Marine 335 19%
Older Metamorphic & Sedimentary (Franciscan) 177 10%
Granitic 53 3%
Tertiary and Miocene Volcanic 18 1%
Open-File Report 2006-1219 19
Coastal Processes
Waves
Waves and currents are the primary forces that move sediment in the littoral zone and annual wave height varia-tions are responsible for seasonal erosion and accretion patterns. Wave characteristics along the California coast depend on weather patterns, geographical effects such as offshore islands, storm climatology, coastline orientation and local bathymetry. The offshore wave climate of Cali-fornia is characterized by four regimes (Figure 7): Northern Pacific swell, Southern Hemisphere swell, northwest wind waves, and by locally driven seas (Storlazzi and Wingfield, 2005). North Pacific swell is generated by extra tropical storms, mid-latitude low-pressure systems, and cold fronts that originate in the North Pacific. Southern swell is domi-nant in the summertime and generated by winter storms in the Southern Hemisphere. Northwest wind waves gener-ated by daily sea breeze conditions are more common in the northern part of the state and are strongest in the spring and early summer months. Local seas are driven by wind and storms along the coast. Given the variety of local and sea-sonal variations in wave climate, the predominant direction of nearshore sediment transport along the California coast is from north-to-south (Hearon and Willis, 2002). Wave climate varies along the California coast and can region-ally summarized as follows (after Storlazzi and Wingfield, 2005):
In northern California the average wave height is greatest from November to February and averages about 3 m, with approximately 20% of the time wave heights are greater than 4 m. Summer wave heights are smaller with mean values around 1.8 m with waves higher than 4 m being extremely rare. Early winter is the most common time for waves to exceed 6 m. During El Niño winter months mean annual wave heights are 0.3 m – 1.2 m greater than normal winter months. El Niño driven storms typically approach from the west or southwest and may cause local littoral drift to the north – counter to the predominant southerly drift. La Niña winter months have slightly higher than average wave height values of 0.1 m – 0.4 m whereas during the summers wave heights are smaller than average.
Central California is a transition zone between harsh stormy waves of the northeast Pacific and milder conditions of Southern California. North Pacific Swell is the largest swell to impact the region with heights between 2m – 10m and periods ranging between 10 – 25 seconds. These waves, which are generated by storms in the North Pacific, occur most commonly between October and May. Northwest wind waves are generated from sea breeze and are dominant from April to October. The height of these waves typi-cally varies between 1 and 4 meters with a period of 3 to 10 seconds. Southern Swell occurs between April and October and typical wave heights range from 0.3 – 3 m with a period of 10 – 25 seconds. Local wind-driven waves are generated by storms passing through central California. They gener-ally occur between October and April with typical heights 1 and 4 meters and periods of 3 to 10 seconds.
In southern California peak wave heights are greatest from November to February and average about 2.4 m during this time. In the summer wave heights are smaller with mean values around 1.8 m. Waves greater than four meters occur about 11% of the time at Point Concep-tion (Figure 5) and are most common during the month of March. Waves that damage the Southern California coast originate from extra-tropical storms in the northeast Pacific or Southern Hemisphere, although the second case is rare (Newberger, 1982). During El Niño winter months, wave heights at Point Conception are 0.7 m above average. In general, the southern region of the West Coast experiences more storms and higher wave energy during ENSO events (Seymour, 1998). Wave conditions along the southern Cali-fornia coast are extremely variable due to coastal configura-tion, bathymetry, orientation of coastline and the presence of several large offshore islands. Wave height measure-ments can be substantially different over distances of a few miles (Newberger, 1982). The Channel Islands block waves approaching from the south and Point Conception blocks waves from the north. Waves that propagate into the chan-nel are severely refracted by irregular shallow bathymetry, producing large spatial variations in swell wave height and direction (Guza and O’Reilly, 2001).Figure 7. General wave directions for central California based
on offshore wave buoy data (modified from Storlazzi and Wing-field, 2005).
Open-File Report 2006-1219 20
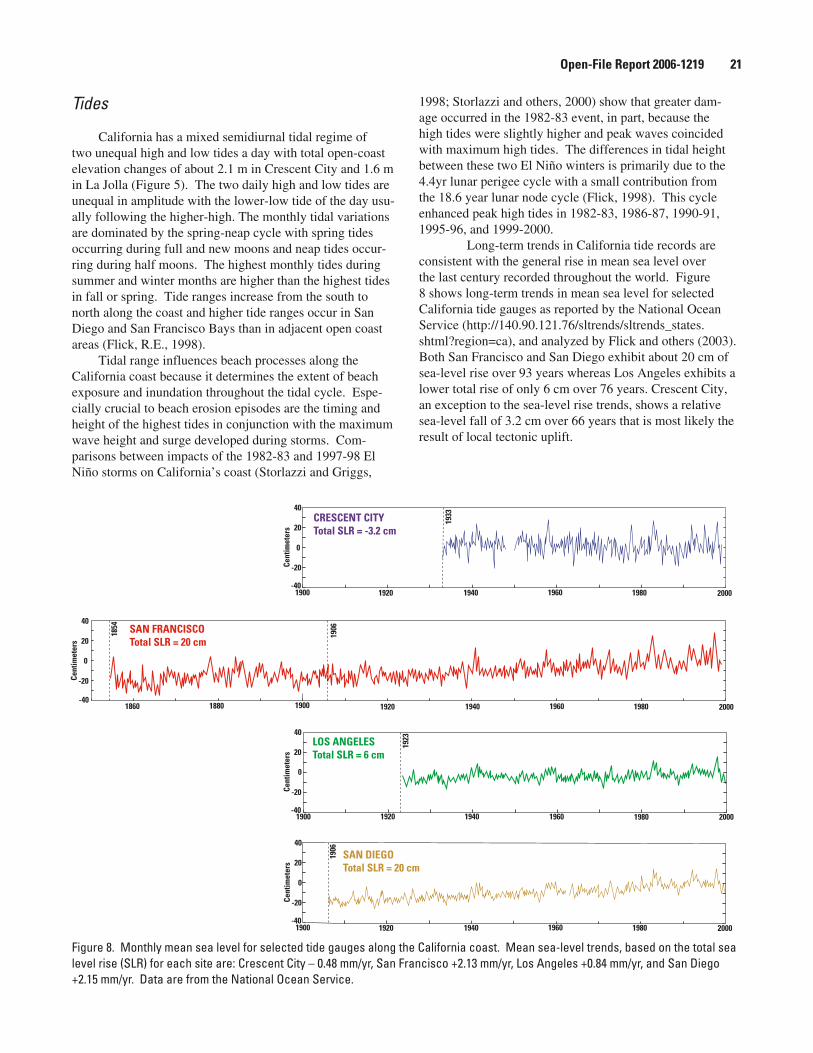
Tides
California has a mixed semidiurnal tidal regime of two unequal high and low tides a day with total open-coast elevation changes of about 2.1 m in Crescent City and 1.6 m in La Jolla (Figure 5). The two daily high and low tides are unequal in amplitude with the lower-low tide of the day usu-ally following the higher-high. The monthly tidal variations are dominated by the spring-neap cycle with spring tides occurring during full and new moons and neap tides occur-ring during half moons. The highest monthly tides during summer and winter months are higher than the highest tides in fall or spring. Tide ranges increase from the south to north along the coast and higher tide ranges occur in San Diego and San Francisco Bays than in adjacent open coast areas (Flick, R.E., 1998).
Tidal range influences beach processes along the California coast because it determines the extent of beach exposure and inundation throughout the tidal cycle. Espe-cially crucial to beach erosion episodes are the timing and height of the highest tides in conjunction with the maximum wave height and surge developed during storms. Com-parisons between impacts of the 1982-83 and 1997-98 El Niño storms on California’s coast (Storlazzi and Griggs,
1998; Storlazzi and others, 2000) show that greater dam-age occurred in the 1982-83 event, in part, because the high tides were slightly higher and peak waves coincided with maximum high tides. The differences in tidal height between these two El Niño winters is primarily due to the 4.4yr lunar perigee cycle with a small contribution from the 18.6 year lunar node cycle (Flick, 1998). This cycle enhanced peak high tides in 1982-83, 1986-87, 1990-91, 1995-96, and 1999-2000.
Long-term trends in California tide records are consistent with the general rise in mean sea level over the last century recorded throughout the world. Figure 8 shows long-term trends in mean sea level for selected California tide gauges as reported by the National Ocean Service (http://140.90.121.76/sltrends/sltrends_states.shtml?region=ca), and analyzed by Flick and others (2003). Both San Francisco and San Diego exhibit about 20 cm of sea-level rise over 93 years whereas Los Angeles exhibits a lower total rise of only 6 cm over 76 years. Crescent City, an exception to the sea-level rise trends, shows a relative sea-level fall of 3.2 cm over 66 years that is most likely the result of local tectonic uplift.
1906
1900 1920 1940 1960 1980 2000
-20
20
-40
40
Cent
imet
ers
0
SAN DIEGOTotal SLR = 20 cm
1900 1920 1940 1960 1980 2000
-20
20
-40
40
Cent
imet
ers
1923
0
LOS ANGELESTotal SLR = 6 cm
CRESCENT CITYTotal SLR = -3.2 cm
1900 1920 1940 1960 1980 2000
-20
20
-40
40
Cent
imet
ers
18801860
1854
1906
0
SAN FRANCISCOTotal SLR = 20 cm
0
1900 1920 1940 1960 1980 2000
-20
20
-40
40
Cent
imet
ers
1933
Figure 8. Monthly mean sea level for selected tide gauges along the California coast. Mean sea-level trends, based on the total sea level rise (SLR) for each site are: Crescent City – 0.48 mm/yr, San Francisco +2.13 mm/yr, Los Angeles +0.84 mm/yr, and San Diego +2.15 mm/yr. Data are from the National Ocean Service.
Open-File Report 2006-1219 21
Winds
Winds are important for generating waves that drive littoral sediment transport and for blowing sand off beaches resulting in potential sand loss from the littoral system. The wind climate of California is strongly influ-enced by the North Pacific High that creates a predominant northwesterly air flow over most of the state. The intensity and position of the North Pacific High often determines the direction and strength of winds affecting coastal California. The North Pacific High is stronger and located more north-erly during summer months and moves south and weakens during winter months, allowing storms to reach the state. Coastal wind flow is predominantly parallel to the coast either from the northwest or the southeast. When winds are from the northwest, flow is along the coast but Ekman trans-port induces an onshore component, which is strengthened by local sea breezes (Zhiqian and others, 1997). Associated with northwest winds is the creation of a jet effect in the vicinity of some of the more prominent headlands. Strong jets of air and large eddies are projected around headlands such as Point Reyes, Point Sur, and Point Arguello (Figure 5). Wind speeds in the immediate vicinity of these major headlands can be two or three times as great as the wind flow at nearby areas.
In general, wind flow from the north is more aligned with the coast, the strongest flow is pushed offshore, and there is usually no associated daily sea breeze. During strong northern flows high wind speeds extends over a large area from Northern California to Point Conception. During northeast or east flow conditions the along-coast variability is significantly larger and winds are weaker (Zhiqian and others, 1997).
These wind patterns are altered by the passage of Pacific storms most of which arrive in the winter. As a storm approaches, the cold fronts are marked by strong easterly or southeasterly winds that can reach speeds of 50 km/hr or more. After the storm passes winds turn toward the southwest. With the passage of the rare warm front, storm winds can reach 30 – 40 km/hr. In Southern Califor-nia, after the passage of a cold front, Santa Ana winds will often blow down from the north to northeast. These winds are sometimes extremely intense and can blow between 90 to 145 km/hr and extend 160 kilometers seaward. Although it is rare, when Santa Ana winds blow during the summer they produce hot and dry conditions that increase the fire danger.
Currents
The California current system forms the eastern edge of the North Pacific gyre and is primarily driven by wind stress patterns over the North Pacific Ocean (California Coastal Commission, 1997). Changes of the ocean circu-lation pattern are caused by the interactions between the
sub-tropical high pressure cell over the North Pacific and the atmospheric thermal low over California and Nevada. The interaction between these pressure regions results in a dominant southward-directed wind along the coast of Cali-fornia in spring and summer driving the California Current towards the equator (Hickey, 1979). Maximum southward wind along the California coast occurs between Cape Men-docino and San Francisco in the spring (Nelson, 1977). The associated Ekman transport moves water perpendicularly away from the coast allowing cold, nutrient-rich waters to upwell from the deep (Newberger, 1982).
During the late fall and early winter southward winds weaken, reducing upwelling and allowing a near-shore, northward-flowing current north of Point Conception called the Davidson Current, to prevail (Hickey, 1979). In the Southern California Bight (coastal Southern California and offshore waters) a counter-clockwise eddy occurs called the Southern California Countercurrent. It is a northwestward-flowing current south of Point Conception and inshore from the Channel Islands. The current runs shore parallel until it reaches Point Conception where one branch flows southwest joining the California Current and the other branch con-tinues northward as a narrow countercurrent (Newberger, 1982). The Southern California Counter current occurs in all seasons but is best developed in winter (Maloney and Chan, 1974).
Littoral cells and transport directions
The prevailing southerly transport direction for Cali-fornia littoral sediment is driven by North Pacific swell and northwest wind waves (see Figure 7). There are local reversals in this prevailing direction due to orientation of the coast and/or southerly wave events. Littoral cells are seg-ments of the coast with distinct sediment sources, defined longshore transport pathways, and sinks where the sediment is removed from the littoral system. Conceptually, the cell boundaries delineate an area where the sediment budget can be balanced for quantitative analysis. Southern California littoral cells were first defined by Inman and Chamberlain (1960) and statewide littoral cells were identified by Habel and Armstrong (1978). In California the cells are typi-cally bound by either prominent rocky headlands that block littoral transport around them, or, submarine canyons that cross the continental shelf to a shallow enough depth as to intercept alongshore moving sediment. Submarine canyons are clearly the largest sink for beach sand loss in California with an estimated removal from some of the larger canyons at: Scripps and La Jolla – 270,000 m3/yr, Mugu – 765,000 m3/yr and Monterey – 230,000 m3/yr (Griggs and others, 2005b). Once sediment enters the submarine canyon system it is permanently lost from the littoral system. Another large sediment sinks are coastal dune fields where wind-blown sand is removed from the active littoral system. However, unlike submarine canyons, subsequent erosion of the dunes can re-supply adjacent beaches with sand. Figure 9 shows
Open-File Report 2006-1219 22
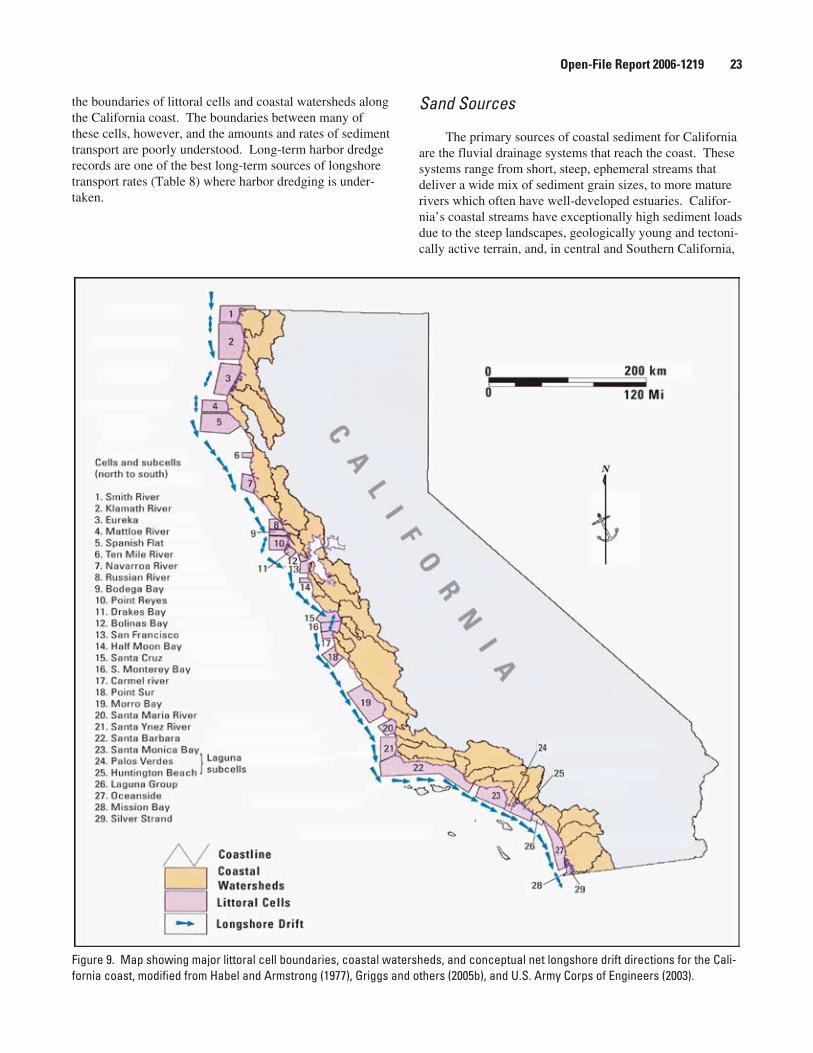
the boundaries of littoral cells and coastal watersheds along the California coast. The boundaries between many of these cells, however, and the amounts and rates of sediment transport are poorly understood. Long-term harbor dredge records are one of the best long-term sources of longshore transport rates (Table 8) where harbor dredging is under-taken.
Sand Sources
The primary sources of coastal sediment for California are the fluvial drainage systems that reach the coast. These systems range from short, steep, ephemeral streams that deliver a wide mix of sediment grain sizes, to more mature rivers which often have well-developed estuaries. Califor-nia’s coastal streams have exceptionally high sediment loads due to the steep landscapes, geologically young and tectoni-cally active terrain, and, in central and Southern California,
Figure 9. Map showing major littoral cell boundaries, coastal watersheds, and conceptual net longshore drift directions for the Cali-fornia coast, modified from Habel and Armstrong (1977), Griggs and others (2005b), and U.S. Army Corps of Engineers (2003).
Open-File Report 2006-1219 23

relatively sparse vegetation cover (Willis, 2002a). Sediment yield per size of drainage basin for California rivers is typi-cally very high when compared to other regions of the U.S.
Estimated sand and gravel discharge for the major California streams that enter the open coast is shown in Figure 10. Average annual bedload discharges range from a few thousand m3/yr for the smaller creeks to nearly 3 million m3/yr for the Eel River in northern California (Wil-lis, 2002a and b) (Figure 5). These estimates should be considered maximum estimates of beach-quality material supplied from coastal streams because of numerous uncer-tainties and assumptions, and the fact that they include sand finer than 0.125 mm which is unlikely to remain in an energetic beach environment. In addition to the rivers shown in Figure 10, the large Sacramento and San Joaquin Rivers empty into San Francisco Bay (Figure 5), the largest estuary on the west coast. A large ebb-tidal delta has formed at the entrance to the bay. Numerous smaller ungauged streams also reach the coast and can supply significant amounts of sediment because of their steep, easily erodible watersheds (Willis, 2002b). On average 70 to 95% of the beach sand in California is derived from coastal streams (Runyon and Griggs, 2002; Willis, 2002a). In general, sand and gravel discharges from coastal watersheds decrease from north to south (primarily rainfall controlled), although the Trans-verse Range has a relatively high sediment discharge (lithol-ogy and vegetation controlled). Infrequent severe floods are thought to be responsible for delivering the majority of sedi-ment to the coast and a single large storm can deliver more sand to the beaches than years of low to moderate rainfall. In addition, sediment discharge during extreme events can lead to open-coast ephemeral delta formation (Richmond, 1988) and delivery of abundant coarse-grained sediment. El Niño years are typically times of significant sediment introduction to the coast because of increased likelihood of extreme rainfall events (Inman and Jenkins, 1999).
Coastal cliffs are the next major source and sand sup-ply varies with cliff lithology and strength. In some areas such as the Oceanside littoral cell, the coastal bluffs have been found to be a major source of beach sand (Young and Ashford, 2006). Softer cliffs composed of coastal sand deposits provide the most beach quality sediment when eroded. Subordinate sources of coastal sediment include
marine planation of submerged rock, material of biologic origin such as shells, and possibly onshore transport of relict shelf sediment.
GEOMORPHOLOGY OF THE CALIFORNIA COAST
The California coast encompasses a wide range of coastal landforms a product of complex geology and dynamic coastal processes. Coastal landforms include steep cliffs, uplifted terraces, beaches, dunes, barrier spits, estuar-ies and lagoons (Figure 11).
Cliffs
Nearly three-fourths of the California coastline are backed by cliffs which fall into two broad general catego-ries: high steep cliffs and marine terraces. High cliffs occur where mountains directly border the coast such as along the Big Sur coast and most of northern California. The high cliffs may be hundreds of meters or more in height, they occupy about 13% of the California coastline, and are typi-cally composed of more resistant rock types such as granite and rocks of the Franciscan Complex (Griggs and Patsch, 2004). Marine terraces and coastal bluffs, which were dis-cussed earlier, form about 60% of the remaining coast and are common from Mendocino to San Diego. Where tectonic uplift has persisted, multiple terraces are often preserved.
Beaches
Beaches are ubiquitous features of the California coast and are important for a number of reasons: a) they act as a natural buffer that protects coastal land during storms, b) they are a valuable recreational and economic resource, and c) they provide habitat such as nesting sites for the endan-gered snowy plover and haul-outs for protected marine mammals. California beaches are not as long and continu-ous as those along passive margins (e.g. the U.S. South Atlantic and Gulf coasts) in part because the young and steep nature of the coast has not allowed enough geologic time for extensive sandy coastal plains to develop. Beach types found in California include pocket beaches, long expanses of linear to gently curved beaches, barrier spit beaches at stream mouths, and cuspate headlands. Pocket beaches are bound by headlands, and occur in both small stream valley and cliffed-coast settings. Pocket beaches are probably the most common beach type in California, although their total length is smaller than the total length of California’s linear beaches. Long expanses of beach typi-cally front the major dune complexes, larger stream valleys, and coastal plain or concaved areas (e.g. Monterey Bay and
Table 8. Estimated annual littoral drift rates and directions along the California Coast (after Griggs and others, 2005b).
Location Annual Rate (m3) Direction
Santa Cruz 230,000 East
Santa Barbara 230,000 East
Ventura 460,000-765,000 Southeast
Santa Monica 210,000 Southeast
Oceanside 270,000 South
Open-File Report 2006-1219 2�

Santa Monica Bay). Cliffed coastlines can be fronted by both permanent and seasonal beaches. Permanent beaches occur where there is abundant sediment supply, both along-shore and offshore. Seasonal beaches, which typically are present in the summer months and are lost during winter months, are common along exposed coasts with a limited offshore supply of sand.
Because of the relatively high wave energy and a steeper and narrower continental shelf along the California coast, pronounced deltas do not form. Instead, barrier spits and ebb and tidal bars develop where the streams reach the sea. Beaches that form at the mouths of stream valleys and embayments are typically a mixture of both fluvial- and littoral-derived sediment (mostly sand). The barriers are typically barren to sparsely vegetated indicating an unstable
substrate prone to occasional marine overwash and breach-ing. Seasonal changes in wave climate and rainfall result in a concomitant change in barrier style. In winter, periods of high waves and heavy rainfall cause overwash and chan-nelization of the barrier spits, reducing their overall size. During the summer months, there are smaller waves and low precipitation and the barrier spits may completely block stream mouths due to reduced stream flow and beach accre-tion.
Seasonal beach change in California is caused by annual variations in wave climate that produce narrow beaches during winter months and wide beaches during the calmer summer months (Dingler and Reiss, 2002). Dra-matic beach erosion, both in rate and amount, occurs during large storms. Subsequent recovery is less rapid, often
3,0001,0000 1,200 1,400
1371,275
256
52540
2,900178
77160
1407
4346
3742529
199
200 400 600 800
46265
78912
5026
259
4596
12233131
105
32
Smith R.Klamath R.
Redwood Cr.Little R.
Mad R.Eel R.
Mattole R.Noyo R.
Navarro R.Russian R.
Pescadero Cr.San Lorenzo R.
Pajaro R.Salinas R.
Carmel R.Arroyo GrandeSanta Maria R.San Antonio Cr.Santa Ynez R.
Ventura R.Santa Clara R.
Calleguas Cr.Malibu Cr.Ballona Cr.
Los Angeles R.San Gabriel R.Santa Ana R.San Diego Cr.San Juan Cr.
Santa Margarita R.San Luis Rey R.San Dieguito R.
San Diego R.Tijuana R.
Average annual sand and gravel discharge (1000 * m3/yr)
3,0001,0000 1,200 1,400200 400 600 800
Figure 10. Average annual sand and gravel discharge from major rivers in California.
Open-File Report 2006-1219 2�
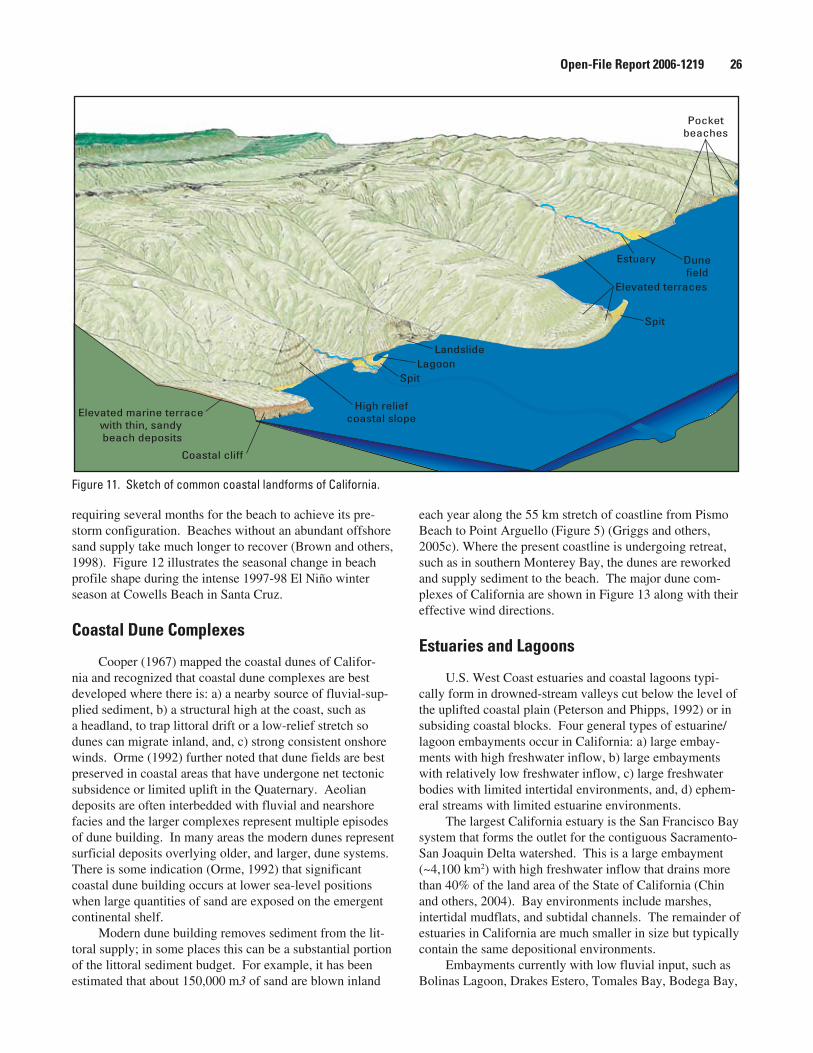
requiring several months for the beach to achieve its pre-storm configuration. Beaches without an abundant offshore sand supply take much longer to recover (Brown and others, 1998). Figure 12 illustrates the seasonal change in beach profile shape during the intense 1997-98 El Niño winter season at Cowells Beach in Santa Cruz.
Coastal Dune Complexes
Cooper (1967) mapped the coastal dunes of Califor-nia and recognized that coastal dune complexes are best developed where there is: a) a nearby source of fluvial-sup-plied sediment, b) a structural high at the coast, such as a headland, to trap littoral drift or a low-relief stretch so dunes can migrate inland, and, c) strong consistent onshore winds. Orme (1992) further noted that dune fields are best preserved in coastal areas that have undergone net tectonic subsidence or limited uplift in the Quaternary. Aeolian deposits are often interbedded with fluvial and nearshore facies and the larger complexes represent multiple episodes of dune building. In many areas the modern dunes represent surficial deposits overlying older, and larger, dune systems. There is some indication (Orme, 1992) that significant coastal dune building occurs at lower sea-level positions when large quantities of sand are exposed on the emergent continental shelf.
Modern dune building removes sediment from the lit-toral supply; in some places this can be a substantial portion of the littoral sediment budget. For example, it has been estimated that about 150,000 m3 of sand are blown inland
each year along the 55 km stretch of coastline from Pismo Beach to Point Arguello (Figure 5) (Griggs and others, 2005c). Where the present coastline is undergoing retreat, such as in southern Monterey Bay, the dunes are reworked and supply sediment to the beach. The major dune com-plexes of California are shown in Figure 13 along with their effective wind directions.
Estuaries and Lagoons
U.S. West Coast estuaries and coastal lagoons typi-cally form in drowned-stream valleys cut below the level of the uplifted coastal plain (Peterson and Phipps, 1992) or in subsiding coastal blocks. Four general types of estuarine/lagoon embayments occur in California: a) large embay-ments with high freshwater inflow, b) large embayments with relatively low freshwater inflow, c) large freshwater bodies with limited intertidal environments, and, d) ephem-eral streams with limited estuarine environments.
The largest California estuary is the San Francisco Bay system that forms the outlet for the contiguous Sacramento-San Joaquin Delta watershed. This is a large embayment (~4,100 km2) with high freshwater inflow that drains more than 40% of the land area of the State of California (Chin and others, 2004). Bay environments include marshes, intertidal mudflats, and subtidal channels. The remainder of estuaries in California are much smaller in size but typically contain the same depositional environments.
Embayments currently with low fluvial input, such as Bolinas Lagoon, Drakes Estero, Tomales Bay, Bodega Bay,
Spit
Landslide
Elevated terraces
Pocketbeaches
Dunefield
Spit
High reliefcoastal slopeElevated marine terrace
with thin, sandy beach deposits
Coastal cliff
Estuary
Lagoon
Figure 11. Sketch of common coastal landforms of California.
Open-File Report 2006-1219 26
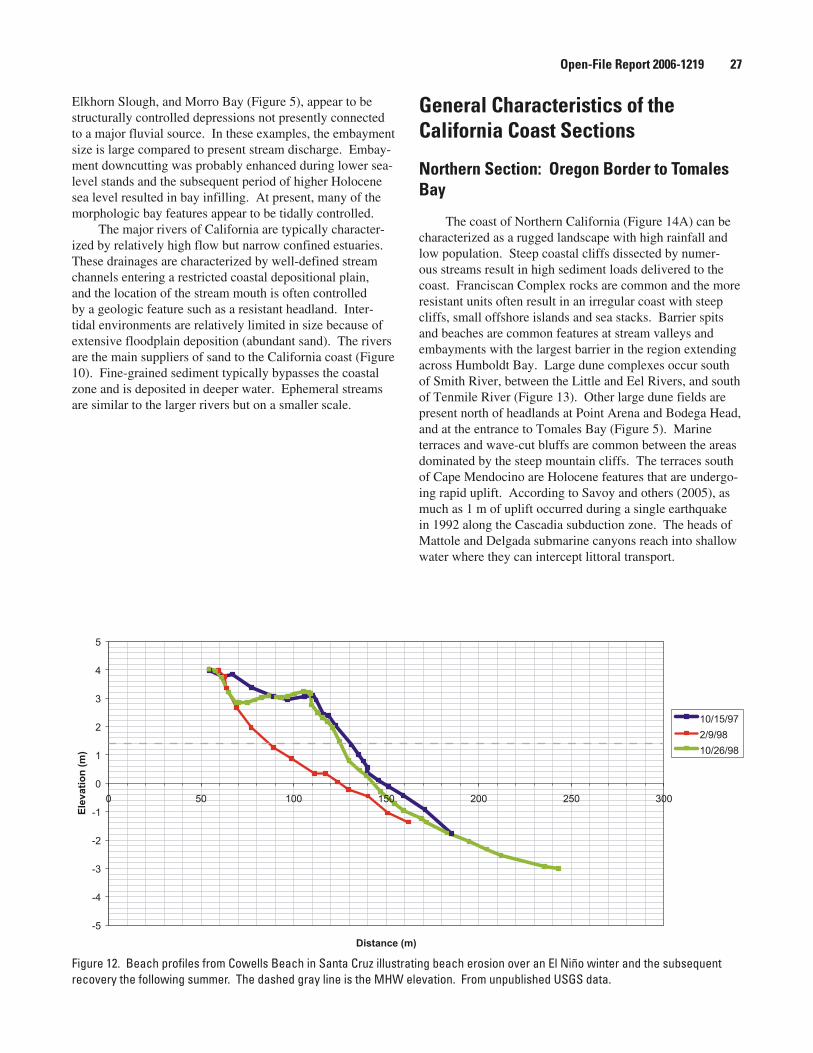
Elkhorn Slough, and Morro Bay (Figure 5), appear to be structurally controlled depressions not presently connected to a major fluvial source. In these examples, the embayment size is large compared to present stream discharge. Embay-ment downcutting was probably enhanced during lower sea-level stands and the subsequent period of higher Holocene sea level resulted in bay infilling. At present, many of the morphologic bay features appear to be tidally controlled.
The major rivers of California are typically character-ized by relatively high flow but narrow confined estuaries. These drainages are characterized by well-defined stream channels entering a restricted coastal depositional plain, and the location of the stream mouth is often controlled by a geologic feature such as a resistant headland. Inter-tidal environments are relatively limited in size because of extensive floodplain deposition (abundant sand). The rivers are the main suppliers of sand to the California coast (Figure 10). Fine-grained sediment typically bypasses the coastal zone and is deposited in deeper water. Ephemeral streams are similar to the larger rivers but on a smaller scale.
General Characteristics of the California Coast Sections
Northern Section: Oregon Border to Tomales Bay
The coast of Northern California (Figure 14A) can be characterized as a rugged landscape with high rainfall and low population. Steep coastal cliffs dissected by numer-ous streams result in high sediment loads delivered to the coast. Franciscan Complex rocks are common and the more resistant units often result in an irregular coast with steep cliffs, small offshore islands and sea stacks. Barrier spits and beaches are common features at stream valleys and embayments with the largest barrier in the region extending across Humboldt Bay. Large dune complexes occur south of Smith River, between the Little and Eel Rivers, and south of Tenmile River (Figure 13). Other large dune fields are present north of headlands at Point Arena and Bodega Head, and at the entrance to Tomales Bay (Figure 5). Marine terraces and wave-cut bluffs are common between the areas dominated by the steep mountain cliffs. The terraces south of Cape Mendocino are Holocene features that are undergo-ing rapid uplift. According to Savoy and others (2005), as much as 1 m of uplift occurred during a single earthquake in 1992 along the Cascadia subduction zone. The heads of Mattole and Delgada submarine canyons reach into shallow water where they can intercept littoral transport.
-5
-4
-3
-2
-1
0
1
2
3
4
5
0 50 100 150 200 250 300
Distance (m)
Ele
vat
ion
(m)
10/15/97
2/9/98
10/26/98
Figure 12. Beach profiles from Cowells Beach in Santa Cruz illustrating beach erosion over an El Niño winter and the subsequent recovery the following summer. The dashed gray line is the MHW elevation. From unpublished USGS data.
Open-File Report 2006-1219 27
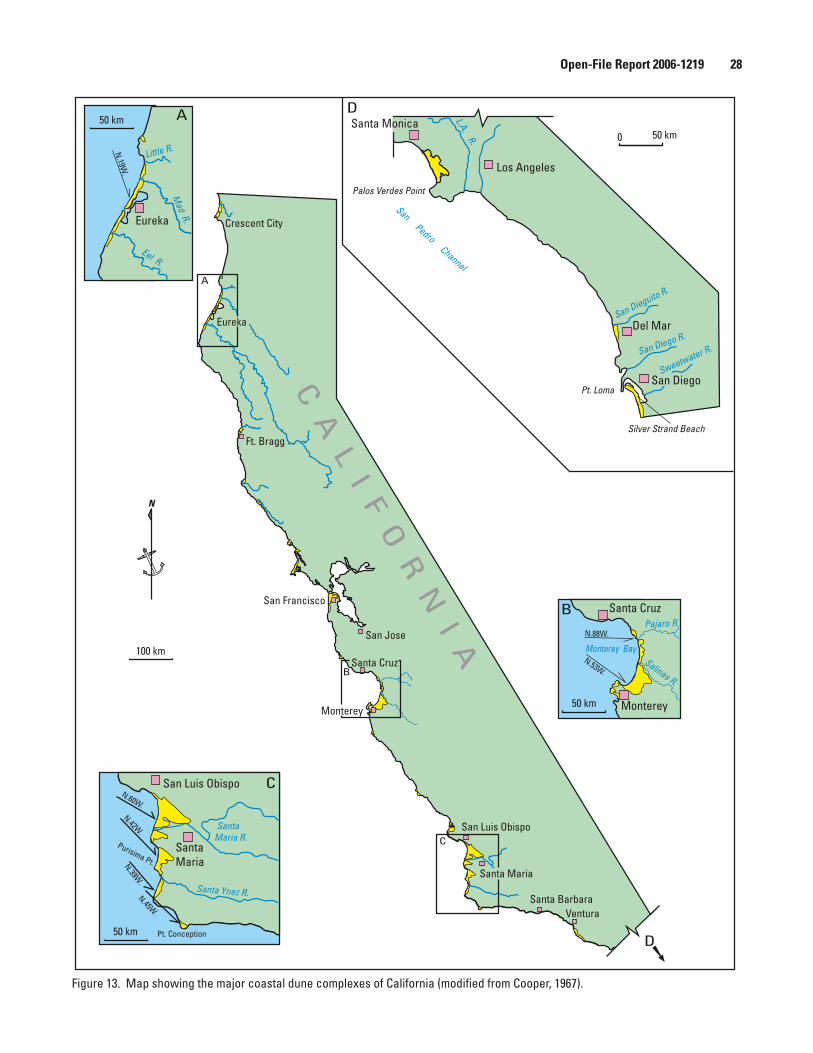
San Diego Pt. Loma
Silver Strand Beach
Del Mar San Dieguito R.
Sweetwater R. San Diego R.
Los Angeles
Palos Verdes Point
Santa Monica L.A.R.
Crescent City Eureka
Mad R.
Eel R.
Little R. N.19W
.
Santa Cruz
Monterey
Monterey Bay
Pajaro R.
Salinas R.
N.88W.
N.53W.
San Pedro Channel
San Luis Obispo
Santa Ynez R.
N.60W.
SantaMaria
SantaMaria R.
N.42W.
N.39W.
N.45W.
Pt. Conception
Purisima Pt.
Ft. Bragg
San Francisco
San Jose
Santa Cruz
Monterey
Santa Barbara Ventura
Eureka
Santa Maria
San Luis Obispo
0 50 km
100 km
50 km
50 km
50 km
NC A
L I F O R N
I A
A
A
B
B
C
C
D
D
Figure 13. Map showing the major coastal dune complexes of California (modified from Cooper, 1967).
Open-File Report 2006-1219 28

Klamath Region1 Oregon Border2 Smith River3 Crescent City4 Crescent City Harbor5 Gold Bluffs Beach6 Klamath River7 Redwood State Park8 Ossagon Creek 9 Big Lagoon County Beach10 Patrick's Point
Navarro Region21 Point Delgada 22 Sinkyone Wilderness State Park23 DeHaven Creek Beach24 Westport-Union Landing State Beach25 Ten Mile River 26 Mac Kerricher State Park27 Fort Bragg28 Nova Harbor29 Mendocino30 Manchester Beach State Park31 Point Arena
Russian River Region32 Gualala River33 Russian River34 Sonoma Coast State Beach35 Salmon Creek Beach36 Bodega Head37 Dillon Beach38 Tomales Point
Eureka Region11 Trinidad Head12 Little River13 Little River State Beach14 Mad River15 Arcata 16 Eureka17 Humbolt Bay Harbor18 Eel River State Wildlife Area19 Eel River20 Cape Mendocino
0 25 50 75 10012.5Kilometers
1
10
6
34
2
5
8
9
11
20
19
14
12
1617
13
18
21
31
27
29
28
2526
24
30
22
23
38
32
33
3536
37
34
7
15
Pacific Ocean
Figure 14A. Index map showing the four analysis regions in Northern California and various locations as discussed in the text.
Open-File Report 2006-1219 29
Central Section: Tomales Bay to Point Conception
Central California (Figure 14B) is the most diverse coastal region of the state having characteristics of both the north and south regions plus a few unique features of its own. This section represents the transition zone between the relatively wet and high wave energy north and the drier and lower wave energy southern section. Unique embayments at Tomales, San Francisco, Monterey, and Morro-Estero Bays (Figure 5) form natural harbors along the rugged coastline. Marine terraces and coastal bluffs are well devel-oped south of Point Reyes, in the Monterey Bay region, parts of the southern Big Sur coast, and stretches along the San Luis Obispo County coast. High relief coastal slopes occur at the Marin Headlands and Devils Slide north and south of San Francisco respectively, and along most of the Big Sur coast. Between Morro Bay and Point Conception, coastal mountains of the San Luis Range, Point Sal Ridge, and the Santa Ynez Mountains of the western Transverse Ranges alternate with intervening basins forming the greater Santa Maria basin. There are large dune complexes at Point Reyes, southern Monterey Bay, Morro Bay, and near the mouths of the Santa Maria and Santa Ynez Rivers (Figure 5). The Santa Maria and Santa Ynez Rivers are presently dammed resulting in a significant reduction of sediment reaching the coast from past conditions. The heads of Mon-terey, Carmel, and Partington submarine canyons lie just offshore where they are thought to be major sinks for beach sand moving alongshore.
Southern Section: Point Conception to the Mexican Border
The coast of Southern California, extending from Point Conception to the Mexican border (Figure 14C), is markedly different from the rest of the state. Point Concep-tion marks a dramatic change in coastal orientation due to tectonic movement along the Transverse Ranges that has resulted in an east-west trending coast. Further south, the coast gradually returns to the northwest-southeast trend. Coastal cliffs and marine terraces are widespread and are typically fronted by narrow beaches. Unusual boulder deltas occur in the Santa Barbara area, notably at El Capitan and Rincon (Figure 5), and are thought to be remnant flood deltas at the mouths of steep mountain creeks. The larg-est river in this section in this section is the Santa Clara River with an estimated average annual sand and gravel discharge of 912,000 m3 (Figure 10). Other notable rivers are the Ventura, Los Angeles, and Santa Ana. There are a number of submarine canyons with heads near the lit-toral zone, including: Mugu, Hueneme, Redondo, Dume, Newport, Scripps, and La Jolla canyons (Figure 5). The narrow coastal plains of the Santa Barbara area are replaced
by broader plains in Ventura-Oxnard, Santa Monica - Los Angeles Basin, and Mission Bay to Imperial Beach. The dune complexes are not as well developed as those in the rest of the state but moderately large dune fields occur near Oxnard, north of Palos Verdes, and at Silver Strand - Impe-rial beaches (Figure 5). This section is the most urbanized stretch of coast in California.
HISTORY OF INFRASTRUCTURE DEVELOPMENT
The first European to visit the coast of California is widely held to be Juan Rodriguez Cabrillo, a Portuguese explorer who is credited with the “discovery” of Califor-nia in 1542. The first permanent European settlement was established in what is now San Diego in 1769. Settlement of the coastal areas proceeded slowly in California, partly because of the dangerous nature of the Pacific coastal waters, and partly because access from inland was inhibited by the steep and rugged terrain. Northern California was settled primarily by Russian fur traders, and most coastal development in the State was restricted to large natural har-bors such as San Diego Bay, Monterey Bay, San Francisco Bay and Humboldt Bay.
By 1850, the total population of California was only 93,000. Population grew over the years, but there was an explosion following World War II; the State’s population increased from 10 to 20 million between 1950 and 1970 (Pincetl, 2004) and in 2005 is about 36 million. Today, California is the most populous state in the union, and it is estimated that 80% of California residents live within 50 km of the coast (Griggs, 1994).
Much of the coast of Central and Northern California is very rugged, inaccessible and therefore undeveloped. This results in the focusing of developmental pressures over a smaller percentage of the coast resulting in variations in coastal hazards. Along much of the Northern California coast, the most important coastal hazards are large land-slides that can damage coastal roads, and the rapid retreat of coastal cliffs where community infrastructure exists at the top or base of the cliff. Central California has a mixture of hazards; in addition to large coastal landslides and coastal cliff erosion, there are linear stretches of sandy shoreline that have been developed with homes and infrastructure. Southern California, which has the greatest percent of sandy shorelines also has the greatest percent of coastal armor-ing, engineering structures and nourishment programs. The wide, sandy beaches that exist today in Southern California were created and are maintained through a variety of coastal engineering projects and nourishment programs (Flick, 1993).
Practices such as damming coastal rivers and building various coastal engineering structures (groins, jetties and breakwaters) may be adversely affecting beach resources. During the post-World War II building boom, many homes
Open-File Report 2006-1219 30
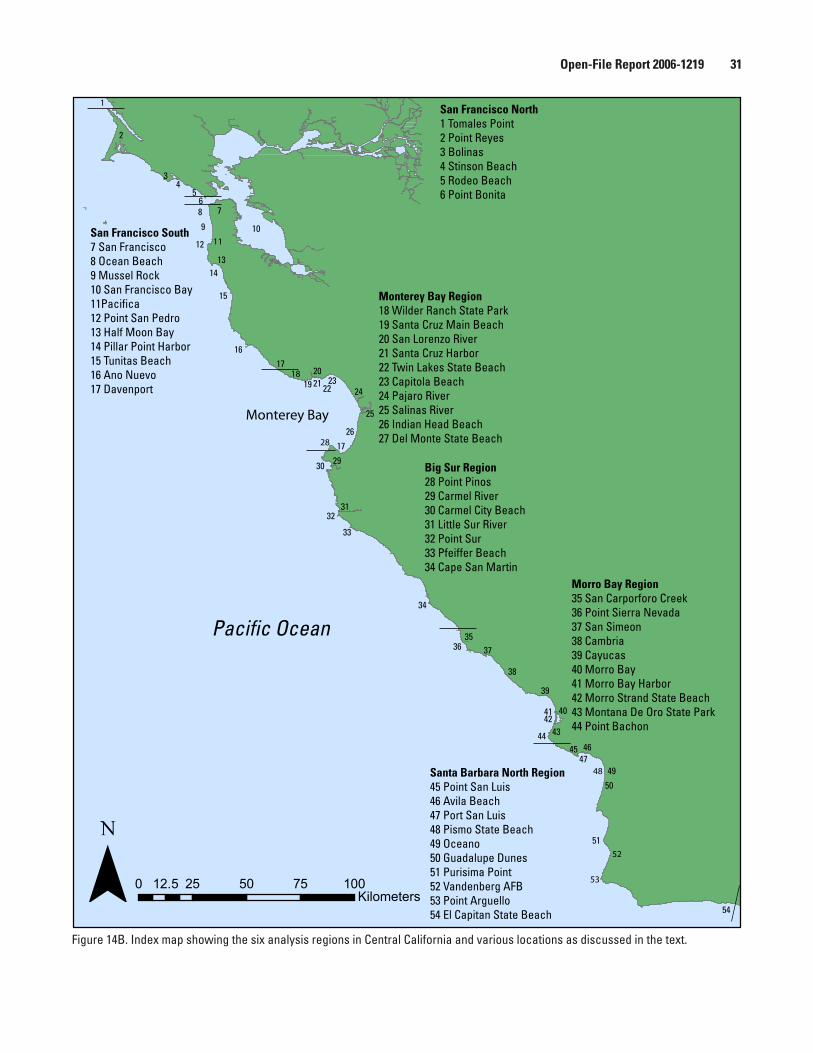
Figure 14B. Index map showing the six analysis regions in Central California and various locations as discussed in the text.
Monterey Bay
0 25 50 75 10012.5Kilometers
San Francisco North1 Tomales Point2 Point Reyes3 Bolinas4 Stinson Beach5 Rodeo Beach6 Point Bonita
San Francisco South7 San Francisco8 Ocean Beach9 Mussel Rock10 San Francisco Bay11Pacifica12 Point San Pedro13 Half Moon Bay14 Pillar Point Harbor15 Tunitas Beach16 Ano Nuevo17 Davenport
Monterey Bay Region18 Wilder Ranch State Park19 Santa Cruz Main Beach20 San Lorenzo River 21 Santa Cruz Harbor22 Twin Lakes State Beach23 Capitola Beach24 Pajaro River 25 Salinas River26 Indian Head Beach27 Del Monte State Beach
Big Sur Region28 Point Pinos 29 Carmel River 30 Carmel City Beach31 Little Sur River32 Point Sur33 Pfeiffer Beach34 Cape San Martin
Morro Bay Region35 San Carporforo Creek36 Point Sierra Nevada37 San Simeon 38 Cambria39 Cayucas40 Morro Bay41 Morro Bay Harbor42 Morro Strand State Beach43 Montana De Oro State Park44 Point Bachon
Santa Barbara North Region45 Point San Luis46 Avila Beach47 Port San Luis48 Pismo State Beach49 Oceano 50 Guadalupe Dunes51 Purisima Point52 Vandenberg AFB53 Point Arguello54 El Capitan State Beach
1
56
2
34
10
17
13
7
11
14
8
12
9
15
16
18
17
2120
19 2223
26
24
25
28
34
2930
3132
33
44
4243
37
38
39
40
3536
41
45
54
46
4847
49
50
52
53
51
Pacific Ocean
Open-File Report 2006-1219 31
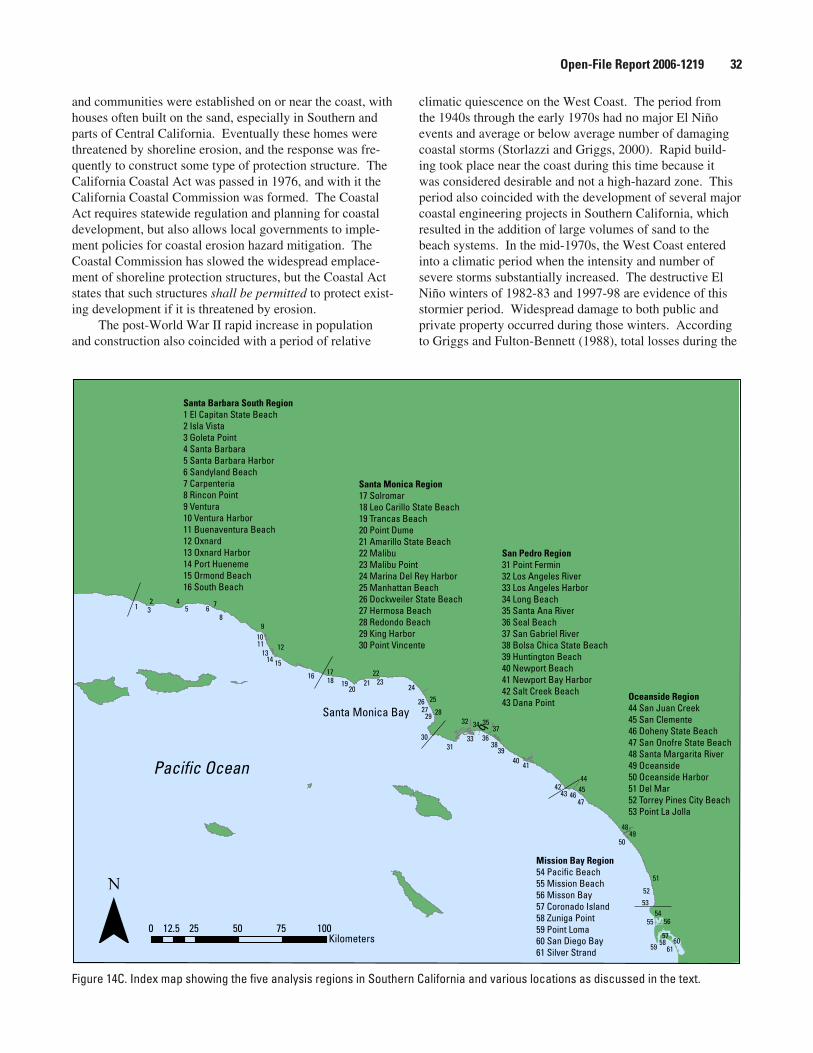
and communities were established on or near the coast, with houses often built on the sand, especially in Southern and parts of Central California. Eventually these homes were threatened by shoreline erosion, and the response was fre-quently to construct some type of protection structure. The California Coastal Act was passed in 1976, and with it the California Coastal Commission was formed. The Coastal Act requires statewide regulation and planning for coastal development, but also allows local governments to imple-ment policies for coastal erosion hazard mitigation. The Coastal Commission has slowed the widespread emplace-ment of shoreline protection structures, but the Coastal Act states that such structures shall be permitted to protect exist-ing development if it is threatened by erosion.
The post-World War II rapid increase in population and construction also coincided with a period of relative
climatic quiescence on the West Coast. The period from the 1940s through the early 1970s had no major El Niño events and average or below average number of damaging coastal storms (Storlazzi and Griggs, 2000). Rapid build-ing took place near the coast during this time because it was considered desirable and not a high-hazard zone. This period also coincided with the development of several major coastal engineering projects in Southern California, which resulted in the addition of large volumes of sand to the beach systems. In the mid-1970s, the West Coast entered into a climatic period when the intensity and number of severe storms substantially increased. The destructive El Niño winters of 1982-83 and 1997-98 are evidence of this stormier period. Widespread damage to both public and private property occurred during those winters. According to Griggs and Fulton-Bennett (1988), total losses during the
Figure 14C. Index map showing the five analysis regions in Southern California and various locations as discussed in the text.
Santa Barbara South Region1 El Capitan State Beach2 Isla Vista3 Goleta Point4 Santa Barbara5 Santa Barbara Harbor6 Sandyland Beach7 Carpenteria8 Rincon Point9 Ventura 10 Ventura Harbor11 Buenaventura Beach12 Oxnard13 Oxnard Harbor14 Port Hueneme15 Ormond Beach16 South Beach
Santa Monica Region17 Solromar18 Leo Carillo State Beach19 Trancas Beach20 Point Dume21 Amarillo State Beach22 Malibu23 Malibu Point24 Marina Del Rey Harbor25 Manhattan Beach26 Dockweiler State Beach27 Hermosa Beach28 Redondo Beach29 King Harbor30 Point Vincente
San Pedro Region31 Point Fermin32 Los Angeles River33 Los Angeles Harbor34 Long Beach35 Santa Ana River36 Seal Beach37 San Gabriel River38 Bolsa Chica State Beach39 Huntington Beach40 Newport Beach41 Newport Bay Harbor42 Salt Creek Beach43 Dana Point
Oceanside Region44 San Juan Creek45 San Clemente46 Doheny State Beach47 San Onofre State Beach48 Santa Margarita River49 Oceanside50 Oceanside Harbor51 Del Mar52 Torrey Pines City Beach53 Point La Jolla
Mission Bay Region54 Pacific Beach 55 Mission Beach56 Misson Bay57 Coronado Island58 Zuniga Point59 Point Loma60 San Diego Bay61 Silver Strand
Pacific Ocean
Santa Monica Bay
12 4
9
12
3 5 67
8
10
1314
11
15
16
0 25 50 75 10012.5Kilometers
20
30
22
25
28
24
1718 19 21 23
2726
29
31
41
33
343237
35
36
3938
40
4342
53
45
49
51
50
4647
48
44
52
59
56
6160
5455
58
q
57
Open-File Report 2006-1219 32
winter of 1982-83 reached $200 million (in 2006 dollars), and numerous houses, businesses and existing coastal pro-tection structures were damaged.
HISTORICAL SHORELINE CHANGE ANALYSIS
This section presents the results of the California sandy shoreline (herein referred to as shoreline) change analysis and discusses, where applicable, the effects of engineering structures and beach nourishment programs on the rates of shoreline change. Each California section (Northern, Central and Southern) is subdivided into regions (Figure 1), which are based broadly on littoral cells and breaks in data cover-age. Tables 6A-C summarize both long-term and short-term average rates of shoreline change within each region. Addi-tionally, Tables 7A-C present the maximum and minimum erosion and accretion rates for each region in California.
The description of shoreline change includes informa-tion and discussion on human-induced changes. Most of the substantial erosion/accretion trends and/or reversals in trend are related to human intervention within the natural coastal system; these are virtually inseparable topics of discussion. In California, shorelines are eroding primarily because of an increase in storm intensity, sea-level rise, climatic changes, and as a consequence of human activities that disrupt the natural sediment supply.
In the discussions below, rates are referenced from Tables 6A-C and 7A-C, where shoreline change rates are presented as the region-average net rate for the long-term (1800s-1998/2001) and short-term (1950s/70s – 1998/2001) analysis, as well as by the magnitude of the erosion-only and accretion-only rates. Errors and uncertainty values are not shown in the text for clarity; refer to Table 6A-C for these values. To compare how net trends and rates may have changed from the long-term to the short-term, a statistical t-test was performed to determine whether the long-term and short-term rates were significantly different from one another at the 90% confidence interval. The t-test results found that in all regions except the San Pedro region, the change from long-term to short-term was statistically significant. Within the remaining 14 regions, the net shore-line change rate became more erosional from the long-term to the short-term with the exception of the Russian River region.
The average net rate of long-term shoreline change for California was 0.2 m/yr, an accretional trend. This is based on shoreline change rates averaged from 14,562 individual transects, of which 40% were eroding. Our analysis found that the only regions in California that experienced long-term negative net shoreline change were in Central Califor-nia (San Francisco South and Monterey Bay regions), both with region-averaged rates of –0.2 m/yr (Table 6B). The highest region-averaged net rate was measured in the San Diego region (0.9 m/yr). Overall, Central California had
the lowest overall net long-term shoreline change, likely because of the lack of major coastal engineering projects, such as those that result in more accretional rates in South-ern California by adding sediment to the littoral system. In addition, the high volumes of sediment input from rivers likely contribute to the lower overall erosional trend in Northern California. When the erosion versus accretion rates were separated out, the average long-term erosion rate for the state was found to be –0.2 m/yr.
The average net rate of short-term change for Califor-nia was -0.2 m/yr, based on 16,142 transects, along which 66% were eroding. Negative (erosional) net short-term shoreline change was measured in 10 of the 15 regions. For those transects along which erosion was recorded, the aver-age short-term erosion rate was -0.8 m/yr. The short-term average erosion rates were highest in Central California (Table 6B).
It is important to keep in mind that the change rates discussed in this report represent change measured through the date that the lidar was collected and thus may not reflect the most recent trends in shoreline change. In addition, although erosion rates in some areas are relatively low, many of California’s beaches are narrow and even a small amount of local erosion may present serious hazards to the coastal resources and community infrastructure in a given area.
Northern California
The Northern California analysis extends from the Ore-gon border to Tomales Bay, a distance of approximately 550 km (Figure 1). For the presentation of the shoreline change analysis Northern California was divided into four regions: Klamath, Eureka, Navarro and Russian River (Figure 14A).
Much of Northern California is highly crenulated, rocky coastline with small sections of pocket beaches, except for near major river mouths such as the Klamath, Smith, Eel and Russian Rivers, and a few areas where steep coastal cliffs are fronted by narrow beaches. As a result of this geomorphology, there were many gaps in the data; the long-term change was measured along only 148 km of the shoreline, and short-term change over 168 km. Both long-term (0.5 m/yr) and short-term (0.3 m/yr) net shoreline change rates were accretional when averaged over all of the Northern California transects. Of the 2,966 transects along which long-term shoreline change was measured, 23% had erosional trends, with an average erosion rate of –0.3 m/yr (Table 6A). For the short-term analysis, the percent of beach eroding more than doubles, increasing to 47% and the average short-term erosion rate was –0.6 m/yr.
Klamath Region
The Klamath region covers approximately 112 km of coastline and extends from the Oregon border to Patrick’s
Open-File Report 2006-1219 33
Point (Figure 1). This region lies within the Smith and Klamath littoral cells (Figure 9), where rivers of the same names supply abundant sediment to the beach systems. The coastline here is sparsely developed, except for the area around Crescent City, and includes long stretches of State and National Park lands. The only significant engineering structures are the breakwaters protecting the Crescent City Harbor. According to Clayton (1991) there is harbor sand by-passing every several years; however the frequency is not consistent. In addition, the harbor was dredged in the 1970s, and material was placed north of the harbor to attempt to slow chronic bluff erosion (Savoy and others, 2005).
For the Klamath region, long-term change rates were measured along 71.5 km of shoreline. The net long-term rate, averaged over 1,430 transects, was 0.7 m/yr. Along those transects with a long-term erosional trend, the average erosion rate was –0.4 m/yr and was found along 25% of the coast. The average long-term accretion rate, which occurred along 75% of the coast in this region, was 1.0 m/yr (Table 6A). The long-term accretion rate in the Klamath region was the highest in Northern California. The maximum long-term erosion rate (-1.2 m/yr) occurred on the shoreline of a dynamic spit that extends across much of the Klamath River mouth (Table 9A).
The average short-term net shoreline change rate in the Klamath region is accretional (0.4 m/yr). Forty-eight per-cent of the coast along which short-term shoreline change was measured was erosional, and the average erosion rate was -0.6 m/yr. The remaining 52% of the measured coast in this region had a short-term accretion rate of 1.3 m/yr. The highest short-term erosion rate, -2.6 m/yr, was along Big Lagoon Beach, north of Patrick’s Point (Table 9A; Figure 15). This area was heavily impacted during the 1982-83 El Niño winter storms (Figure 16), which may have influenced the short-term erosion rate.
The rate of net shoreline change in the Klamath region decreased from the long-term (0.7 m/yr) to the short-term (0.4 m/yr), and the percent of the coastline eroding increased from 25% in the long-term to 48% in the short-term (Table 6A).
North of the Crescent City Harbor, shoreline change becomes increasingly erosional in both the long- and short-term periods (Figure 15) near the harbor as opposed to areas further north. The highest accretion rates north of Crescent City were located immediately south of the Smith River mouth where there are extensive dune systems. There were local increases in the rates of accretion adjacent to the north and south breakwaters of the Crescent City Harbor (Figure 15). This area is composed of broad tidal flats, and the high rates may have been a function of the tide level when the shoreline data were collected.
South of the Klamath River mouth, the magnitude of shoreline change increased substantially. At the northern end of Redwood State Park where Ossagon Creek empties onto the beach at Gold Bluffs Beach, the highest accretion rates in the State were observed (4.8 m/yr long-term and 7.3 m/yr short-term). While most of the high accretion rates in other parts of the State were associated with engineering structures or beach nourishment, the accretion rates here were apparently natural.
Eureka Region
The Eureka region, which begins 6 km south of Trini-dad Head and extends 74 km south to Cape Mendocino (Figures 14A and 17) falls within the Eureka littoral cell. Most of the coastline consists of sandy beaches as compared with the other Northern California regions. Long, linear beaches, dunes systems and spits have formed through deposition of sand by the Eel, Mad and Little Rivers. While still sparsely developed by California standards, the Eureka
Region Long-term(m/yr)
Location Short-term(m/yr)
Location
Klamath Max. erosion -1.2
Klamath River mouth, south side-2.6
Big Lagoon Beach, 3.0 km north of Patrick’s Point
Max. accretion 4.8Gold Bluffs Beach, Prairie Creek Redwoods State Park
7.3Gold Bluffs Beach, Prairie Creek Redwoods State Park
Eureka Max. erosion -0.4 Eel River mouth, south side -2.7 North Spit Beach, 0.8 km north of
Humboldt Bay jetty Max. accretion 2.5 Little River mouth, south side 4.7 Little River mouth, south side
Navarro Max. erosion -0.6 DeHaven Creek Beach -1.4 DeHaven Creek Beach Max. accretion 0.7 Ten Mile Beach, 0.6 km south of the
Ten Mile River mouth 3.3 Ten Mile Beach, north side of Ten Mile River mouth
Russian River Max. erosion -0.7 Sonoma Coast State Beach, 1.3 km
south of Russian River mouth -1.6 Sonoma Coast State Beach, 1.5 km south of the Russian River mouth
Max. accretion 1.8 Dillon Beach 3.5 Dillon Beach
Table 9A. Maximum and minimum shoreline change rates: Northern California
Open-File Report 2006-1219 3�
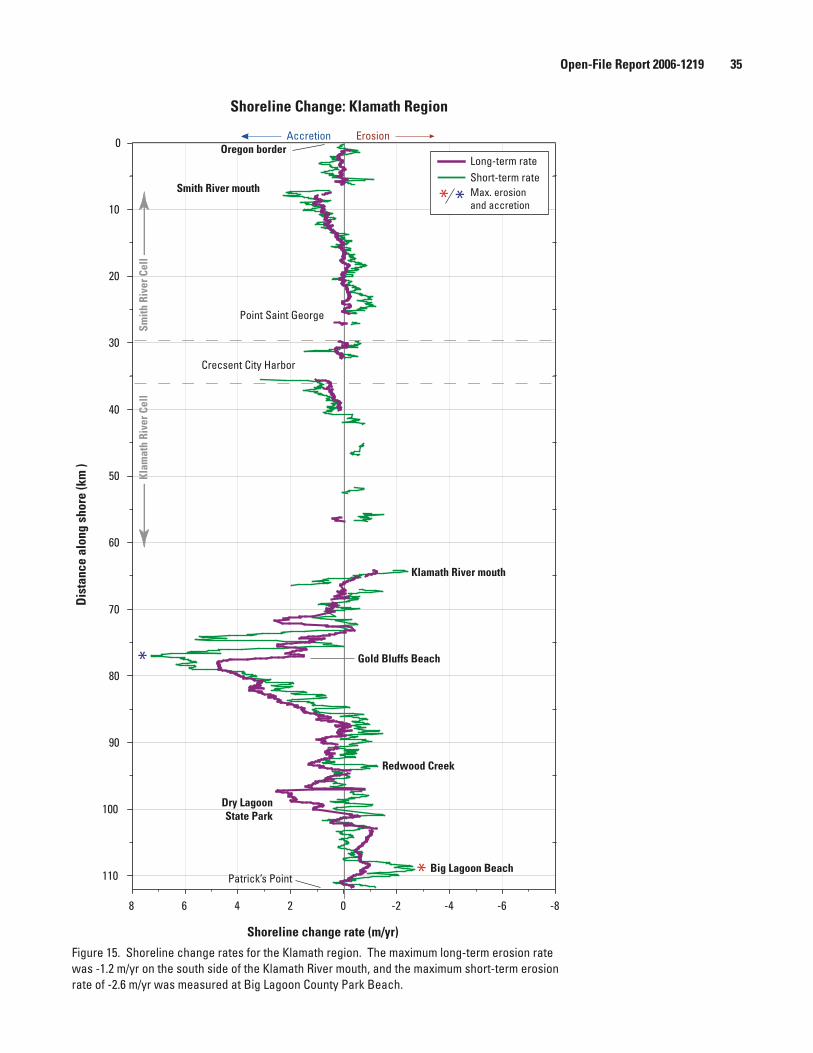
Shoreline change rate (m/yr)
-8-6-4-202468
Dis
tanc
e al
ong
shor
e (k
m)
0
10
20
30
40
50
60
70
80
90
100
110
Shoreline Change: Klamath Region
Crecsent City Harbor
Klam
ath
Rive
r Cel
lSm
ith R
iver
Cel
l
Patrick’s Point
Oregon borderErosionAccretion
Smith River mouth
Point Saint George
Klamath River mouth
Gold Bluffs Beach
Redwood Creek
Dry LagoonState Park
Big Lagoon Beach
Short-term rateLong-term rate
* * Max. erosion and accretion
*
*
Figure 15. Shoreline change rates for the Klamath region. The maximum long-term erosion rate was -1.2 m/yr on the south side of the Klamath River mouth, and the maximum short-term erosion rate of -2.6 m/yr was measured at Big Lagoon County Park Beach.
Open-File Report 2006-1219 3�
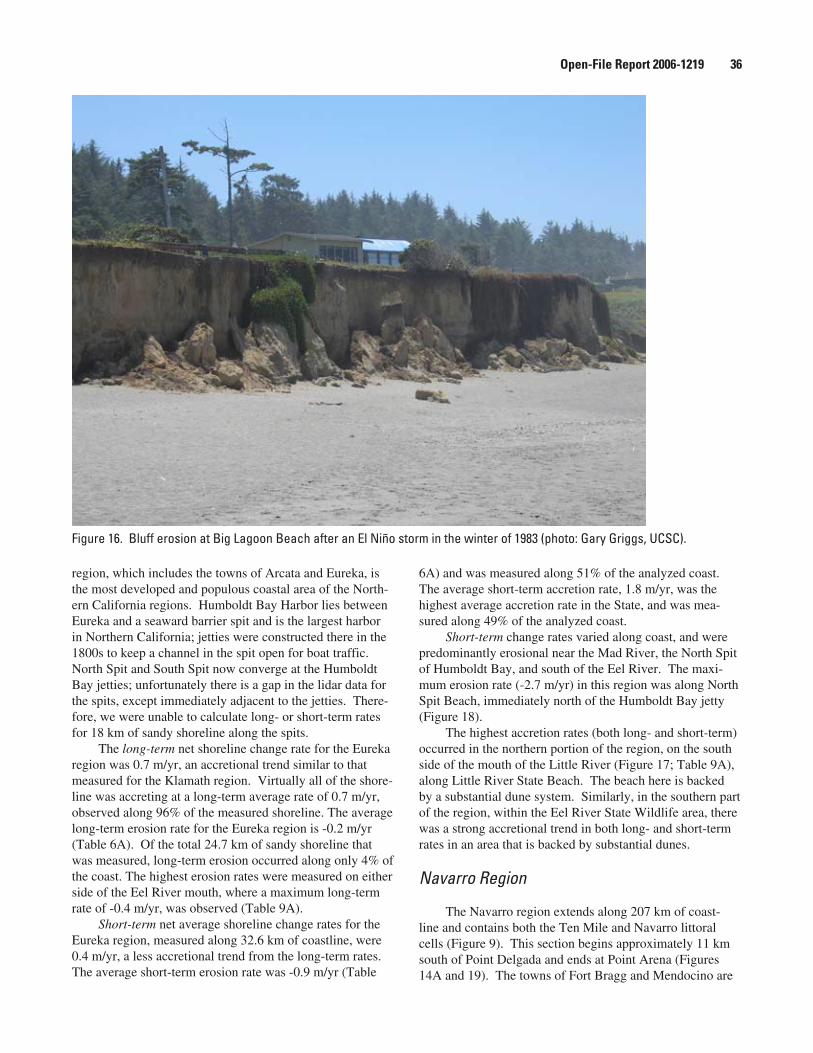
region, which includes the towns of Arcata and Eureka, is the most developed and populous coastal area of the North-ern California regions. Humboldt Bay Harbor lies between Eureka and a seaward barrier spit and is the largest harbor in Northern California; jetties were constructed there in the 1800s to keep a channel in the spit open for boat traffic. North Spit and South Spit now converge at the Humboldt Bay jetties; unfortunately there is a gap in the lidar data for the spits, except immediately adjacent to the jetties. There-fore, we were unable to calculate long- or short-term rates for 18 km of sandy shoreline along the spits.
The long-term net shoreline change rate for the Eureka region was 0.7 m/yr, an accretional trend similar to that measured for the Klamath region. Virtually all of the shore-line was accreting at a long-term average rate of 0.7 m/yr, observed along 96% of the measured shoreline. The average long-term erosion rate for the Eureka region is -0.2 m/yr (Table 6A). Of the total 24.7 km of sandy shoreline that was measured, long-term erosion occurred along only 4% of the coast. The highest erosion rates were measured on either side of the Eel River mouth, where a maximum long-term rate of -0.4 m/yr, was observed (Table 9A).
Short-term net average shoreline change rates for the Eureka region, measured along 32.6 km of coastline, were 0.4 m/yr, a less accretional trend from the long-term rates. The average short-term erosion rate was -0.9 m/yr (Table
6A) and was measured along 51% of the analyzed coast. The average short-term accretion rate, 1.8 m/yr, was the highest average accretion rate in the State, and was mea-sured along 49% of the analyzed coast.
Short-term change rates varied along coast, and were predominantly erosional near the Mad River, the North Spit of Humboldt Bay, and south of the Eel River. The maxi-mum erosion rate (-2.7 m/yr) in this region was along North Spit Beach, immediately north of the Humboldt Bay jetty (Figure 18).
The highest accretion rates (both long- and short-term) occurred in the northern portion of the region, on the south side of the mouth of the Little River (Figure 17; Table 9A), along Little River State Beach. The beach here is backed by a substantial dune system. Similarly, in the southern part of the region, within the Eel River State Wildlife area, there was a strong accretional trend in both long- and short-term rates in an area that is backed by substantial dunes.
Navarro Region
The Navarro region extends along 207 km of coast-line and contains both the Ten Mile and Navarro littoral cells (Figure 9). This section begins approximately 11 km south of Point Delgada and ends at Point Arena (Figures 14A and 19). The towns of Fort Bragg and Mendocino are
Figure 16. Bluff erosion at Big Lagoon Beach after an El Niño storm in the winter of 1983 (photo: Gary Griggs, UCSC).
Open-File Report 2006-1219 36
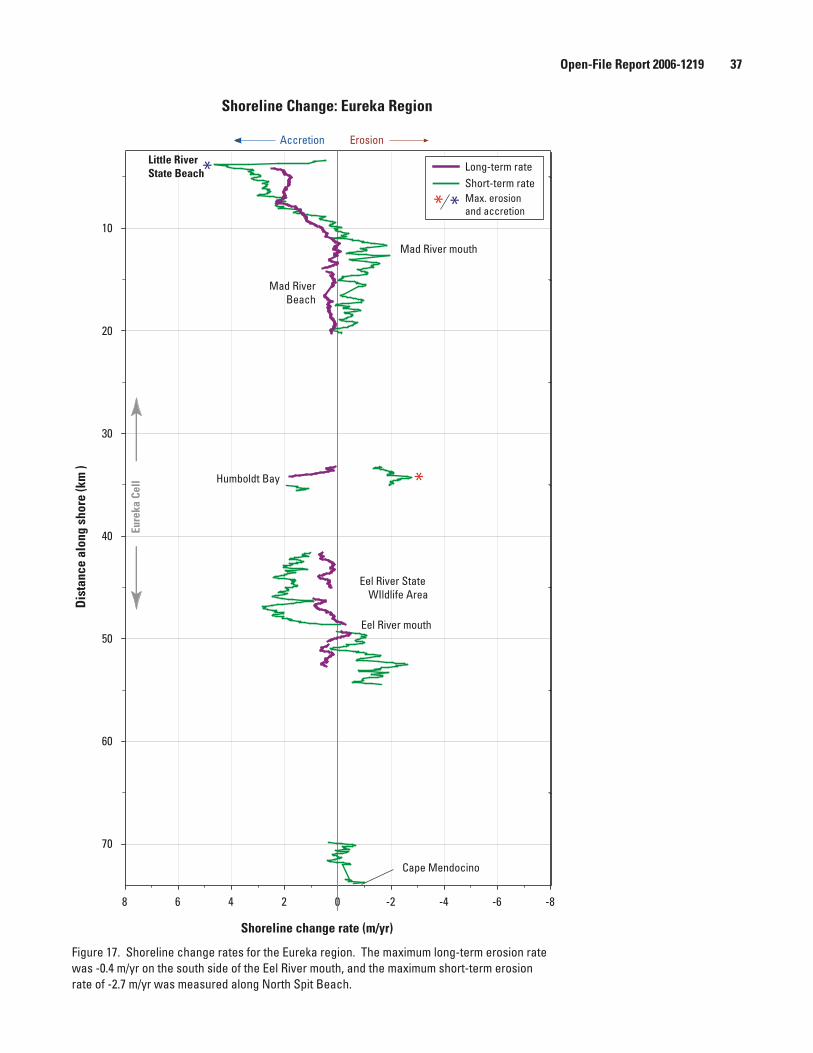
Shoreline change rate (m/yr)
-8-6-4-202468
Dis
tanc
e al
ong
shor
e (k
m)
10
20
30
40
50
60
70
Shoreline Change: Eureka Region
Humboldt Bay
Eure
ka C
ell
Little RiverState Beach
ErosionAccretion
Mad River mouth
Eel River mouth
Eel River State WIldlife Area
Mad RiverBeach
Cape Mendocino
Short-term rateLong-term rate
* * Max. erosion and accretion
*
*
Figure 17. Shoreline change rates for the Eureka region. The maximum long-term erosion rate was -0.4 m/yr on the south side of the Eel River mouth, and the maximum short-term erosion rate of -2.7 m/yr was measured along North Spit Beach.
Open-File Report 2006-1219 37
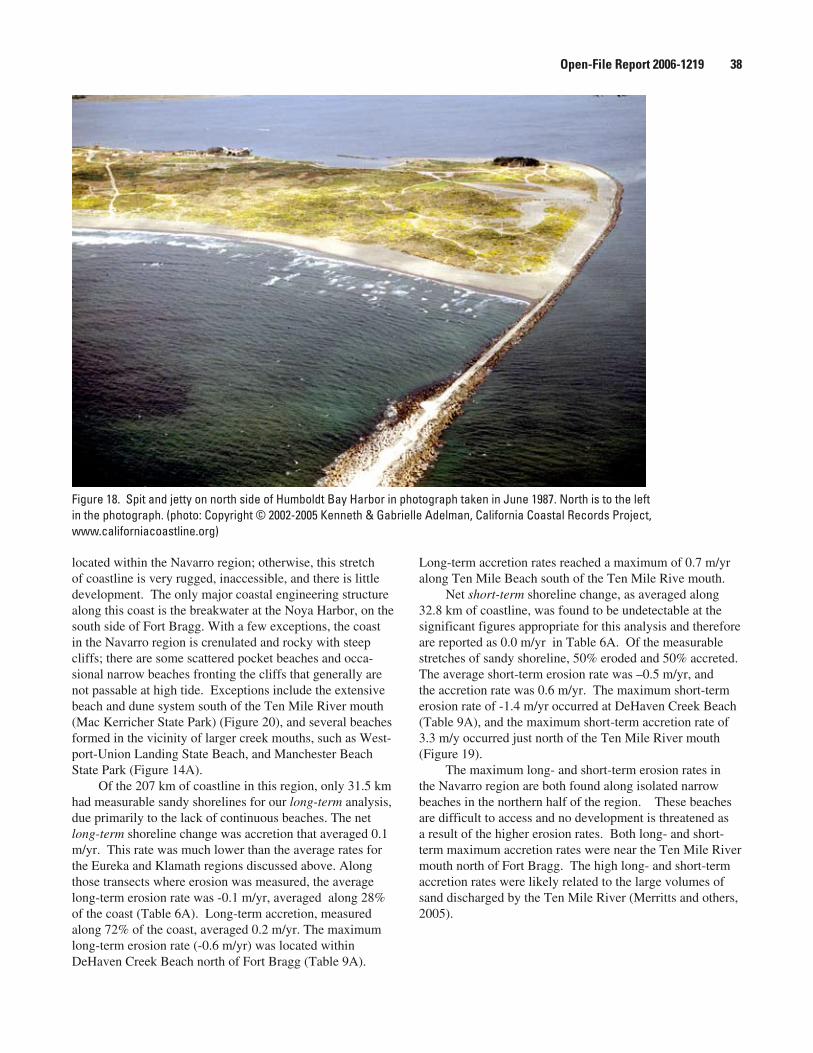
located within the Navarro region; otherwise, this stretch of coastline is very rugged, inaccessible, and there is little development. The only major coastal engineering structure along this coast is the breakwater at the Noya Harbor, on the south side of Fort Bragg. With a few exceptions, the coast in the Navarro region is crenulated and rocky with steep cliffs; there are some scattered pocket beaches and occa-sional narrow beaches fronting the cliffs that generally are not passable at high tide. Exceptions include the extensive beach and dune system south of the Ten Mile River mouth (Mac Kerricher State Park) (Figure 20), and several beaches formed in the vicinity of larger creek mouths, such as West-port-Union Landing State Beach, and Manchester Beach State Park (Figure 14A).
Of the 207 km of coastline in this region, only 31.5 km had measurable sandy shorelines for our long-term analysis, due primarily to the lack of continuous beaches. The net long-term shoreline change was accretion that averaged 0.1 m/yr. This rate was much lower than the average rates for the Eureka and Klamath regions discussed above. Along those transects where erosion was measured, the average long-term erosion rate was -0.1 m/yr, averaged along 28% of the coast (Table 6A). Long-term accretion, measured along 72% of the coast, averaged 0.2 m/yr. The maximum long-term erosion rate (-0.6 m/yr) was located within DeHaven Creek Beach north of Fort Bragg (Table 9A).
Long-term accretion rates reached a maximum of 0.7 m/yr along Ten Mile Beach south of the Ten Mile Rive mouth.
Net short-term shoreline change, as averaged along 32.8 km of coastline, was found to be undetectable at the significant figures appropriate for this analysis and therefore are reported as 0.0 m/yr in Table 6A. Of the measurable stretches of sandy shoreline, 50% eroded and 50% accreted. The average short-term erosion rate was –0.5 m/yr, and the accretion rate was 0.6 m/yr. The maximum short-term erosion rate of -1.4 m/yr occurred at DeHaven Creek Beach (Table 9A), and the maximum short-term accretion rate of 3.3 m/y occurred just north of the Ten Mile River mouth (Figure 19).
The maximum long- and short-term erosion rates in the Navarro region are both found along isolated narrow beaches in the northern half of the region. These beaches are difficult to access and no development is threatened as a result of the higher erosion rates. Both long- and short-term maximum accretion rates were near the Ten Mile River mouth north of Fort Bragg. The high long- and short-term accretion rates were likely related to the large volumes of sand discharged by the Ten Mile River (Merritts and others, 2005).
Figure 18. Spit and jetty on north side of Humboldt Bay Harbor in photograph taken in June 1987. North is to the left in the photograph. (photo: Copyright © 2002-2005 Kenneth & Gabrielle Adelman, California Coastal Records Project, www.californiacoastline.org)
Open-File Report 2006-1219 38

Shoreline change rate (m/yr)
-8-6-4-202468
Dis
tanc
e al
ong
shor
e (k
m)
10
20
30
40
50
60
70
80
90
100
110
120
130
140
150
160
170
180
190
200
Shoreline Change: Navarro Region
Ten Mile River mouth
Nav
arro
Riv
er C
ell
Ten
Mile
Rive
r Cel
l
Point Arena
ErosionAccretion
SinkyoneWilderness
State Park
Ten Mile Beach
DeHaven Creek Beach
Navarro River mouth
Manchester Beach State Park
Fort Bragg
Mendocino
Short-term rateLong-term rate
* * Max. erosion and accretion
*
*
Figure 19. Shoreline change rates for the Navarro region. The maximum long-term erosion rate was -0.6 m/yr at DeHaven Creek Beach, and the maximum short-term erosion rate of 1.4 m/yr was also measured at DeHaven Creek Beach.
Open-File Report 2006-1219 39
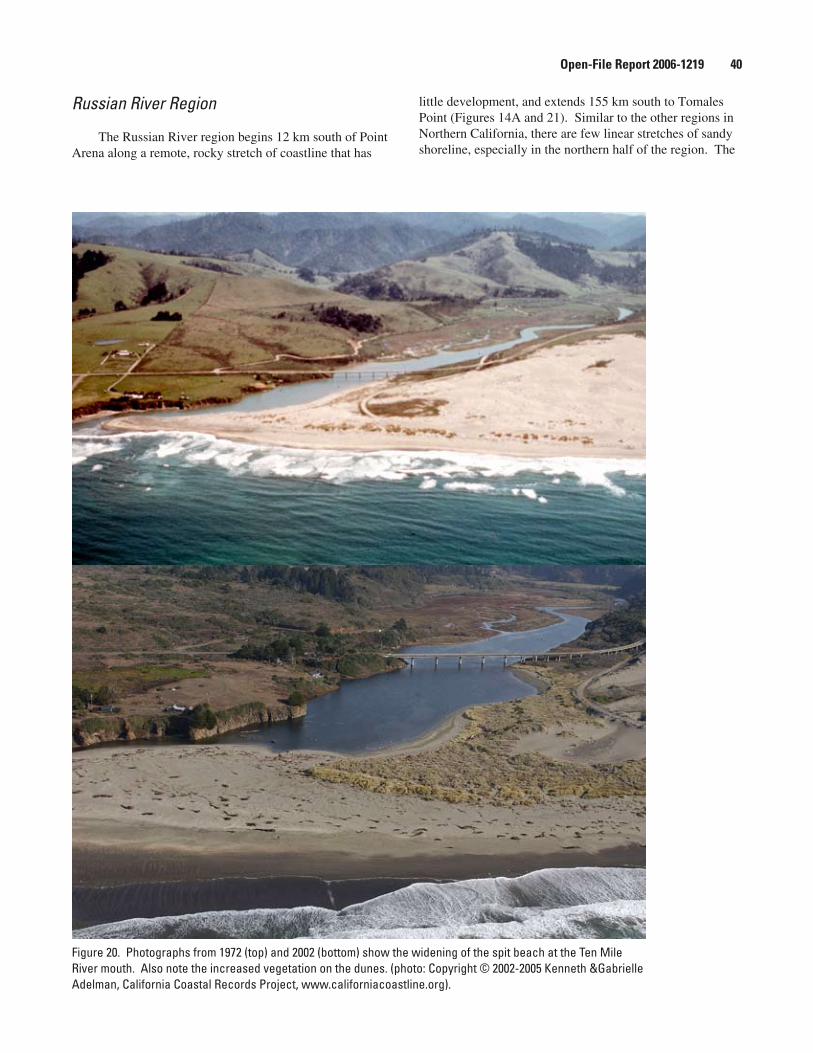
Russian River Region
The Russian River region begins 12 km south of Point Arena along a remote, rocky stretch of coastline that has
little development, and extends 155 km south to Tomales Point (Figures 14A and 21). Similar to the other regions in Northern California, there are few linear stretches of sandy shoreline, especially in the northern half of the region. The
Figure 20. Photographs from 1972 (top) and 2002 (bottom) show the widening of the spit beach at the Ten Mile River mouth. Also note the increased vegetation on the dunes. (photo: Copyright © 2002-2005 Kenneth &Gabrielle Adelman, California Coastal Records Project, www.californiacoastline.org).
Open-File Report 2006-1219 �0
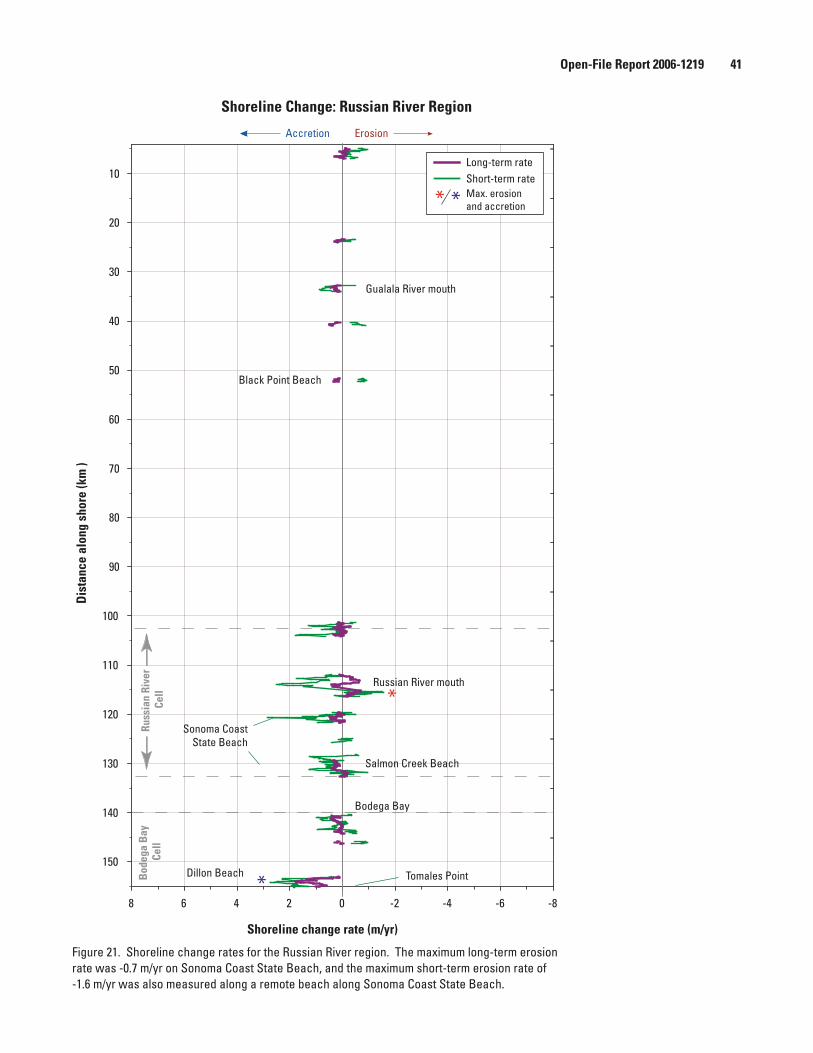
Shoreline change rate (m/yr)
-8-6-4-202468
Dis
tanc
e al
ong
shor
e (k
m)
10
20
30
40
50
60
70
80
90
100
110
120
130
140
150
Shoreline Change: Russian River Region
Gualala River mouth
Russ
ian
Rive
r Ce
ll
ErosionAccretion
Black Point Beach
Russian River mouth
Sonoma CoastState Beach
Bodega Bay
Dillon Beach Tomales PointBod
ega
Bay
Ce
ll
Salmon Creek Beach
Short-term rateLong-term rate
* * Max. erosion and accretion
*
*
Figure 21. Shoreline change rates for the Russian River region. The maximum long-term erosion rate was -0.7 m/yr on Sonoma Coast State Beach, and the maximum short-term erosion rate of -1.6 m/yr was also measured along a remote beach along Sonoma Coast State Beach.
Open-File Report 2006-1219 �1
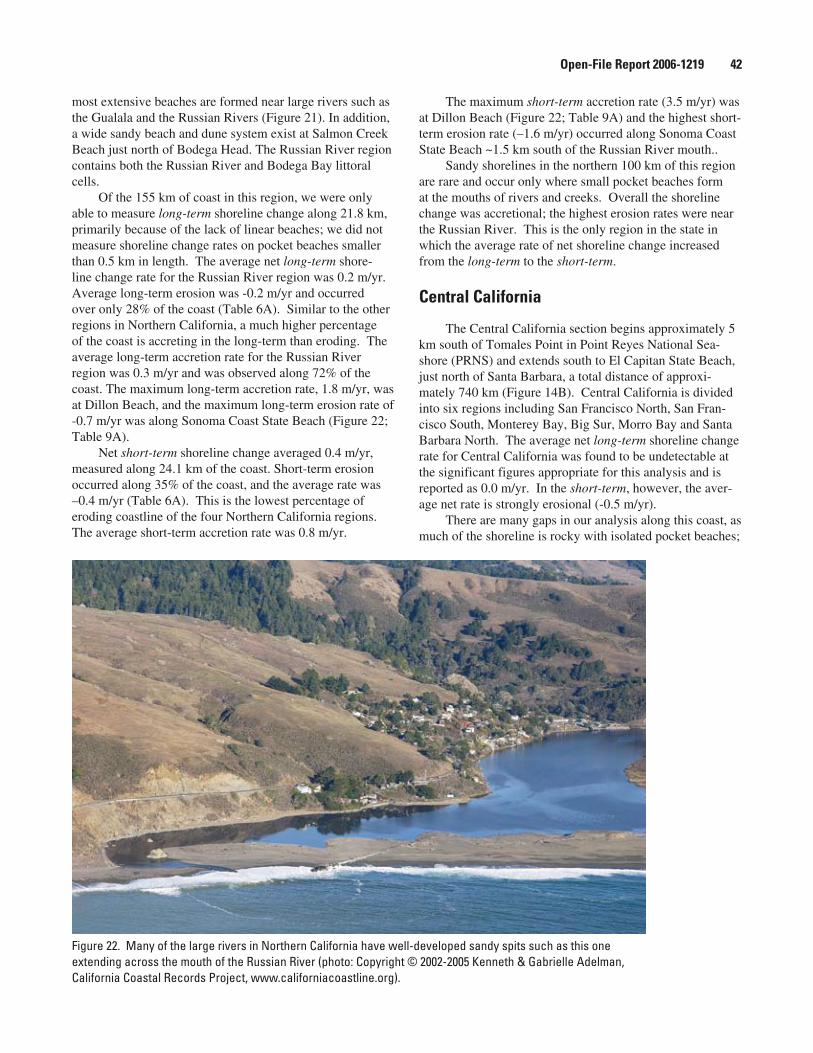
most extensive beaches are formed near large rivers such as the Gualala and the Russian Rivers (Figure 21). In addition, a wide sandy beach and dune system exist at Salmon Creek Beach just north of Bodega Head. The Russian River region contains both the Russian River and Bodega Bay littoral cells.
Of the 155 km of coast in this region, we were only able to measure long-term shoreline change along 21.8 km, primarily because of the lack of linear beaches; we did not measure shoreline change rates on pocket beaches smaller than 0.5 km in length. The average net long-term shore-line change rate for the Russian River region was 0.2 m/yr. Average long-term erosion was -0.2 m/yr and occurred over only 28% of the coast (Table 6A). Similar to the other regions in Northern California, a much higher percentage of the coast is accreting in the long-term than eroding. The average long-term accretion rate for the Russian River region was 0.3 m/yr and was observed along 72% of the coast. The maximum long-term accretion rate, 1.8 m/yr, was at Dillon Beach, and the maximum long-term erosion rate of -0.7 m/yr was along Sonoma Coast State Beach (Figure 22; Table 9A).
Net short-term shoreline change averaged 0.4 m/yr, measured along 24.1 km of the coast. Short-term erosion occurred along 35% of the coast, and the average rate was –0.4 m/yr (Table 6A). This is the lowest percentage of eroding coastline of the four Northern California regions. The average short-term accretion rate was 0.8 m/yr.
The maximum short-term accretion rate (3.5 m/yr) was at Dillon Beach (Figure 22; Table 9A) and the highest short-term erosion rate (–1.6 m/yr) occurred along Sonoma Coast State Beach ~1.5 km south of the Russian River mouth..
Sandy shorelines in the northern 100 km of this region are rare and occur only where small pocket beaches form at the mouths of rivers and creeks. Overall the shoreline change was accretional; the highest erosion rates were near the Russian River. This is the only region in the state in which the average rate of net shoreline change increased from the long-term to the short-term.
Central California
The Central California section begins approximately 5 km south of Tomales Point in Point Reyes National Sea-shore (PRNS) and extends south to El Capitan State Beach, just north of Santa Barbara, a total distance of approxi-mately 740 km (Figure 14B). Central California is divided into six regions including San Francisco North, San Fran-cisco South, Monterey Bay, Big Sur, Morro Bay and Santa Barbara North. The average net long-term shoreline change rate for Central California was found to be undetectable at the significant figures appropriate for this analysis and is reported as 0.0 m/yr. In the short-term, however, the aver-age net rate is strongly erosional (-0.5 m/yr).
There are many gaps in our analysis along this coast, as much of the shoreline is rocky with isolated pocket beaches;
Figure 22. Many of the large rivers in Northern California have well-developed sandy spits such as this one extending across the mouth of the Russian River (photo: Copyright © 2002-2005 Kenneth & Gabrielle Adelman, California Coastal Records Project, www.californiacoastline.org).
Open-File Report 2006-1219 �2

there are a few continuous linear beaches such as in the Monterey Bay region. Coastal engineering structures and nourishment projects are limited to small harbor construc-tion (e.g. Port San Luis, Santa Cruz) and some harbor by-passing. Numerous seawalls and revetment exist along the coast but these are primarily related to issues of coastal cliff erosion mitigation, not to protect structures from erosion of the sandy shoreline.
San Francisco North Region
The San Francisco North region is 93 km long and includes the Point Reyes, Drakes Bay and Bolinas Bay litto-ral cells (Figure 9). This is primarily a rocky coastline, with narrow beaches backed by high coastal cliffs, small isolated pocket beaches between rocky headlands, and an expansive dune field at Point Reyes. There are two very small, devel-oped sections of the coast in this region at Bolinas and Stin-son Beach. Due to a data gap in the 1800s-era t-sheets we have no long-term shoreline change rates for either of these areas. Other than these two areas, the coast here is undevel-oped and remote, and falls entirely within either PRNS or the Golden Gate National Recreation Area (GGNRA).
Net long-term shoreline change rates in this region, averaged along 45.1 km of coast, were low and averaged 0.1 m/yr (Table 6B). Forty-six percent of the shoreline was eroding in the long-term at an average rate of –0.2 m/yr. Long-term accretion rates of 0.3 m/yr occurred along 54% of the coast. The highest and lowest long-term rates occurred north of Point Reyes Headland where the long-term trend was largely accretional (Figure 23). However, the maximum long-term erosion rate for the San Francisco North region of -0.5 m/yr was at Limantour Beach, which is north of Point Reyes (Table 9B).
Net average short-term shoreline change rates were measured along 51.9 km of coastline, and the average change rate was –0.5 m/yr. Eighty-one percent of the coast was eroding (short-term) with the rate of erosion averaging –0.7 m/yr. Short-term accretion rates, averaging 0.5 m/yr, occurred along only 19% of the coast.
Short-term shoreline change trends north of Point Reyes Headland (Figure 23) were highly variable with accretion dominant in the north, changing to predominantly erosion in the south. The maximum short-term erosion rate of -3.1 m/yr was measured at Point Reyes Beach (Figure 23). This trend is driven by the position of the most recent (lidar) shoreline and may indicate a rotation of the beach during the 1997-98 El Nino where the dominant littoral transport changed directions from southward to northward in many local areas.
In the San Francisco North region, the long- and short-term shoreline change rates were significantly differ-ent; there was an overall shift from a net shoreline change trend that was 0.1 m/yr in the long-term to a net shoreline change rate that was strongly erosional (-0.5 m/yr) in the short-term. In addition, the percent of coastline along which
erosion was measured increased from 46% in the long-term to 81% of the short-term.
As demonstrated in Figure 23, from Point Reyes headland to Point Bonita, the sandy beaches were relatively stable in the long-term. In the short-term, this section of beach as primarily erosional, with a few localized excep-tions (i.e south of Drakes Estero). The short-term erosion rates at Stinson Beach were the highest of those measured in the southern portion of the San Francisco North region. Winter storm waves frequently inundate Stinson Beach, moving large volumes of sand, and threatening homes built on the sand spit. Figure 24 shows a house buried by sand that had been eroded from a location further north. Riprap has been emplaced in many areas to protect the houses from beach erosion (Savoy and others, 2005).
San Francisco South Region
The San Francisco South region is 115 km long and extends from the mouth of San Francisco Bay to Davenport (Figures 14B and 25). The northern coast in this region is urban and includes San Francisco, Pacifica and Half Moon Bay; the southern half is largely undeveloped and agricultural. The San Francisco littoral cell is within this region (Figure 9). The geomorphology of the coastline is variable, with linear beaches backed by dunes, steep cliffs with narrow fronting beaches, rocky coast with small pocket beaches, and steep, high-relief coast with no sandy shore-line. There are no known beach nourishment projects in this region, although a dredge spoil deposit offshore may be contributing material to the beach (Barnard and Hanes, 2006). Additionally, wind-blown sand is regularly removed from the inland side of the dunes and from the adjacent highway and added to the south end of the beach (Wiegel, 2002). The most notable coastal engineering structures are the O’Shaughnessy and Great Highway seawalls along Ocean Beach in San Francisco and the Pillar Point Harbor at Half Moon Bay.
For this analysis we calculated net average long-term shoreline change rates for 56.3 km of coastline, and the average rate was –0.2 m/yr. Long-term erosion occurred along 76% of the coast at an average long-term rate of –0.4 m/yr. For the 24% of the coast along which accretion occurred, the long-term average accretion rate was 0.1 m/yr. The maximum long-term accretion rate (0.4 m/yr) in this region was located 0.25 km south of Mussel Rock, and the maximum long-term erosion rate of –1.8 m/yr occurred on the north side of Point Año Nuevo (Figure 25; Table 9B).
Net short-term shoreline change, with an average rate of –0.5 m/yr, was measured along 57.5 km of coast in the San Francisco South region. Along the portions of coast where the short-term shoreline change was erosional, the rate was –0.7 m/yr, averaged over 81% of the coast. The average short-term accretion rate was 0.5 m/yr.
Short-term change trends in the central portion of this region are more variable than the long-term trends; erosion
Open-File Report 2006-1219 �3

Shoreline change rate (m/yr)
-8-6-4-202468
Dis
tanc
e al
ong
shor
e (k
m)
10
20
30
40
50
60
70
80
90
Point Reyes Beach
Driftwood Beach
Point Reyes Headland
Shoreline Change: San Francisco North
Drakes Estero Mouth
Bol
inas
Bay
Cel
lD
rake
s B
ay C
ell
Stinson Beach
Bolinas Point
Rodeo BeachPoint Bonita
ErosionAccretion
Short-term rateLong-term rate
* * Max. erosion and accretion
*
*
Figure 23. Shoreline change rates for the San Francisco North region. The maximum long-term erosion rate was -0.5 m/yr on Limantour Beach east of Drakes Estero; the maximum short-term erosion rate of –3.1 m/yr was measured at Point Reyes Beach just north of Point Reyes.
Open-File Report 2006-1219 ��
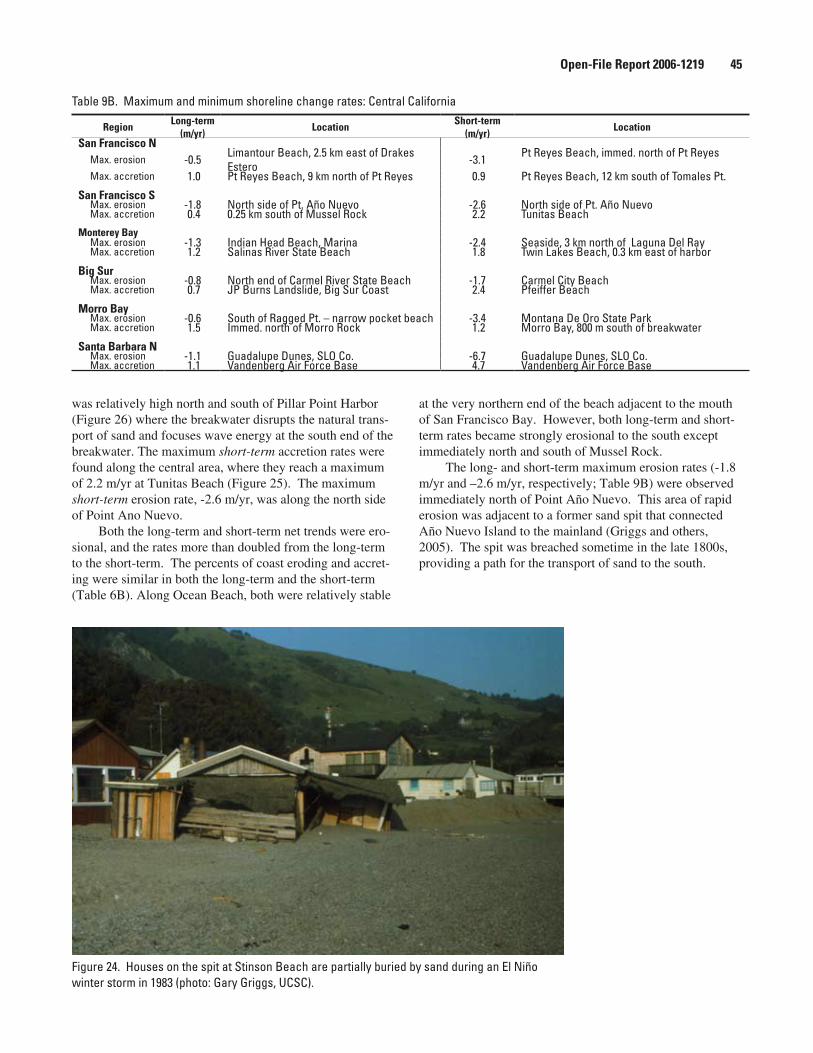
was relatively high north and south of Pillar Point Harbor (Figure 26) where the breakwater disrupts the natural trans-port of sand and focuses wave energy at the south end of the breakwater. The maximum short-term accretion rates were found along the central area, where they reach a maximum of 2.2 m/yr at Tunitas Beach (Figure 25). The maximum short-term erosion rate, -2.6 m/yr, was along the north side of Point Ano Nuevo.
Both the long-term and short-term net trends were ero-sional, and the rates more than doubled from the long-term to the short-term. The percents of coast eroding and accret-ing were similar in both the long-term and the short-term (Table 6B). Along Ocean Beach, both were relatively stable
at the very northern end of the beach adjacent to the mouth of San Francisco Bay. However, both long-term and short-term rates became strongly erosional to the south except immediately north and south of Mussel Rock.
The long- and short-term maximum erosion rates (-1.8 m/yr and –2.6 m/yr, respectively; Table 9B) were observed immediately north of Point Año Nuevo. This area of rapid erosion was adjacent to a former sand spit that connected Año Nuevo Island to the mainland (Griggs and others, 2005). The spit was breached sometime in the late 1800s, providing a path for the transport of sand to the south.
Figure 24. Houses on the spit at Stinson Beach are partially buried by sand during an El Niño winter storm in 1983 (photo: Gary Griggs, UCSC).
Region Long-term(m/yr) Location Short-term
(m/yr) Location
San Francisco N Max. erosion -0.5 Limantour Beach, 2.5 km east of Drakes
Estero -3.1 Pt Reyes Beach, immed. north of Pt Reyes
Max. accretion 1.0 Pt Reyes Beach, 9 km north of Pt Reyes 0.9 Pt Reyes Beach, 12 km south of Tomales Pt.
San Francisco S Max. erosion -1.8 North side of Pt. Año Nuevo -2.6 North side of Pt. Año Nuevo Max. accretion 0.4 0.25 km south of Mussel Rock 2.2 Tunitas BeachMonterey Bay Max. erosion -1.3 Indian Head Beach, Marina -2.4 Seaside, 3 km north of Laguna Del Ray Max. accretion 1.2 Salinas River State Beach 1.8 Twin Lakes Beach, 0.3 km east of harbor
Big Sur Max. erosion -0.8 North end of Carmel River State Beach -1.7 Carmel City Beach Max. accretion 0.7 JP Burns Landslide, Big Sur Coast 2.4 Pfeiffer Beach
Morro Bay Max. erosion -0.6 South of Ragged Pt. – narrow pocket beach -3.4 Montana De Oro State Park Max. accretion 1.5 Immed. north of Morro Rock 1.2 Morro Bay, 800 m south of breakwater
Santa Barbara N Max. erosion -1.1 Guadalupe Dunes, SLO Co. -6.7 Guadalupe Dunes, SLO Co. Max. accretion 1.1 Vandenberg Air Force Base 4.7 Vandenberg Air Force Base
Table 9B. Maximum and minimum shoreline change rates: Central California
Open-File Report 2006-1219 ��
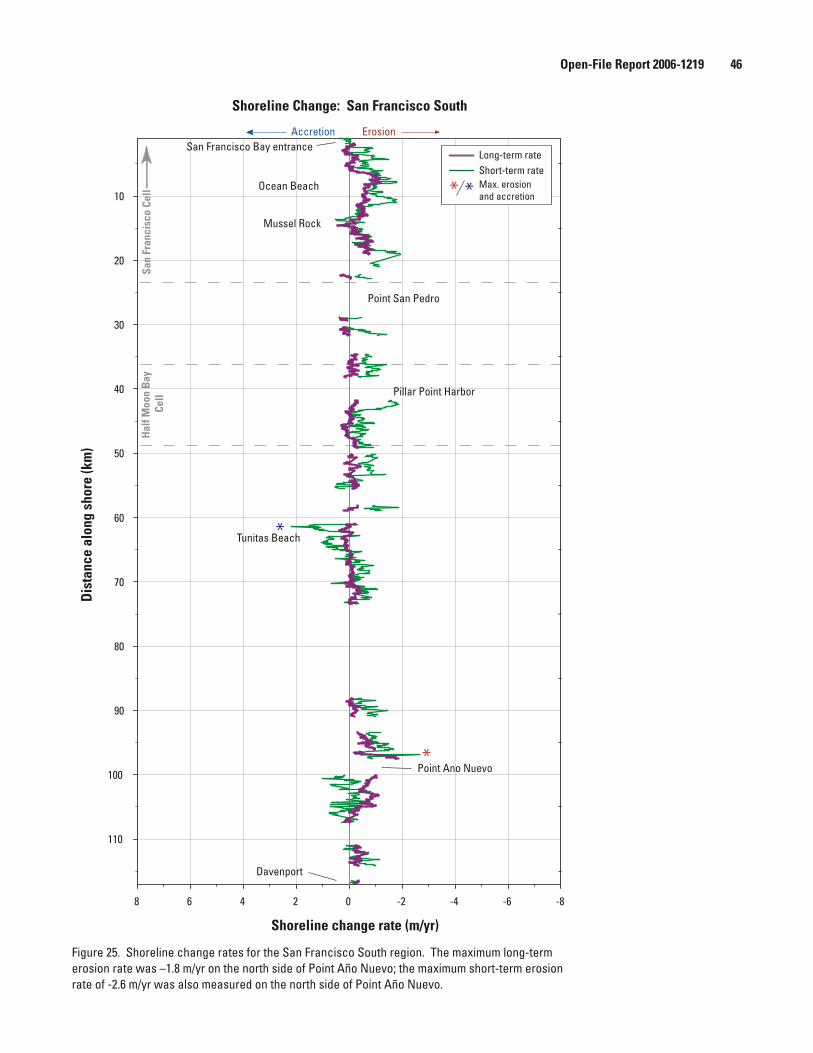
Shoreline change rate (m/yr)
-8-6-4-202468
Dis
tanc
e al
ong
shor
e (k
m)
10
20
30
40
50
60
70
80
90
100
110
San
Fran
cisc
o Ce
ll Ocean Beach
Point San Pedro
Pillar Point Harbor
Tunitas Beach
Point Ano Nuevo
Davenport
Hal
f Moo
n B
ay
Cell
Shoreline Change: San Francisco South
San Francisco Bay entranceErosionAccretion
Mussel Rock
Short-term rateLong-term rate
* * Max. erosion and accretion
*
*
Figure 25. Shoreline change rates for the San Francisco South region. The maximum long-term erosion rate was –1.8 m/yr on the north side of Point Año Nuevo; the maximum short-term erosion rate of -2.6 m/yr was also measured on the north side of Point Año Nuevo.
Open-File Report 2006-1219 �6
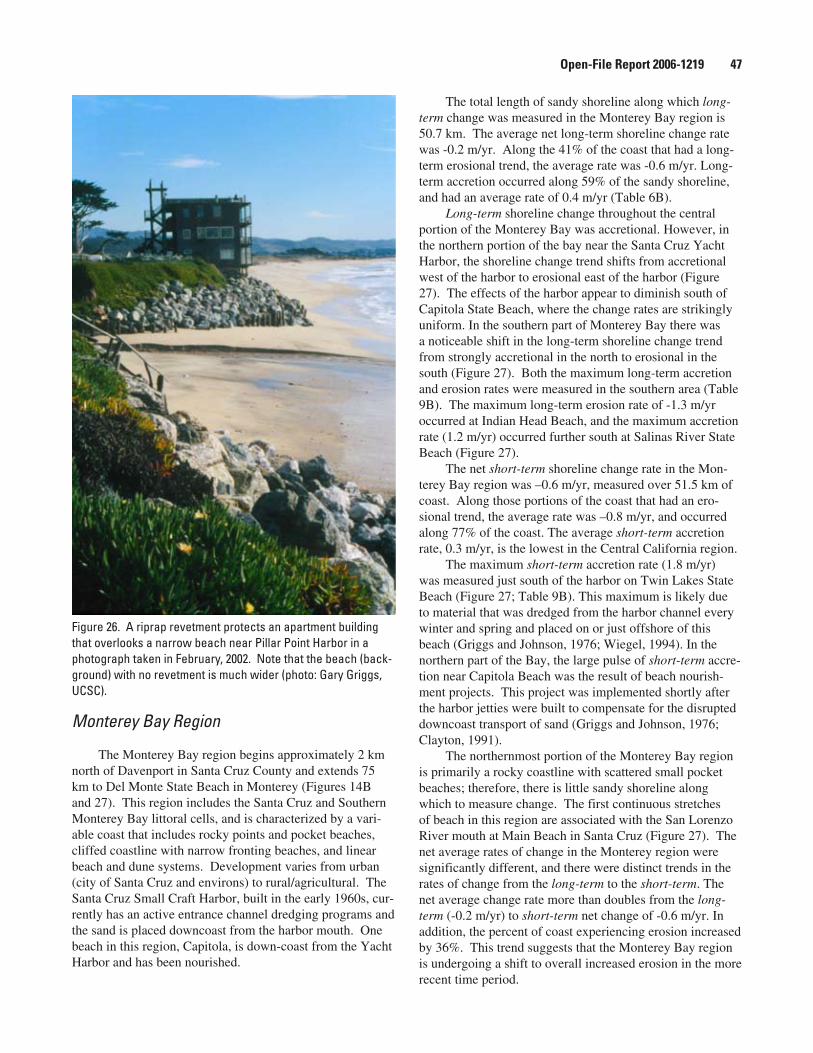
Monterey Bay Region
The Monterey Bay region begins approximately 2 km north of Davenport in Santa Cruz County and extends 75 km to Del Monte State Beach in Monterey (Figures 14B and 27). This region includes the Santa Cruz and Southern Monterey Bay littoral cells, and is characterized by a vari-able coast that includes rocky points and pocket beaches, cliffed coastline with narrow fronting beaches, and linear beach and dune systems. Development varies from urban (city of Santa Cruz and environs) to rural/agricultural. The Santa Cruz Small Craft Harbor, built in the early 1960s, cur-rently has an active entrance channel dredging programs and the sand is placed downcoast from the harbor mouth. One beach in this region, Capitola, is down-coast from the Yacht Harbor and has been nourished.
The total length of sandy shoreline along which long-term change was measured in the Monterey Bay region is 50.7 km. The average net long-term shoreline change rate was -0.2 m/yr. Along the 41% of the coast that had a long-term erosional trend, the average rate was -0.6 m/yr. Long-term accretion occurred along 59% of the sandy shoreline, and had an average rate of 0.4 m/yr (Table 6B).
Long-term shoreline change throughout the central portion of the Monterey Bay was accretional. However, in the northern portion of the bay near the Santa Cruz Yacht Harbor, the shoreline change trend shifts from accretional west of the harbor to erosional east of the harbor (Figure 27). The effects of the harbor appear to diminish south of Capitola State Beach, where the change rates are strikingly uniform. In the southern part of Monterey Bay there was a noticeable shift in the long-term shoreline change trend from strongly accretional in the north to erosional in the south (Figure 27). Both the maximum long-term accretion and erosion rates were measured in the southern area (Table 9B). The maximum long-term erosion rate of -1.3 m/yr occurred at Indian Head Beach, and the maximum accretion rate (1.2 m/yr) occurred further south at Salinas River State Beach (Figure 27).
The net short-term shoreline change rate in the Mon-terey Bay region was –0.6 m/yr, measured over 51.5 km of coast. Along those portions of the coast that had an ero-sional trend, the average rate was –0.8 m/yr, and occurred along 77% of the coast. The average short-term accretion rate, 0.3 m/yr, is the lowest in the Central California region.
The maximum short-term accretion rate (1.8 m/yr) was measured just south of the harbor on Twin Lakes State Beach (Figure 27; Table 9B). This maximum is likely due to material that was dredged from the harbor channel every winter and spring and placed on or just offshore of this beach (Griggs and Johnson, 1976; Wiegel, 1994). In the northern part of the Bay, the large pulse of short-term accre-tion near Capitola Beach was the result of beach nourish-ment projects. This project was implemented shortly after the harbor jetties were built to compensate for the disrupted downcoast transport of sand (Griggs and Johnson, 1976; Clayton, 1991).
The northernmost portion of the Monterey Bay region is primarily a rocky coastline with scattered small pocket beaches; therefore, there is little sandy shoreline along which to measure change. The first continuous stretches of beach in this region are associated with the San Lorenzo River mouth at Main Beach in Santa Cruz (Figure 27). The net average rates of change in the Monterey region were significantly different, and there were distinct trends in the rates of change from the long-term to the short-term. The net average change rate more than doubles from the long-term (-0.2 m/yr) to short-term net change of -0.6 m/yr. In addition, the percent of coast experiencing erosion increased by 36%. This trend suggests that the Monterey Bay region is undergoing a shift to overall increased erosion in the more recent time period.
Figure 26. A riprap revetment protects an apartment building that overlooks a narrow beach near Pillar Point Harbor in a photograph taken in February, 2002. Note that the beach (back-ground) with no revetment is much wider (photo: Gary Griggs, UCSC).
Open-File Report 2006-1219 �7

Shoreline change rate (m/yr)
-8-6-4-202468
Dis
tanc
e al
ong
shor
e (k
m)
10
20
30
40
50
60
70
80
Wilder Ranch State Park
Main Beach
Santa Cruz Yacht Habor
Capitola State Beach
Pajaro River mouth
Sant
a Cr
uz C
ell
Sout
hern
Mon
tere
y B
ay C
ell
Salinas River State Beach
Laguna Del Ray
Shoreline Change: Monterey Bay
ErosionAccretion
Twin Lakes Beach
Seaside
Indian Head Beach
Short-term rateLong-term rate
* * Max. erosion and accretion
*
*
San Lorenzo River mouth
Salinas River mouth
Figure 27. Shoreline change rates for the Monterey Bay region. The maximum long-term ero-sion rate was -1.3 m/yr on Indian Head Beach near Marina. The maximum short-term erosion rate of –2.4 m/yr was measured near Seaside.
Open-File Report 2006-1219 �8
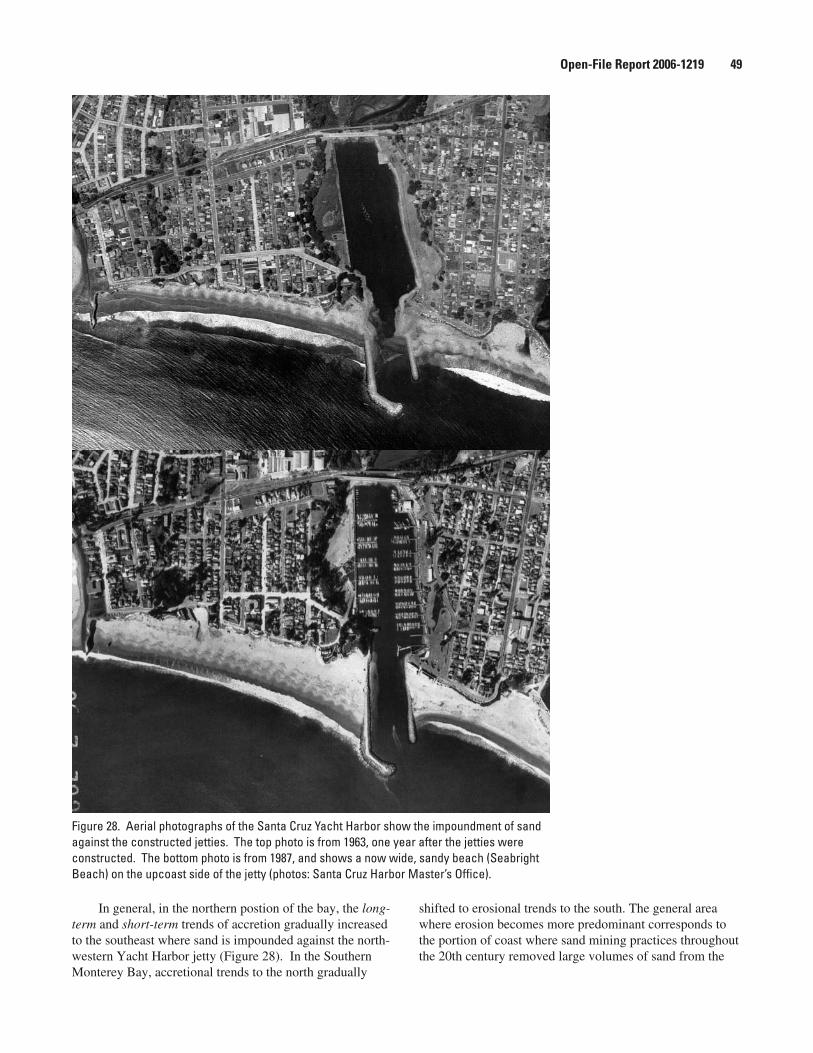
In general, in the northern postion of the bay, the long-term and short-term trends of accretion gradually increased to the southeast where sand is impounded against the north-western Yacht Harbor jetty (Figure 28). In the Southern Monterey Bay, accretional trends to the north gradually
shifted to erosional trends to the south. The general area where erosion becomes more predominant corresponds to the portion of coast where sand mining practices throughout the 20th century removed large volumes of sand from the
Figure 28. Aerial photographs of the Santa Cruz Yacht Harbor show the impoundment of sand against the constructed jetties. The top photo is from 1963, one year after the jetties were constructed. The bottom photo is from 1987, and shows a now wide, sandy beach (Seabright Beach) on the upcoast side of the jetty (photos: Santa Cruz Harbor Master’s Office).
Open-File Report 2006-1219 �9
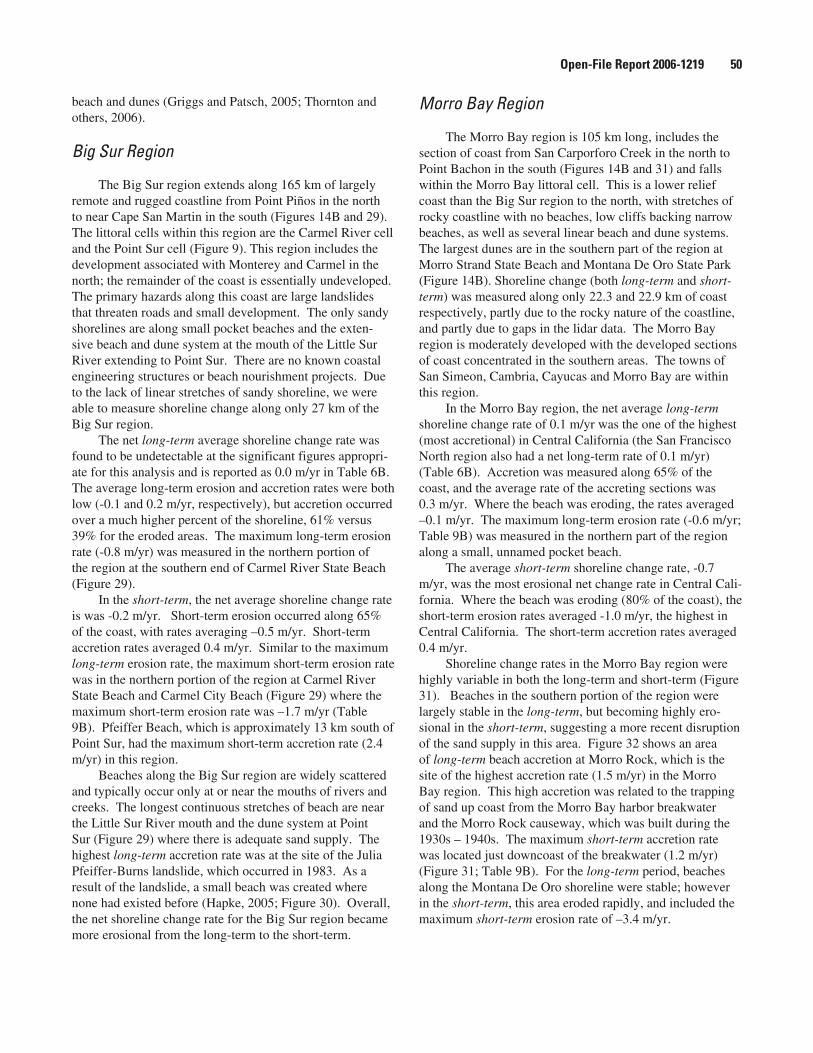
beach and dunes (Griggs and Patsch, 2005; Thornton and others, 2006).
Big Sur Region
The Big Sur region extends along 165 km of largely remote and rugged coastline from Point Piños in the north to near Cape San Martin in the south (Figures 14B and 29). The littoral cells within this region are the Carmel River cell and the Point Sur cell (Figure 9). This region includes the development associated with Monterey and Carmel in the north; the remainder of the coast is essentially undeveloped. The primary hazards along this coast are large landslides that threaten roads and small development. The only sandy shorelines are along small pocket beaches and the exten-sive beach and dune system at the mouth of the Little Sur River extending to Point Sur. There are no known coastal engineering structures or beach nourishment projects. Due to the lack of linear stretches of sandy shoreline, we were able to measure shoreline change along only 27 km of the Big Sur region.
The net long-term average shoreline change rate was found to be undetectable at the significant figures appropri-ate for this analysis and is reported as 0.0 m/yr in Table 6B. The average long-term erosion and accretion rates were both low (-0.1 and 0.2 m/yr, respectively), but accretion occurred over a much higher percent of the shoreline, 61% versus 39% for the eroded areas. The maximum long-term erosion rate (-0.8 m/yr) was measured in the northern portion of the region at the southern end of Carmel River State Beach (Figure 29).
In the short-term, the net average shoreline change rate is was -0.2 m/yr. Short-term erosion occurred along 65% of the coast, with rates averaging –0.5 m/yr. Short-term accretion rates averaged 0.4 m/yr. Similar to the maximum long-term erosion rate, the maximum short-term erosion rate was in the northern portion of the region at Carmel River State Beach and Carmel City Beach (Figure 29) where the maximum short-term erosion rate was –1.7 m/yr (Table 9B). Pfeiffer Beach, which is approximately 13 km south of Point Sur, had the maximum short-term accretion rate (2.4 m/yr) in this region.
Beaches along the Big Sur region are widely scattered and typically occur only at or near the mouths of rivers and creeks. The longest continuous stretches of beach are near the Little Sur River mouth and the dune system at Point Sur (Figure 29) where there is adequate sand supply. The highest long-term accretion rate was at the site of the Julia Pfeiffer-Burns landslide, which occurred in 1983. As a result of the landslide, a small beach was created where none had existed before (Hapke, 2005; Figure 30). Overall, the net shoreline change rate for the Big Sur region became more erosional from the long-term to the short-term.
Morro Bay Region
The Morro Bay region is 105 km long, includes the section of coast from San Carporforo Creek in the north to Point Bachon in the south (Figures 14B and 31) and falls within the Morro Bay littoral cell. This is a lower relief coast than the Big Sur region to the north, with stretches of rocky coastline with no beaches, low cliffs backing narrow beaches, as well as several linear beach and dune systems. The largest dunes are in the southern part of the region at Morro Strand State Beach and Montana De Oro State Park (Figure 14B). Shoreline change (both long-term and short-term) was measured along only 22.3 and 22.9 km of coast respectively, partly due to the rocky nature of the coastline, and partly due to gaps in the lidar data. The Morro Bay region is moderately developed with the developed sections of coast concentrated in the southern areas. The towns of San Simeon, Cambria, Cayucas and Morro Bay are within this region.
In the Morro Bay region, the net average long-term shoreline change rate of 0.1 m/yr was the one of the highest (most accretional) in Central California (the San Francisco North region also had a net long-term rate of 0.1 m/yr) (Table 6B). Accretion was measured along 65% of the coast, and the average rate of the accreting sections was 0.3 m/yr. Where the beach was eroding, the rates averaged –0.1 m/yr. The maximum long-term erosion rate (-0.6 m/yr; Table 9B) was measured in the northern part of the region along a small, unnamed pocket beach.
The average short-term shoreline change rate, -0.7 m/yr, was the most erosional net change rate in Central Cali-fornia. Where the beach was eroding (80% of the coast), the short-term erosion rates averaged -1.0 m/yr, the highest in Central California. The short-term accretion rates averaged 0.4 m/yr.
Shoreline change rates in the Morro Bay region were highly variable in both the long-term and short-term (Figure 31). Beaches in the southern portion of the region were largely stable in the long-term, but becoming highly ero-sional in the short-term, suggesting a more recent disruption of the sand supply in this area. Figure 32 shows an area of long-term beach accretion at Morro Rock, which is the site of the highest accretion rate (1.5 m/yr) in the Morro Bay region. This high accretion was related to the trapping of sand up coast from the Morro Bay harbor breakwater and the Morro Rock causeway, which was built during the 1930s – 1940s. The maximum short-term accretion rate was located just downcoast of the breakwater (1.2 m/yr) (Figure 31; Table 9B). For the long-term period, beaches along the Montana De Oro shoreline were stable; however in the short-term, this area eroded rapidly, and included the maximum short-term erosion rate of –3.4 m/yr.
Open-File Report 2006-1219 �0
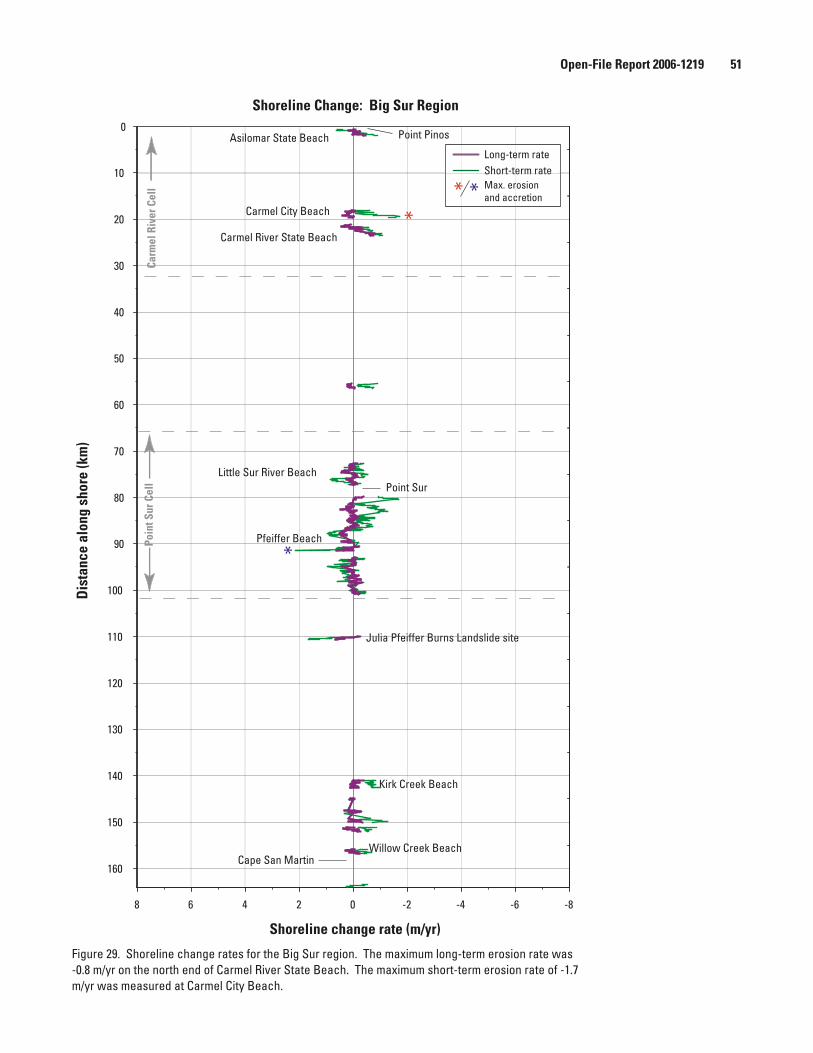
Figure 29. Shoreline change rates for the Big Sur region. The maximum long-term erosion rate was -0.8 m/yr on the north end of Carmel River State Beach. The maximum short-term erosion rate of -1.7 m/yr was measured at Carmel City Beach.
Shoreline change rate (m/yr)
-8-6-4-202468
Dis
tanc
e al
ong
shor
e (k
m)
0
10
20
30
40
50
60
70
80
90
100
110
120
130
140
150
160
Pfeiffer Beach
Cape San MartinWillow Creek Beach
Shoreline Change: Big Sur Region
Point PinosAsilomar State Beach
Carmel City Beach
Carmel River State Beach
Point SurLittle Sur River Beach
Julia Pfeiffer Burns Landslide site
Kirk Creek Beach
Carm
el R
iver
Cel
lPo
int S
ur C
ell
Short-term rateLong-term rate
* * Max. erosion and accretion
*
*
Open-File Report 2006-1219 �1
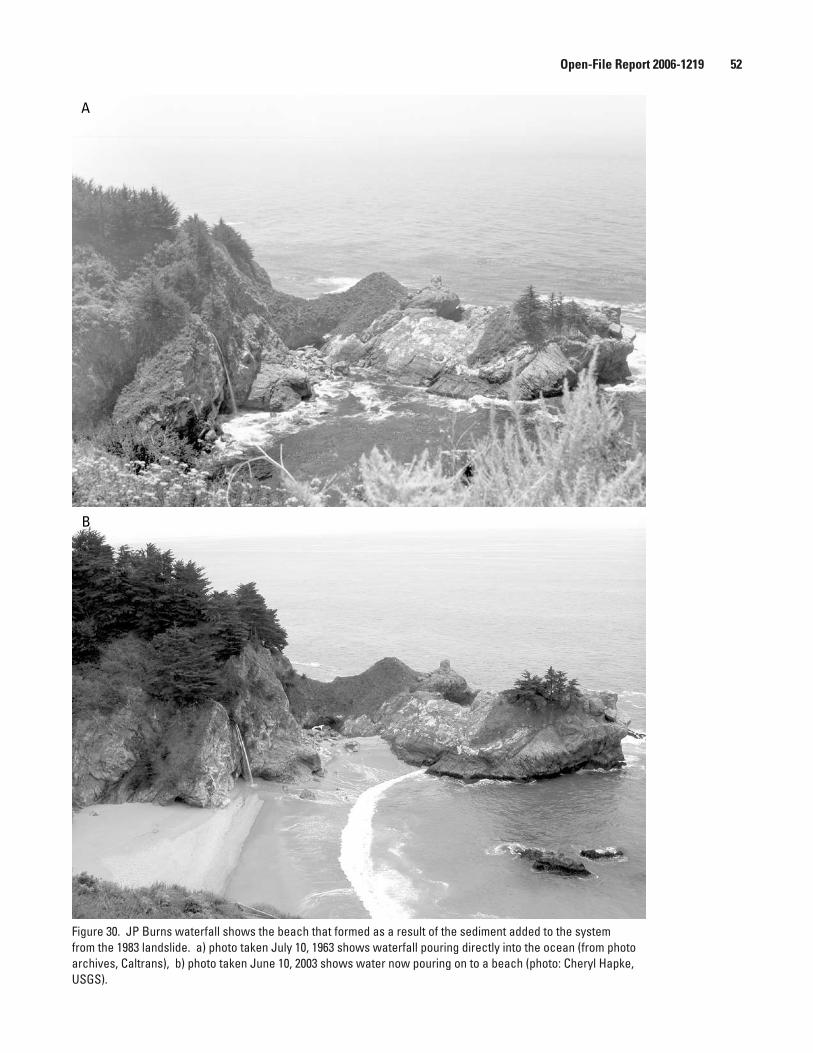
A
B
Figure 30. JP Burns waterfall shows the beach that formed as a result of the sediment added to the system from the 1983 landslide. a) photo taken July 10, 1963 shows waterfall pouring directly into the ocean (from photo archives, Caltrans), b) photo taken June 10, 2003 shows water now pouring on to a beach (photo: Cheryl Hapke, USGS).
Open-File Report 2006-1219 �2

Cayucas State Beach
Mor
ro B
ay C
ell
Shoreline Change: Morro Bay Region
Piedras Blancas Point
Morro Strand State Beach
Shoreline change rate (m/yr)
Dis
tanc
e al
ong
shor
e (k
m)
San Carporforo Creek Beach
Point Sierra Nevada
San Simeon Point
Point Estero
Morro Rock
Montana De OroState Park
Point Bachon
ErosionAccretion
Short-term rateLong-term rate
* * Max. erosion and accretion
*
*
Figure 31. Shoreline change rates for the Morro Bay region. The maximum long-term erosion rate was -0.6 m/yr along a narrow pocket beach south of Ragged Point. The maximum short-term ero-sion rate of –3.4 m/yr was measured at Montana De Oro State Park.
Open-File Report 2006-1219 �3
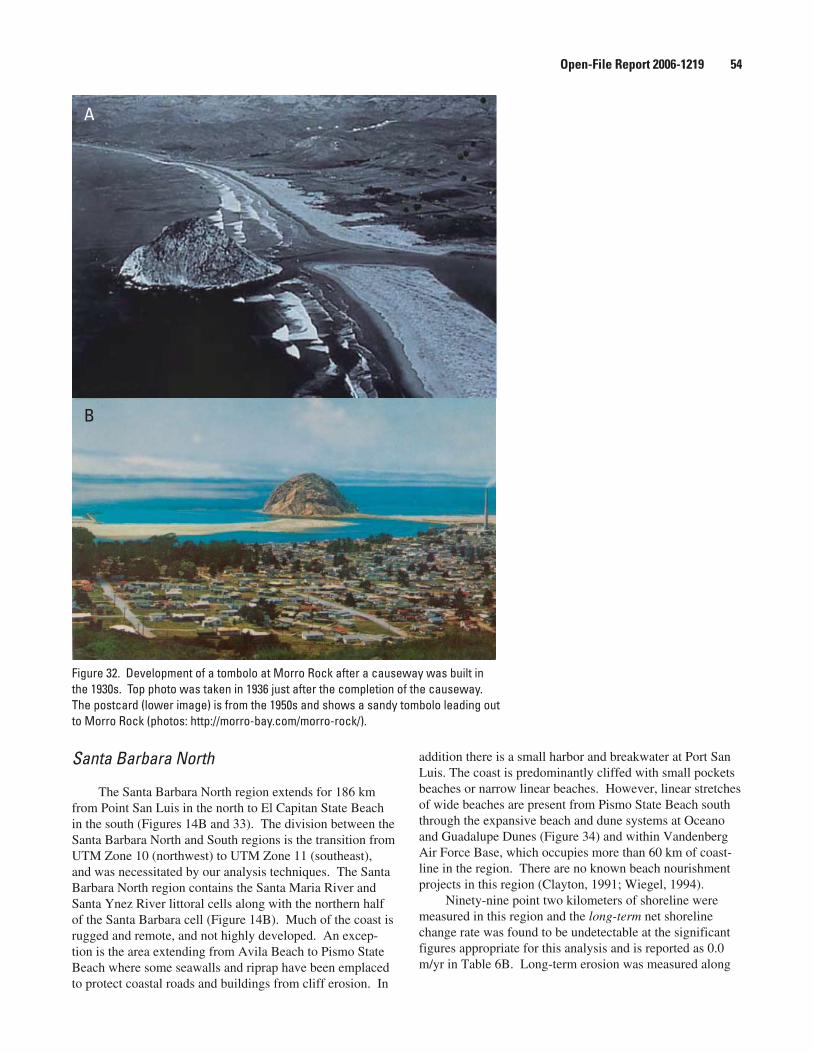
Santa Barbara North
The Santa Barbara North region extends for 186 km from Point San Luis in the north to El Capitan State Beach in the south (Figures 14B and 33). The division between the Santa Barbara North and South regions is the transition from UTM Zone 10 (northwest) to UTM Zone 11 (southeast), and was necessitated by our analysis techniques. The Santa Barbara North region contains the Santa Maria River and Santa Ynez River littoral cells along with the northern half of the Santa Barbara cell (Figure 14B). Much of the coast is rugged and remote, and not highly developed. An excep-tion is the area extending from Avila Beach to Pismo State Beach where some seawalls and riprap have been emplaced to protect coastal roads and buildings from cliff erosion. In
addition there is a small harbor and breakwater at Port San Luis. The coast is predominantly cliffed with small pockets beaches or narrow linear beaches. However, linear stretches of wide beaches are present from Pismo State Beach south through the expansive beach and dune systems at Oceano and Guadalupe Dunes (Figure 34) and within Vandenberg Air Force Base, which occupies more than 60 km of coast-line in the region. There are no known beach nourishment projects in this region (Clayton, 1991; Wiegel, 1994).
Ninety-nine point two kilometers of shoreline were measured in this region and the long-term net shoreline change rate was found to be undetectable at the significant figures appropriate for this analysis and is reported as 0.0 m/yr in Table 6B. Long-term erosion was measured along
A
B
Figure 32. Development of a tombolo at Morro Rock after a causeway was built in the 1930s. Top photo was taken in 1936 just after the completion of the causeway. The postcard (lower image) is from the 1950s and shows a sandy tombolo leading out to Morro Rock (photos: http://morro-bay.com/morro-rock/).
Open-File Report 2006-1219 ��
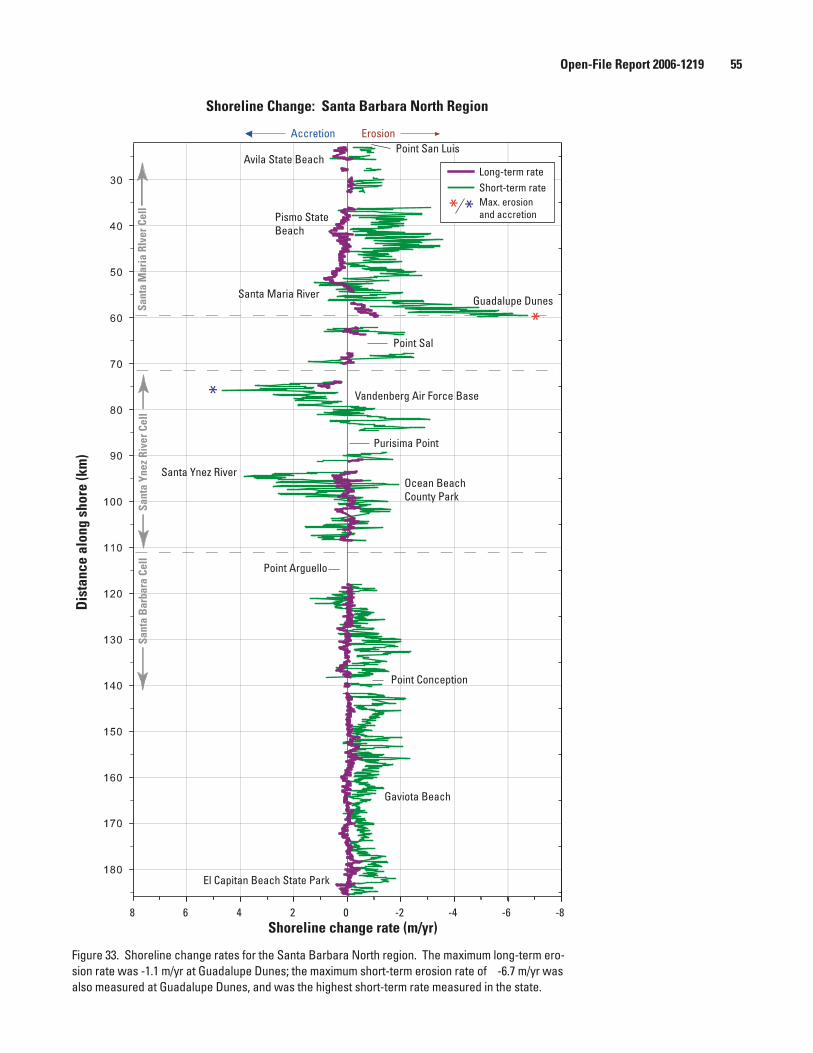
Shoreline change rate (m/yr)-8-6-4-202468
Dis
tanc
e al
ong
shor
e (k
m)
Sant
a M
aria
RIv
er C
ell
Avila State BeachSa
nta
Ynez
Riv
er C
ell
Shoreline Change: Santa Barbara North Region
Point San Luis
Pismo State Beach
Guadalupe Dunes
Point Sal
Purisima Point
Ocean Beach County Park
Vandenberg Air Force Base
Point Arguello
Sant
a B
arba
ra C
ell
Point Conception
El Capitan Beach State Park
Gaviota Beach
ErosionAccretion
Santa Ynez River
Santa Maria River
Short-term rateLong-term rate
* * Max. erosion and accretion
*
*
Figure 33. Shoreline change rates for the Santa Barbara North region. The maximum long-term ero-sion rate was -1.1 m/yr at Guadalupe Dunes; the maximum short-term erosion rate of -6.7 m/yr was also measured at Guadalupe Dunes, and was the highest short-term rate measured in the state.
Open-File Report 2006-1219 ��
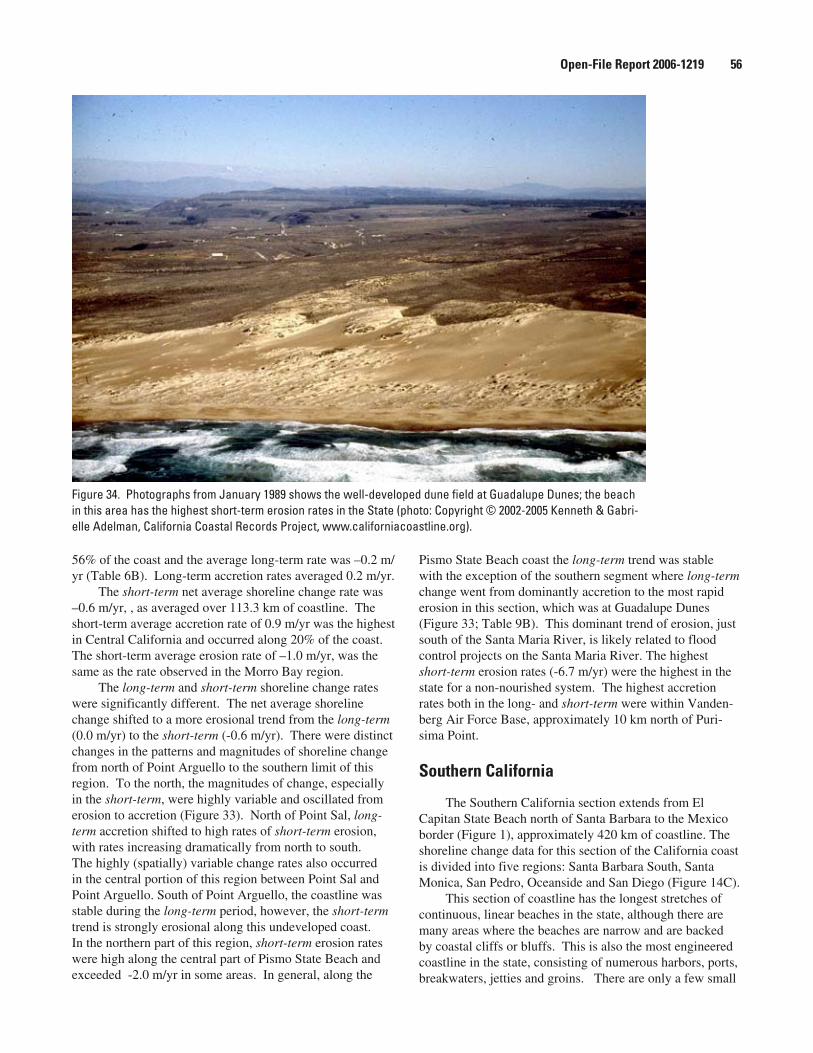
56% of the coast and the average long-term rate was –0.2 m/yr (Table 6B). Long-term accretion rates averaged 0.2 m/yr.
The short-term net average shoreline change rate was –0.6 m/yr, , as averaged over 113.3 km of coastline. The short-term average accretion rate of 0.9 m/yr was the highest in Central California and occurred along 20% of the coast. The short-term average erosion rate of –1.0 m/yr, was the same as the rate observed in the Morro Bay region.
The long-term and short-term shoreline change rates were significantly different. The net average shoreline change shifted to a more erosional trend from the long-term (0.0 m/yr) to the short-term (-0.6 m/yr). There were distinct changes in the patterns and magnitudes of shoreline change from north of Point Arguello to the southern limit of this region. To the north, the magnitudes of change, especially in the short-term, were highly variable and oscillated from erosion to accretion (Figure 33). North of Point Sal, long-term accretion shifted to high rates of short-term erosion, with rates increasing dramatically from north to south. The highly (spatially) variable change rates also occurred in the central portion of this region between Point Sal and Point Arguello. South of Point Arguello, the coastline was stable during the long-term period, however, the short-term trend is strongly erosional along this undeveloped coast. In the northern part of this region, short-term erosion rates were high along the central part of Pismo State Beach and exceeded -2.0 m/yr in some areas. In general, along the
Pismo State Beach coast the long-term trend was stable with the exception of the southern segment where long-term change went from dominantly accretion to the most rapid erosion in this section, which was at Guadalupe Dunes (Figure 33; Table 9B). This dominant trend of erosion, just south of the Santa Maria River, is likely related to flood control projects on the Santa Maria River. The highest short-term erosion rates (-6.7 m/yr) were the highest in the state for a non-nourished system. The highest accretion rates both in the long- and short-term were within Vanden-berg Air Force Base, approximately 10 km north of Puri-sima Point.
Southern California
The Southern California section extends from El Capitan State Beach north of Santa Barbara to the Mexico border (Figure 1), approximately 420 km of coastline. The shoreline change data for this section of the California coast is divided into five regions: Santa Barbara South, Santa Monica, San Pedro, Oceanside and San Diego (Figure 14C).
This section of coastline has the longest stretches of continuous, linear beaches in the state, although there are many areas where the beaches are narrow and are backed by coastal cliffs or bluffs. This is also the most engineered coastline in the state, consisting of numerous harbors, ports, breakwaters, jetties and groins. There are only a few small
Figure 34. Photographs from January 1989 shows the well-developed dune field at Guadalupe Dunes; the beach in this area has the highest short-term erosion rates in the State (photo: Copyright © 2002-2005 Kenneth & Gabri-elle Adelman, California Coastal Records Project, www.californiacoastline.org).
Open-File Report 2006-1219 �6
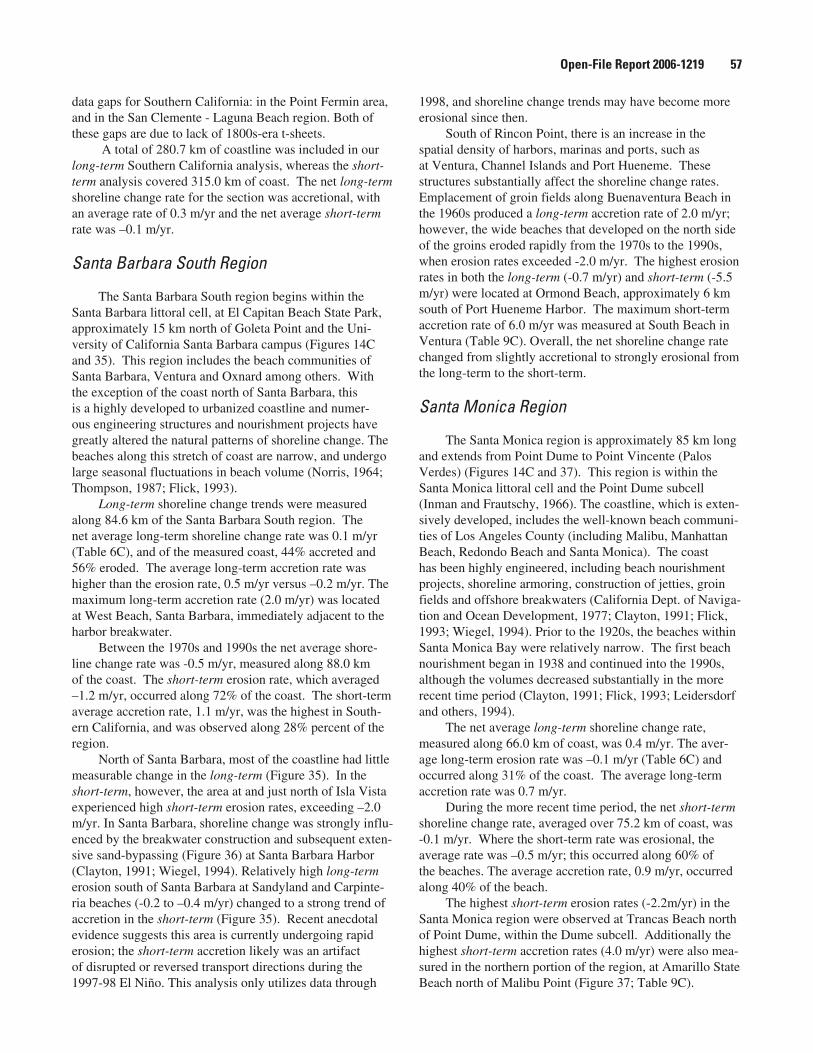
data gaps for Southern California: in the Point Fermin area, and in the San Clemente - Laguna Beach region. Both of these gaps are due to lack of 1800s-era t-sheets.
A total of 280.7 km of coastline was included in our long-term Southern California analysis, whereas the short-term analysis covered 315.0 km of coast. The net long-term shoreline change rate for the section was accretional, with an average rate of 0.3 m/yr and the net average short-term rate was –0.1 m/yr.
Santa Barbara South Region
The Santa Barbara South region begins within the Santa Barbara littoral cell, at El Capitan Beach State Park, approximately 15 km north of Goleta Point and the Uni-versity of California Santa Barbara campus (Figures 14C and 35). This region includes the beach communities of Santa Barbara, Ventura and Oxnard among others. With the exception of the coast north of Santa Barbara, this is a highly developed to urbanized coastline and numer-ous engineering structures and nourishment projects have greatly altered the natural patterns of shoreline change. The beaches along this stretch of coast are narrow, and undergo large seasonal fluctuations in beach volume (Norris, 1964; Thompson, 1987; Flick, 1993).
Long-term shoreline change trends were measured along 84.6 km of the Santa Barbara South region. The net average long-term shoreline change rate was 0.1 m/yr (Table 6C), and of the measured coast, 44% accreted and 56% eroded. The average long-term accretion rate was higher than the erosion rate, 0.5 m/yr versus –0.2 m/yr. The maximum long-term accretion rate (2.0 m/yr) was located at West Beach, Santa Barbara, immediately adjacent to the harbor breakwater.
Between the 1970s and 1990s the net average shore-line change rate was -0.5 m/yr, measured along 88.0 km of the coast. The short-term erosion rate, which averaged –1.2 m/yr, occurred along 72% of the coast. The short-term average accretion rate, 1.1 m/yr, was the highest in South-ern California, and was observed along 28% percent of the region.
North of Santa Barbara, most of the coastline had little measurable change in the long-term (Figure 35). In the short-term, however, the area at and just north of Isla Vista experienced high short-term erosion rates, exceeding –2.0 m/yr. In Santa Barbara, shoreline change was strongly influ-enced by the breakwater construction and subsequent exten-sive sand-bypassing (Figure 36) at Santa Barbara Harbor (Clayton, 1991; Wiegel, 1994). Relatively high long-term erosion south of Santa Barbara at Sandyland and Carpinte-ria beaches (-0.2 to –0.4 m/yr) changed to a strong trend of accretion in the short-term (Figure 35). Recent anecdotal evidence suggests this area is currently undergoing rapid erosion; the short-term accretion likely was an artifact of disrupted or reversed transport directions during the 1997-98 El Niño. This analysis only utilizes data through
1998, and shoreline change trends may have become more erosional since then.
South of Rincon Point, there is an increase in the spatial density of harbors, marinas and ports, such as at Ventura, Channel Islands and Port Hueneme. These structures substantially affect the shoreline change rates. Emplacement of groin fields along Buenaventura Beach in the 1960s produced a long-term accretion rate of 2.0 m/yr; however, the wide beaches that developed on the north side of the groins eroded rapidly from the 1970s to the 1990s, when erosion rates exceeded -2.0 m/yr. The highest erosion rates in both the long-term (-0.7 m/yr) and short-term (-5.5 m/yr) were located at Ormond Beach, approximately 6 km south of Port Hueneme Harbor. The maximum short-term accretion rate of 6.0 m/yr was measured at South Beach in Ventura (Table 9C). Overall, the net shoreline change rate changed from slightly accretional to strongly erosional from the long-term to the short-term.
Santa Monica Region
The Santa Monica region is approximately 85 km long and extends from Point Dume to Point Vincente (Palos Verdes) (Figures 14C and 37). This region is within the Santa Monica littoral cell and the Point Dume subcell (Inman and Frautschy, 1966). The coastline, which is exten-sively developed, includes the well-known beach communi-ties of Los Angeles County (including Malibu, Manhattan Beach, Redondo Beach and Santa Monica). The coast has been highly engineered, including beach nourishment projects, shoreline armoring, construction of jetties, groin fields and offshore breakwaters (California Dept. of Naviga-tion and Ocean Development, 1977; Clayton, 1991; Flick, 1993; Wiegel, 1994). Prior to the 1920s, the beaches within Santa Monica Bay were relatively narrow. The first beach nourishment began in 1938 and continued into the 1990s, although the volumes decreased substantially in the more recent time period (Clayton, 1991; Flick, 1993; Leidersdorf and others, 1994).
The net average long-term shoreline change rate, measured along 66.0 km of coast, was 0.4 m/yr. The aver-age long-term erosion rate was –0.1 m/yr (Table 6C) and occurred along 31% of the coast. The average long-term accretion rate was 0.7 m/yr.
During the more recent time period, the net short-term shoreline change rate, averaged over 75.2 km of coast, was -0.1 m/yr. Where the short-term rate was erosional, the average rate was –0.5 m/yr; this occurred along 60% of the beaches. The average accretion rate, 0.9 m/yr, occurred along 40% of the beach.
The highest short-term erosion rates (-2.2m/yr) in the Santa Monica region were observed at Trancas Beach north of Point Dume, within the Dume subcell. Additionally the highest short-term accretion rates (4.0 m/yr) were also mea-sured in the northern portion of the region, at Amarillo State Beach north of Malibu Point (Figure 37; Table 9C).
Open-File Report 2006-1219 �7
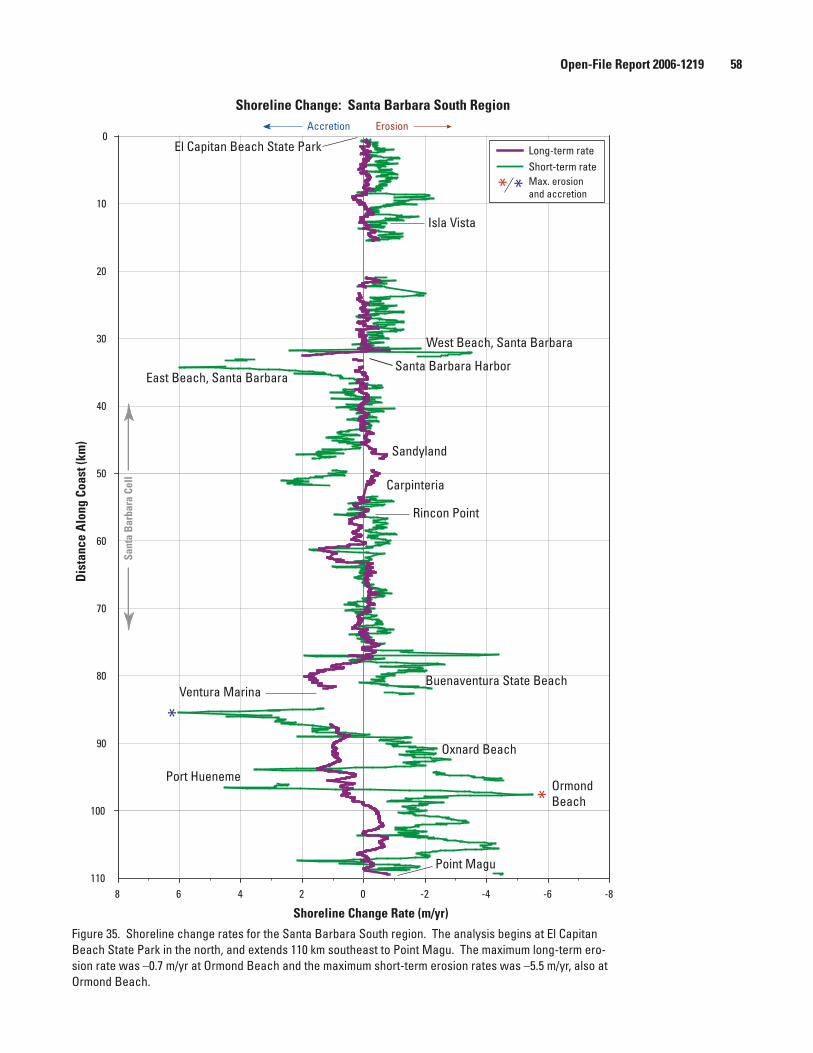
Shoreline Change Rate (m/yr)-8-6-4-202468
Dis
tanc
e A
long
Coa
st (k
m)
10
20
30
40
60
70
80
90
110
0
50
100
Isla Vista
West Beach, Santa Barbara
Santa Barbara HarborEast Beach, Santa Barbara
Carpinteria
Rincon Point
Buenaventura State Beach
Oxnard Beach
Port Hueneme
Point Magu
Ventura Marina
Sandyland
El Capitan Beach State Park
Shoreline Change: Santa Barbara South RegionErosionAccretion
Sant
a B
arba
ra C
ell
Short-term rateLong-term rate
* * Max. erosion and accretion
*
*
OrmondBeach
Figure 35. Shoreline change rates for the Santa Barbara South region. The analysis begins at El Capitan Beach State Park in the north, and extends 110 km southeast to Point Magu. The maximum long-term ero-sion rate was –0.7 m/yr at Ormond Beach and the maximum short-term erosion rates was –5.5 m/yr, also at Ormond Beach.
Open-File Report 2006-1219 �8
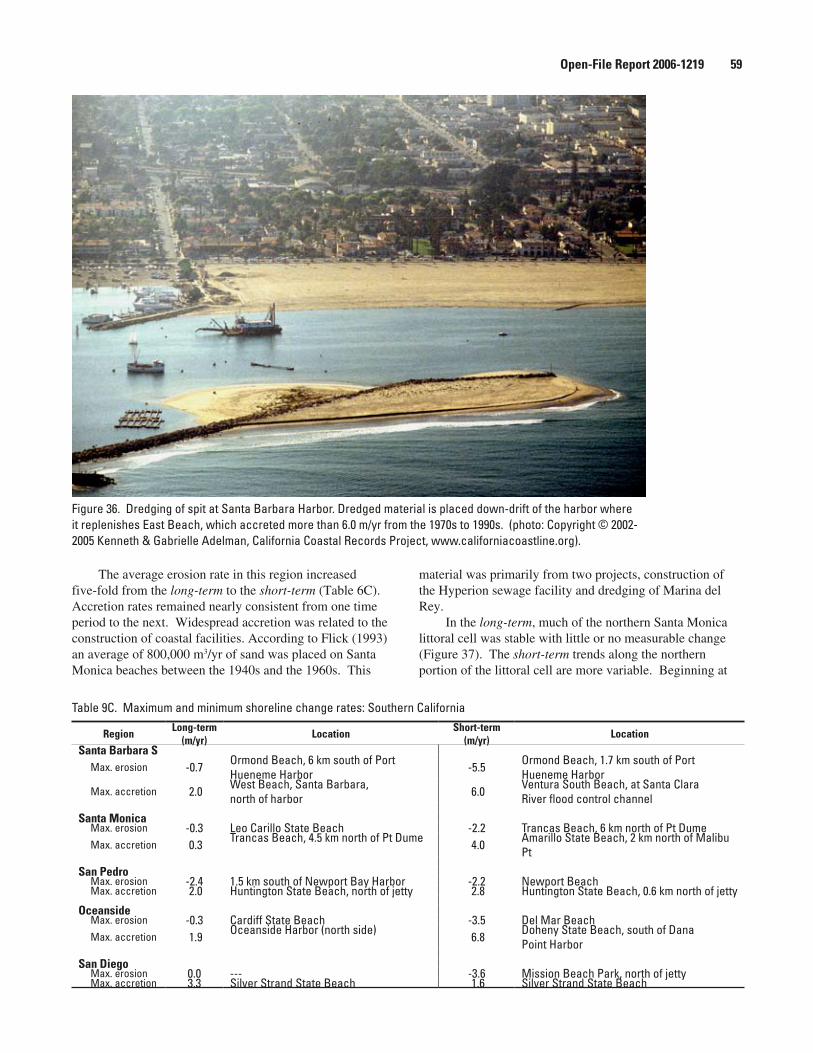
The average erosion rate in this region increased five-fold from the long-term to the short-term (Table 6C). Accretion rates remained nearly consistent from one time period to the next. Widespread accretion was related to the construction of coastal facilities. According to Flick (1993) an average of 800,000 m3/yr of sand was placed on Santa Monica beaches between the 1940s and the 1960s. This
material was primarily from two projects, construction of the Hyperion sewage facility and dredging of Marina del Rey.
In the long-term, much of the northern Santa Monica littoral cell was stable with little or no measurable change (Figure 37). The short-term trends along the northern portion of the littoral cell are more variable. Beginning at
Figure 36. Dredging of spit at Santa Barbara Harbor. Dredged material is placed down-drift of the harbor where it replenishes East Beach, which accreted more than 6.0 m/yr from the 1970s to 1990s. (photo: Copyright © 2002-2005 Kenneth & Gabrielle Adelman, California Coastal Records Project, www.californiacoastline.org).
Region Long-term(m/yr) Location Short-term
(m/yr) Location
Santa Barbara S Max. erosion -0.7 Ormond Beach, 6 km south of Port
Hueneme Harbor -5.5 Ormond Beach, 1.7 km south of Port Hueneme Harbor
Max. accretion 2.0 West Beach, Santa Barbara, north of harbor 6.0 Ventura South Beach, at Santa Clara
River flood control channel
Santa Monica Max. erosion -0.3 Leo Carillo State Beach -2.2 Trancas Beach, 6 km north of Pt Dume Max. accretion 0.3 Trancas Beach, 4.5 km north of Pt Dume 4.0 Amarillo State Beach, 2 km north of Malibu
Pt
San Pedro Max. erosion -2.4 1.5 km south of Newport Bay Harbor -2.2 Newport Beach Max. accretion 2.0 Huntington State Beach, north of jetty 2.8 Huntington State Beach, 0.6 km north of jetty
Oceanside Max. erosion -0.3 Cardiff State Beach -3.5 Del Mar Beach Max. accretion 1.9 Oceanside Harbor (north side) 6.8 Doheny State Beach, south of Dana
Point Harbor
San Diego Max. erosion 0.0 --- -3.6 Mission Beach Park, north of jetty Max. accretion 3.3 Silver Strand State Beach 1.6 Silver Strand State Beach
Table 9C. Maximum and minimum shoreline change rates: Southern California
Open-File Report 2006-1219 �9
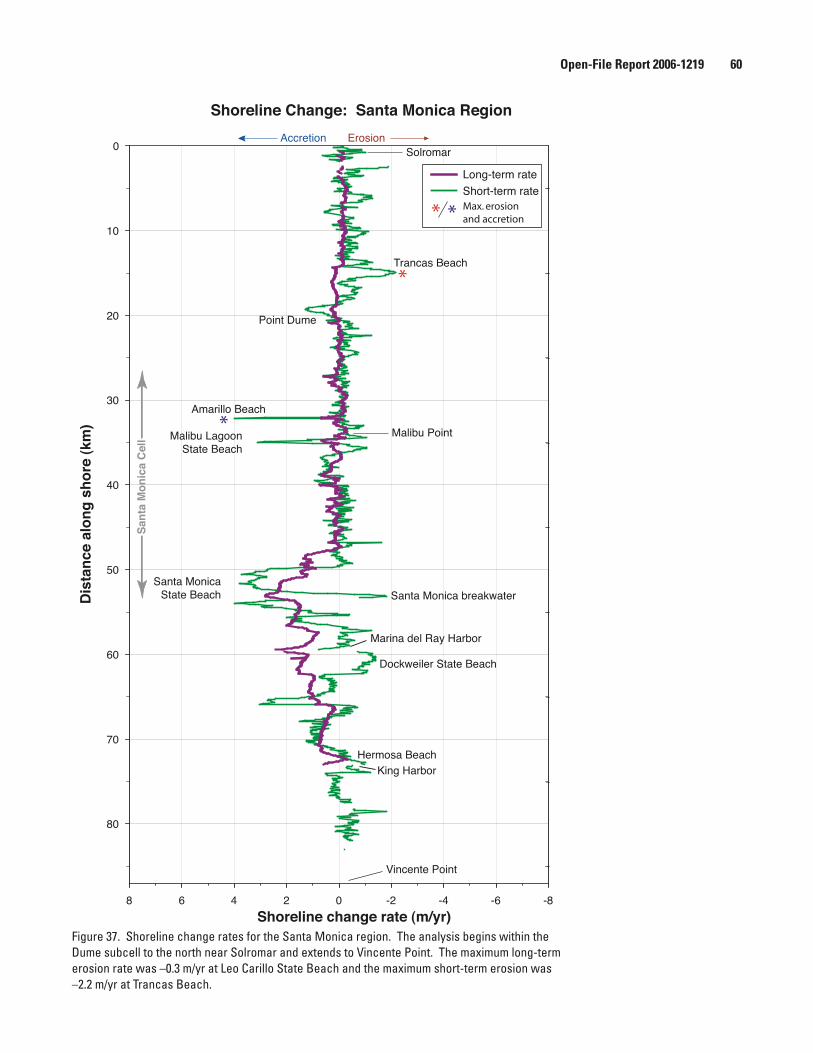
Figure 37. Shoreline change rates for the Santa Monica region. The analysis begins within the Dume subcell to the north near Solromar and extends to Vincente Point. The maximum long-term erosion rate was –0.3 m/yr at Leo Carillo State Beach and the maximum short-term erosion was –2.2 m/yr at Trancas Beach.
Shoreline Change: Santa Monica Region
Solromar
Malibu Point
Marina del Ray Harbor
Vincente Point
Trancas Beach
Amarillo Beach
Malibu LagoonState Beach
Santa Monica State Beach Santa Monica breakwater
Dockweiler State Beach
Hermosa BeachKing Harbor
ErosionAccretion
Shoreline change rate (m/yr)-8-6-4-202468
Dis
tanc
e al
ong
shor
e (k
m)
0
10
20
30
40
50
60
70
80
Sant
a M
onic
a C
ell
Figure 37
Point Dume
Short-term rateLong-term rate
* * Max. erosion and accretion
*
*
Open-File Report 2006-1219 60

the interior of Santa Monica Bay, where groin fields exist along Santa Monica State Beach, the long-term change trend became predominantly accretional to Hermosa Beach (Figure 37). According to Coastal Frontiers (1992), as of the early 1990s, this approximately 32-km section of coast had 5 breakwaters, 3 jetties, 19 groins, 5 revetments and 6 piers (Figure 38).
The short-term trend showed primarily erosion throughout the northern half of the region except north and south of Malibu. From the interior beaches of Santa Monica Bay to the southern end of the region, the short-term change trend, while highly variable, shifts to erosional (Figure 38).From the 1970s to the 1990s, the 2.5 km stretch of beach at Dockweiler State Beach eroded at a maximum rates of over 1.9 m/yr (Figure 37), despite the extensive groin fields and nourishment projects. The long-term change at Dockwei-ler State Beach was accretional, due primarily to massive nourishment projects. The distinct shift to erosion began sometime after 1970, when artificial material was no longer placed on these beaches (Flick, 1993; Wiegel, 1994).
San Pedro Region
This region includes both the San Pedro littoral cell and the Laguna subcells to the south (Figure 9). The small (~14 km long) Palos Verdes subcell to the north of Point Fermin was not covered by this report because the coastline here is rocky with occasional narrow pocket beaches, and thus has little sandy shoreline. The San Pedro region extends approximately 67 km from Point Fermin to Dana Point (Figures 14C and 39). The massive Los Angeles Harbor complex and breakwater west of Long Beach (Figure 40) occupy the northern 14 km of the region. The communities of Long Beach, Huntington Beach and Newport Beach (Fig-ure 14C) are all located within the San Pedro region. The Laguna littoral subcells begin at Newport Bay and extend south approximately 22 km to Dana Point. Due to a data gap in the 1800s-era t-sheets we were not able to calculate long-term shoreline change rates along a large potion of the southern half of this region, although we do have more data for the short-term analysis.
Net long-term shoreline change rates in the San Pedro region averaged 0.5 m/yr. The average long-term erosion rate, which was –0.3 m/yr, was the highest in Southern California. However, long-term erosion was observed along
Figure 38. Oblique aerial photograph of a breakwater along the highly engineered Santa Monica coastline (Copyright © 2002-2005 Kenneth & Gabrielle Adelman, California Coastal Records Project, www.californiacoastline.org).
Open-File Report 2006-1219 61

Shoreline Change: San Pedro Region
Shoreline change (m/yr)
Dis
tanc
e al
ong
shor
e (k
m)
Long Beach
Seal Beach
Bolsa Chica State Beach
HuntingtonState Beach
West Newport Beach
Lagu
na S
ubce
llsSa
n Pe
dro
Cell
Salt Creek Beach Dana Point
Los Angeles Harbor
Laguna Beach
ErosionAccretion
Short-term rateLong-term rate
* * Max. erosion and accretion
*
*
-8-6-4-202468
20
30
40
50
60
70
Figure 39. Shoreline change rates for the San Pedro region. The analysis extends from Los Angeles Harbor to Dana Point. The maximum long-term erosion rate was –2.4 m/yr south of Newport Bay Harbor and the maximum short-term erosion was –2.2 m/yr at Newport Beach.
Open-File Report 2006-1219 62
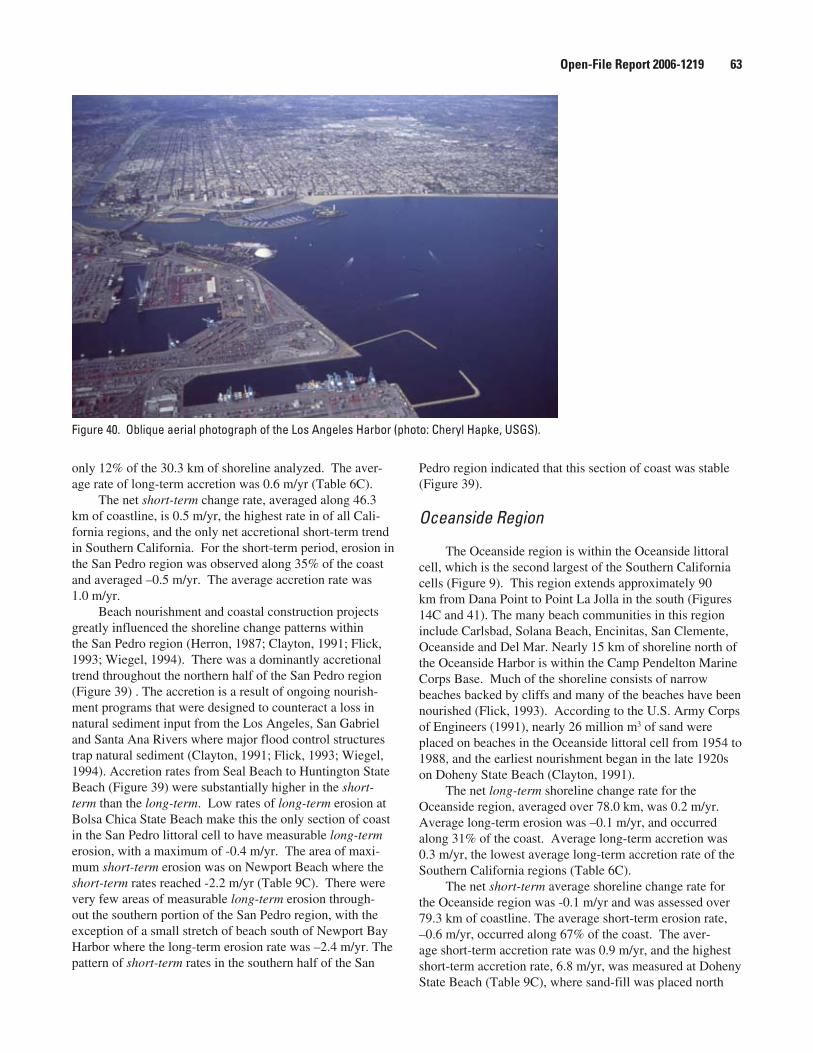
only 12% of the 30.3 km of shoreline analyzed. The aver-age rate of long-term accretion was 0.6 m/yr (Table 6C).
The net short-term change rate, averaged along 46.3 km of coastline, is 0.5 m/yr, the highest rate in of all Cali-fornia regions, and the only net accretional short-term trend in Southern California. For the short-term period, erosion in the San Pedro region was observed along 35% of the coast and averaged –0.5 m/yr. The average accretion rate was 1.0 m/yr.
Beach nourishment and coastal construction projects greatly influenced the shoreline change patterns within the San Pedro region (Herron, 1987; Clayton, 1991; Flick, 1993; Wiegel, 1994). There was a dominantly accretional trend throughout the northern half of the San Pedro region (Figure 39) . The accretion is a result of ongoing nourish-ment programs that were designed to counteract a loss in natural sediment input from the Los Angeles, San Gabriel and Santa Ana Rivers where major flood control structures trap natural sediment (Clayton, 1991; Flick, 1993; Wiegel, 1994). Accretion rates from Seal Beach to Huntington State Beach (Figure 39) were substantially higher in the short-term than the long-term. Low rates of long-term erosion at Bolsa Chica State Beach make this the only section of coast in the San Pedro littoral cell to have measurable long-term erosion, with a maximum of -0.4 m/yr. The area of maxi-mum short-term erosion was on Newport Beach where the short-term rates reached -2.2 m/yr (Table 9C). There were very few areas of measurable long-term erosion through-out the southern portion of the San Pedro region, with the exception of a small stretch of beach south of Newport Bay Harbor where the long-term erosion rate was –2.4 m/yr. The pattern of short-term rates in the southern half of the San
Pedro region indicated that this section of coast was stable (Figure 39).
Oceanside Region
The Oceanside region is within the Oceanside littoral cell, which is the second largest of the Southern California cells (Figure 9). This region extends approximately 90 km from Dana Point to Point La Jolla in the south (Figures 14C and 41). The many beach communities in this region include Carlsbad, Solana Beach, Encinitas, San Clemente, Oceanside and Del Mar. Nearly 15 km of shoreline north of the Oceanside Harbor is within the Camp Pendelton Marine Corps Base. Much of the shoreline consists of narrow beaches backed by cliffs and many of the beaches have been nourished (Flick, 1993). According to the U.S. Army Corps of Engineers (1991), nearly 26 million m3 of sand were placed on beaches in the Oceanside littoral cell from 1954 to 1988, and the earliest nourishment began in the late 1920s on Doheny State Beach (Clayton, 1991).
The net long-term shoreline change rate for the Oceanside region, averaged over 78.0 km, was 0.2 m/yr. Average long-term erosion was –0.1 m/yr, and occurred along 31% of the coast. Average long-term accretion was 0.3 m/yr, the lowest average long-term accretion rate of the Southern California regions (Table 6C).
The net short-term average shoreline change rate for the Oceanside region was -0.1 m/yr and was assessed over 79.3 km of coastline. The average short-term erosion rate, –0.6 m/yr, occurred along 67% of the coast. The aver-age short-term accretion rate was 0.9 m/yr, and the highest short-term accretion rate, 6.8 m/yr, was measured at Doheny State Beach (Table 9C), where sand-fill was placed north
Figure 40. Oblique aerial photograph of the Los Angeles Harbor (photo: Cheryl Hapke, USGS).
Open-File Report 2006-1219 63
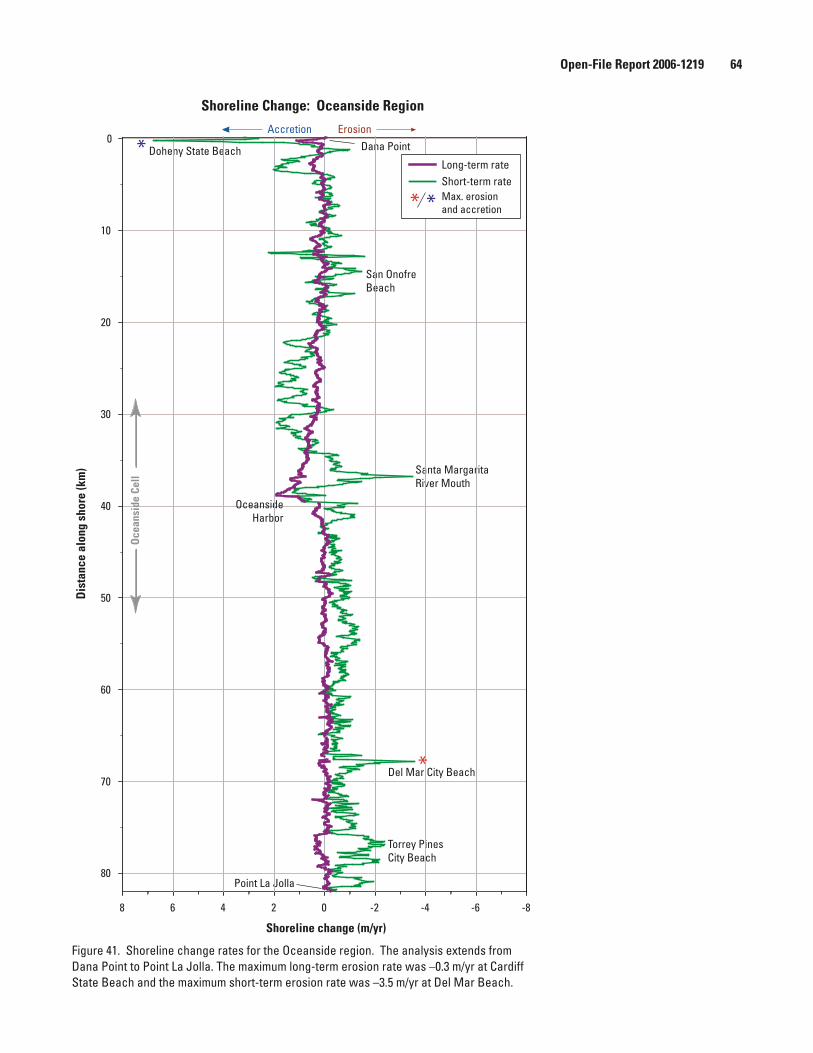
Shoreline Change: Oceanside Region
Shoreline change (m/yr)
-8-6-4-202468
Dis
tanc
e al
ong
shor
e (k
m)
0
10
20
30
40
50
60
70
80
Doheny State Beach
San Onofre Beach
Santa MargaritaRiver Mouth
OceansideHarbor
Del Mar City Beach
Torrey PinesCity Beach
Point La Jolla
Dana PointErosionAccretion
Oce
ansi
de C
ell
Short-term rateLong-term rate
* * Max. erosion and accretion
*
*
Figure 41. Shoreline change rates for the Oceanside region. The analysis extends from Dana Point to Point La Jolla. The maximum long-term erosion rate was –0.3 m/yr at Cardiff State Beach and the maximum short-term erosion rate was –3.5 m/yr at Del Mar Beach.
Open-File Report 2006-1219 6�
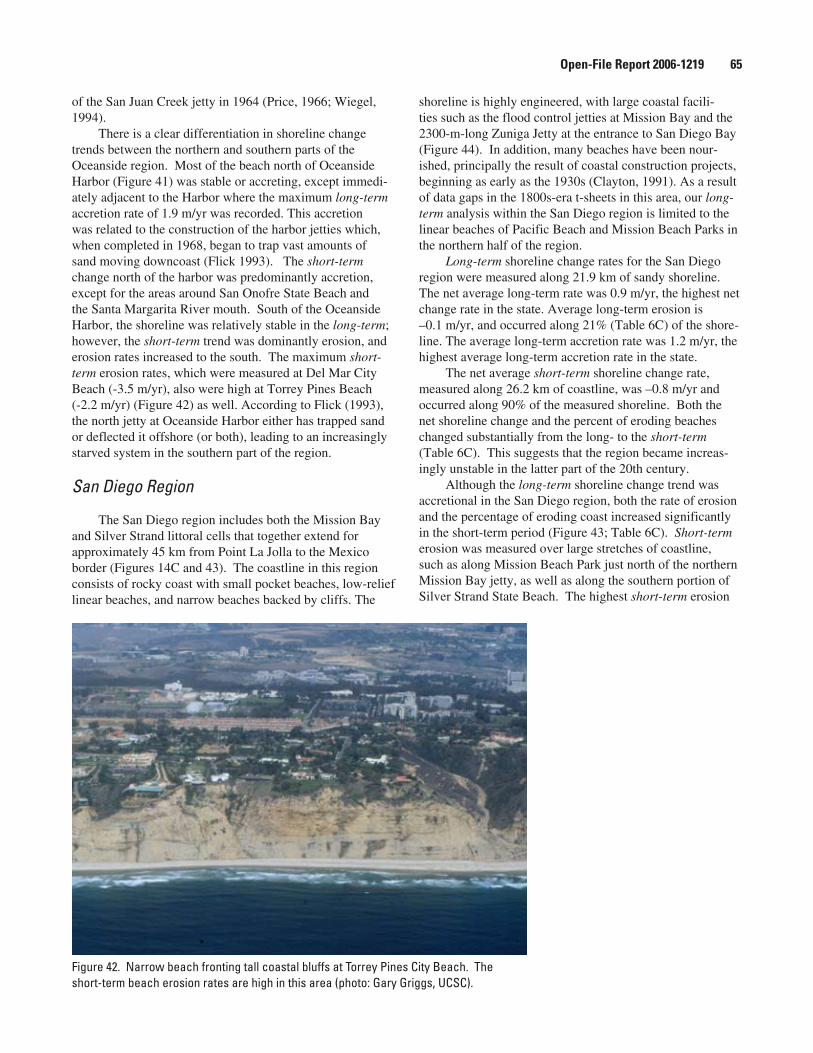
of the San Juan Creek jetty in 1964 (Price, 1966; Wiegel, 1994).
There is a clear differentiation in shoreline change trends between the northern and southern parts of the Oceanside region. Most of the beach north of Oceanside Harbor (Figure 41) was stable or accreting, except immedi-ately adjacent to the Harbor where the maximum long-term accretion rate of 1.9 m/yr was recorded. This accretion was related to the construction of the harbor jetties which, when completed in 1968, began to trap vast amounts of sand moving downcoast (Flick 1993). The short-term change north of the harbor was predominantly accretion, except for the areas around San Onofre State Beach and the Santa Margarita River mouth. South of the Oceanside Harbor, the shoreline was relatively stable in the long-term; however, the short-term trend was dominantly erosion, and erosion rates increased to the south. The maximum short-term erosion rates, which were measured at Del Mar City Beach (-3.5 m/yr), also were high at Torrey Pines Beach (-2.2 m/yr) (Figure 42) as well. According to Flick (1993), the north jetty at Oceanside Harbor either has trapped sand or deflected it offshore (or both), leading to an increasingly starved system in the southern part of the region.
San Diego Region
The San Diego region includes both the Mission Bay and Silver Strand littoral cells that together extend for approximately 45 km from Point La Jolla to the Mexico border (Figures 14C and 43). The coastline in this region consists of rocky coast with small pocket beaches, low-relief linear beaches, and narrow beaches backed by cliffs. The
shoreline is highly engineered, with large coastal facili-ties such as the flood control jetties at Mission Bay and the 2300-m-long Zuniga Jetty at the entrance to San Diego Bay (Figure 44). In addition, many beaches have been nour-ished, principally the result of coastal construction projects, beginning as early as the 1930s (Clayton, 1991). As a result of data gaps in the 1800s-era t-sheets in this area, our long-term analysis within the San Diego region is limited to the linear beaches of Pacific Beach and Mission Beach Parks in the northern half of the region.
Long-term shoreline change rates for the San Diego region were measured along 21.9 km of sandy shoreline. The net average long-term rate was 0.9 m/yr, the highest net change rate in the state. Average long-term erosion is –0.1 m/yr, and occurred along 21% (Table 6C) of the shore-line. The average long-term accretion rate was 1.2 m/yr, the highest average long-term accretion rate in the state.
The net average short-term shoreline change rate, measured along 26.2 km of coastline, was –0.8 m/yr and occurred along 90% of the measured shoreline. Both the net shoreline change and the percent of eroding beaches changed substantially from the long- to the short-term (Table 6C). This suggests that the region became increas-ingly unstable in the latter part of the 20th century.
Although the long-term shoreline change trend was accretional in the San Diego region, both the rate of erosion and the percentage of eroding coast increased significantly in the short-term period (Figure 43; Table 6C). Short-term erosion was measured over large stretches of coastline, such as along Mission Beach Park just north of the northern Mission Bay jetty, as well as along the southern portion of Silver Strand State Beach. The highest short-term erosion
Figure 42. Narrow beach fronting tall coastal bluffs at Torrey Pines City Beach. The short-term beach erosion rates are high in this area (photo: Gary Griggs, UCSC).
Open-File Report 2006-1219 6�
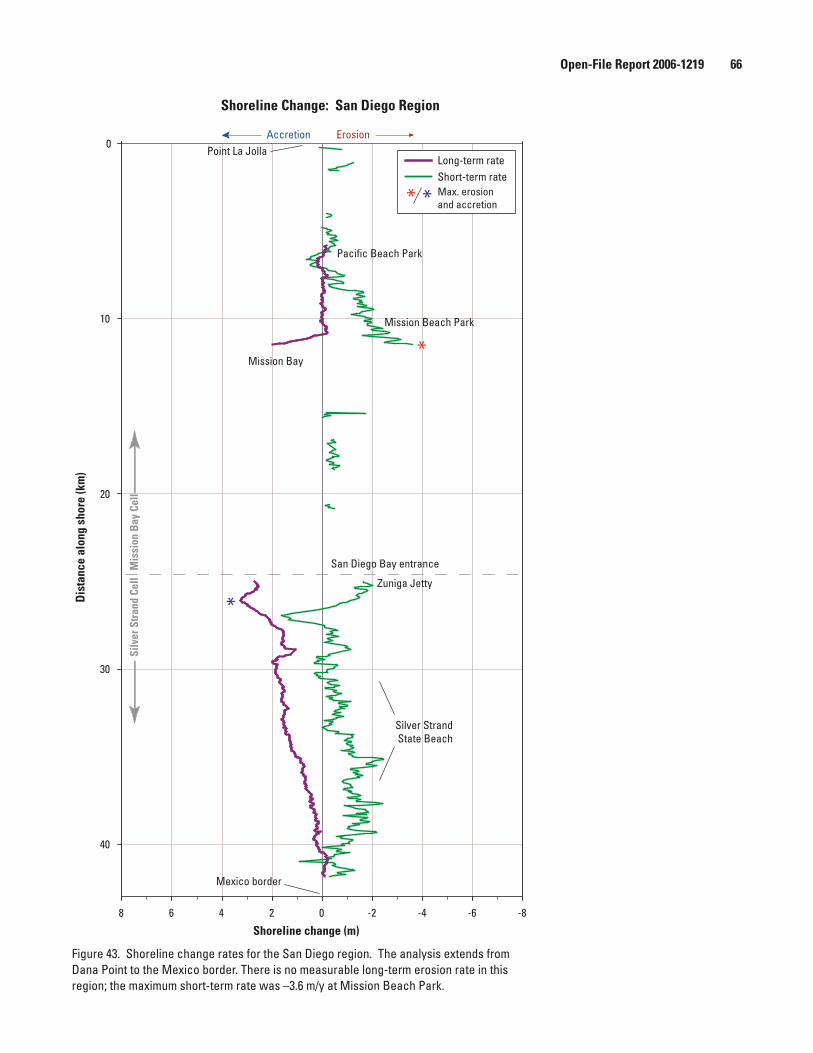
Shoreline Change: San Diego Region
Shoreline change (m)-8-6-4-202468
Dis
tanc
e al
ong
shor
e (k
m)
0
10
20
30
40
Point La Jolla
Silv
er S
tran
d Ce
llM
issi
on B
ay C
ell
Mission Bay
Mission Beach Park
Pacific Beach Park
Zuniga Jetty
Mexico border
San Diego Bay entrance
Silver StrandState Beach
ErosionAccretion
Short-term rateLong-term rate
* * Max. erosion and accretion
*
*
Figure 43. Shoreline change rates for the San Diego region. The analysis extends from Dana Point to the Mexico border. There is no measurable long-term erosion rate in this region; the maximum short-term rate was –3.6 m/y at Mission Beach Park.
Open-File Report 2006-1219 66
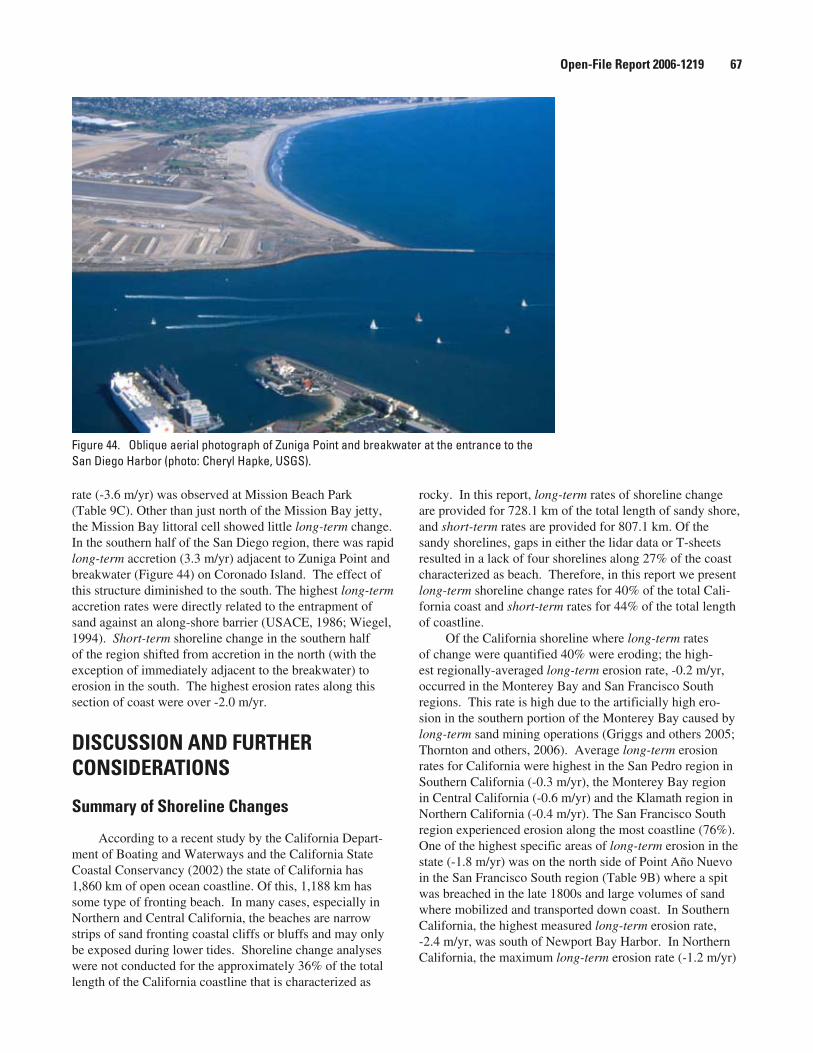
rate (-3.6 m/yr) was observed at Mission Beach Park (Table 9C). Other than just north of the Mission Bay jetty, the Mission Bay littoral cell showed little long-term change. In the southern half of the San Diego region, there was rapid long-term accretion (3.3 m/yr) adjacent to Zuniga Point and breakwater (Figure 44) on Coronado Island. The effect of this structure diminished to the south. The highest long-term accretion rates were directly related to the entrapment of sand against an along-shore barrier (USACE, 1986; Wiegel, 1994). Short-term shoreline change in the southern half of the region shifted from accretion in the north (with the exception of immediately adjacent to the breakwater) to erosion in the south. The highest erosion rates along this section of coast were over -2.0 m/yr.
DISCUSSION AND FURTHER CONSIDERATIONS
Summary of Shoreline Changes
According to a recent study by the California Depart-ment of Boating and Waterways and the California State Coastal Conservancy (2002) the state of California has 1,860 km of open ocean coastline. Of this, 1,188 km has some type of fronting beach. In many cases, especially in Northern and Central California, the beaches are narrow strips of sand fronting coastal cliffs or bluffs and may only be exposed during lower tides. Shoreline change analyses were not conducted for the approximately 36% of the total length of the California coastline that is characterized as
rocky. In this report, long-term rates of shoreline change are provided for 728.1 km of the total length of sandy shore, and short-term rates are provided for 807.1 km. Of the sandy shorelines, gaps in either the lidar data or T-sheets resulted in a lack of four shorelines along 27% of the coast characterized as beach. Therefore, in this report we present long-term shoreline change rates for 40% of the total Cali-fornia coast and short-term rates for 44% of the total length of coastline.
Of the California shoreline where long-term rates of change were quantified 40% were eroding; the high-est regionally-averaged long-term erosion rate, -0.2 m/yr, occurred in the Monterey Bay and San Francisco South regions. This rate is high due to the artificially high ero-sion in the southern portion of the Monterey Bay caused by long-term sand mining operations (Griggs and others 2005; Thornton and others, 2006). Average long-term erosion rates for California were highest in the San Pedro region in Southern California (-0.3 m/yr), the Monterey Bay region in Central California (-0.6 m/yr) and the Klamath region in Northern California (-0.4 m/yr). The San Francisco South region experienced erosion along the most coastline (76%). One of the highest specific areas of long-term erosion in the state (-1.8 m/yr) was on the north side of Point Año Nuevo in the San Francisco South region (Table 9B) where a spit was breached in the late 1800s and large volumes of sand where mobilized and transported down coast. In Southern California, the highest measured long-term erosion rate, -2.4 m/yr, was south of Newport Bay Harbor. In Northern California, the maximum long-term erosion rate (-1.2 m/yr)
Figure 44. Oblique aerial photograph of Zuniga Point and breakwater at the entrance to the San Diego Harbor (photo: Cheryl Hapke, USGS).
Open-File Report 2006-1219 67
was adjacent to the Klamath River mouth where a dynamic spit shifts spatially through time.
Overall the highest long-term accretion rates were associated with coastal engineering structures and beach nourishment sites (Southern and Central California) and where there is high sediment supply from large rivers (Northern California). The highest rate of long-term accre-tion (4.8 m/yr) occurred 10 km south of the Klamath River mouth, and appeared to be a natural rate, likely associated with sediment influx from the soft bluff and gullies that are incised in the bluffs.
In general, there was a statewide increase in the percent of sandy shoreline that eroded from the long-term (40%) to the short-term (66%). This trend implies that erosion hazards have increased in California, especially from the 1950s-70s to the late 1990s. This may be related to the climatic shift that began in the mid-1970s when California’s climate entered a period of more frequent and stronger storms, including two of the most intense, and damaging El Niño winters of the last century. It must also be remembered that our analysis only extends up to 1998 (or 2002 in some areas) and does not include trends that may have developed since.
Planned Updates and Related Research
The USGS plans to revise and report on rates of shoreline change for California every 5 to 10 years, and thus this report and associated data should be considered a work in progress. The revision interval will depend on new information and technological advances that will allow relatively rapid shoreline position acquisition, processing, and dissemination. Future revisions will also incorporate the results of ongoing shoreline research. For example, we plan to continue to refine the methodology that we applied to quantify the effects of using different shoreline proxies on the shoreline change rates. We will also explore other approaches to reduce shoreline positioning uncertainty (spatial errors) and shoreline sampling uncertainty (temporal variability). GPS technology has greatly reduced positioning errors so that they are no longer a significant component of the uncertainty analysis. GPS and lidar also eliminate the need for digitization and introduction of associated position-ing errors. The dynamics of sandy beaches ensure that short-term shoreline fluctuations will not be eliminated entirely from future shoreline positions, but data being collected in various coastal regions as part of the USGS regional studies will provide quantitative assessments of seasonal and inter-annual changes in shoreline position. These assessments will provide a means to determine if the detected shoreline change is within the expected range of movement and allow us to further constrain the uncertainties.
Influence of Human Activities
As coastal communities continue to grow along the California Coast, potential conflicts may arise between preservation of property (typically privately owned) and conservation of the beach (typically publicly owned). Past social responses indicate that these conflicts most likely will be resolved through a combination of beach nourishment projects and shoreline protection structures. Both of these engineering responses to erosion alter the natural beach pro-cesses and eventually lead to artificial shoreline positions.
Adding sand to eroding beaches is a common method to mitigate storm damage and to maintain a recreational beach. Beach nourishment alters the rates of retreat by causing rapid artificial accretion of the shoreline. In those areas where nourishment is frequent, the trends of shore-line change will be biased toward accretion or stability. Additionally, the proposed removal of dams in some of the watersheds in California may alter the shoreline change trends, as previously impounded sediment begins to make its way into the littoral system. Passive erosion of the beach by emplacement of seawalls or revetments may initially lead to an increase in the rate of erosion, but the rate will slow to zero if the beach erodes away in front of the structure. Because many beaches are already altered by shoreline protection projects and more will be altered in the future, the methods of analyzing shoreline movement have to take shoreline stabilization activities into account so that the documented trends and derived rates of change can be expressed in their proper context.
Distinguishing between natural rates of shoreline movement and those influenced directly by human activi-ties is crucial when historical rates of change are used for planning and to project future shoreline positions. Improved methods of analyzing shoreline movement will be needed to document the natural rates of shoreline change.
REFERENCES
Anders, F.J., and Byrnes, M.R., 1991, Accuracy of shoreline change rates as determined from maps and aerial photo-graphs: Shore and Beach, v. 59, p. 17-26.
Anderson, R.S., Densmore, A.L., and Ellis, M.A., 1999, The generation and degradation of marine terraces: Basin Research, v. 11, p. 7-19.
Barnard, P.L. and Hanes, D.M., 2006, Coastal monitoring of the May 2005 dredge disposal offshore of Ocean Beach, San Francisco, California: U.S. Geological Survey, Open-File Report, Report Series 2006-1140, 27 pp., http://pubs.usgs.gov/of/2006/1140/
Barton, C.C., Dismukes, J.S., and Morton, R.A., 2003, Complexity analysis of the change in shoreline position at Duck, NC: Proceedings Coastal Sediments ‘03, 7p.
Open-File Report 2006-1219 68

Bascom, W., 1954, Characteristics of natural beaches: Proceedings of the 4th Coastal Engineering Conference, 1953, in Johnson, J.W. (ed.), Council on Wave Research, The Engineering Foundation, p. 163-180.
Benumof, B.T., Storlazzi, C.D., Seymour, R.J., and Griggs, G.B. 2000, The relationship between incident wave energy and seacliff erosion rates: San Diego County, California: Journal of Coastal Research, v. 16, n. 4, p. 1162-1178.
Brown, K.M., Richmond, B.M., and Scholar, D.C., 1998, Oceanographic influence on beach morphology during an El Niño winter along the Santa Cruz County Coast: EOS Transactions, AGU Fall Mtg., San Francisco CA., v. 79, n. 45, p. F486.
California Coastal Commission, 1997, California Coastal Access Guide (5th Edition), Berkeley, University of Cali-fornia Press, 304 pp.
California Department of Boating and Waterways and Cali-fornia State Coastal Conservancy, 2002, California Beach Restoration Study, Sacramento, CA, 280 pp.
California Dept. of Navigation and Ocean Development, 1977, Study of beach nourishment along the southern California coastline: State of California, the Resources Agency.
California Geological Survey, 2002a, California Geomor-phic Provinces: CGS Note #36, 4 pp.
California Geological Survey, 2002b, Generalized Geologic Map of California: CGS Note #17, 4 pp.
Chin, J.L., Wong, F.L., and Carlson, P.R., 2004, Shifting shoals and shattered rocks – how man has transformed the floor of west-central San Francisco Bay: U.S. Geological Survey Circular 1259, 30 pp.
Clayton, T.D., 1991, Beach replenishment activities on the U.S. Continental Pacific Coast: Journal of Coastal Research, v. 7, n. 4, p. 1195-1210.
Cooper, W.S. 1967, Coastal Dunes of California: Geologi-cal Society of America Memoir 104, 131 pp.
Coastal Frontiers, 1992, Historical changes in the beaches of Los Angeles County, Malaga Cove to Topanga Canyon, 1935-1990: County of Los Angeles, Dept. of Beaches and Harbors, 105 pp.
Crowell, M., and Leatherman, S.P., eds., 1999, Coastal erosion mapping and management: Journal of Coastal Research, Special Issue 28, 196 pp.
Crowell, M., Douglas, B.C., and Leatherman, S.P., 1997, On forecasting future U.S. shoreline positions: A test of algorithms: Journal of Coastal Research, v. 13, p. 1245-1255.
Crowell, M., Leatherman, S.P., and Buckley, M.K., 1993, Shoreline change rate analysis: Long-term versus short-term: Shore and Beach, v. 61, n. 2, p. 13-20.
Crowell, M., Leatherman, S.P., and Buckley, M.K., 1991, Historical shoreline change; Error analysis and mapping accuracy: Journal of Coastal Research, v. 7, p. 839-852.
Dingler, J.R. and Reiss, T.E., 2002, Changes to Monterey Bay beaches from the end of the 1982-83 El Niño through the 1997-98 El Niño, In Eittreim S.L. and Noble, M. (eds.), Marine Geology Special Issue: Seafloor Geology and Natural Environment of the Monterey Bay National Marine Sanctuary, v. 181, p. 249-264.
Dolan, R., Anders, F. and Kimball, S., 1985, Coastal erosion and accretion, In National Atlas of the United States of America, U.S. Geological Survey, Reston, VA.
Douglas, B.C., and Crowell, M., 2000, Long-term shore-line position prediction and error propagation: Journal of Coastal Research, v. 16, p. 145-152.
Flick, R.E., 1993, The myth and reality of Southern Califor-nia beaches: Shore and Beach, v. 61, no. 3, p.3-13.
Flick, R.E., 1998, Comparison of California tides, storm surges, and mean sea level during the El Nino winters of 1982 –83 and 1997-1998: Shore and Beach, v. 66, n. 3, p. 7-11.
Flick, R.E., Murray, J.F., and Ewing, L.C., 2003, Trends in the United States Tidal Datum Statistics and Tide Range: Journal of Waterway, Port and Coastal Engineering, v. 129, n. 4, p. 155-164.
Griggs, G.B., 1994, California’s Coastal Hazards: Journal of Coastal Research Special Issue No. 12, p. 1-15.
Griggs, G.B. and Fulton-Bennett, K., 1988, Rip-rap revet-ments and seawalls and their effectiveness along the Central California coast: Shore and Beach, v. 56, n. 2, p. 3-11.
Griggs, G. B., and Johnson, R. E., 1976, Effects of the Santa Cruz Harbor on coastal processes of Northern Monterey Bay, California: Environmental Geology, v. 1, n. 5, p. 299 312.
Griggs, G.B. and Johnson, R. E., 1979, Coastline Erosion: Santa Cruz County, California: California Geology, v. 32, n. 4, p. 67 76.
Open-File Report 2006-1219 69
Griggs, G.B. and Patsch, K., 2004, California’s coastal cliffs and bluffs, In M.A. Hampton and G.B. Griggs (eds.), For-mation, Evolution, and Stability of Coastal Cliffs – Status and Trends: U.S. Geological Survey Professional Paper 1693, p. 53-64.
Griggs, G.B. and Patsch, K., 2005, Año Nuevo to the Mon-terey Peninsula: In Living with the Changing California Coast, Griggs, Patsch and Savoy (eds.), University of California Press, p. 228-269.
Griggs G.B., Patsch, K., and Savoy, L., 2005a, Living with the Changing California Coast, University of California Press, 540 pp.
Griggs G.B., Patsch, K., and Savoy, L., 2005b, The evolu-tion of the California Coast: In Living with the Chang-ing California Coast, Griggs , Patsch and Savoy (eds.), University of California Press, Berkeley, p. 8-17.
Griggs G.B., Patsch, K., and Savoy, L., 2005c, Understand-ing the shoreline: In Living with the Changing California Coast, Griggs , Patsch and Savoy (eds.), University of California Press, Berkeley, p. 38-74.
Griggs, G.B. and Savoy, L.E., 1985, Living With the California Coast: Duke University Press, Durham, North Carolina, 393 pp.
Griggs, G., Weber, J., Lajoie, K. and Mathieson, S., 2005, San Francisco to Año Nuevo: In Living with the Chang-ing California Coast, Griggs, Patsch and Savoy (eds.), University of California Press, p. 270-310.
Guza, R. and O’Reilly, W, 2001, Wave prediction in the Santa Barbara Channel: MMS OCS Study 2001-005, Coastal Research Center, Marine Science Institute, University of California, Santa Barbara, California, MMS Cooperative Agreement Number 14-35-0001-30758, 8 pp.
Habel, J.S. and Armstrong, G.A., 1978, Assessment and atlas of shoreline erosion along the California coast: State of California Department of Boating and Ocean Development, Sacramento, CA, 277 pp.
Hapke, C.J., 2005, Estimated material yield from coastal landslides based on historical digital terrain modeling, Big Sur, California: Earth Surface Landforms and Pro-cesses, v. 30, p. 679-697.
Hapke, C., 2005, Monterey Peninsula to Morro Bay: In Liv-ing with the Changing California Coast, G. Griggs and K. Patsch (eds.), University of California Press, Berkeley, p. 311-333.
Harden, D.R., 1998, California Geology, Prentice-Hall, New Jersey, 477 pp.
Hare, S.R. and Mantua, N.J., 2002, Empirical evidence for North Pacific regime shifts in 1977 and 1989: Progress in Oceanography, v. 24, p. 6-14.
Hearon, G and Willis, C., 2002, Chapter 2: California Beach Setting, In M. Coyne and K. Sterrett (eds), California Beach Restoration Study, California Department of Boating and Waterways and State Coastal Conservancy, Sacramento, California, p. 2-1 to 2-6. Available on-line at: http://www.dbw.ca.gov/beachreport.asp
The Heinz Center, 2000, Evaluation of erosion hazards: The H. John Heinz III Center for Science, Economics and the Environment, Washington, D.C., 203 pp.
Herron, W.J., 1980, Artificial beaches in Southern Califor-nia: Shore and Beach, v. 48, n. 1, p. 3-12.
Herron, W.J., 1987, Sand Replenishment in Southern Cali-fornia: Shore and Beach, v. 55, n. ¾, p. 87-91.
Hickey, B.M., 1979, The California Current System-Hypotheses and Facts: Progress in Oceanography, v. 8, n. 4, p. 191-279.
Inman, D.L., and Chamberlain, T.K., 1960, Littoral sand budget along the southern California coast, In Volume of Abstracts, Report of the 21st International Geological Congress, Copenhagen, Denmark, p. 245-6.
Inman, D.L. and Frautschy, J. D., 1966, Littoral processes and the development of shorelines: Coastal Engineer-ing—Santa Barbara Specialty Conference, October 1966, American Society of Civil Engineers, p. 511-536.
Inman, D.L. and Jenkins, S.A., 1999, Climate change and the episodicity of sediment flux of small California rivers: Journal of Geology, V. 107, p. 251-270.
Inman, D.L. and Masters, P.M., 1991, Budget of sediment and prediction of the future state of the coast: State of the Coast Report, San Diego Region, Coast of Califor-nia Storm and Tidal Waves Study, U.S. Army Corps of Engineers, Los Angeles District, Ch 9, 105 pp. Available online: http://repositories.cdlib.org/sio/cmg/10/
Inman, D.L. and Nordstrom, C.E., 1971, On the tectonic and morphologic classifications of coasts: Journal of Geology, v. 79, p. 1-21.
Johnson, J.W., 1971, The significance of seasonal beach changes in tidal boundaries: Shore and Beach, v. 39, n. 1, p. 26-31.
Krabill, W., Wright, C., Swift, R., Frederick, E., Man-izade, S., Yungel, J., Martin, C., Sonntag, J., Duffy, M., Hulslander, W., and Brock, J., 2000. Airborne laser map-ping of Assateague National Seashore Beach. Photogram-metric Engineering & Remote Sensing, v. 66, p. 65-71.
Open-File Report 2006-1219 70
Leidersdorf, C.B., Hollar, R.C., and Woodell, G., 1994, Human Invervention with the Beaches of Santa Monica Bay, California: Shore and Beach, v. 62, n. 3, p. 29-38.
Maloney, N. and Chan, K. M., 1974, A summary of knowl-edge of the Southern California Coastal Zone and Off-shore Areas (SOK, SC): v. 1, Sept. 1974, The Southern California Ocean Studies Consortium of the California State Universities and Colleges, Report to Bureau of Land Management, Department of Interior, Washington, D.C.
Merritts, D., Savoy, L., Griggs, G. and Walker, R., 2005, Point Delgada to Point Arena: In Living with the Chang-ing California Coast, Griggs , Patsch and Savoy (eds.), University of California Press, p. 192-203.
Moore, L. J., 2000, Shoreline mapping techniques: Journal of Coastal Research, v. 16, p. 111-124.
Moore, L., Ruggiero, P., and List. J., 2006, Comparing mean high water and high water line shorelines: Should proxy-datum offsets be incorporated in shoreline change analysis?: Journal of Coastal Research, v. 22, n. 4, p. 894-905.
Morton, R.A., 1991, Accurate shoreline mapping: past, present, and future: American Society of Civil Engineers, Coastal Sediments ‘91, v. 1, p. 997-1010.
Morton, R.A., 1996, Geoindicators of coastal wetlands and shorelines, in Berger, A.R., and Iams, W.J., eds., Geoin-dicators: Assessing rapid environmental changes in earth systems: A.A. Balkema, Rotterdam, p. 207-230.
Morton, R.A., Miller T.L, and Moore, L.J., 2004, National Assessment of shoreline change: Part 1, Historical shore-line changes and associated coastal land loss along the U.S. Gulf of Mexico, U.S. Geological Survey Open File Report 2004-1043, 44 pp.
Nelson, C.S. 1977, Wind stress and wind stress curl over the California Current: NOAA Tech. Rep. NMFS SSRF-714, U.S. Dept. of Commerce, NOAA, NMFS, 87 pp.
Newberger, P., 1982, Physical oceanography and meteorol-ogy of the California Outer Continental Shelf: POCS Technical Paper No. 82-2, Prepared by Minerals Manage-ment Service, Pacific OCS Region for U.S. Department of the Interior.
Norris, R.M., 1964, Dams and beach sand supply in South-ern California: Papers in Marine Geology, R. L. Miller (ed.), New York: Macmillan, pp. 154 71.
Orme, A.R., 1992, Late Quaternary deposits near Point Sal, South-Central California: A time frame for coastal-dune emplacement: In Fletcher, C.H. and Wehmiller, J.F. (eds.), Quaternary Coasts of the United States: Marine and Lacustrine Systems, SEPM Special Publication No. 48, p. 309-315.
Pajak, M.J., and Leatherman, S.P., 2002, The high water line as a shoreline indicator: Journal of Coastal Research, v. 18, p. 329-337.
Peterson, C.D. and Phipps, J.B., 1992, Holocene sedimen-tary framework of Grays Harbor basin, Washington, USA: In Fletcher, C.H. and Wehmiller, J.F. (eds.), Quaternary Coasts of the United States: Marine and Lacustrine Systems, SEPM Special Publication No. 48, p. 273-286.
Pincetl, S.S., 2004, Transforming California: A Political History of Land Use and Development: John Hopkins University Press, Baltimore, MD, 400 pp.
Price, R.C., 1966, Statement of the California Department of Water Resources: Shore and Beach, v. 34, n. 1, p. 22-32.
Richmond, B.M., 1988, Ephemeral delta development at the mouth of Aptos Creek, Northern Monterey Bay, In Ellen, S.D., and Wieczorek, G.F. (eds.), Landslides, floods, and marine effects of the storm of January 3-5, 1982, in the San Francisco Bay region, California: U.S. Geological Survey Professional Paper 1434, p. 265-281.
Ruggiero, P., Kaminsky, G.M., and Gelfenbaum, G., 2003, Linking proxy-based and datum-based shorelines on a high-energy coastline: Implications for shoreline change analyses: Journal of Coastal Research Special Issue 38, p. 57-82.
Ruggiero, P., Komar, P.D., McDougal, W.G., Marra, J.J. and Beach, R.A., 2001, Wave runup, extreme water levels and the erosion of properties backing beaches: Journal of Coastal Research, v. 17, n. 2, p. 407-419.
Ruggiero, P., Komar, P.D., McDougal, W.G. and Beach, R.A., 1996, Extreme water levels, wave runup, and coastal erosion, Proceedings 25th Coastal Engineering Conference, ASCE, 2793-2805.
Runyan, K. B., and Griggs, G. B., 2002, Contributions from Coastal Cliff Erosion to the Littoral Budget, In M. Coyne and K. Sterrett (eds.), California Beach Restoration Study, California Department of Boating and Waterways and State Coastal Conservancy, Sacramento, California, 51pp. Available on-line: http://www.dbw.ca.gov/beachreport.asp
Sallenger, A.H., Krabill, W., Swift, R., Brock, J., List, J., Hansen, M., Holman, R.A., Manizade, S., Sontag, J., Meredith, A., Morgan, K., Yunkel, J.K., Frederick, E. and Stockdon, H., 2003. Evaluation of airborne scanning lidar for coastal change applications: Journal of Coastal Research, v.19, p. 125-133.
Open-File Report 2006-1219 71
Savoy, L., Merritts, D. Griggs, G., and Rust, D., 2005, The Northern California Coast: The Oregon Border to Shelter Cove: In Living with the Changing California Coast, Griggs, Patsch and Savoy (eds.), University of California Press, p. 163-191.
Seymour, R.J., 1998, Effects of El Niño’s on the West Coast wave climate: Shore and Beach, v. 66, n. 3, p. 3-6.
Shalowitz, A.L., 1964, Shore and sea boundaries. Publica-tion 10-1, U.S. Department of Commerce, Washington, DC, 749 pp.
Shepard, F.P., 1950, Beach Cycles in Southern California: USACE Beach Erosion Board, Technical Memorandum No. 20, 26 pp.
Stauble, D.K., and Brumbaugh, R.W., 2003, An assessment of the nation’s shorelines, USA: Shore and Beach, v. 71, p. 11-18.
Stockdon, H.F., Holman, R.A., Howd, P.A. and Sallenger, A.H. Jr., 2006, Empirical parameterization of setup, swash, and runup: Coastal Engineering, v. 53, p.573-588.
Stockdon, H.F., Sallenger, A.H., List, J.H. and Holman, R.A., 2002, Estimation of shoreline position and change from airborne topographic lidar data. Journal of Coastal Research, v. 18, p. 502-513.
Storlazzi, C.D. and Griggs, G.B., 1998, The 1997-98 El Niño and erosion processes along the central coast of California: Shore and Beach, v. 66, n. 3, p. 12-17.
Storlazzi, C. and Griggs, G.B., 2000, The influence of El Niño-Southern Oscillation (ENSO) events on the evolu-tion of central California’s shoreline: Geol. Soc. Am. Bull., v. 112, n. 2, p. 236-249.
Storlazzi, C.D., Willis, C.M, and Griggs, G.B. 2000, Com-parative impacts of the 1982-83 and 1997-98 El Niño winters on the central California coast: Journal of Coastal Research, v. 16, n. 4, p. 1022-1036.
Storlazzi,C.D. and Wingfield,D.K, 2005, Spatial and tem-poral variations in oceanographic and meteorologic forc-ing along Central California:1980-2002: U.S. Geological Survey Scientific Investigations Report 2005-5085, 30 pp.
Taylor, J.R., 1997, An Introduction to Error Analysis: The Study of Uncertainties in Physical Measurement, Univer-sity Science Books, Sausalito, CA, 327 pp.
Thieler, E.R., and Danforth, W.W., 1994, Historical shore-line mapping (1). Improving techniques and reducing positioning errors: Journal of Coastal Research, v. 10, p. 549-563.
Thieler, E.R., Himmelstoss, E.A., Zichichi, J.L., and Miller, T.L., 2005, Digital Shoreline Analysis System (DSAS) version 3.0; An ArcGIS© extension for calculating shore-line change: U.S. Geological Survey Open-File Report 2005-1304.
Thompson, Warren C., 1987, Seasonal orientation of Cali-fornia beaches: Shore and Beach, v. 55, n. ¾, p. 67-70.
Thornton, E.B., Sallenger, A.H., Conforto Sesto, J., Egley, L. A. , McGee, T., and. Parsons, A.R., 2006, Sand Mining Impacts on Long-Term Dune Erosion in Southern Mon-terey Bay, Marine Geology, v. 229, n. 1-2, p. 45-58.
U.S. Army Corps of Engineers, 1971, National Shoreline Study, California Regional Inventory, 106 pp.
U.S. Army Corps of Engineers, 1986, Southern California coastal processes data summary: Coast of California Storm and Tidal Wave Study, CCSTWS 86-1, 572 pp.
U.S. Army Corps of Engineers, 1991, State of the Coast Report, San Diego Region: Coast of California Storm and Tidal Wave Study, Los Angeles District.
U.S. Army Corps of Engineers, 2003, California costal sediment master plan, 905(b) reconnaissance report, Los Angeles District, 34 pp.
USGS/UCSC/NASA/NOAA Collaborative Research Group, 1998, A collaborative program to investigate the impacts of the 1997-98 El Niño winter along the California coast: Shore and Beach, v. 66, n. 3, p. 24-32.
Weber, K.M., List J.H., and Morgan, K.M., 2005, An opera-tional mean high water datum for determination of shore-line position from topographic lidar data: U.S. Geological Survey Open-File Report 2005-1027.
Wiegel, R.L., 1994, Ocean beach nourishment on the USA Pacific Coast: Shore and Beach, v. 62, n. 1, p. 11-36.
Wiegel, R.L., 2002, Large quantity of sand blown inland over top of seawall: Shore and Beach Observation, v. 70, n. 2, p. 11-12.
Willis, C.M., 2002a, Impediments to fluvial delivery of sediment to the shoreline, In M. Coyne and K. Sterrett (eds.), California Beach Restoration Study: California Department of Boating and Waterways and State Coastal Conservancy, Sacramento, California, p. 130-177. Available on-line at: http://www.dbw.ca.gov/beachreport.asp
Willis, C.M., 2002b, Assessing natural and human altera-tions to coastal sediment supply in California and the impacts on regional beach sustainability, Ph.D. Disserta-tion, University of California Santa Cruz, Santa Cruz, CA, 142 pp.
Open-File Report 2006-1219 72