Embed Size (px)
Citation preview

© LafargeHolcim Ltd 2015
Plant Name: Thondebhavi
National Award for “Excellence in Energy Management” – 2018

© 2015 Company
Company Profile
2
Set up as a Green Field Project in Lush
Green Village of Thondebhavi
Installed Capacity – 2 Million MT (OPC/PPC)
Grinding System with VRM (Make : Loesche)
Capacity – 250 TPH (PPC)
ISO 14001: 2015 and ISO 50001:2011 Certified
1
2
3
4 42%
53%
6%
OPC PPC C+
Product Portfolio
Lowest SEEC across ACC/ACL5

© 2015 Company 3
Plant Process Layout - TCW
Clinker silo
100000 t
Cement silos2x 10000t1x1000t
PPC OPC
Fly ash storage silo
1X3500 t
Fly ash feeding silo
1X 500 t
Fly Ash Bulker Unloading
Wagon Tippler
Clinker Hopper (500T)
Gypsum Hopper (300T)
Gypsum Gantry 15000t
Reclaimer (120TPH)
Gypsum Crusher
(150TPH)
Mill Bag House & Fan
(3300KW fan motor)
Vertical Roller Mill – LM 56.3+3 (250 TPH PPC)
Installed Motor capacity 5400 KW
WF
Mill Building
RMHBuilding
Gypsum CrBuilding
Packing Plant
Truck Loading &
Bulk Loading

© 2015 Company
1. Specific Electrical Energy Consumption
2.1
SEEC (kWh/t Cement)
27.18 26.84 25.12 23
3.49 3.112.69
2
2016 2017 YTD July'18 Aspiration
Auxiliaries
Mill Section
30.67 29.9627.81
25.0

© 2015 Company
1. Specific Electrical Energy Consumption – Product wise
OPC PPC
28.3 28.2 26.21
3.5 3.12.69
2016 2017 YTD July'18
31.8 31.3128.98
25.72 25.32 23.45
3.5 3.12.69
2016 2017 YTD July'18
29.22 28.4226.14
Mill Section
Auxiliaries

© 2015 Company
2. Internal Benchmark
53.15
52.30
48.47
47.58
46.10
42.61
41.22
40.07
39.67
38.70
37.05
36.26
34.28
32.49
32.03
31.03
27.81
0.00 10.00 20.00 30.00 40.00 50.00 60.00
Plant 1
Plant 2
Plant 3
Plant 4
Plant 5
Plant 6
Plant 7
Plant 8
Plant 9
Plant 10
Plant 11
Plant 12
Plant 13
Plant 14
Plant 15
Plant 16
THONDEBHAVI
SEEC (kWh/t Cem) – YTD 2018
61.45
53.49
50.38
48.84
47.70
45.54
42.36
41.16
39.20
38.83
38.83
36.70
35.72
34.96
33.72
32.22
29.91
0.00 20.00 40.00 60.00 80.00
Plant 1
Plant 2
Plant 3
Plant 4
Plant 5
Plant 6
Plant 7
Plant 8
Plant 9
Plant 10
Plant 11
Plant 12
Plant 13
Plant 14
Plant 15
Plant 16
THONDEBHAVI
SEEC (kWh/t Cem) - 2017
Lowest Specific Electrical Energy Consumption across ACC/ACL
© 2015 Company
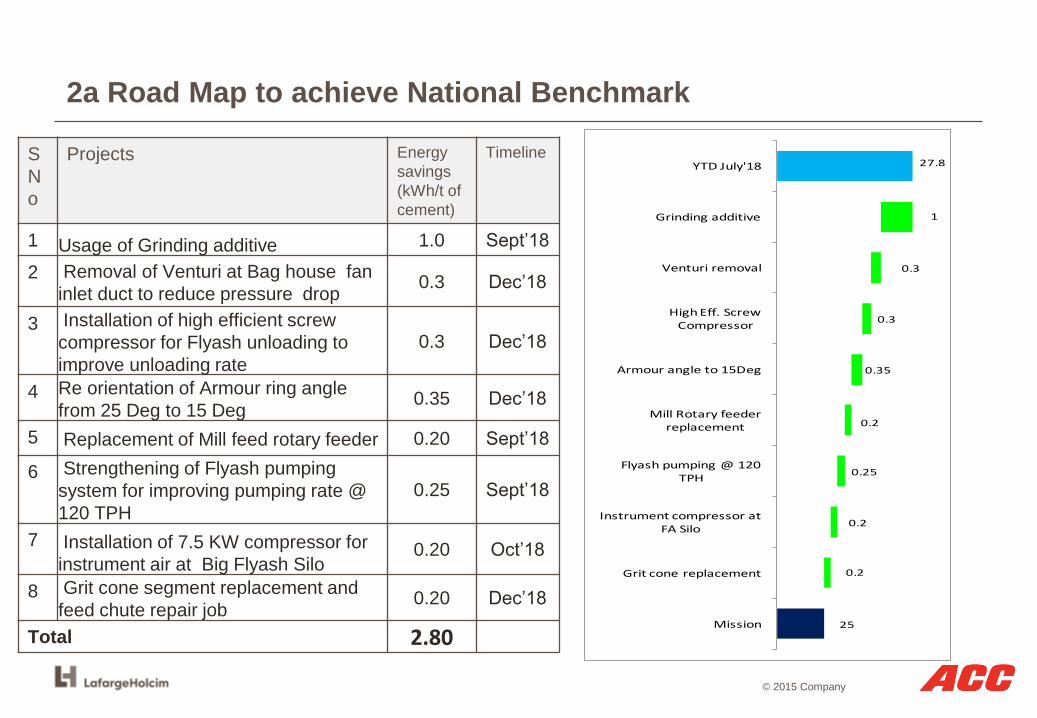
2a Road Map to achieve National Benchmark
S
N
o
Projects Energy
savings
(kWh/t of
cement)
Timeline
1 Usage of Grinding additive 1.0 Sept’18
2 Removal of Venturi at Bag house fan
inlet duct to reduce pressure drop0.3 Dec’18
3 Installation of high efficient screw
compressor for Flyash unloading to
improve unloading rate
0.3 Dec’18
4 Re orientation of Armour ring angle
from 25 Deg to 15 Deg 0.35 Dec’18
5 Replacement of Mill feed rotary feeder 0.20 Sept’18
6 Strengthening of Flyash pumping
system for improving pumping rate @
120 TPH
0.25 Sept’18
7 Installation of 7.5 KW compressor for
instrument air at Big Flyash Silo 0.20 Oct’18
8 Grit cone segment replacement and
feed chute repair job0.20 Dec’18
Total 2.80
27.8
25
1
0.3
0.3
0.35
0.2
0.25
0.2
0.2
YTD July'18
Grinding additive
Venturi removal
High Eff. Screw Compressor
Armour angle to 15Deg
Mill Rotary feeder replacement
Flyash pumping @ 120 TPH
Instrument compressor at FA Silo
Grit cone replacement
Mission

© 2015 Company
3a. Energy saving projects implemented in FY 2015-16
8
No Title of ProjectAnnual
Electrical
Saving (kWh)
Annual
Electrical
Cost Saving
(Rs million)
Total Annual
Savings (Rs
million)
Investment Made
(Rs million)
Payback
(Months)
1Optimisation of Flyash
pumping circuit60000 0.36 0.36 0 -
2VFD for cement Silo Bag filter
Fan29700 0.18 0.18 0.3 20
3False air arresting VRM
Roller seals83424 0.5 0.5 0 -
4Plant lighting section wise
through DCS45000 0.27 0.27 0 -
Total 218124 1.31 1.31 0 -
© 2015 Company
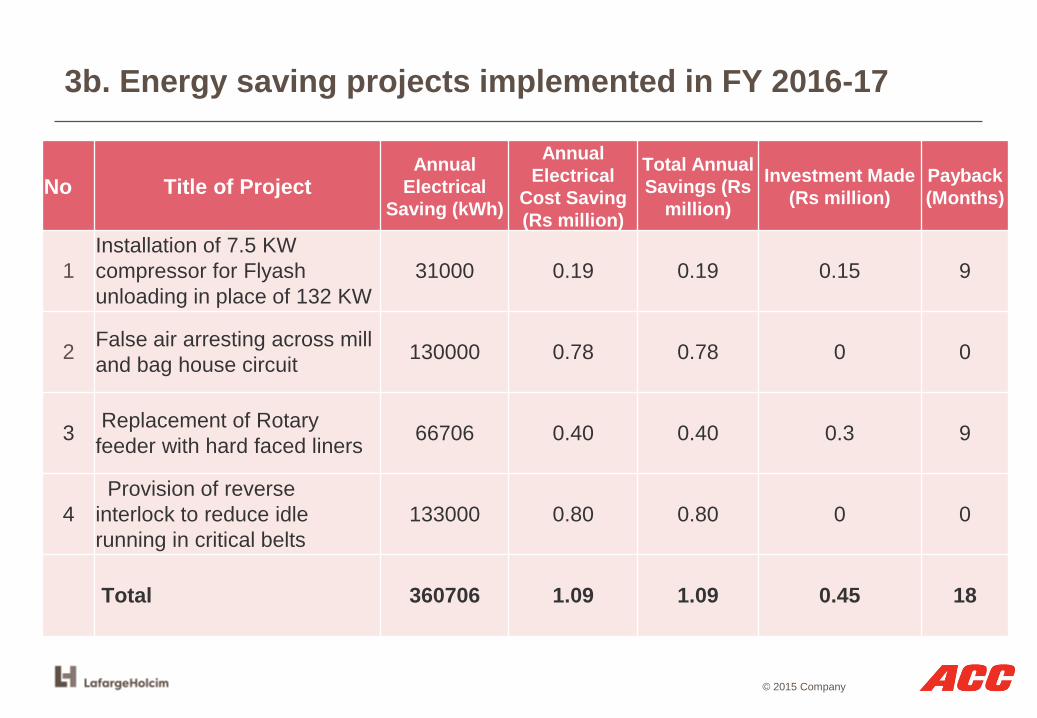
3b. Energy saving projects implemented in FY 2016-17
9
No Title of ProjectAnnual
Electrical
Saving (kWh)
Annual
Electrical
Cost Saving
(Rs million)
Total Annual
Savings (Rs
million)
Investment Made
(Rs million)
Payback
(Months)
1
Installation of 7.5 KW
compressor for Flyash
unloading in place of 132 KW
31000 0.19 0.19 0.15 9
2False air arresting across mill
and bag house circuit130000 0.78 0.78 0 0
3Replacement of Rotary
feeder with hard faced liners66706 0.40 0.40 0.3 9
4
Provision of reverse
interlock to reduce idle
running in critical belts
133000 0.80 0.80 0 0
Total 360706 1.09 1.09 0.45 18

© 2015 Company
3c. Energy saving projects implemented in FY 2017-18
10
No Title of ProjectAnnual
Electrical
Saving (kWh)
Annual
Electrical
Cost Saving
(Rs million)
Total Annual
Savings (Rs
million)
Investment Made
(Rs million)
Payback
(Months)
1
Installation of mesh at mill
inlet ducts to avoid material
accumulation and pressure
drop
332900 1.9 1.9 0 0
2
Modified Water Spray
Nozzles with compressed air
for uniform distribution of
water
166460 0.99 0.99 0 0
3
Build up of Support ring
Height from 40mm to 65 mm
and Width from 35 mm to
55mm.
277437 1.66 1.66 0 0
4
Removal of stump cone and
extension of grit cone chute
by 400mm to reduce main
drive load
166460 0.99 0.99 0 0

© 2015 Company
3c. Energy saving projects implemented in FY 2017-18
11
No Title of Project
Annual
Electrical
Saving
(kWh)
Annual
Electrical
Cost Saving
(Rs million)
Total Annual
Savings (Rs
million)
Investment Made
(Rs million)
Payback
(Months)
5
Optimisation of counter and
Working pressure for smooth
operation of mill
332900 1.99 1.99 0 0
6Optimisation of compressed air
by arresting leakages110900 0.65 0.65 0 0
7Installation of LED lights in place
of HPSV lights204000 1.2 1.2 0.5 5
8
Installation of 3rd flyash
unloading line to improve flyash
unloading rate
296000 1.77 1.77 0.2 0
9
Improvement in Mill MTBF from
180 hrs to 250 hrs by inhouse
designed SMART app.
145200 0.87 0.87 0.2 3
10Reduction of average Rake
unloading time from 7 hrs to 5 hrs304920 1.8 1.8 0 0
Total 2337177 13.82 13.82 0.9 8

© 2015 Company
Innovative Projects Implemented
12
• Removal of stump cone and extension of grit cone chute and maintained 600mm
height from table.
• Build up of Support ring Height from 40mm to 65 mm and Width from 35 mm to
55mm.
• Modified Water Spray Nozzles with compressed air for uniform distribution of
water
• Optimisation of counter and working pressure for smooth operation of mill
• Installation of mesh at mill inlet ducts to avoid material accumulation and
pressure drop
• Increase in BA pressure from 40 to 45 bar and reduce PA pressure from 10 to 8
bar
• Installation of Flyash unloading line No.3 using existing compressor

© 2015 Company 13
1. Table Support Ring Build up from 40 X 35 mm to 65 X 55 mm
65mm
55 mm
Action taken:
▪ Build up of Support ring Height from 40mm to 65 mm and Width from 35 mm to 55mm.
▪ Distance between Roller tyre back face and support ring reduced from 30mm to 15mm when
rollers rest on buffer
Benefits realised:
• Consistent bed height above 65 mm as against previous level of 50mm, resulted in increase
grinding efficiency.
• Increase in throughput of mill from 280 TPH to 295 TPH in PPC.
• Savings ~ 0.25 kWh/t Cem
4. Implemented Innovations

© 2015 Company
14
4. Implemented Innovations
2. Removal of Stump cone from table
AfterBefore
Action taken:
▪ Removal of stump cone and extension of grit cone chute by 400 mm.
▪ Distance from Table to reject chute reduced from 700mm to 600mm for
uniform distribution of material
Benefits realised:
• Reduction in Main drive load Savings - ~ 0.15 kWh/t)
• Uniform distribution of material across grinding path. Better mill stability
Grit Cone Chute
Stump Cone

© 2015 Company
15
4. Implemented Innovations
3. Installation of nozzle @ 60 deg and Armour ring @ 25deg
Nozzle ring Angle :60 Deg
Nozzle ring Angle :80 Deg
Armour Ring : 25 Deg
Action taken:
▪ Reinstallation of Louver ring with the angle of 60 deg and
armour ring angle to 25 deg
▪ Maintaining louver ring area of 3.97 m2 by blocking 2 louvers
behind each roller (Total 12 Nos)
Benefits realised:
• Reduction of mill fan power consumption by ~270 KW
• Impact ~ 1.0 kWh/t Cem
Armour Ring : 10 Deg

© 2015 Company
16
4. Modification of Table Water Spray Nozzles
Before
Water Spray Nozzle with single pipe at height of 100mm from Dam ring
Modified Water Spray Nozzles with compressed air for uniform distribution of water▪ Height above Dam ring – 50 mm▪ Distance from Inner Dam ring – 100 mm▪ Distance from Roller – 50 mm▪ Angle towards Roller – 35 Deg
*Better distribution of water resulted in uniform bed there by reduction in vibrations to the level of 5 mm/s from previous 6 to 7mm/s.*Water requirement reduced from 4.5M3/hr to 3 M3/hr
After
4. Implemented Innovations

© 2015 Company
4. Implemented Innovations
17
5. Installation of mesh in inlet duct to reduce pressure drop by 4 mbar at mill inlet
Action taken:
▪ To Reduce pressure drop at inlet duct due to material accumulation, mesh of 2” size
installed at inlet ducts to avoid accumulation
Benefits realised:
• Reduction of material accumulation at inlet duct, resulting in reduction of mill inlet draft
from -50 mm WC to -20 mm WC
• Reduction of Bag house power consumption by 0.3 kWh/t Cem

© 2015 Company
4. Implemented Innovations
18
6. Installation of Fly-ash Unloading line No 3 in 500 MT Silo
• Improvement in unloading rate from 50 TPH to 80 TPH.
• Minimizing pumping and Unloading of Fly-ash from Big Silo, reduction in SEEC
• Minimizing stoppage of mill on account of Fly-ash silo level.
• Utilization of Mill operation person dedicatedly for Mill
Line No 3
Line No 1 Line No 2
Before After
• Improvement in unloading rate from 50 TPH to 80 TPH.
• Minimizing pumping and Unloading of Fly-ash from Big Silo, reduction in SEEC
• Minimizing stoppage of mill on account of Fly-ash silo level.
• Utilization of Mill operation person dedicatedly for Mill

© 2015 Company
4. Implemented Innovations
19
7. Optimisation of mill by operating counter pressure from 23 Bar to below 18 Bar
Action taken:
▪ Operating the mill counter pressure below 18 bar.
▪ Reduction of piston accumulator N2 pressure from 10 bar to
8 bar and increased bladder accumulator pressure from 40 bar
to 45 bar.
▪ Working pressure Min set point fixed at 65 bar.
▪ Counter Pressure Min set point fixed at 12 bar.
▪ Maintaining Net Grinding pressure at 50 bar
Benefits realised:
• Reduction in mill vibrations from 7 mm/s to 5 mm/s
• Reduction in mill reject load from 30 to 34 amps from 24 to
27 amps.
• Reduction in main drive power and Baghouse power

© 2015 Company 20
▪ Installation of compressor of 7.5 KW for Flyash unloading during Mill Stoppage, Eliminating running of 110 KW compressor
Provision of Lighting ON/OFF through DCS in timer mode
4. Implemented Innovations

© 2015 Company
4. Implemented Innovations - SMART App
21
➢ To strengthen the quality of
WBI (walk by inspection) and
develop full proof system to
eliminate the human errors.
➢ To improve the health of
equipment by immediate
reporting and action executed.
➢ To minimize time for actual
WBI and report generation.

© 2015 Company
4. Implemented Innovations – SMART App
QR CODE ON
EQUIPMENTINPUT BY WBI
INSPECTORDATABASE
SERVER
Equip scan
SMS ALERT E-Mail ALERT
WAN
WAN
TIMELY
EXECUTION

© 2015 Company 23
Entering the Observations with photographs, readings along with Risk level in the app
4. Implemented Innovations - SMART App

© 2015 Company 24
➢ Reports will be generated automatically at mentioned time slot and will be sent to concerned
team.
➢ If high priority alarms persists, notification will be triggered to concerned person as message/mail.
4. Implemented Innovations - SMART App

© 2015 Company
5. Green Power Sourcing – Renewable Energy
25
93%
71%
36% 35%
7%
24%
22% 20%
5%42% 45%
2016 2017 YTD July'18 2018
Solar Purchase BESCOM I Ex
▪ Solar power in used extensively for cement manufacturing at Thondebhavi
▪ To use about 15 MW of solar power to meet over half of annual power requirement -
~23 MU of solar power
▪ Switching to solar power will reduce CO2 emissions by 19,000 tonnes every
year – Eqv. to 22.5 trees every year or a saving of 45 million litres of water

© 2015 Company
6. TEAM and Review Mechanism
26
SourabhModi
Swaroop G
(Process)AK Tripathy
(E&I)
Saravanan
(Mech)
Vikram,Arvind
KarthikLakshmi
Velu, Chandru
Naveen, Paramesh, Rajasekhar
Deepak, Anil, Mumtaj, Ganga, Rajesh
Murthy Vikram, Guruchaan
Team Leader
Team Members
(MS)
Patrollers,
SFAs
Business
Partners
TEAM
▪ Formation of Cross functional team including contract workmen
▪ Continuous monitoring of Specific Electrical Energy Consumption (SEEC) through EMS
▪ Hourly reporting of SEEC through Whatsapp
▪ Weekly performance review with Director Plant and deriving and implementation of action plan
Weekly Performance review along with steering
committee chaired by Director Plant
Mr. H.S Rathore
Director Plant
ACC
Thondebhavi

© 2015 Company
6.TEAM and Review Mechanism
Discussion with operation team to optimise mill further
▪ Identification and
Rectification of leakages
through Walk by
inspections and shared
in Whatsapp.
▪ Immediate action by
shift engineer to rectify.
Rewarding the best performers in the
shift operation

© 2015 Company
6.TEAM and Review Mechanism
Innovation Lab
▪ Developed an Innovation Lab set up in Plant
▪ Brainstorming and Ideation sessions conducted on regularly
▪ Motivational and Positive Environment for Ideation session
▪ Implementation of Innovate Ideas and Reward Program in Place

© 2015 Company
7. ISO 50001:2011 Certified, GreenCo Rating
29
Greenco Silver Rating in Dec 2012
Participating for Recertification on 2018

© 2015 Company
8. Awards & Accolades
30
▪Innovative Project Award – National Energy Management Award – 2013
▪ Energy Efficient Unit – National Energy Management Award – 2013
▪Energy Efficient Unit – National Energy Management Award – 2016

© 2015 Company
8. Awards & Accolades
31
▪ CII ITC Sustainability Awards - 2014
▪ National Energy Conservation Award – BEE – 2012
▪ Golden Peacock National Quality Award – Winner - 2014

© 2015 Company
8. Awards & Accolades
32
Awards for Lowest Ever Specific Power
consumption across ACC
Award for Consistent
Performing Plant for the
period of 3 years in SEEC

© 2015 Company
Plantation
33
2000 Nos saplings ( 400 Nos Fruits Saplings) Plantation inside plant and
near by communities
Plantation at Community
SchoolPlantation at Railway StationPlantation in Plant

© 2015 Company
Greenbelt Development
BEFORE AFTER
BIRD’S EYE VIEW

© 2015 Company
Greenbelt Development

© 2015 Company
Greenbelt Development
36
Herbal Garden
Fruits Trees inside Plant

© 2015 Company
Bio Diversity
We facilitated Bio diversity at our Plant premises to encourage Birds by
providing Welcome Rest Shelter, Bird feeders and Drinking Water

© 2015 CompanyTechport-Cement Industrial India 38


![dpv-uk.com · PDF fileEndure of Thermal shock. ... Ash Silo wz Pneumatic Ash Handling System Layout Chimney Pressue Pump Ash Silo czX-Ð] cz ESP Ash Silo ESP Ash](https://img.pdfslide.net/doc/110x75/5abd4e267f8b9a7e418b6dff/dpv-ukcom-of-thermal-shock-ash-silo-wz-pneumatic-ash-handling-system-layout.jpg)