Embed Size (px)
Citation preview
National Center on Response to Intervention
National Center on Responseto Intervention
RTI Implementer SeriesModule 2: Progress Monitoring
National Center on Response to Intervention 2
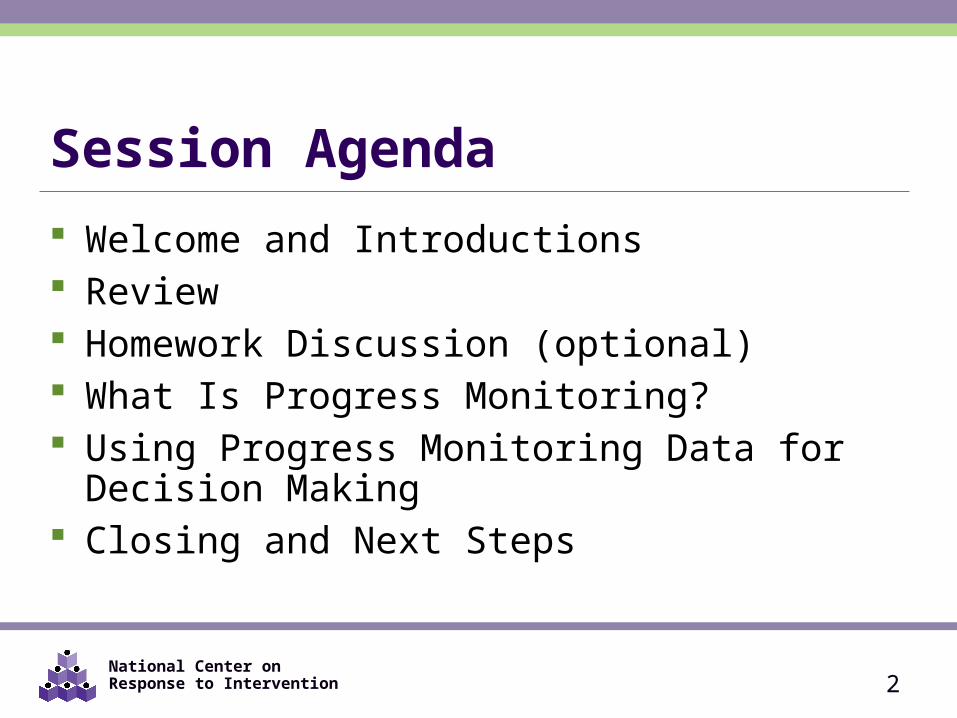
Session Agenda Welcome and Introductions Review Homework Discussion (optional) What Is Progress Monitoring? Using Progress Monitoring Data for Decision Making Closing and Next Steps
National Center on Response to Intervention
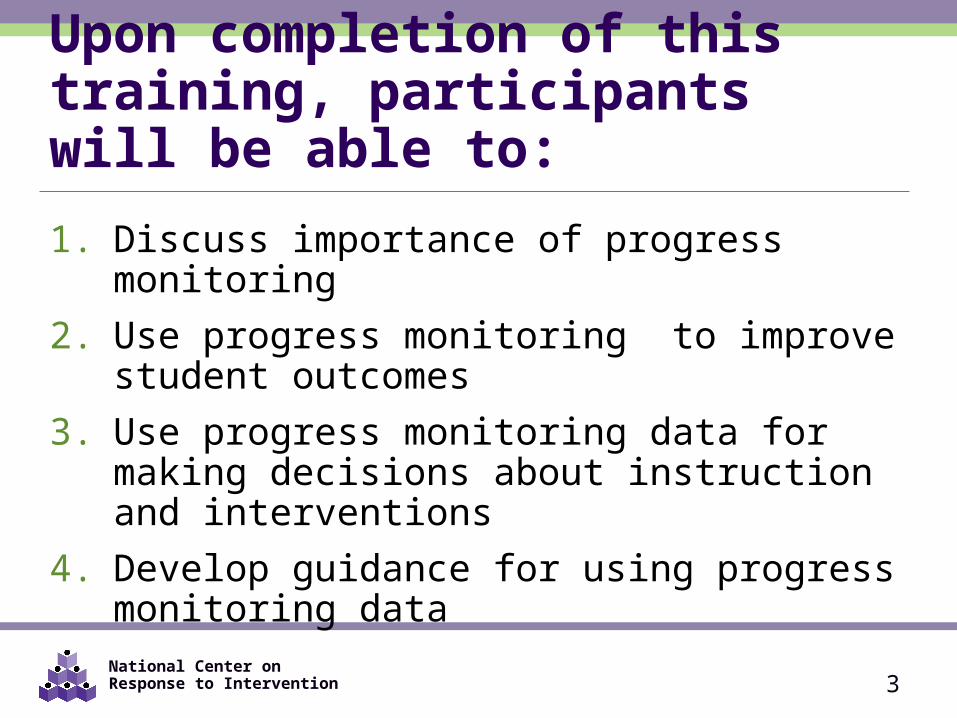
Upon completion of this training, participants will be able to:
1. Discuss importance of progress monitoring 2. Use progress monitoring to improve student
outcomes 3. Use progress monitoring data for making decisions
about instruction and interventions4. Develop guidance for using progress monitoring data
3
National Center on Response to Intervention
REVIEW: WHAT IS RTI?
4
National Center on Response to Intervention 5
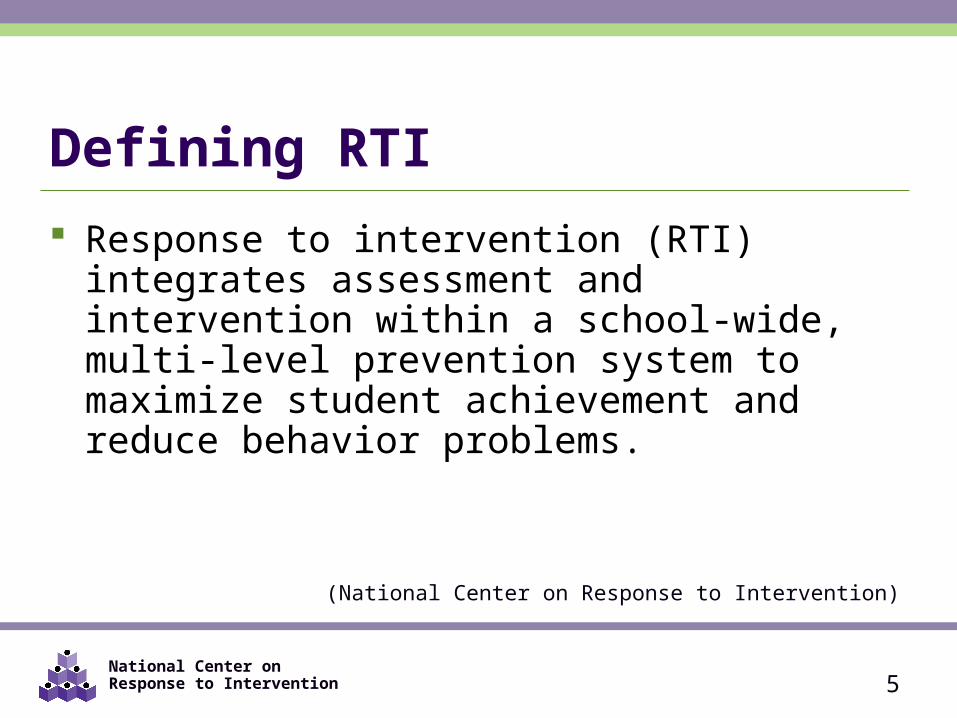
Response to intervention (RTI) integrates assessment and intervention within a school-wide, multi level ‑prevention system to maximize student achievement and reduce behavior problems.
Defining RTI
(National Center on Response to Intervention)
National Center on Response to Intervention 6
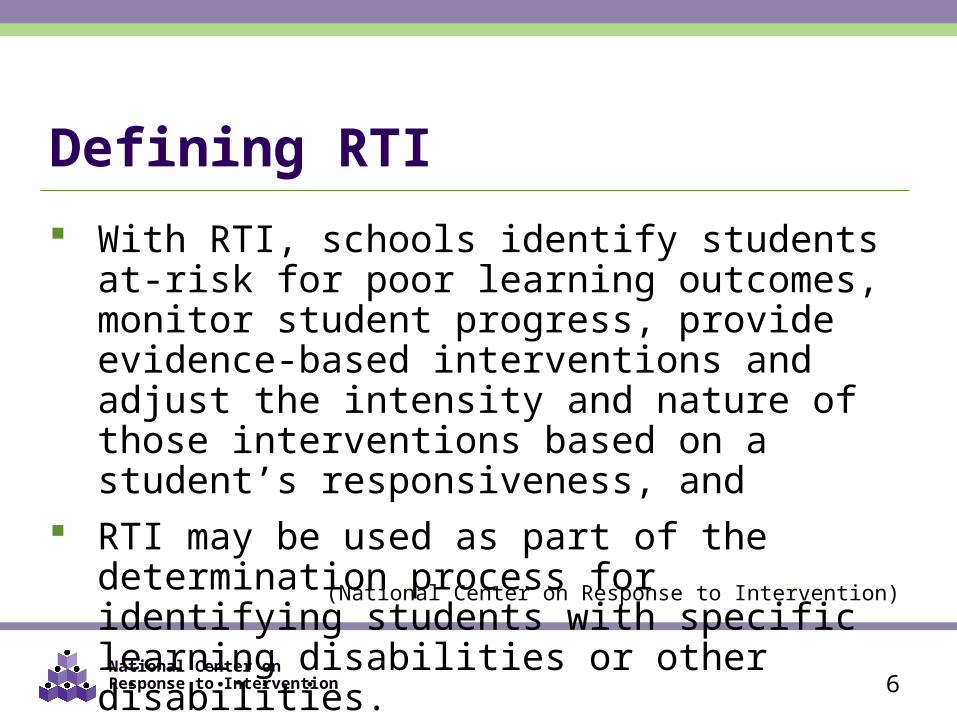
With RTI, schools identify students at-risk for poor learning outcomes, monitor student progress, provide evidence-based interventions and adjust the intensity and nature of those interventions based on a student’s responsiveness, and
RTI may be used as part of the determination process for identifying students with specific learning disabilities or other disabilities.
Defining RTI
(National Center on Response to Intervention)
National Center on Response to Intervention 7
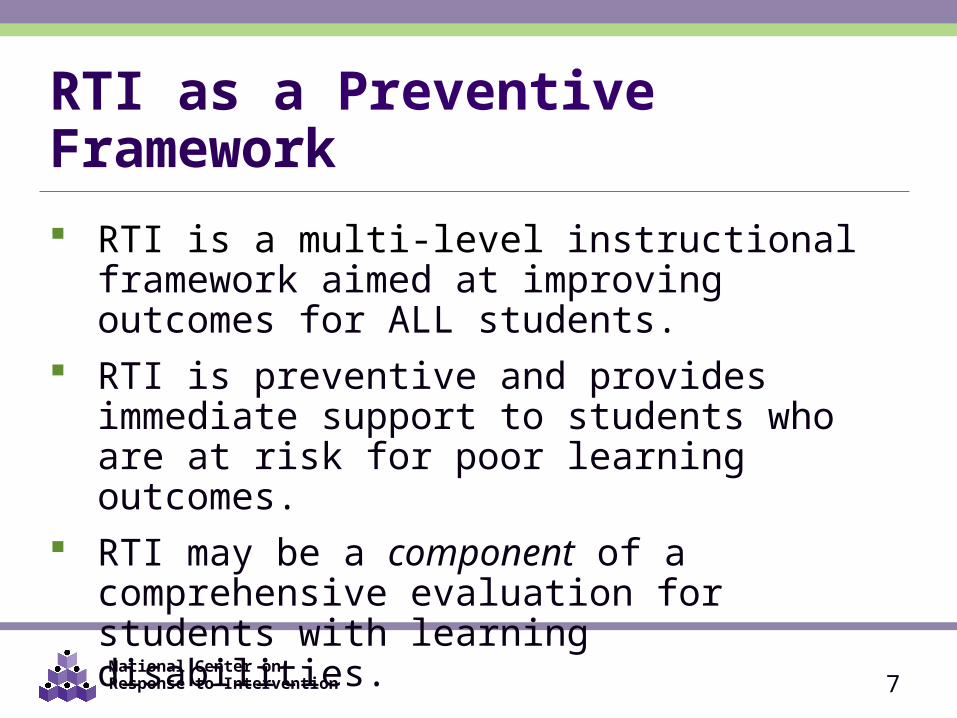
RTI as a Preventive Framework RTI is a multi-level instructional framework aimed at
improving outcomes for ALL students. RTI is preventive and provides immediate support to
students who are at risk for poor learning outcomes. RTI may be a component of a comprehensive
evaluation for students with learning disabilities.
National Center on Response to Intervention 8
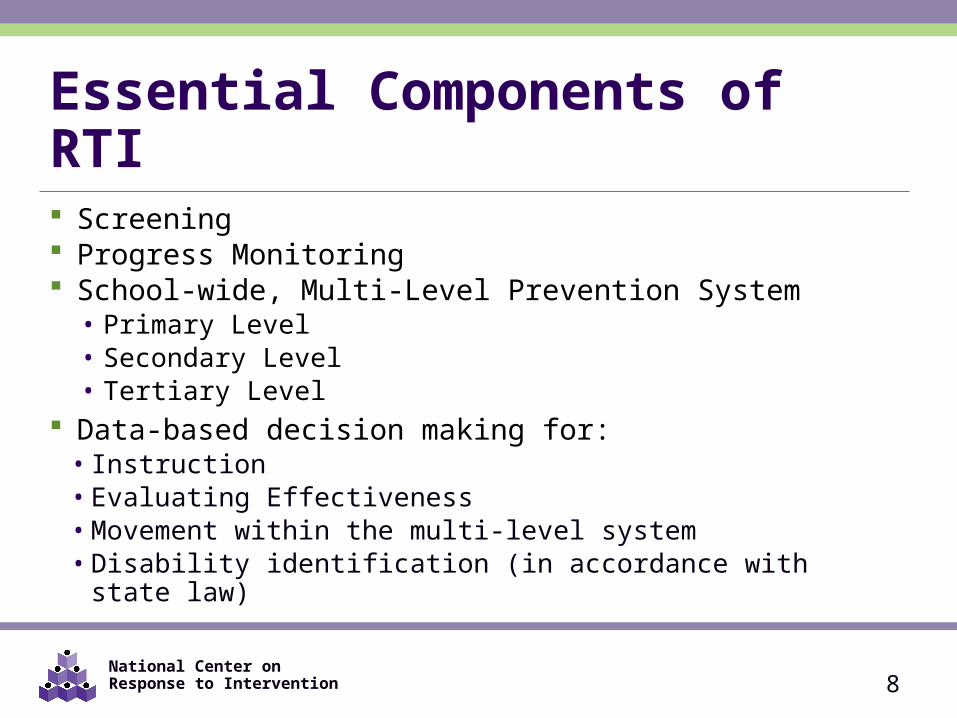
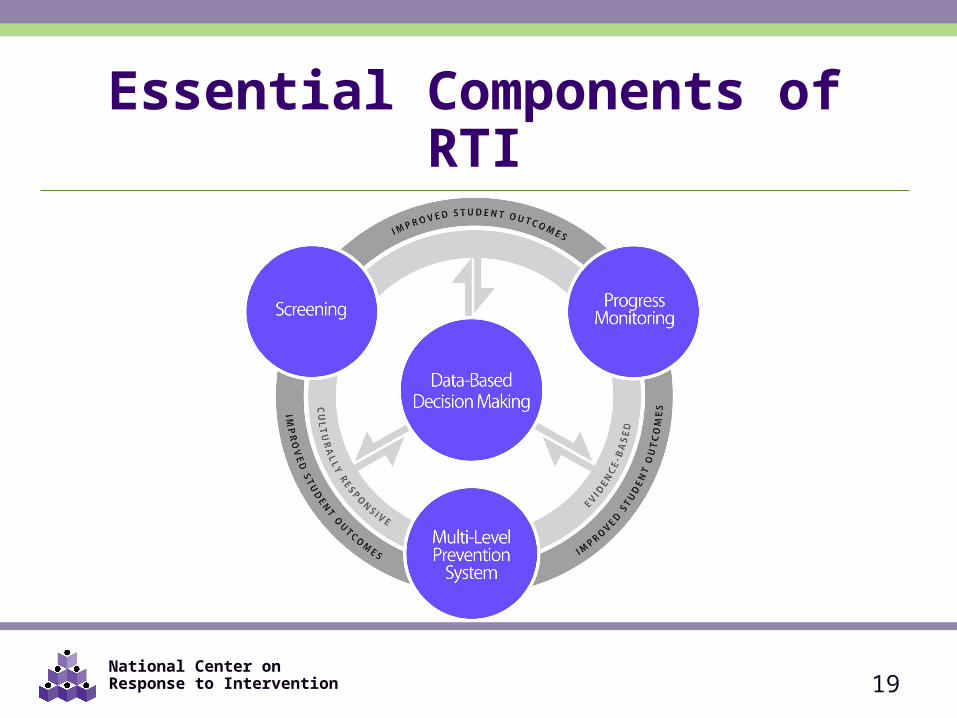
Essential Components of RTI Screening Progress Monitoring School-wide, Multi-Level Prevention System
• Primary Level• Secondary Level• Tertiary Level
Data-based decision making for:• Instruction • Evaluating Effectiveness• Movement within the multi-level system• Disability identification (in accordance with state law)

National Center on Response to Intervention
Essential Components of RTI
9
National Center on Response to Intervention
SCREENING
Essential Component
10
National Center on Response to Intervention 11
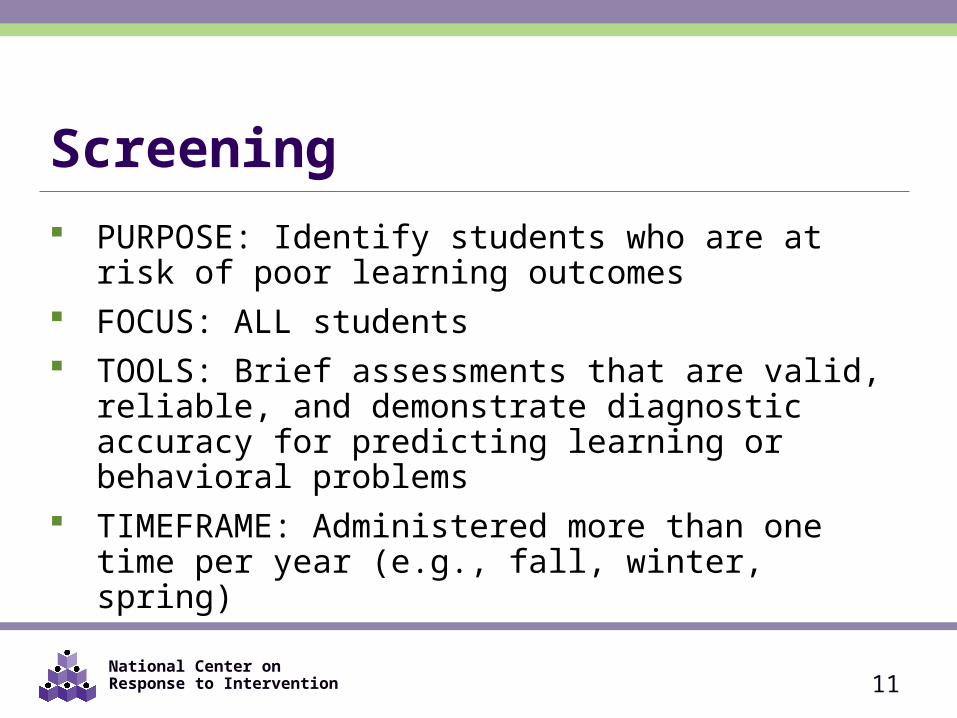
Screening PURPOSE: Identify students who are at risk of poor
learning outcomes FOCUS: ALL students TOOLS: Brief assessments that are valid, reliable, and
demonstrate diagnostic accuracy for predicting learning or behavioral problems
TIMEFRAME: Administered more than one time per year (e.g., fall, winter, spring)

National Center on Response to Intervention
Essential Components of RTI
12
National Center on Response to Intervention
PROGRESS MONITORING
Essential Component
13
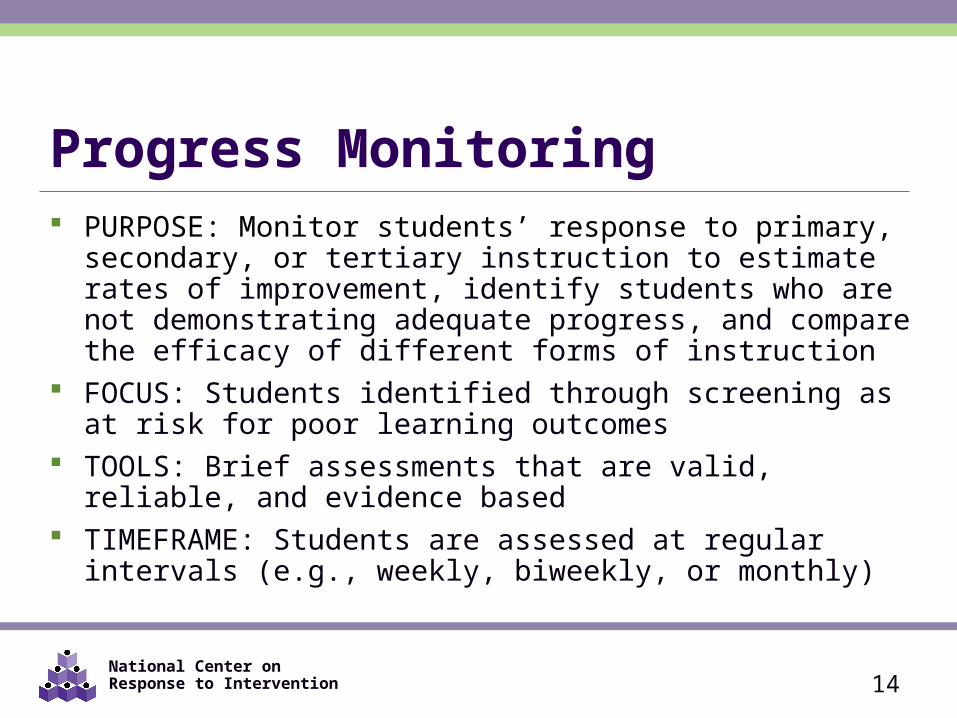
National Center on Response to Intervention 14
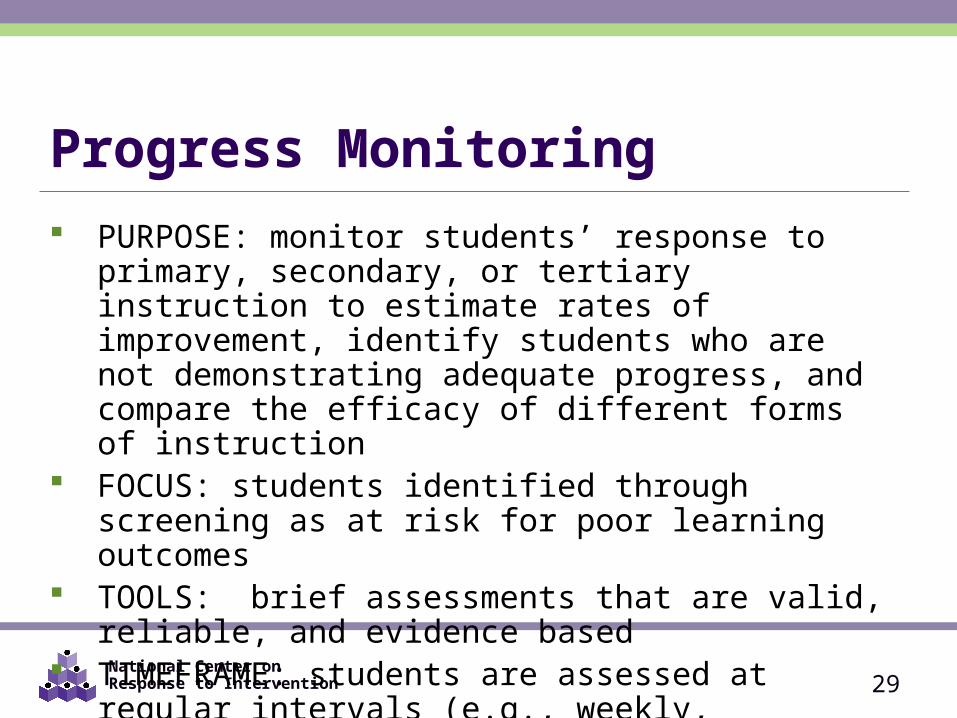
Progress Monitoring PURPOSE: Monitor students’ response to primary, secondary,
or tertiary instruction to estimate rates of improvement, identify students who are not demonstrating adequate progress, and compare the efficacy of different forms of instruction
FOCUS: Students identified through screening as at risk for poor learning outcomes
TOOLS: Brief assessments that are valid, reliable, and evidence based
TIMEFRAME: Students are assessed at regular intervals (e.g., weekly, biweekly, or monthly)

National Center on Response to Intervention
Essential Components of RTI
15
National Center on Response to Intervention
SCHOOL-WIDE, MULTI-LEVEL PREVENTION SYSTEM
Essential Component
16
National Center on Response to Intervention 17
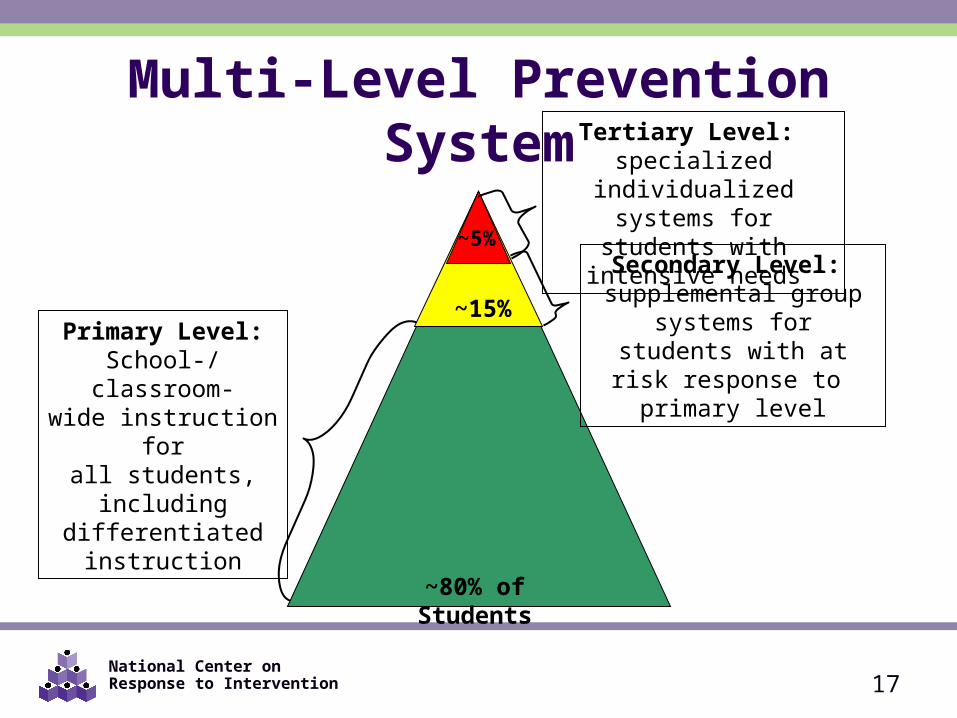
Multi-Level Prevention System
~15%
~5%
Tertiary Level: specialized individualizedsystems for students with
intensive needs
Secondary Level: supplemental group
systems for students with at risk response to
primary level
Primary Level:School-/classroom-wide instruction for
all students, including differentiated
instruction
~80% of Students
National Center on Response to Intervention 18
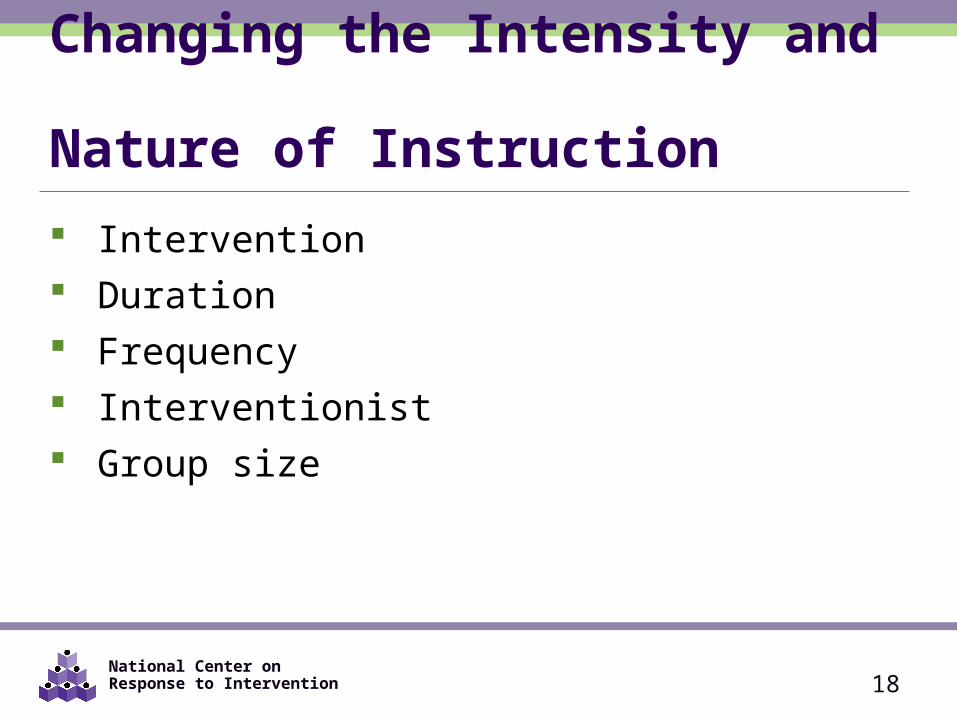
Changing the Intensity and Nature of Instruction Intervention Duration Frequency Interventionist Group size
National Center on Response to Intervention
Essential Components of RTI
19
National Center on Response to Intervention
DATA-BASED DECISION MAKING
Essential Component
20
National Center on Response to Intervention 21
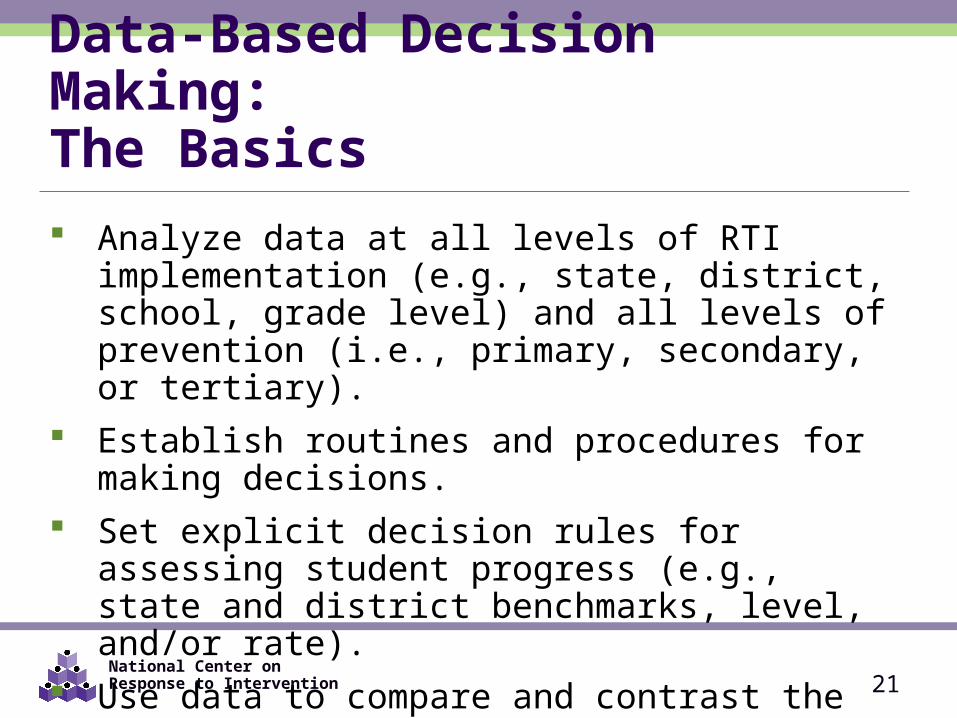
Data-Based Decision Making: The Basics Analyze data at all levels of RTI implementation (e.g.,
state, district, school, grade level) and all levels of prevention (i.e., primary, secondary, or tertiary).
Establish routines and procedures for making decisions. Set explicit decision rules for assessing student progress
(e.g., state and district benchmarks, level, and/or rate). Use data to compare and contrast the adequacy of the
core curriculum and the effectiveness of different instructional and behavioral strategies.
National Center on Response to Intervention 22
Data-Based Decision Making: Types of Decisions Instruction Evaluate Effectiveness Movement within the multi-level prevention system Disability identification (in accordance with state
law)

National Center on Response to Intervention
Essential Components of RTI
23
National Center on Response to Intervention
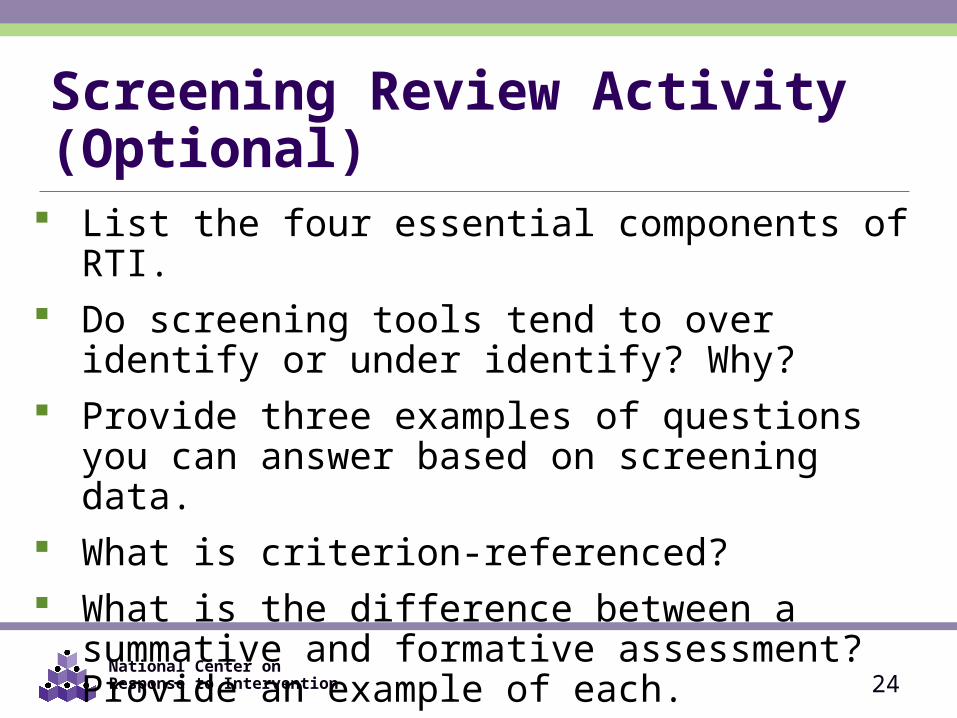
Screening Review Activity (Optional) List the four essential components of RTI. Do screening tools tend to over identify or under
identify? Why? Provide three examples of questions you can answer
based on screening data. What is criterion-referenced? What is the difference between a summative and
formative assessment? Provide an example of each.
24
National Center on Response to Intervention
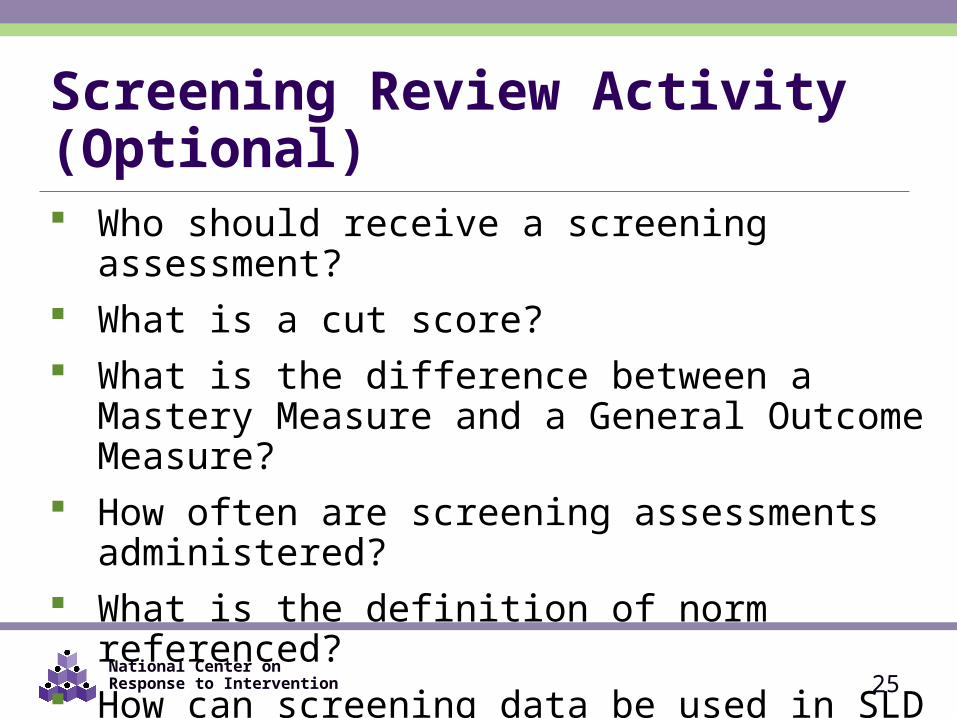
Screening Review Activity (Optional) Who should receive a screening assessment? What is a cut score? What is the difference between a Mastery Measure
and a General Outcome Measure? How often are screening assessments administered? What is the definition of norm referenced? How can screening data be used in SLD identification? What is classification accuracy?
25
National Center on Response to Intervention
WHAT IS PROGRESS MONITORING?
26

National Center on Response to Intervention
Essential Components of RTI
27
National Center on Response to Intervention
Progress monitoring research has been conducted over the past 30 years
Research has demonstrated that when teachers use progress monitoring for instructional decision making:• Students learn more• Teacher decision making improves• Students are more aware of their performance
Why Progress Monitoring?
28
National Center on Response to Intervention 29
Progress Monitoring PURPOSE: monitor students’ response to primary, secondary,
or tertiary instruction to estimate rates of improvement, identify students who are not demonstrating adequate progress, and compare the efficacy of different forms of instruction
FOCUS: students identified through screening as at risk for poor learning outcomes
TOOLS: brief assessments that are valid, reliable, and evidence based
TIMEFRAME: students are assessed at regular intervals (e.g., weekly, biweekly, or monthly)
National Center on Response to Intervention
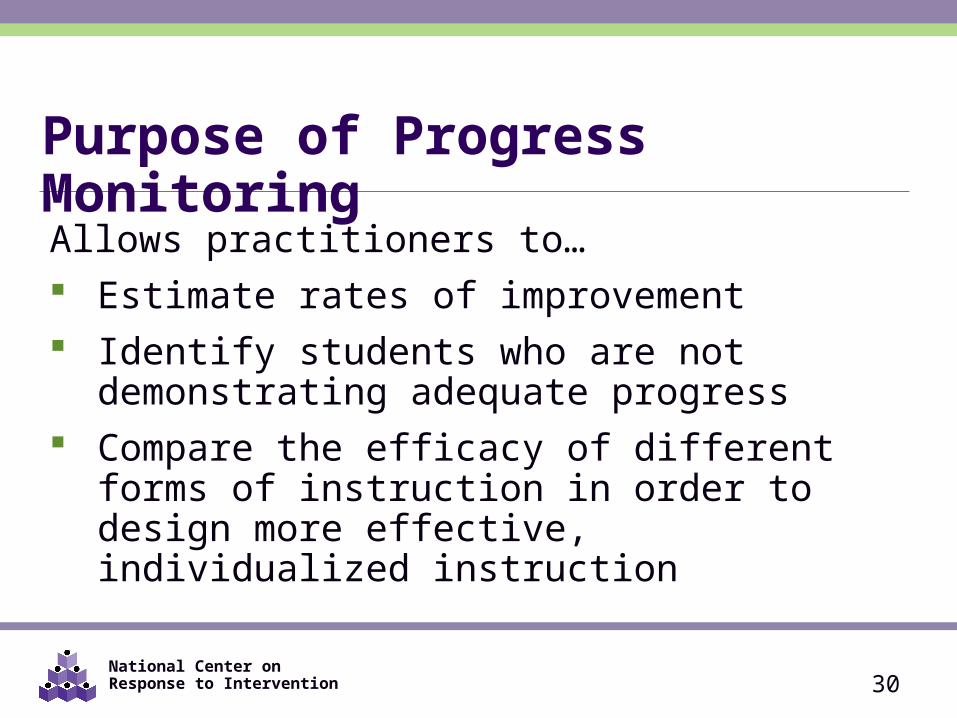
Purpose of Progress Monitoring
Allows practitioners to… Estimate rates of improvement Identify students who are not demonstrating
adequate progress Compare the efficacy of different forms of
instruction in order to design more effective, individualized instruction
30
National Center on Response to Intervention
0
10
20
30
40
50
60
70
80
90
100
1 2 3 4 5 6 7 8 9 10 11 12 13 14
Weeks of Primary Prevention
Wor
ds R
ead
Corre
ctly
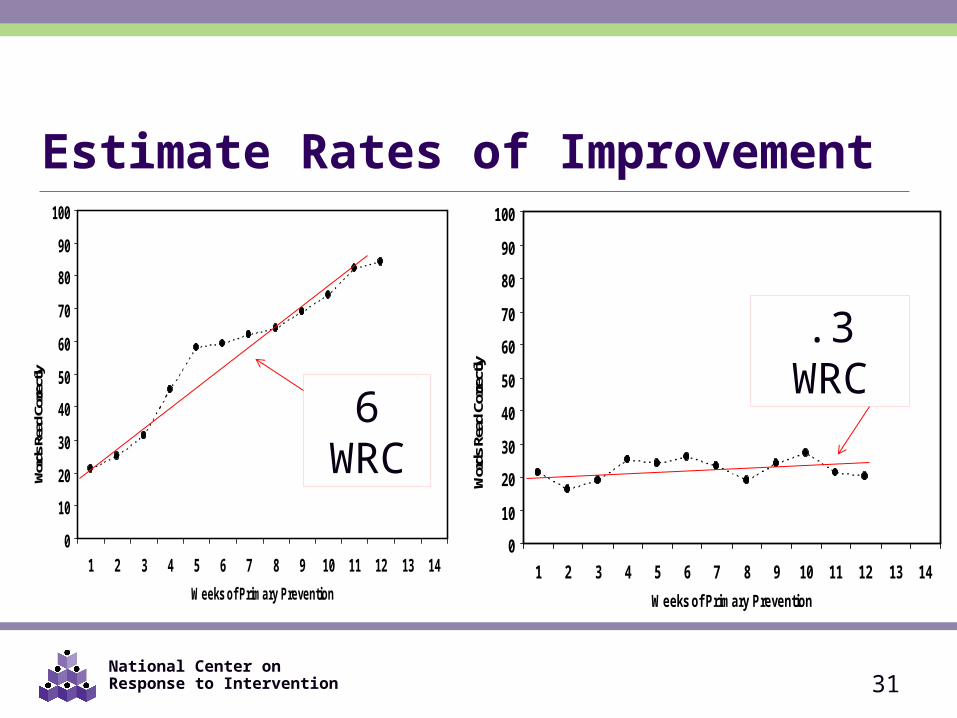
Estimate Rates of Improvement
31
0
10
20
30
40
50
60
70
80
90
100
1 2 3 4 5 6 7 8 9 10 11 12 13 14
Weeks of Primary Prevention
Wor
ds R
ead
Corre
ctly
6 WRC
.3 WRC
National Center on Response to Intervention
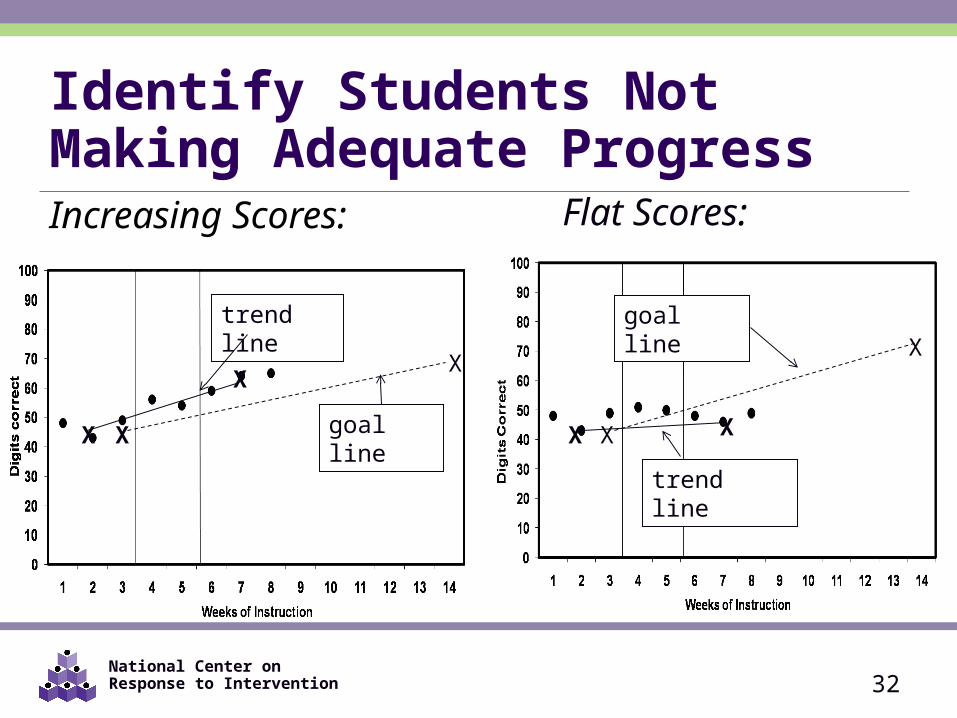
Identify Students Not Making Adequate ProgressIncreasing Scores:
32
X
goal line
trend lineX
goal line
trend line
Flat Scores:
X
X
X XX X
National Center on Response to Intervention
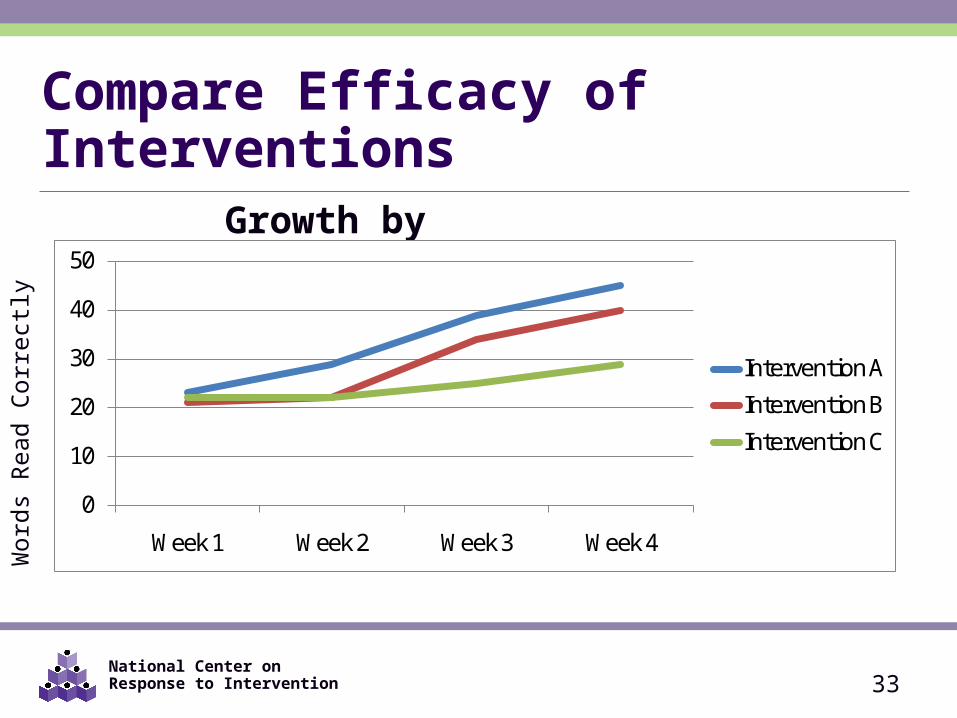
Compare Efficacy of Interventions
0
10
20
30
40
50
Week 1 Week 2 Week 3 Week 4
Intervention A
Intervention B
Intervention C
33
Growth by Intervention Type
Wor
ds R
ead
Cor
rect
ly
National Center on Response to Intervention
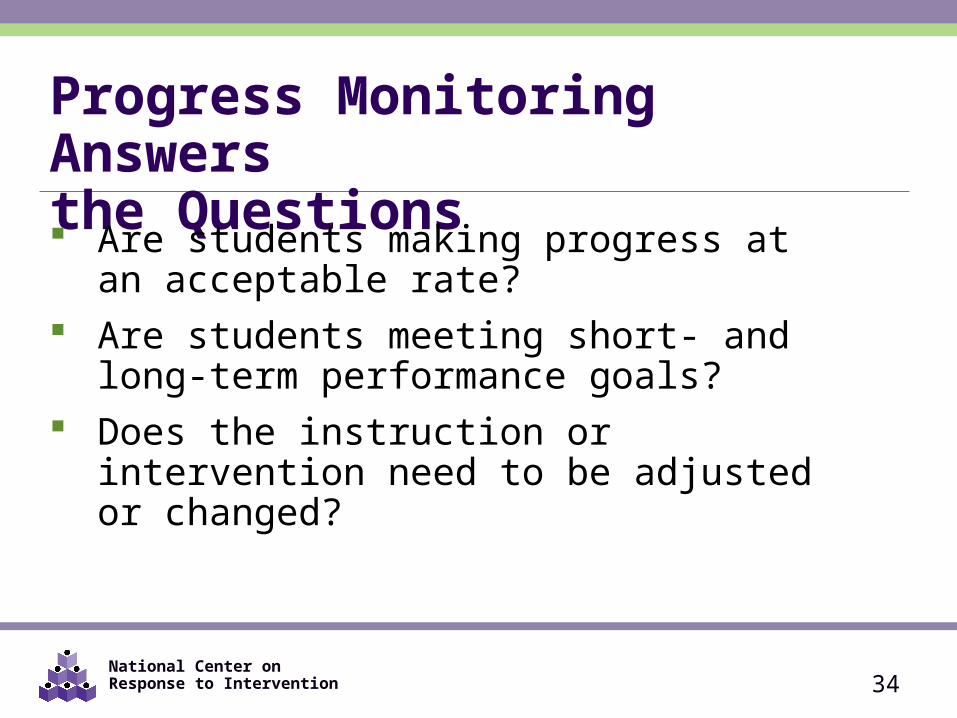
Progress Monitoring Answers the Questions Are students making progress at an acceptable
rate? Are students meeting short- and long-term
performance goals? Does the instruction or intervention need to be
adjusted or changed?
34
National Center on Response to Intervention 35
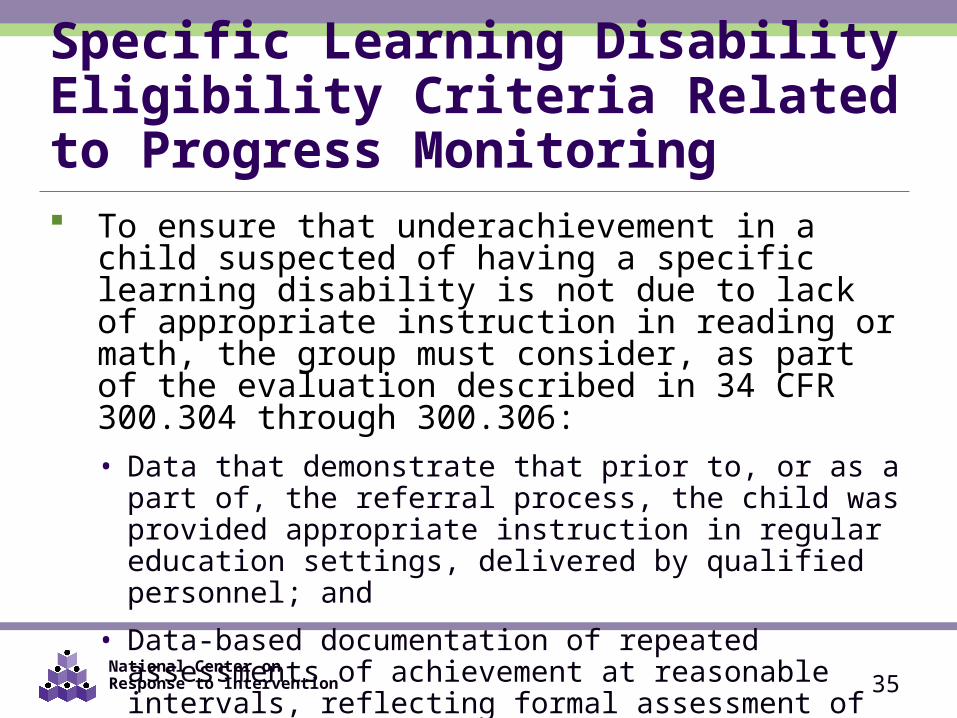
Specific Learning Disability Eligibility Criteria Related to Progress Monitoring To ensure that underachievement in a child suspected of
having a specific learning disability is not due to lack of appropriate instruction in reading or math, the group must consider, as part of the evaluation described in 34 CFR 300.304 through 300.306:• Data that demonstrate that prior to, or as a part of, the referral
process, the child was provided appropriate instruction in regular education settings, delivered by qualified personnel; and
• Data-based documentation of repeated assessments of achievement at reasonable intervals, reflecting formal assessment of student progress during instruction, which was provided to the child’s parents.
National Center on Response to Intervention
THINK-PAIR-SHARE How is progress monitoring being used in your
district?
36
National Center on Response to Intervention
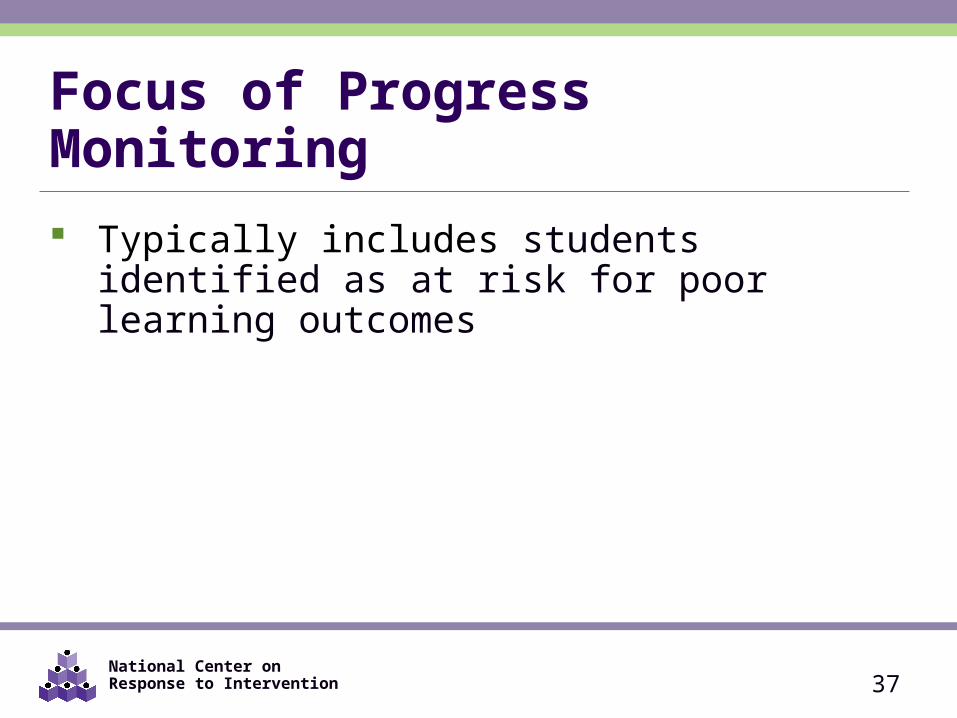
Focus of Progress Monitoring Typically includes students identified as at risk for
poor learning outcomes
37
National Center on Response to Intervention
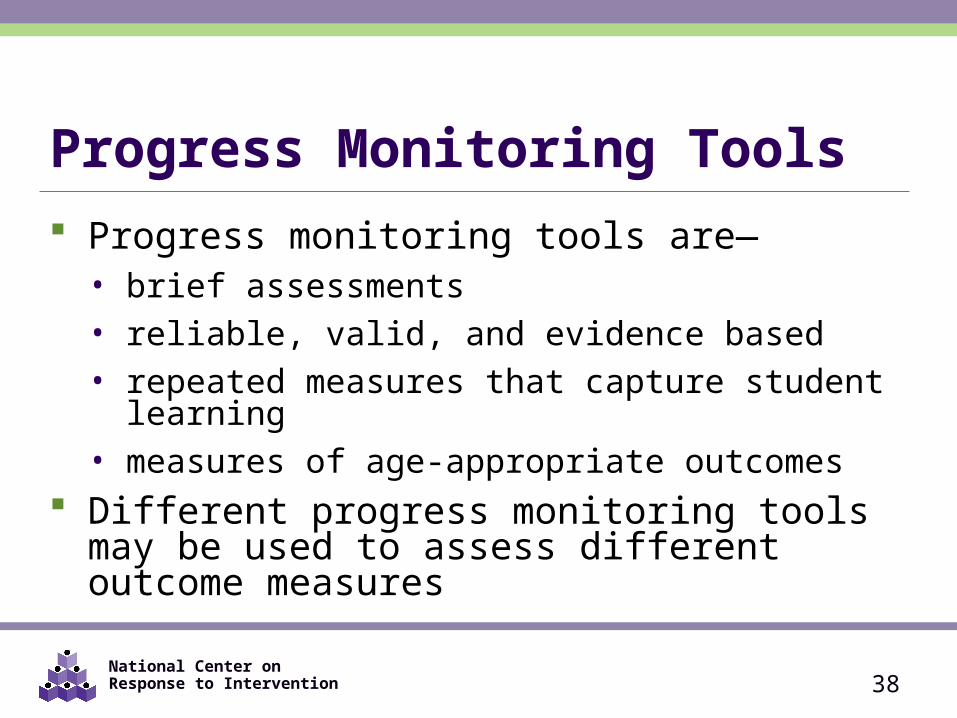
Progress Monitoring Tools Progress monitoring tools are—
• brief assessments • reliable, valid, and evidence based• repeated measures that capture student learning• measures of age-appropriate outcomes
Different progress monitoring tools may be used to assess different outcome measures
38
National Center on Response to Intervention
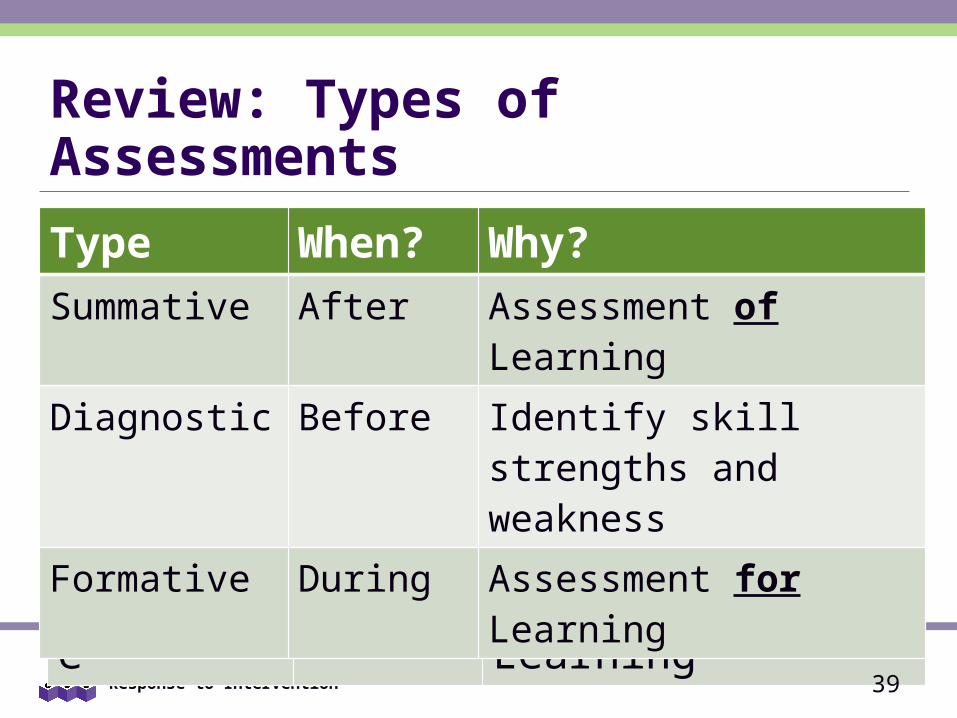
Review: Types of Assessments
Type When? Why?Summative After Assessment of LearningDiagnostic Before Identify skill deficitsFormative During Assessment for Learning
39
Type When? Why?Summative After Assessment of Learning
Diagnostic Before Identify skill strengths and weakness
Formative During Assessment for Learning
National Center on Response to Intervention
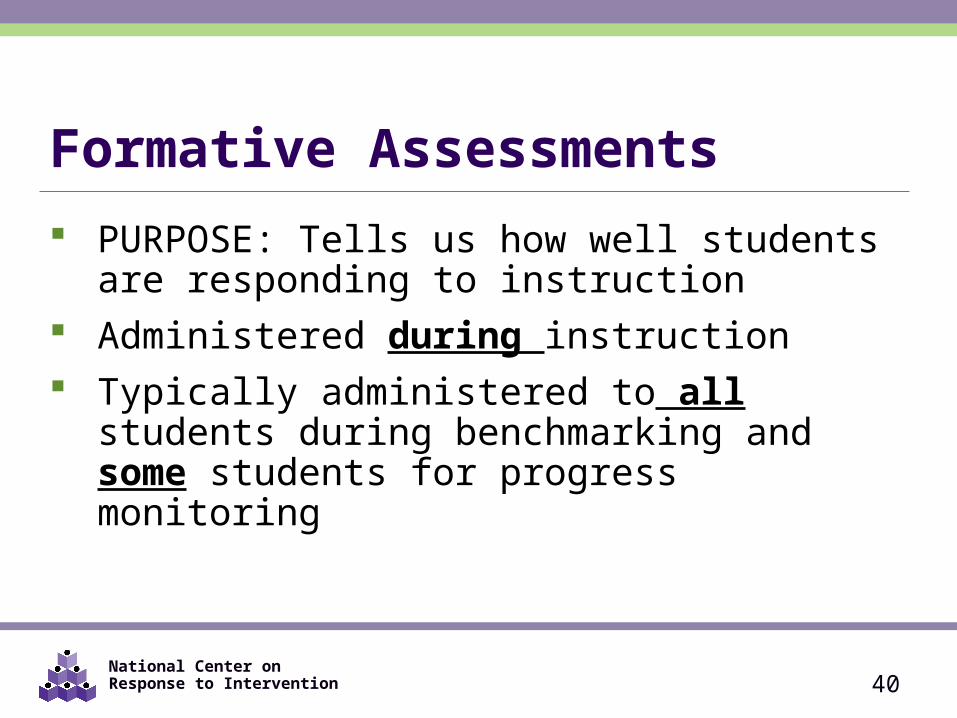
Formative Assessments PURPOSE: Tells us how well students are responding
to instruction Administered during instruction Typically administered to all students during
benchmarking and some students for progress monitoring
40
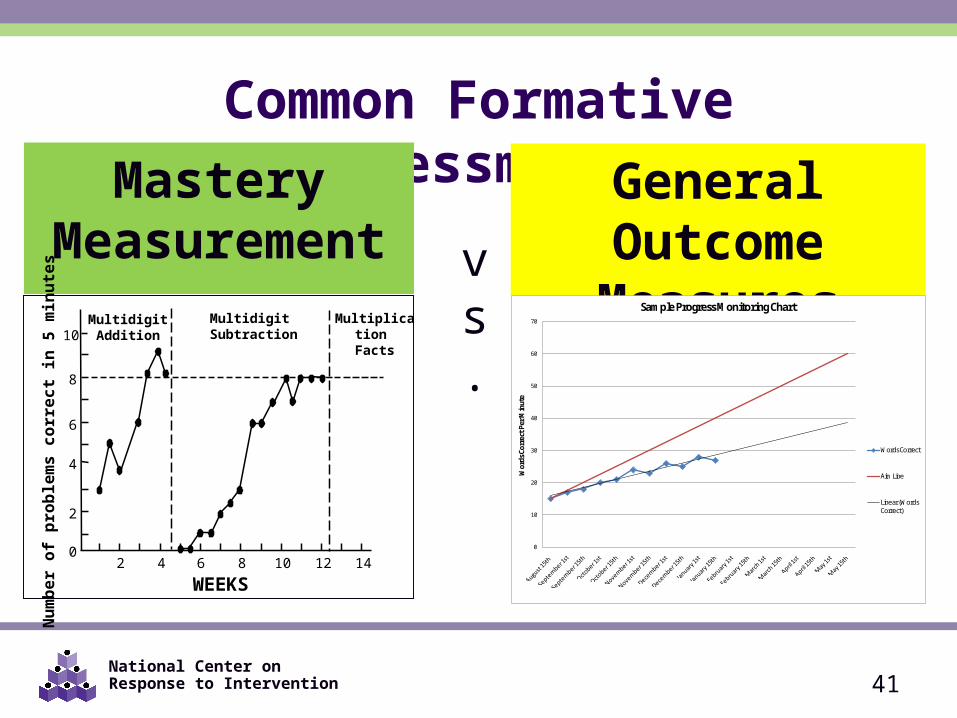
National Center on Response to Intervention 41
Common Formative AssessmentsMastery
MeasurementGeneral
Outcome Measures
vs.10
8
6
4
2
0
WEEKS
Multidigit Addition
Multidigit Subtraction
2 4 6 8 10 12 14
Multiplication Facts
Num
ber o
f pro
blem
s co
rrec
t in
5 m
inut
es
0
10
20
30
40
50
60
70
Wor
ds C
orre
ct P
er M
inut
e
Sample Progress Monitoring Chart
Words Correct
Aim Line
Linear (Words Correct)
National Center on Response to Intervention
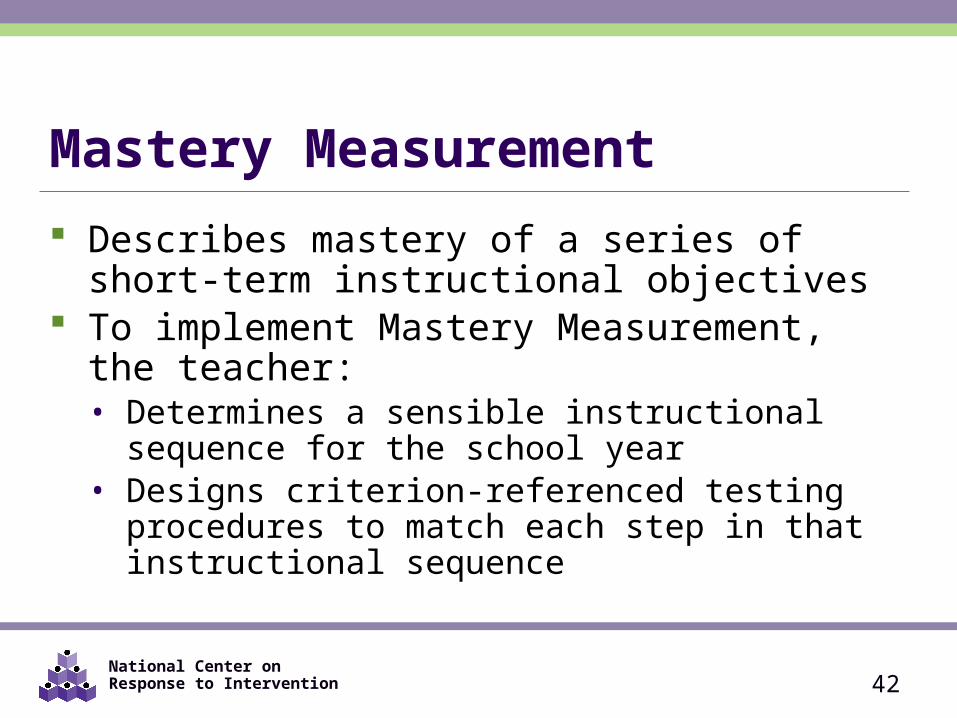
Mastery Measurement Describes mastery of a series of short-term
instructional objectives To implement Mastery Measurement, the teacher:
• Determines a sensible instructional sequence for the school year
• Designs criterion-referenced testing procedures to match each step in that instructional sequence
42
National Center on Response to Intervention
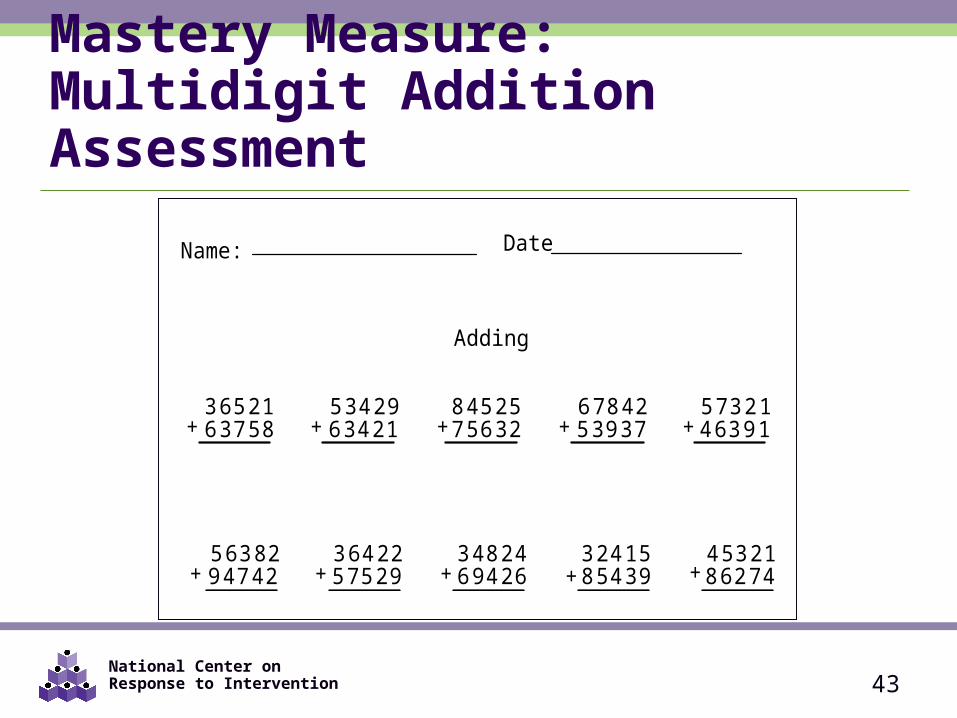
Name: Date
3 65 216 37 58+
5 34 296 34 21+
8 45 257 56 32+
6 78 425 39 37+
5 63 829 47 42+
5 73 2 14 63 9 1+
3 64 225 75 29+
3 48 246 94 26+
3 24 158 54 39+
4 53 21+ 8 62 74
Adding
Mastery Measure: Multidigit Addition Assessment
43
National Center on Response to Intervention
General Outcome Measures (GOM) A GOM is a measure that reflects overall competence
in the annual curriculum. Describes individual student’s growth and
development over time (both “current status” and “rate of development”).
Provides a decision making model for designing and evaluating interventions.
Is used for individuals and groups of students.
44
National Center on Response to Intervention
GOM Example: CBM Curriculum-Based Measure (CBM)
• A General Outcome Measure (GOM) of a student’s performance in either basic academic skills or content knowledge
• CBM tools available in basic skills and core subject areas grades K-8 (e.g., DIBELS, AIMSweb)
45
National Center on Response to Intervention
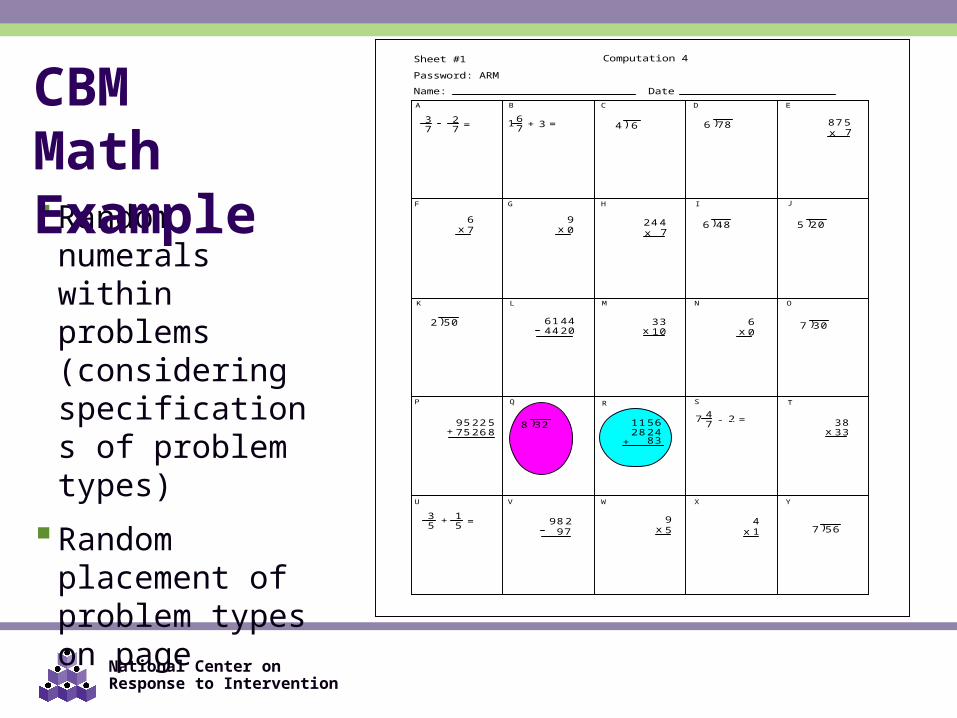
Random numerals within problems (considering specifications of problem types)
Random placement of problem types on page
41x
98 297
95 22 575 26 8+
24 47x
B C D E
G H I J
L M N O
Q R S T
V W X Y
A
F
K
P
U
64 )37
27 =
61 4444 20
Sheet #1
Password: ARM
Computation 4
Name: Date
67 =31 +
47 =27 -
35
15 =+
786 ) 87 57x
67x
90x 486 ) 205 )
502 ) 3310x
60x
307 )
328 ) 11 5628 24
+ 83
3833x
95x 567 )
CBM Math Example
National Center on Response to Intervention 47
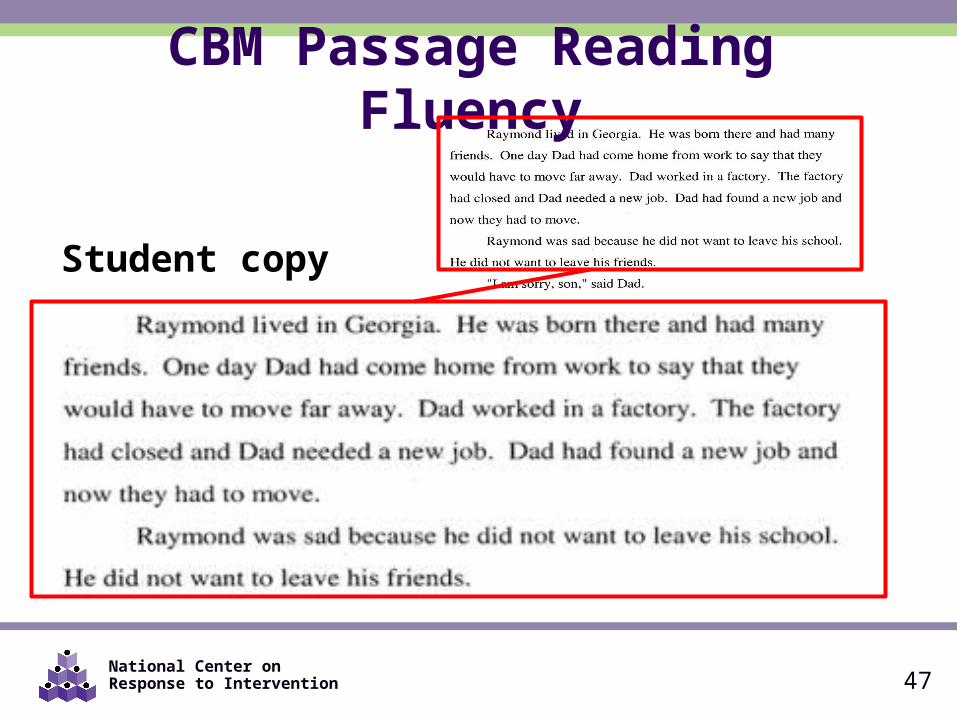
Student copy
CBM Passage Reading Fluency
National Center on Response to Intervention
THINK-PAIR-SHARE What mastery measures and general outcome
measures are being used in your district?
48
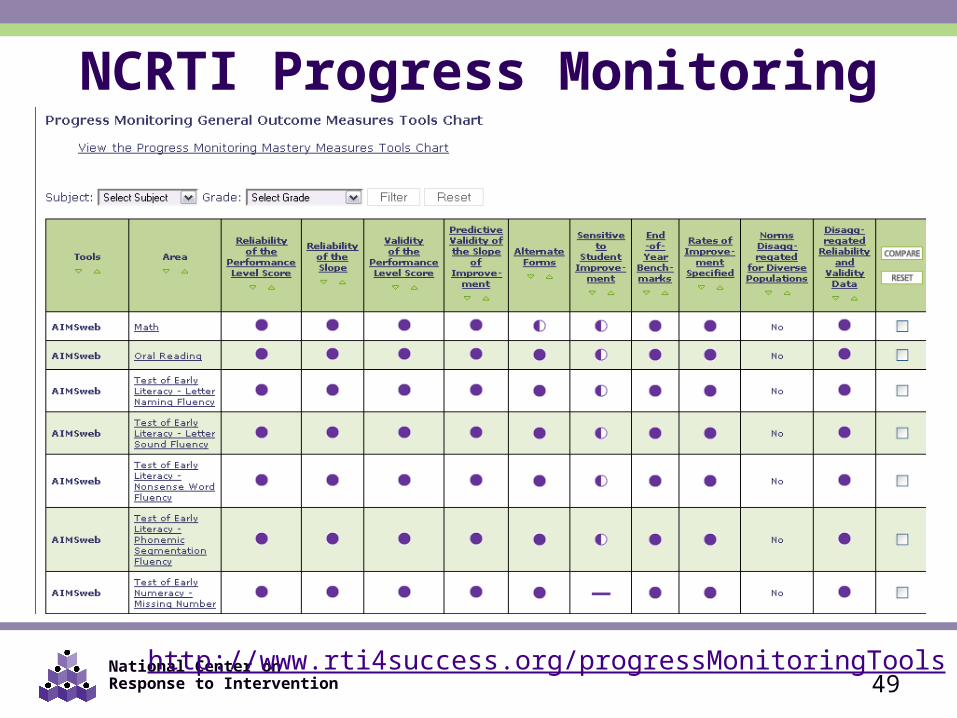
National Center on Response to Intervention 49
NCRTI Progress Monitoring Tools Chart
http://www.rti4success.org/progressMonitoringTools
National Center on Response to Intervention
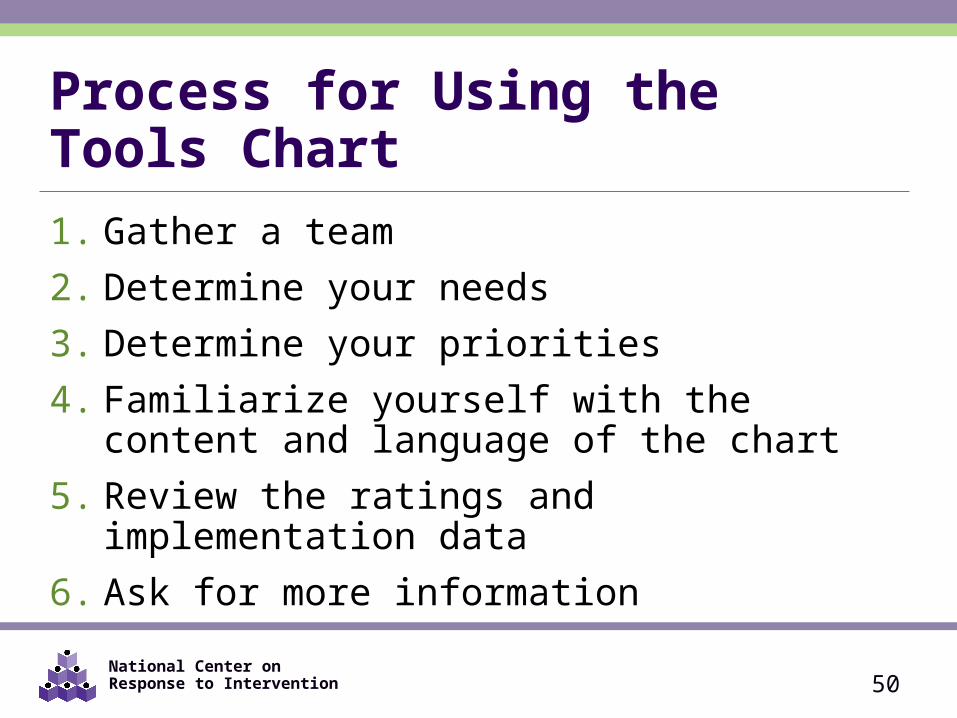
Process for Using the Tools Chart1. Gather a team2. Determine your needs3. Determine your priorities4. Familiarize yourself with the content and language
of the chart5. Review the ratings and implementation data6. Ask for more information
50
National Center on Response to Intervention
1. Gather a Team Who should be involved in selecting a progress
monitoring tool? What types of expertise and what perspectives
should be involved in selecting a tool?
51
National Center on Response to Intervention
2. Determine Your Needs For what skills or set of skills do you need a progress monitoring
tool? What population will you progress monitor (grades, subgroups)? When and how frequently will progress monitoring occur? Who will conduct the progress monitoring and what is their
knowledge and skill level? What kind of training do staff need and who will provide it? What materials will you need (computer, paper and pencil)? How much funding will you need?
52
National Center on Response to Intervention
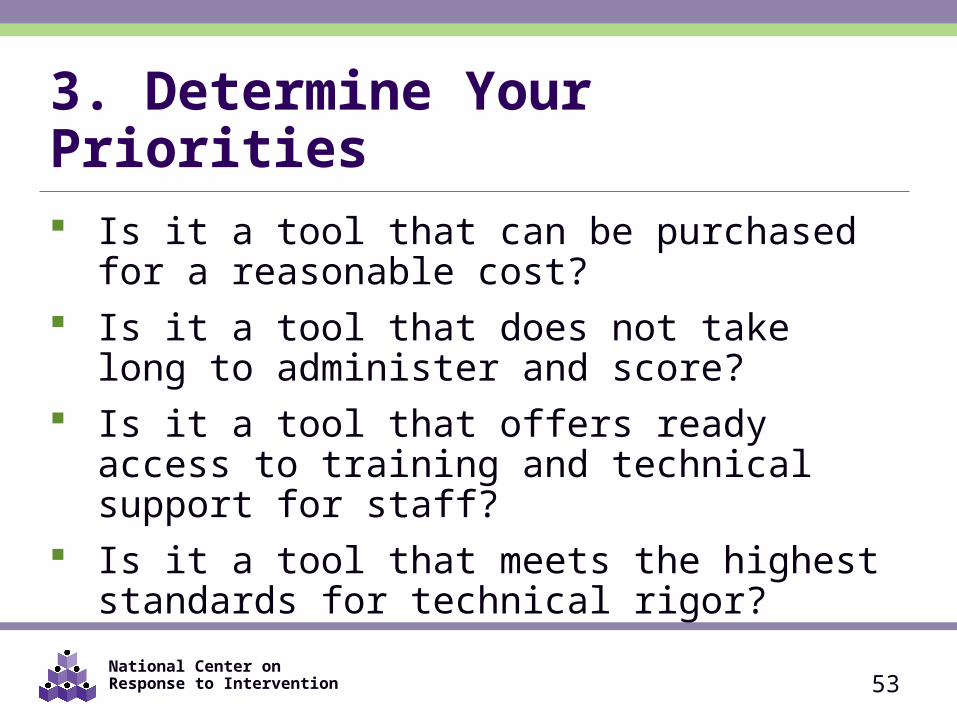
3. Determine Your Priorities Is it a tool that can be purchased for a reasonable
cost? Is it a tool that does not take long to administer and
score? Is it a tool that offers ready access to training and
technical support for staff? Is it a tool that meets the highest standards for
technical rigor?
53
National Center on Response to Intervention
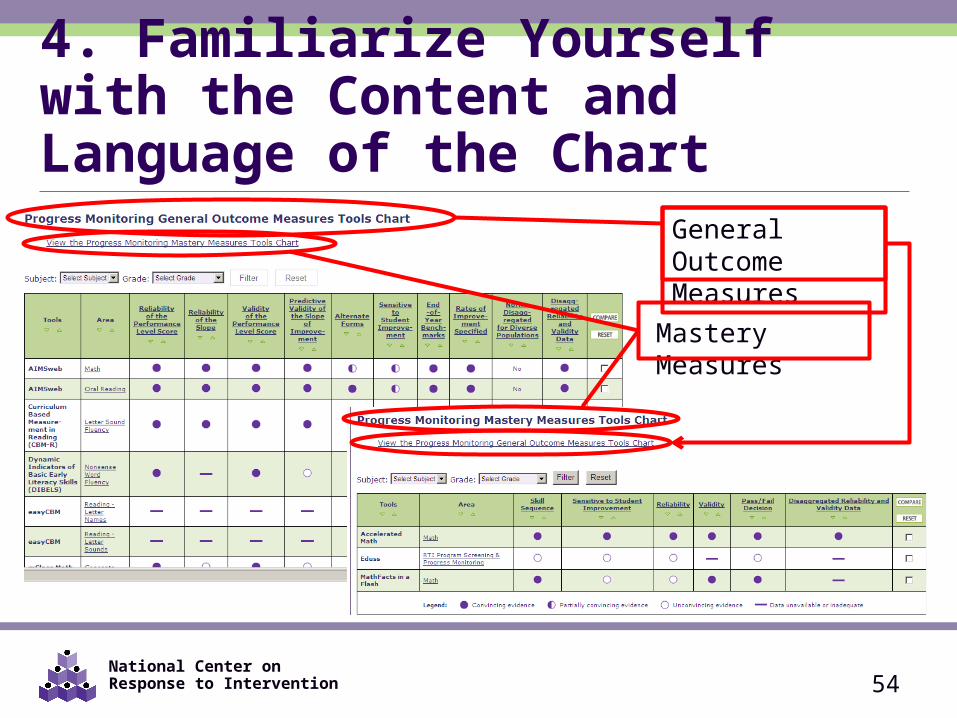
4. Familiarize Yourself with the Content and Language of the Chart
54
General Outcome Measures
Mastery Measures
National Center on Response to Intervention 55
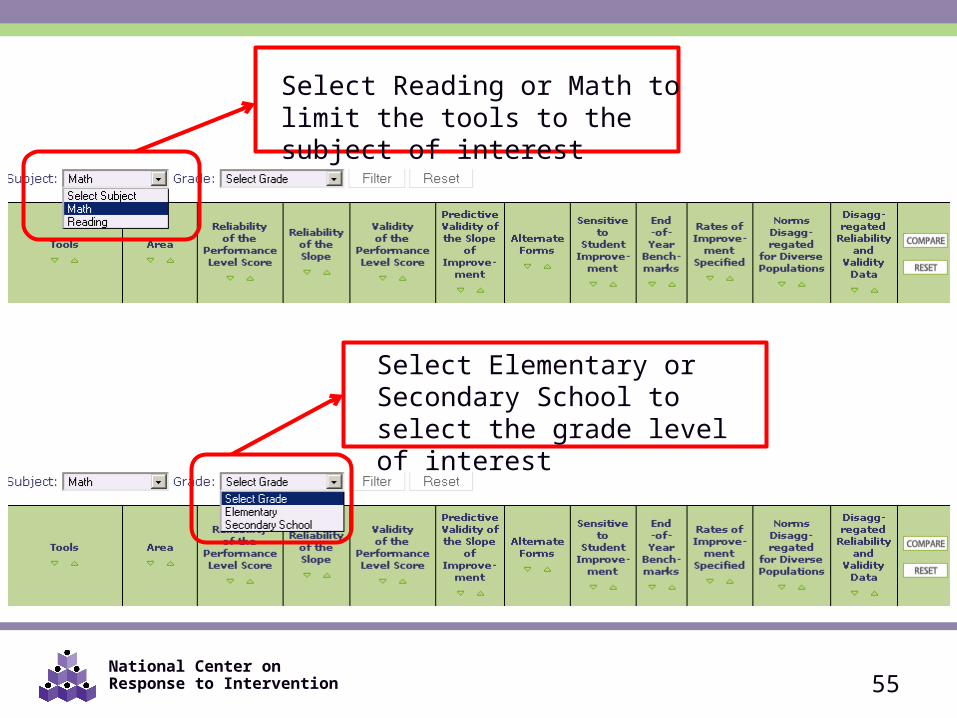
Select Reading or Math to limit the tools to the subject of interest
Select Elementary or Secondary School to select the grade level of interest
National Center on Response to Intervention
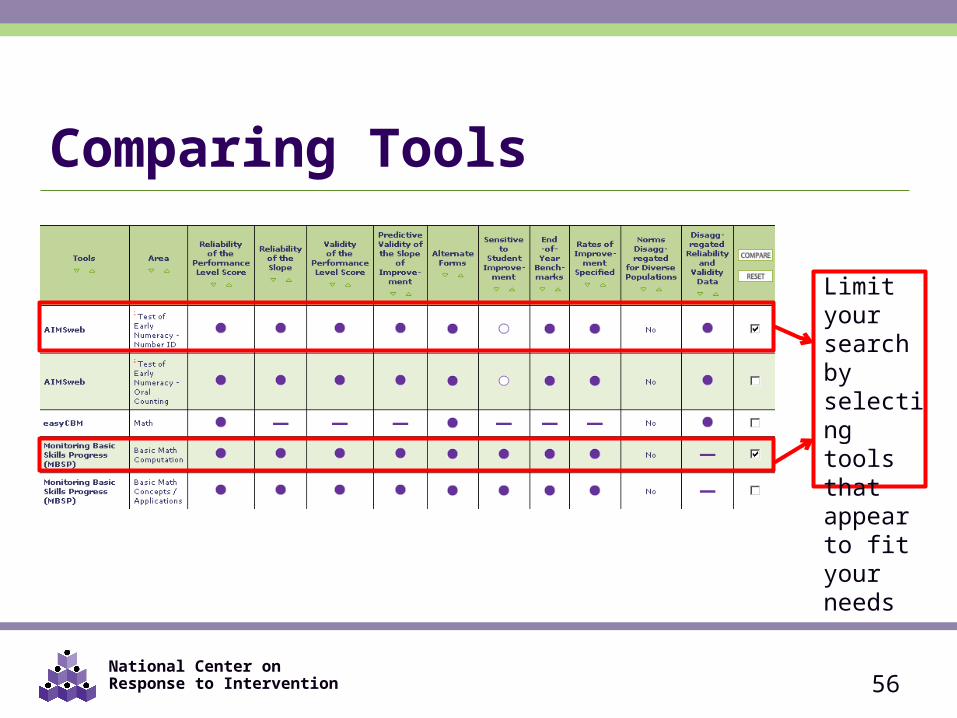
Comparing Tools
56
Limit your search by selecting tools that appear to fit your needs
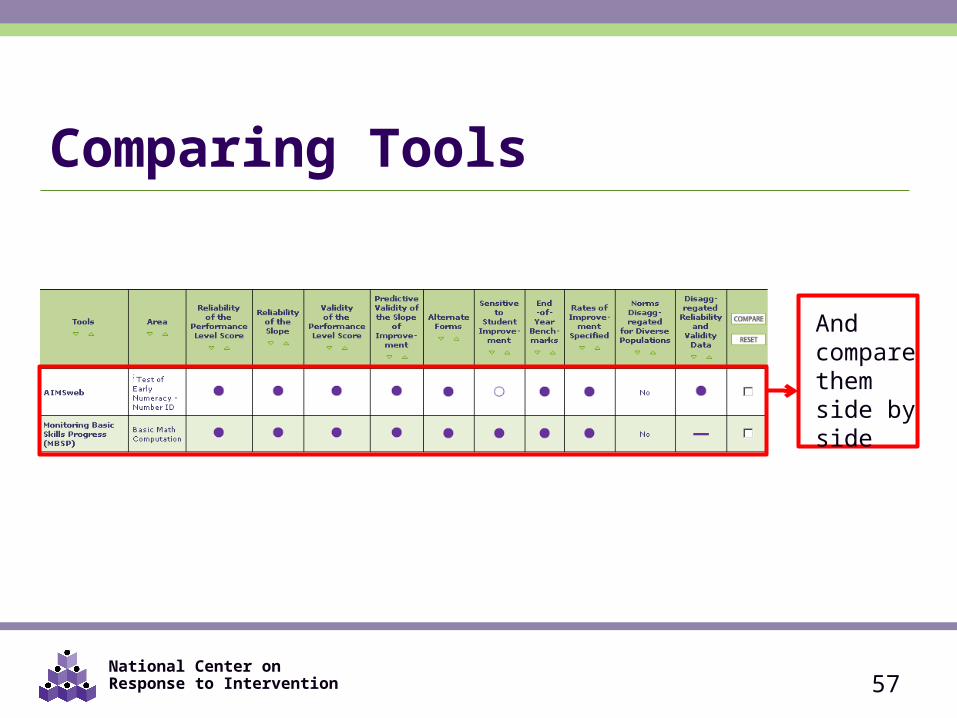
National Center on Response to Intervention
Comparing Tools
57
And compare them side by side
National Center on Response to Intervention 58
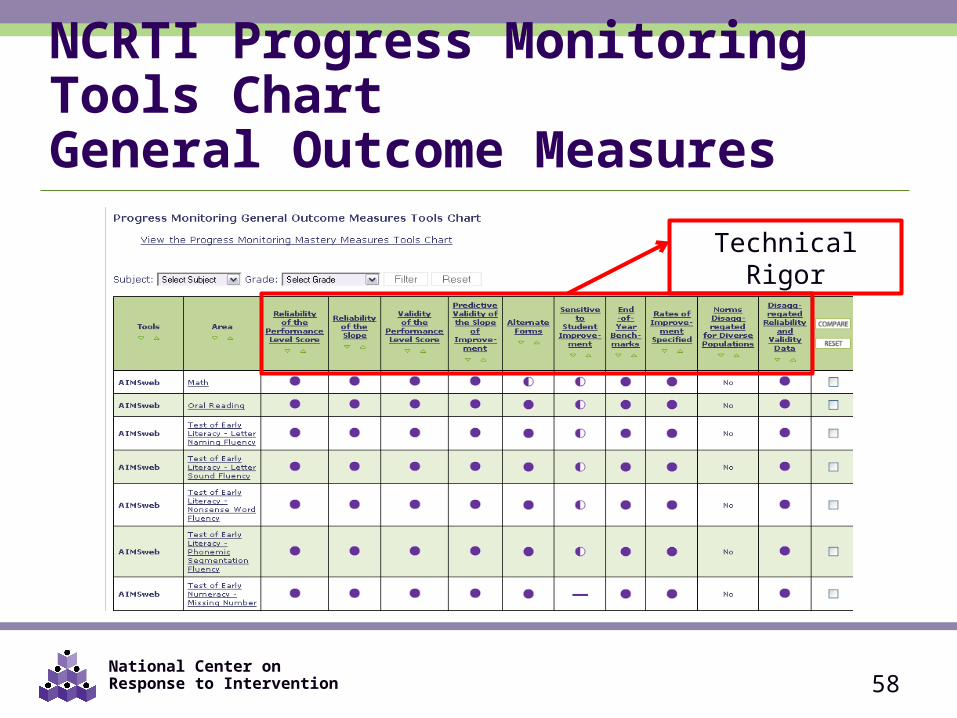
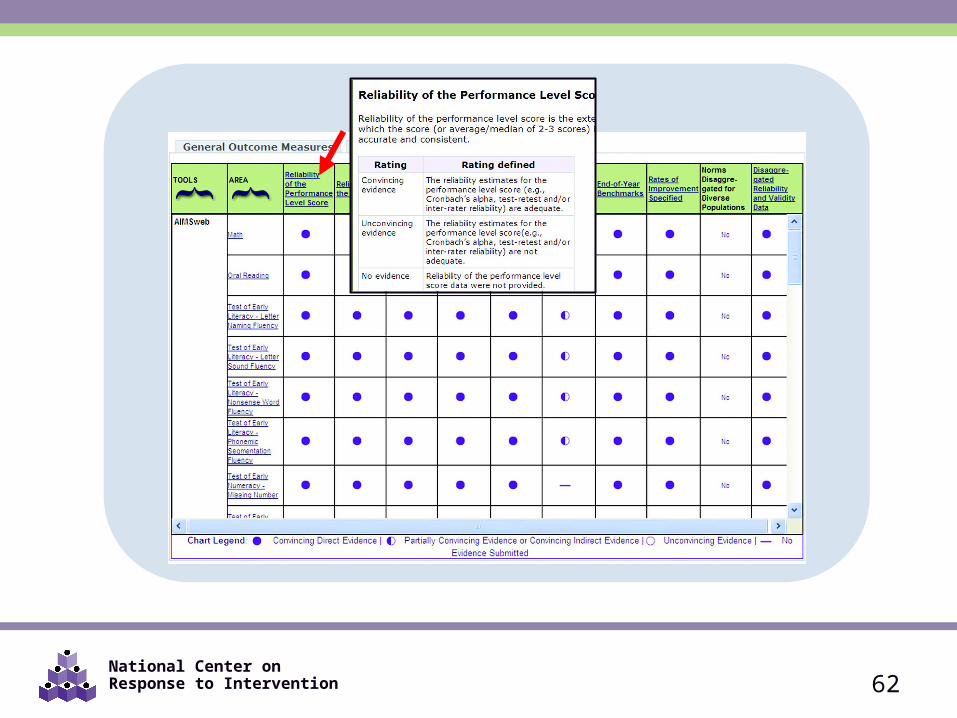
NCRTI Progress Monitoring Tools ChartGeneral Outcome Measures
Technical Rigor
National Center on Response to Intervention
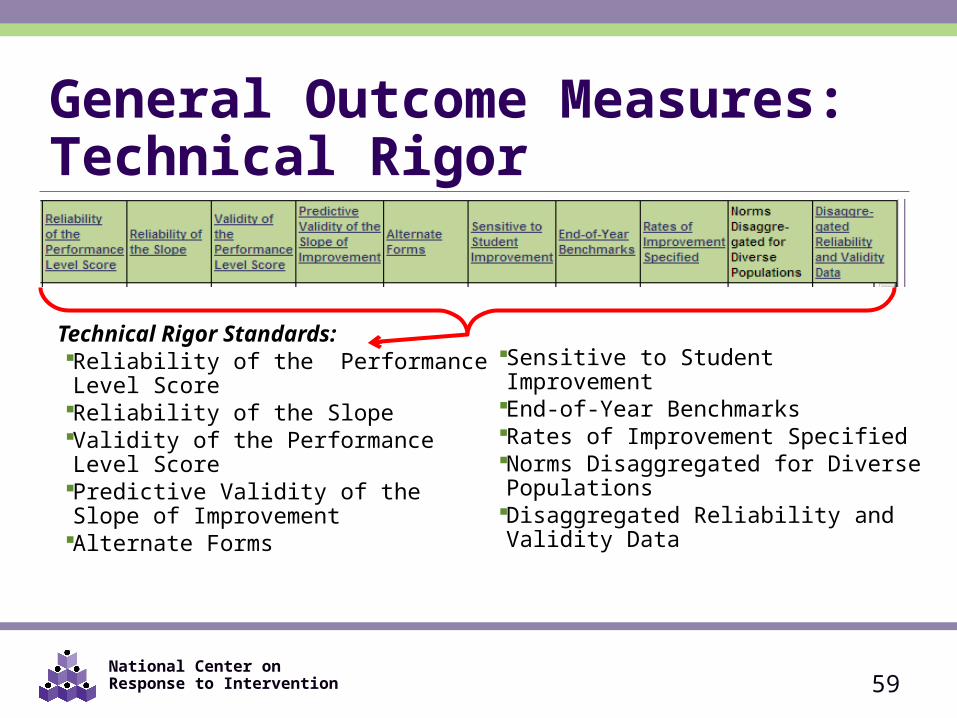
General Outcome Measures: Technical Rigor
Technical Rigor Standards: Reliability of the Performance Level Score Reliability of the Slope Validity of the Performance Level Score Predictive Validity of the Slope of
Improvement Alternate Forms
Sensitive to Student Improvement End-of-Year Benchmarks
Rates of Improvement Specified Norms Disaggregated for Diverse Populations Disaggregated Reliability and Validity Data
59
National Center on Response to Intervention
Technical Rigor
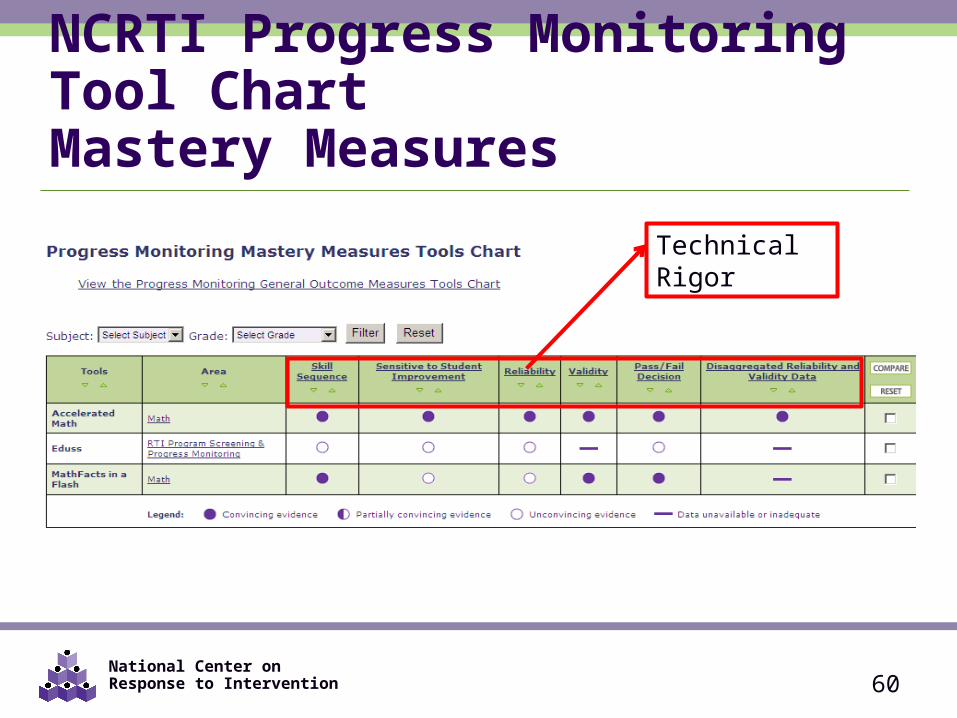
NCRTI Progress Monitoring Tool ChartMastery Measures
60
National Center on Response to Intervention
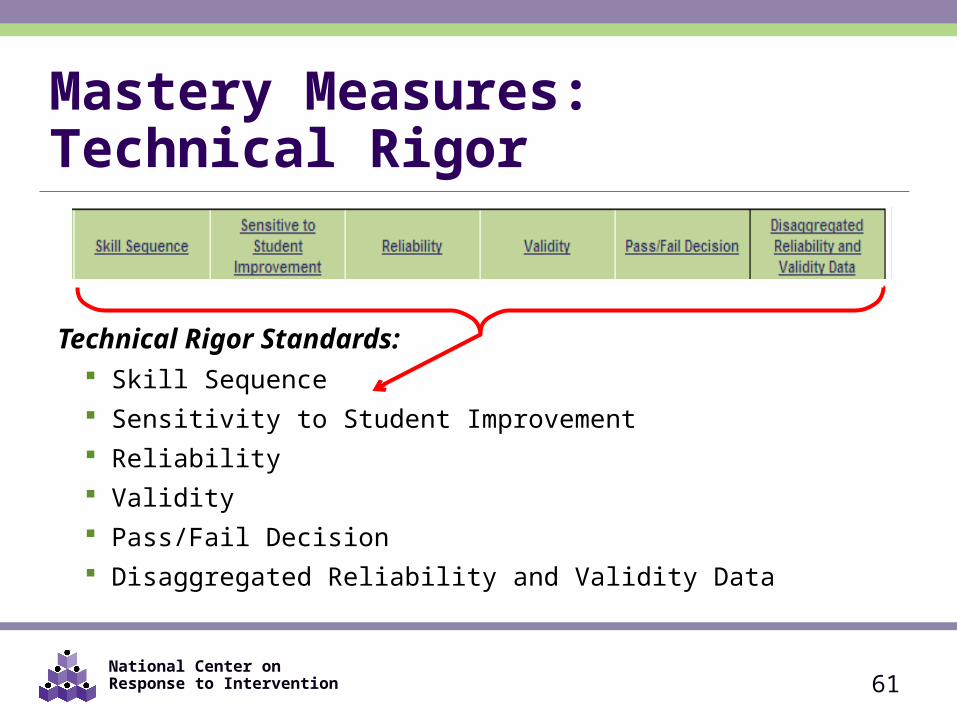
Mastery Measures: Technical Rigor
Technical Rigor Standards: Skill Sequence Sensitivity to Student Improvement Reliability Validity Pass/Fail Decision Disaggregated Reliability and Validity Data
61
National Center on Response to Intervention 62
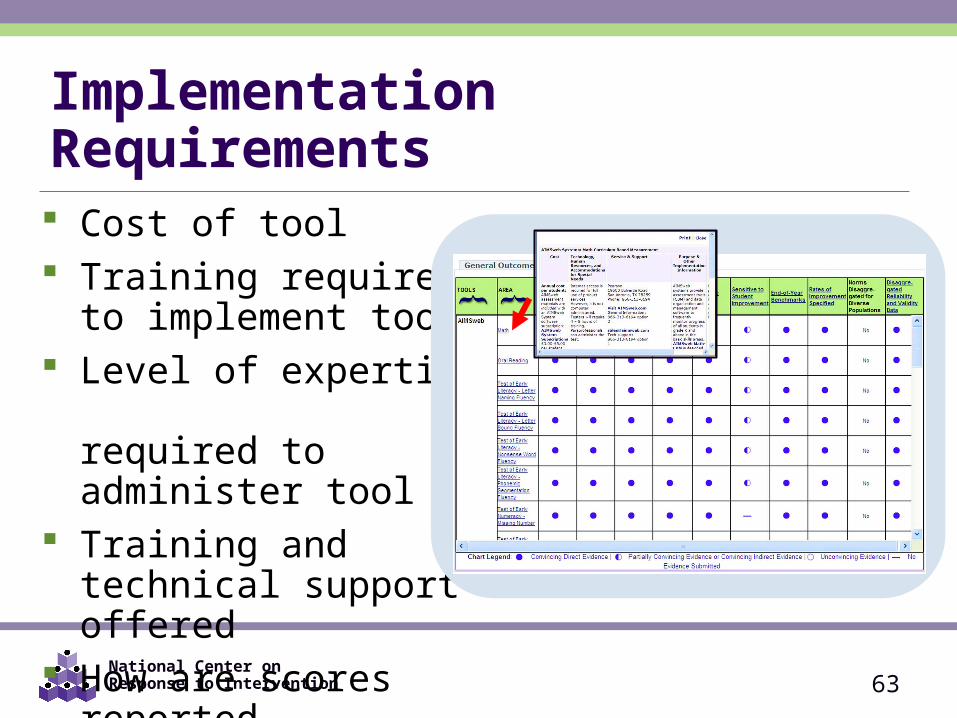
National Center on Response to Intervention
Implementation Requirements Cost of tool Training required to
implement tool Level of expertise
required to administer tool
Training and technical support offered
How are scores reported
63
National Center on Response to Intervention
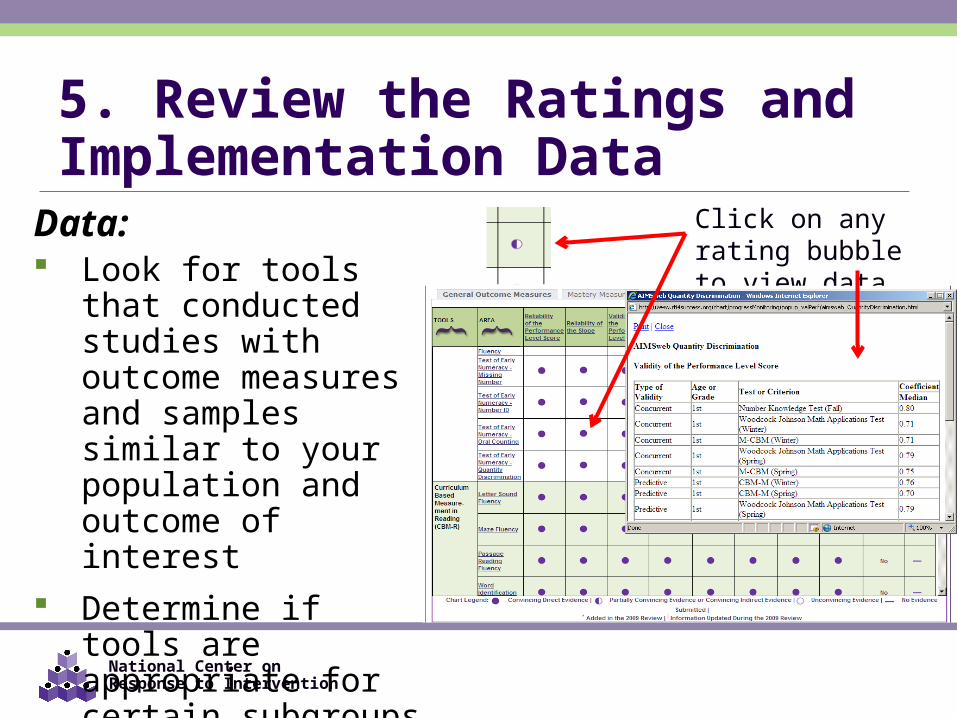
5. Review the Ratings and Implementation Data
Data: Look for tools that
conducted studies with outcome measures and samples similar to your population and outcome of interest
Determine if tools are appropriate for certain subgroups (e.g., ELLs)
Click on any rating bubble to view data
National Center on Response to Intervention
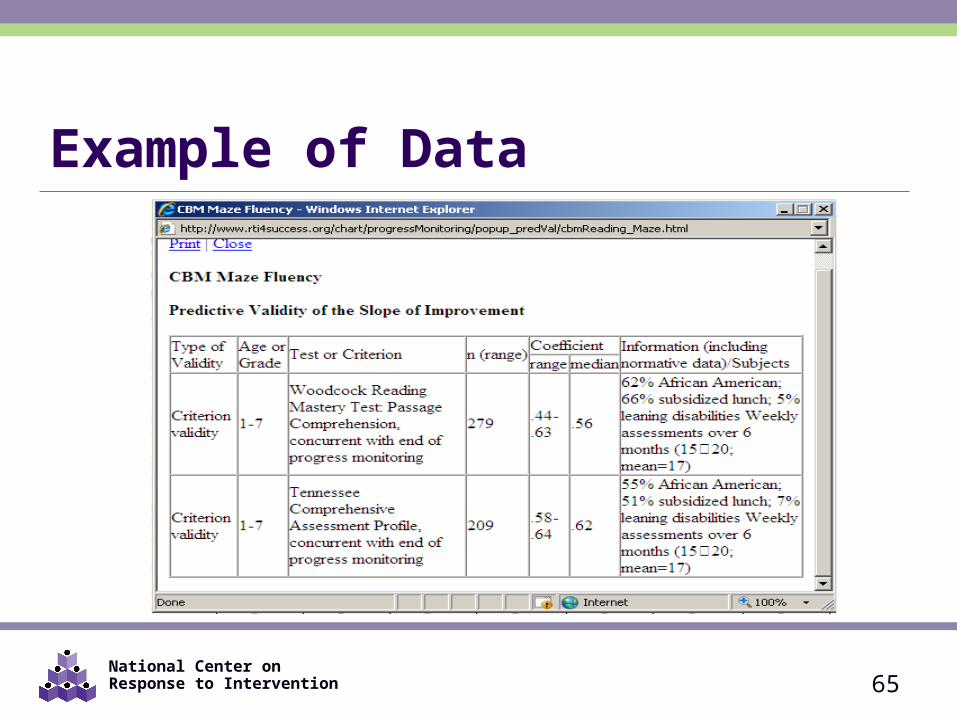
Example of Data
65
National Center on Response to Intervention
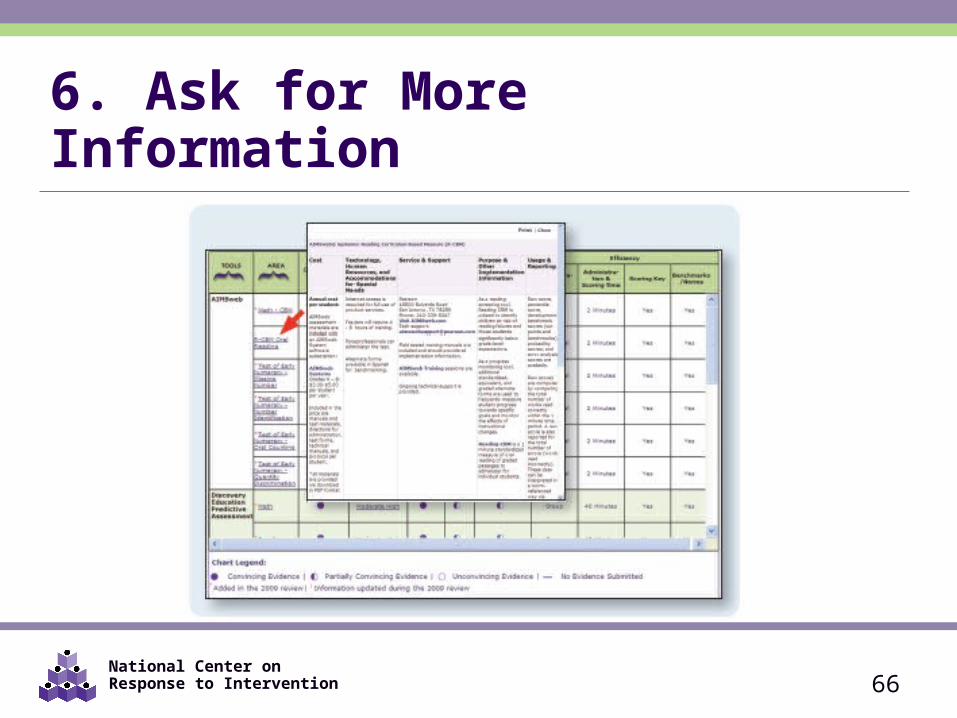
6. Ask for More Information
66
National Center on Response to Intervention 67
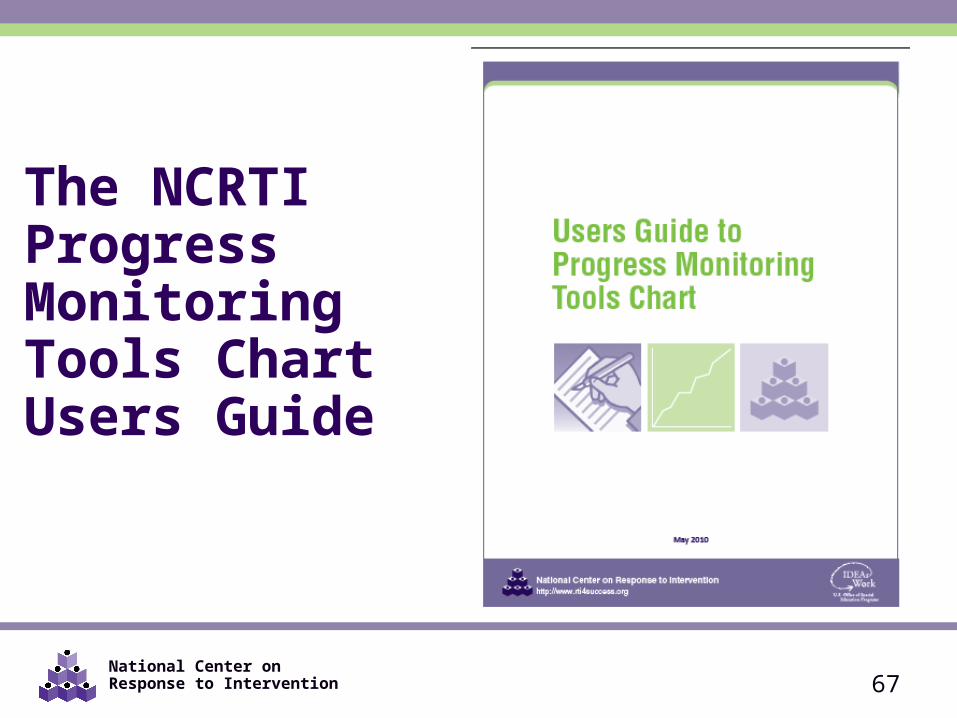
The NCRTI Progress Monitoring Tools Chart Users Guide
National Center on Response to Intervention
Timeframe for Progress Monitoring
68
Throughout instruction at regular intervals (e.g., weekly, bi-weekly, monthly)
Teachers use student data to quantify short- and long-term goals toward end-of-year goals
National Center on Response to Intervention
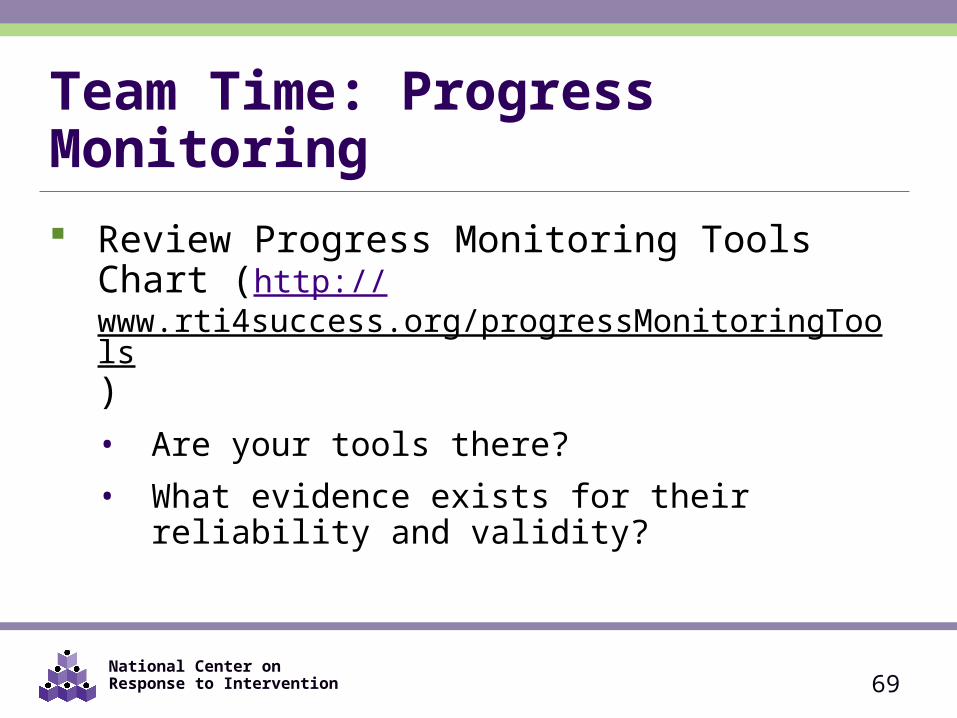
Team Time: Progress Monitoring Review Progress Monitoring Tools Chart (http://
www.rti4success.org/progressMonitoringTools)• Are your tools there? • What evidence exists for their reliability and validity?
69
National Center on Response to Intervention
THINK-PAIR-SHARE How has what you heard challenged your thinking
about progress monitoring? How has it confirmed your thinking?
70
National Center on Response to Intervention
PROGRESS MONITORING DATA- BASED DECISION MAKING
71
National Center on Response to Intervention 72
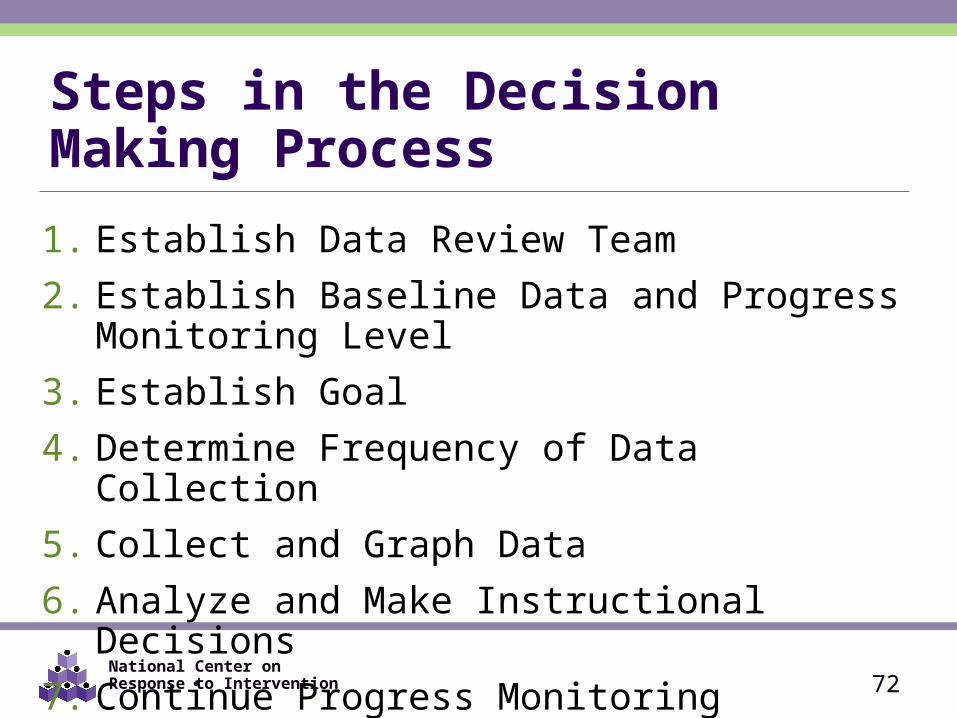
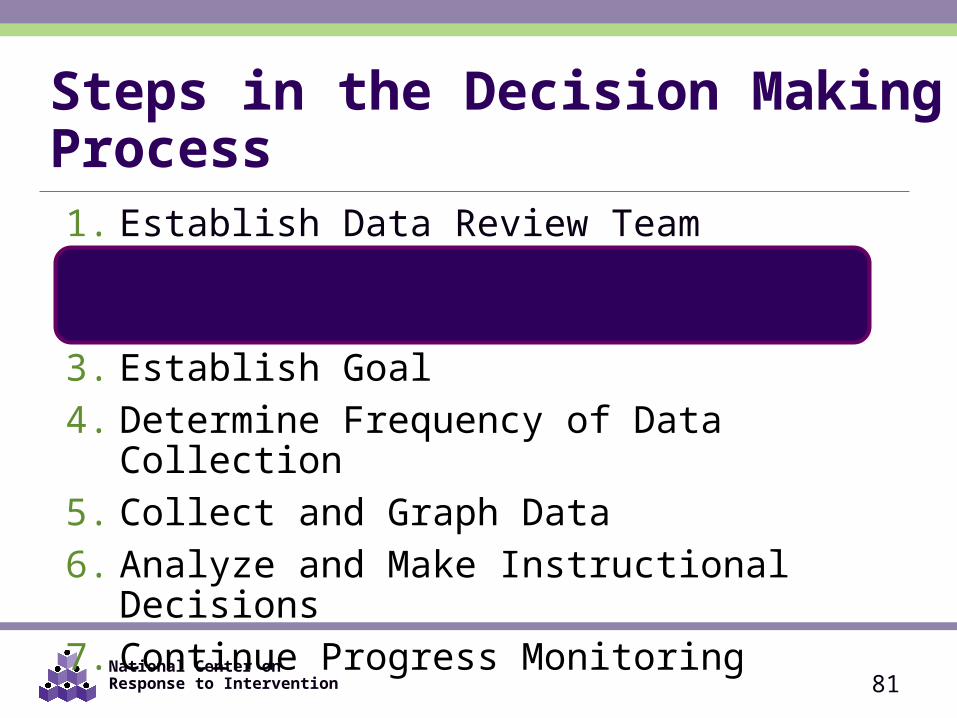
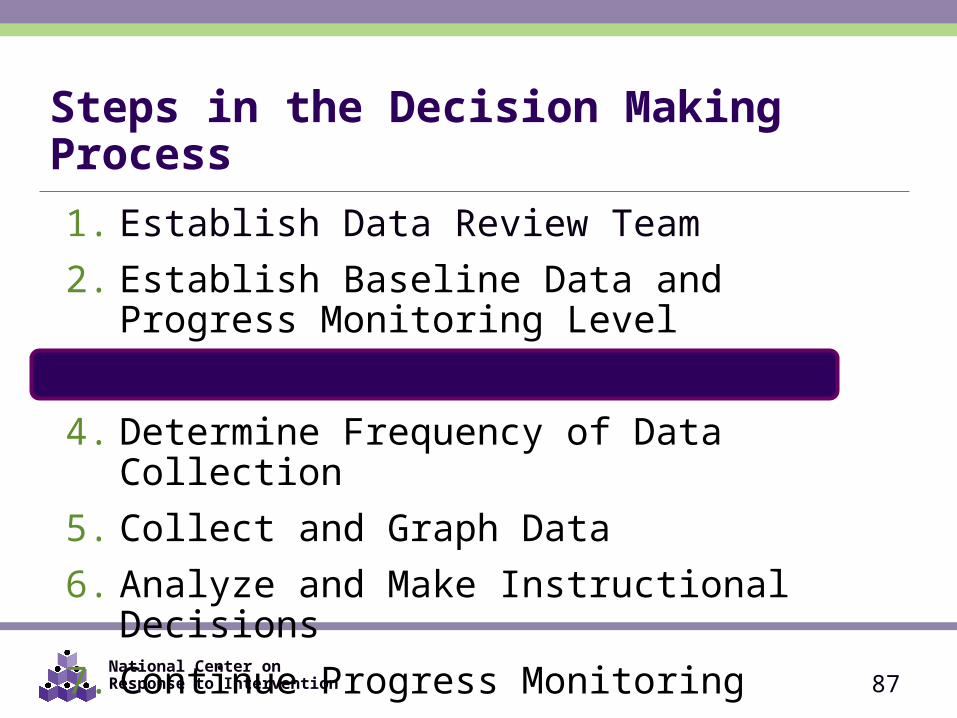
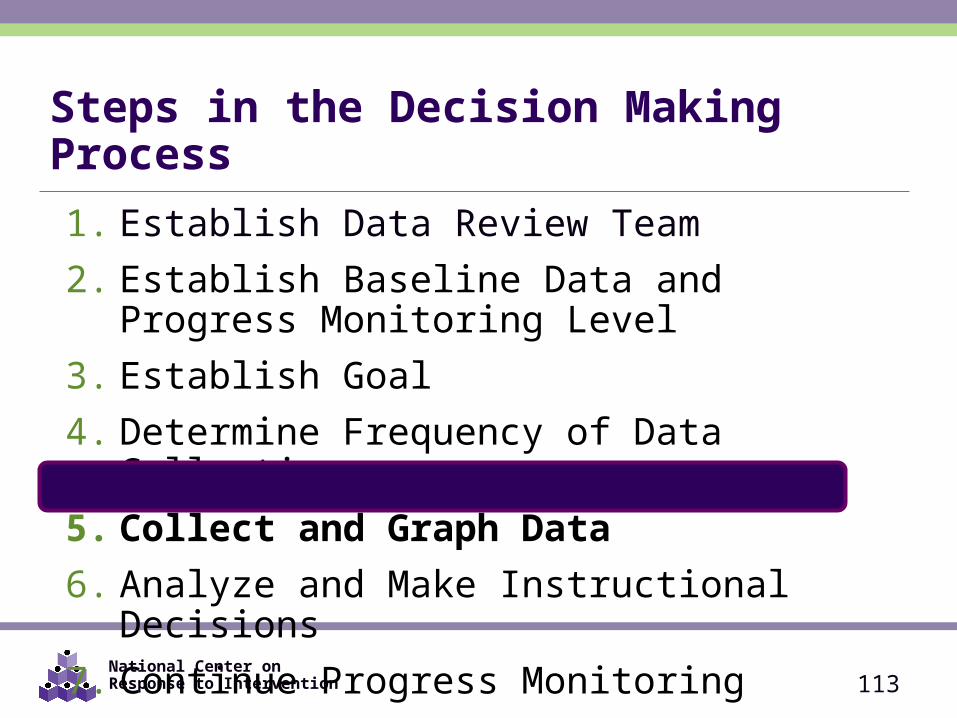
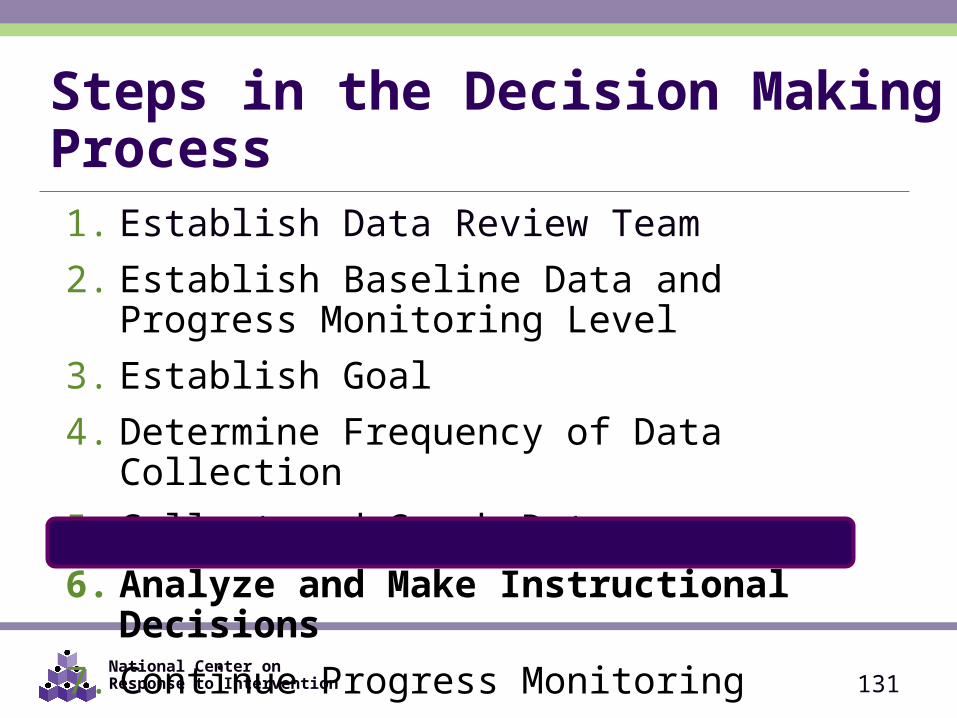
Steps in the Decision Making Process
1. Establish Data Review Team2. Establish Baseline Data and Progress Monitoring Level3. Establish Goal4. Determine Frequency of Data Collection5. Collect and Graph Data6. Analyze and Make Instructional Decisions7. Continue Progress Monitoring
National Center on Response to Intervention 73
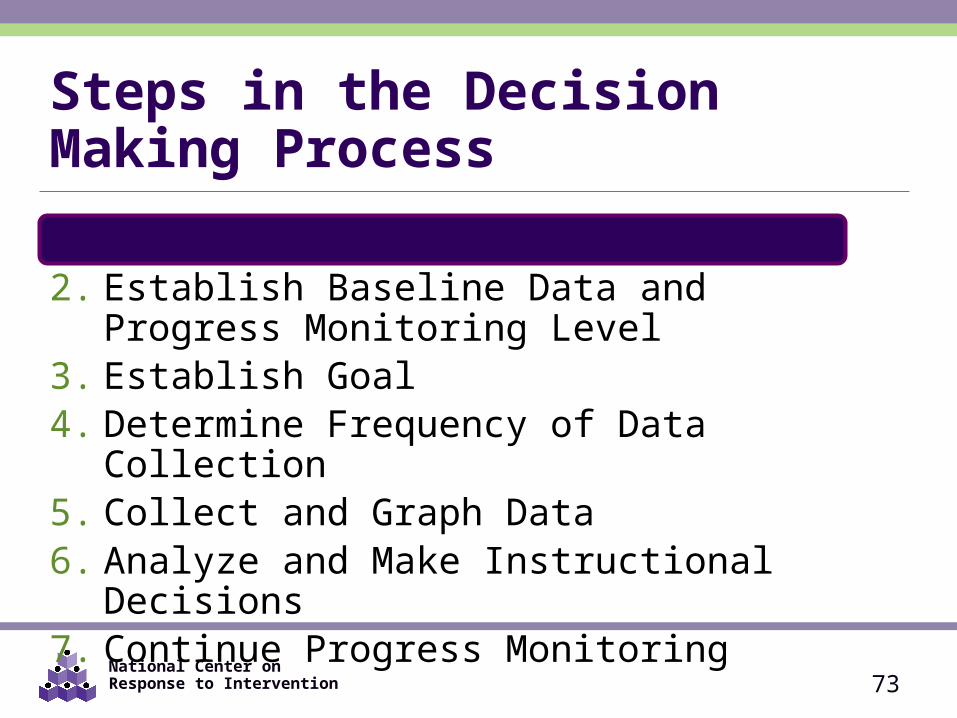
Steps in the Decision Making Process
1. Establish Data Review Team2. Establish Baseline Data and Progress Monitoring
Level3. Establish Goal4. Determine Frequency of Data Collection5. Collect and Graph Data6. Analyze and Make Instructional Decisions7. Continue Progress Monitoring
National Center on Response to Intervention
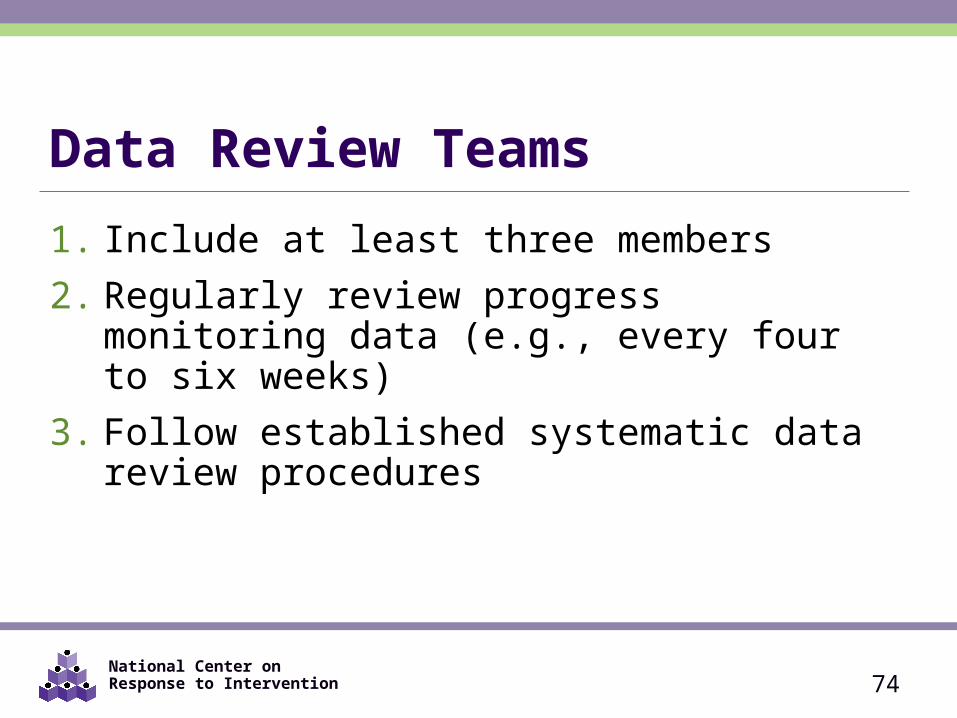
Data Review Teams
1. Include at least three members 2. Regularly review progress monitoring data (e.g.,
every four to six weeks) 3. Follow established systematic data review
procedures
74
National Center on Response to Intervention
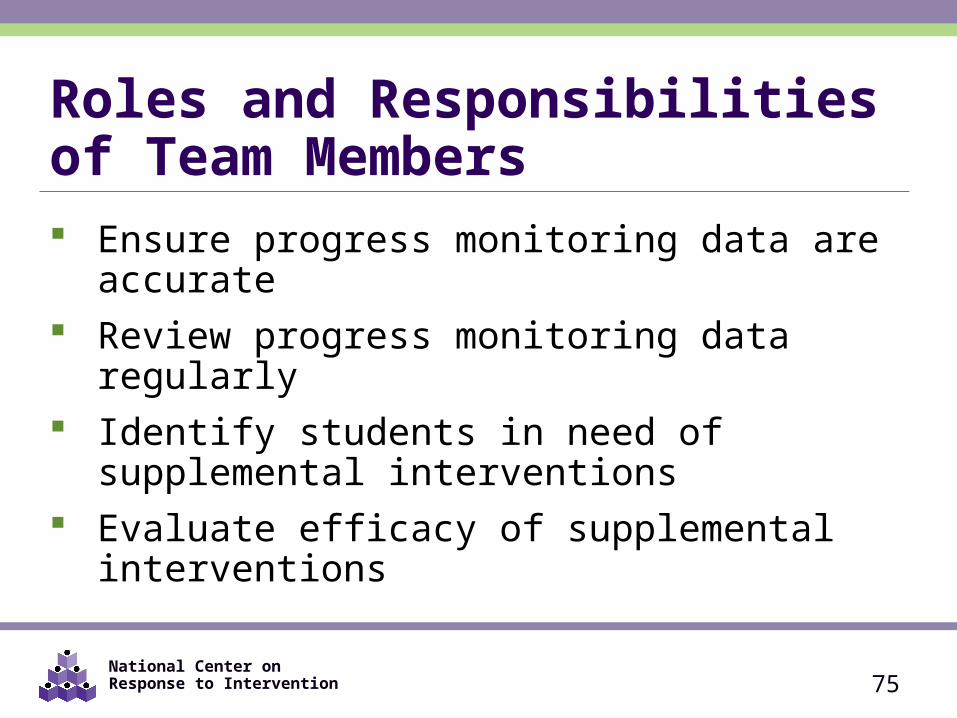
Roles and Responsibilitiesof Team Members Ensure progress monitoring data are accurate Review progress monitoring data regularly Identify students in need of supplemental
interventions Evaluate efficacy of supplemental interventions
75
National Center on Response to Intervention
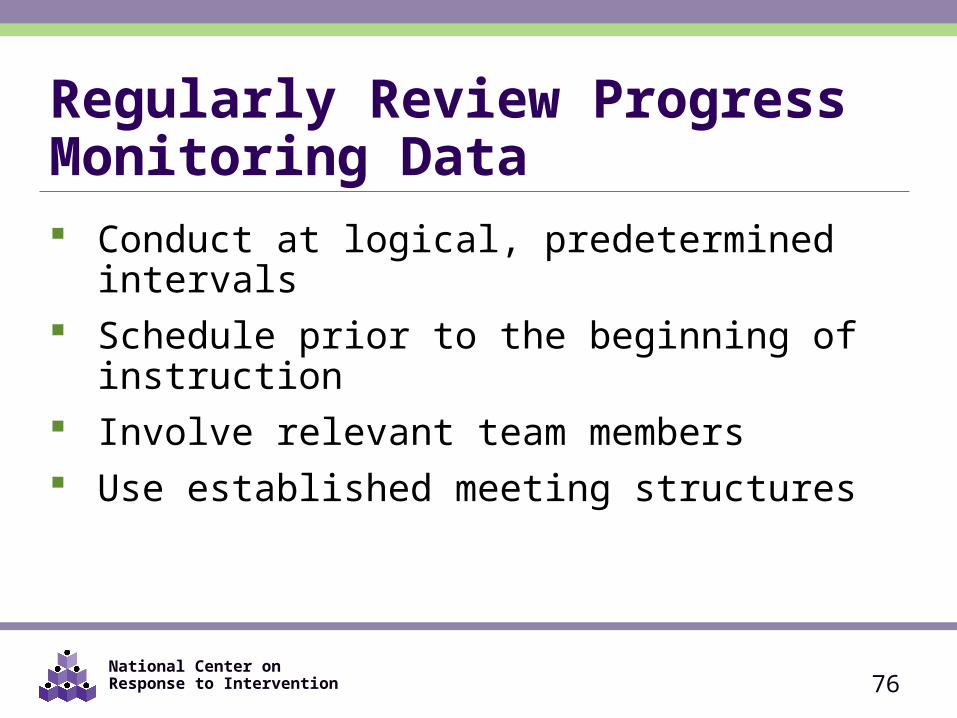
Regularly Review ProgressMonitoring Data Conduct at logical, predetermined intervals Schedule prior to the beginning of instruction Involve relevant team members Use established meeting structures
76
National Center on Response to Intervention
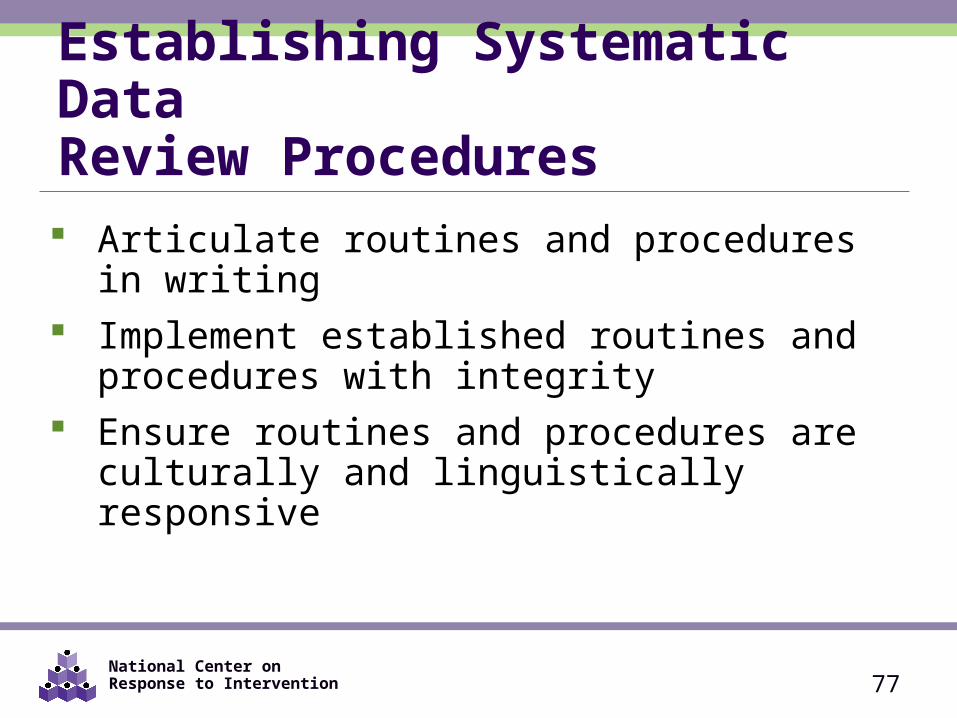
Establishing Systematic DataReview Procedures Articulate routines and procedures in writing Implement established routines and procedures with
integrity Ensure routines and procedures are culturally and
linguistically responsive
77
National Center on Response to Intervention
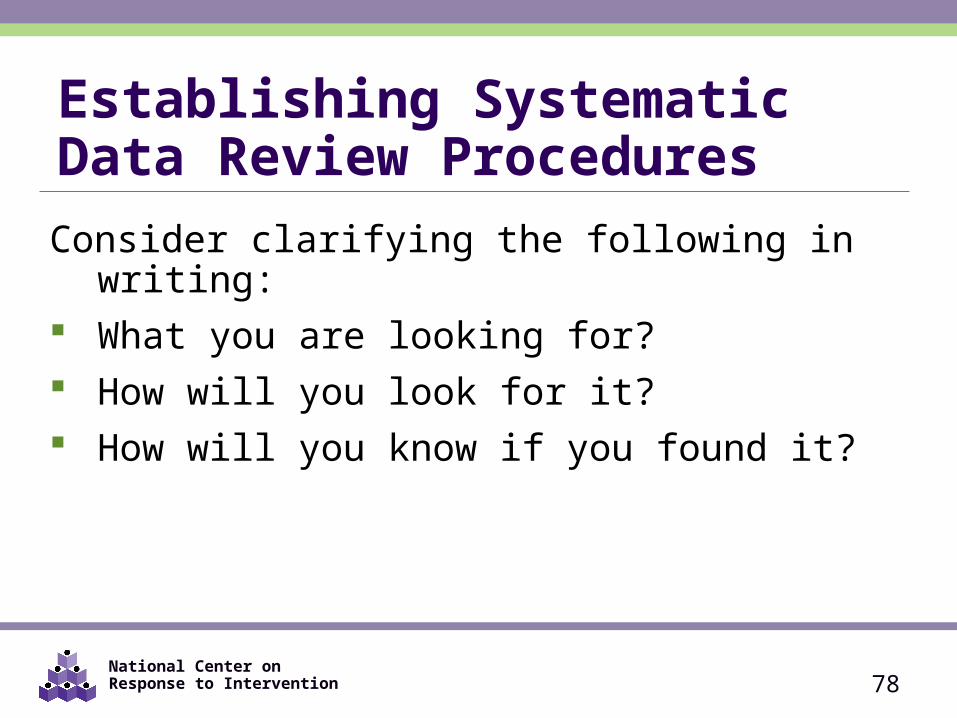
Establishing SystematicData Review ProceduresConsider clarifying the following in writing: What you are looking for? How will you look for it? How will you know if you found it?
78
National Center on Response to Intervention
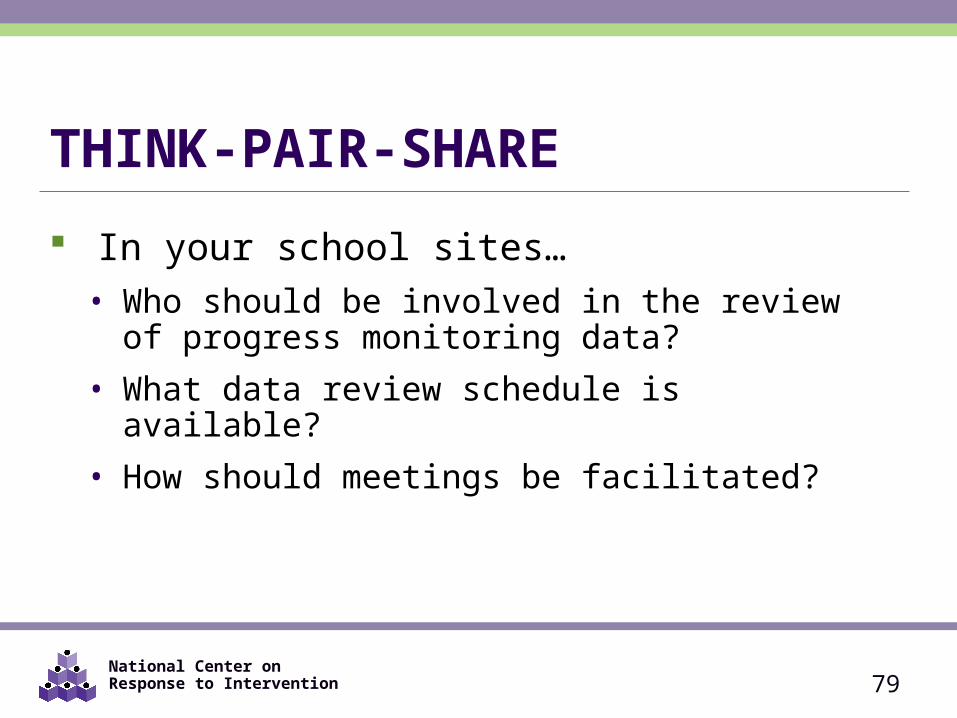
THINK-PAIR-SHARE
In your school sites…• Who should be involved in the review of progress
monitoring data?• What data review schedule is available?• How should meetings be facilitated?
79
National Center on Response to Intervention
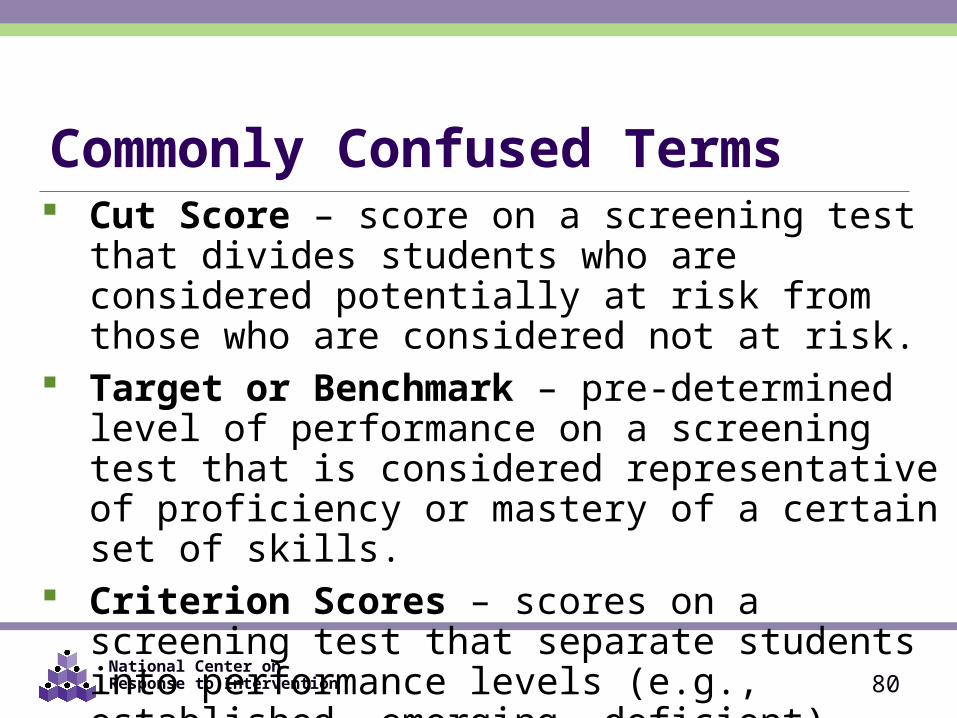
Commonly Confused Terms Cut Score – score on a screening test that divides
students who are considered potentially at risk from those who are considered not at risk.
Target or Benchmark – pre-determined level of performance on a screening test that is considered representative of proficiency or mastery of a certain set of skills.
Criterion Scores – scores on a screening test that separate students into performance levels (e.g., established, emerging, deficient)
80
National Center on Response to Intervention
Steps in the Decision Making Process1. Establish Data Review Team2. Establish Baseline Data and Progress Monitoring
Level3. Establish Goal4. Determine Frequency of Data Collection5. Collect and Graph Data6. Analyze and Make Instructional Decisions7. Continue Progress Monitoring
81
National Center on Response to Intervention
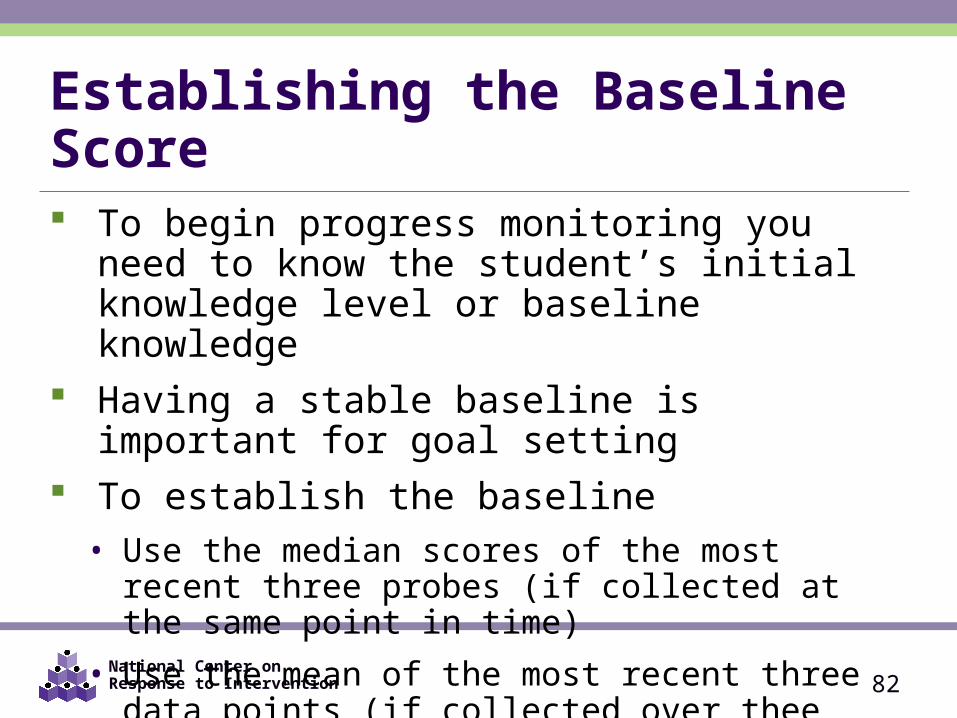
Establishing the Baseline Score To begin progress monitoring you need to know the
student’s initial knowledge level or baseline knowledge
Having a stable baseline is important for goal setting To establish the baseline
• Use the median scores of the most recent three probes (if collected at the same point in time)
• Use the mean of the most recent three data points (if collected over thee different points in time).
82
National Center on Response to Intervention
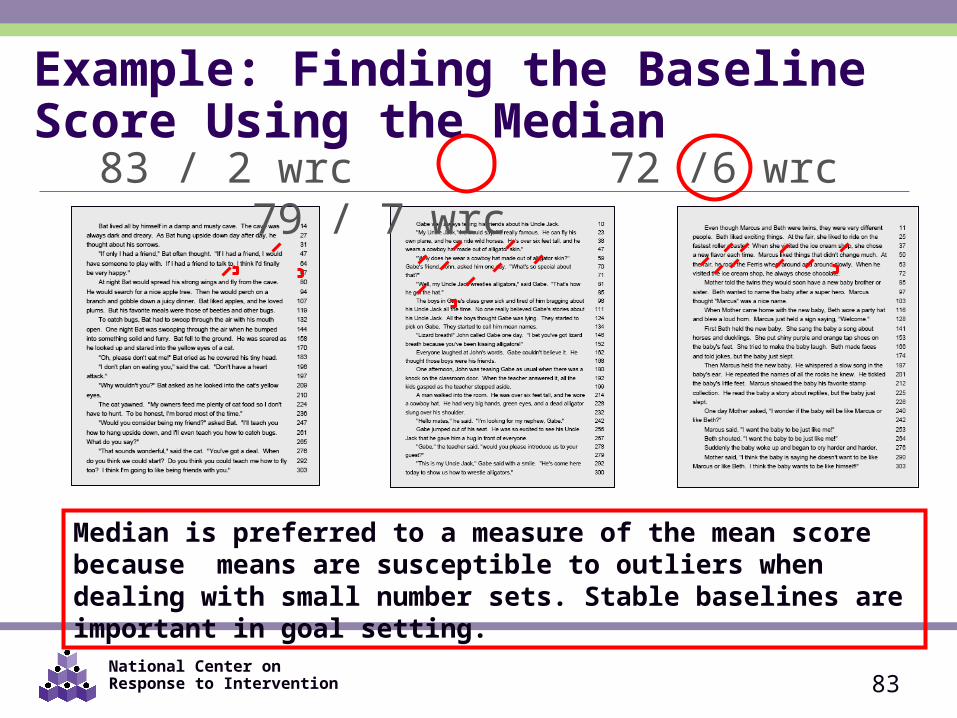
Example: Finding the Baseline Score Using the Median
Median is preferred to a measure of the mean score because means are susceptible to outliers when dealing with small number sets. Stable baselines are important in goal setting.
83 / 2 wrc 72 /6 wrc 79 / 7 wrc
83
National Center on Response to Intervention
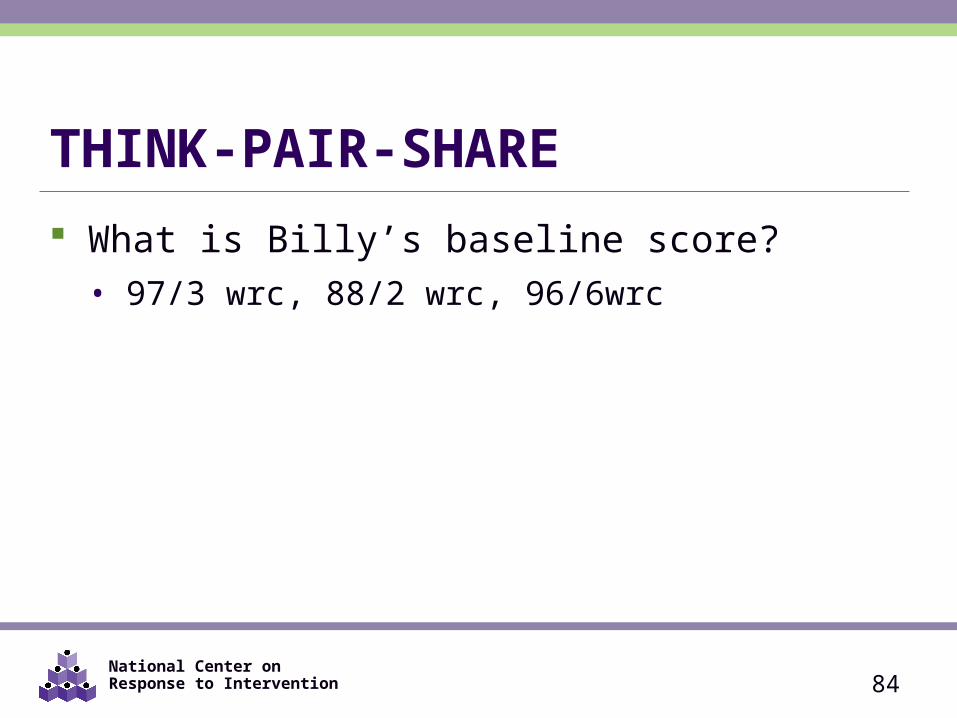
THINK-PAIR-SHARE What is Billy’s baseline score?
• 97/3 wrc, 88/2 wrc, 96/6wrc
84
National Center on Response to Intervention
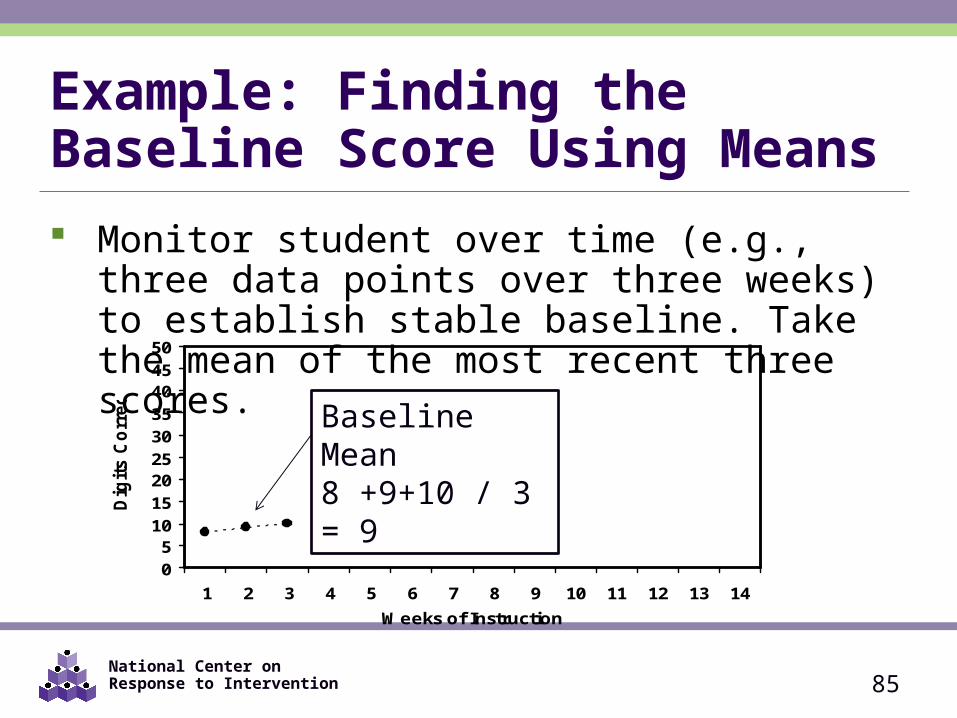
Example: Finding the Baseline Score Using Means Monitor student over time (e.g., three data points
over three weeks) to establish stable baseline. Take the mean of the most recent three scores.
85
05
101520253035404550
1 2 3 4 5 6 7 8 9 10 11 12 13 14
Weeks of Instruction
Dig
its C
orr
ect
Baseline Mean8 +9+10 / 3 = 9
National Center on Response to Intervention
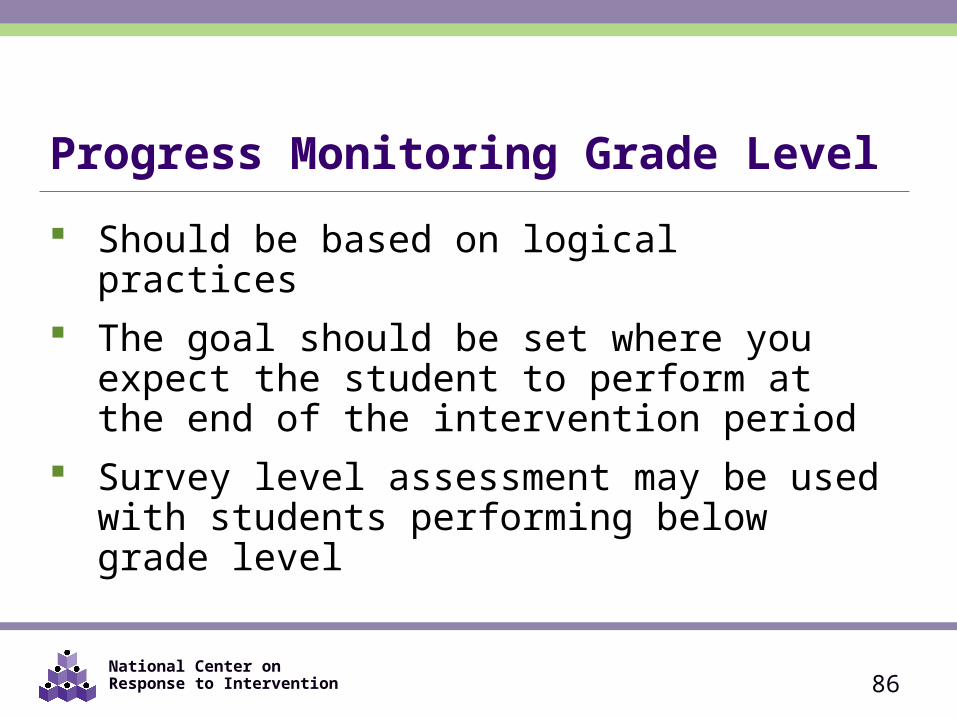
Progress Monitoring Grade Level Should be based on logical practices The goal should be set where you expect the student
to perform at the end of the intervention period Survey level assessment may be used with students
performing below grade level
86
National Center on Response to Intervention
Steps in the Decision Making Process1. Establish Data Review Team2. Establish Baseline Data and Progress Monitoring
Level3. Establish Goal4. Determine Frequency of Data Collection5. Collect and Graph Data6. Analyze and Make Instructional Decisions7. Continue Progress Monitoring
87
National Center on Response to Intervention 88
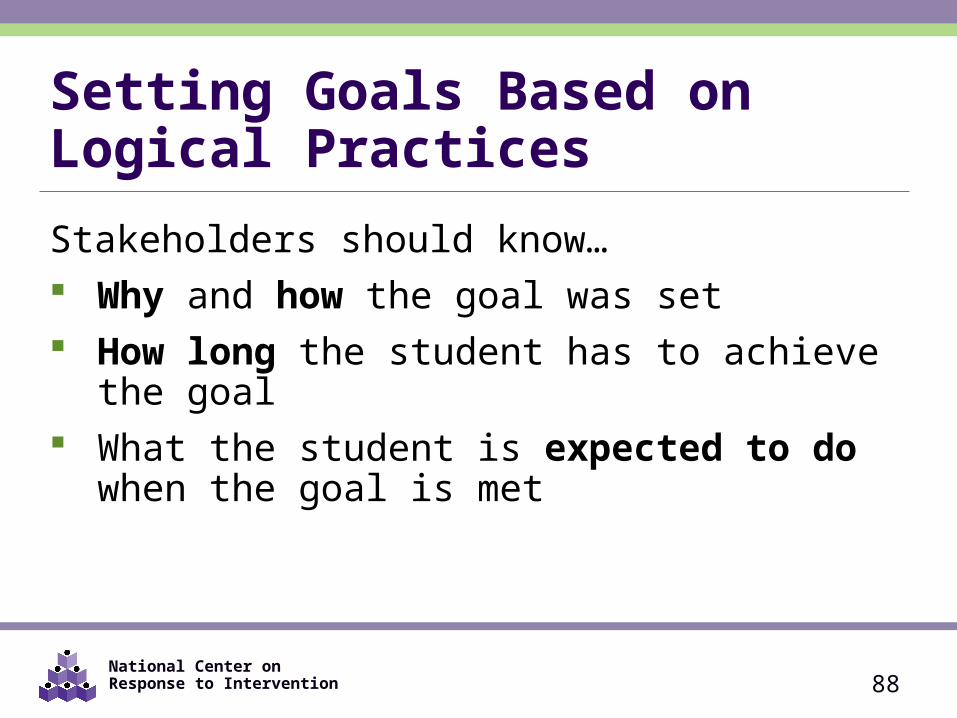
Setting Goals Based on Logical Practices
Stakeholders should know… Why and how the goal was set How long the student has to achieve the goal What the student is expected to do when the goal is
met
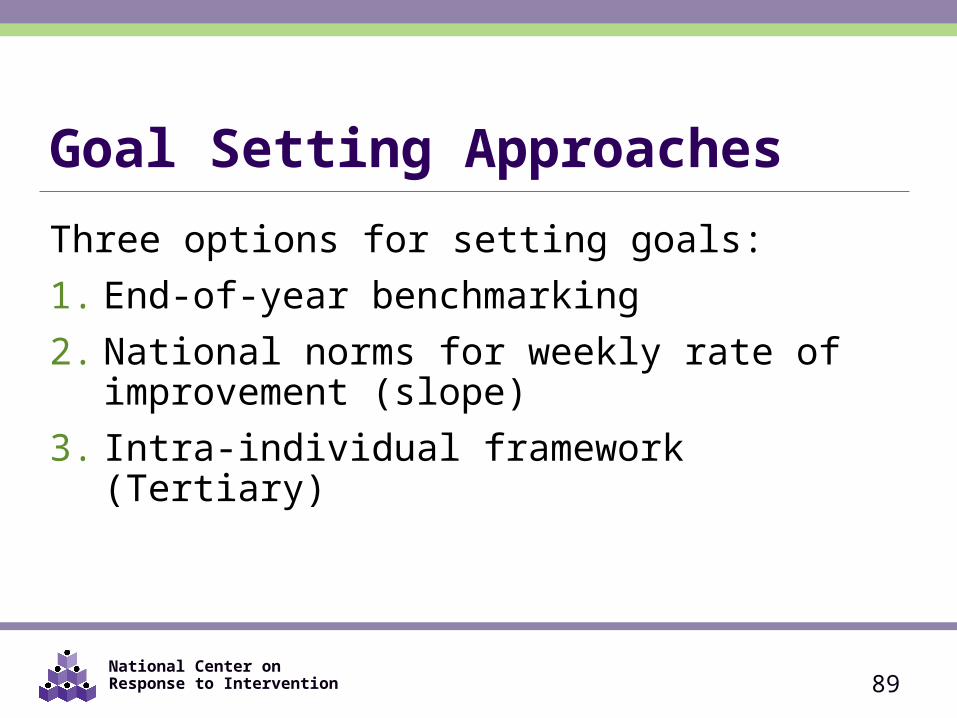
National Center on Response to Intervention 89
Goal Setting Approaches
Three options for setting goals:1. End-of-year benchmarking2. National norms for weekly rate of improvement
(slope)3. Intra-individual framework (Tertiary)
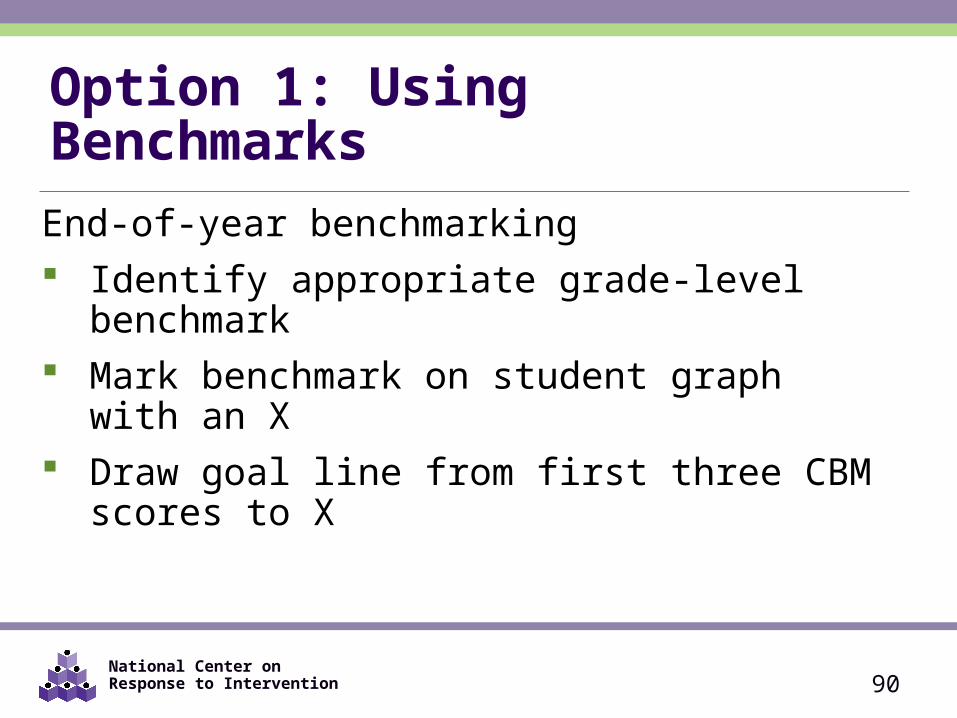
National Center on Response to Intervention
Option 1: Using Benchmarks End-of-year benchmarking Identify appropriate grade-level benchmark Mark benchmark on student graph with an X Draw goal line from first three CBM scores to X
90
National Center on Response to Intervention
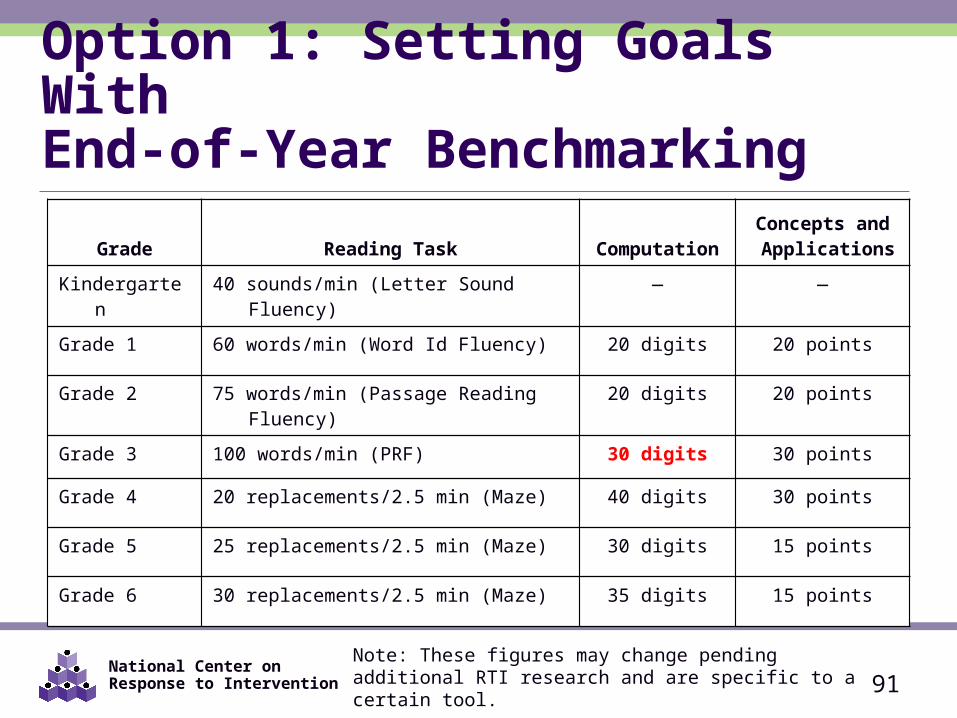
Option 1: Setting Goals With End-of-Year Benchmarking
Grade Reading Task ComputationConcepts and Applications
Kindergarten 40 sounds/min (Letter Sound Fluency) — —
Grade 1 60 words/min (Word Id Fluency) 20 digits 20 points
Grade 2 75 words/min (Passage Reading Fluency) 20 digits 20 points
Grade 3 100 words/min (PRF) 30 digits 30 points
Grade 4 20 replacements/2.5 min (Maze) 40 digits 30 points
Grade 5 25 replacements/2.5 min (Maze) 30 digits 15 points
Grade 6 30 replacements/2.5 min (Maze) 35 digits 15 points
91Note: These figures may change pending additional RTI research and are specific to a certain tool.
National Center on Response to Intervention
X
05
101520253035404550
1 2 3 4 5 6 7 8 9 10 11 12 13 14
Weeks of Instruction
Dig
its
Co
rrec
t
goal line
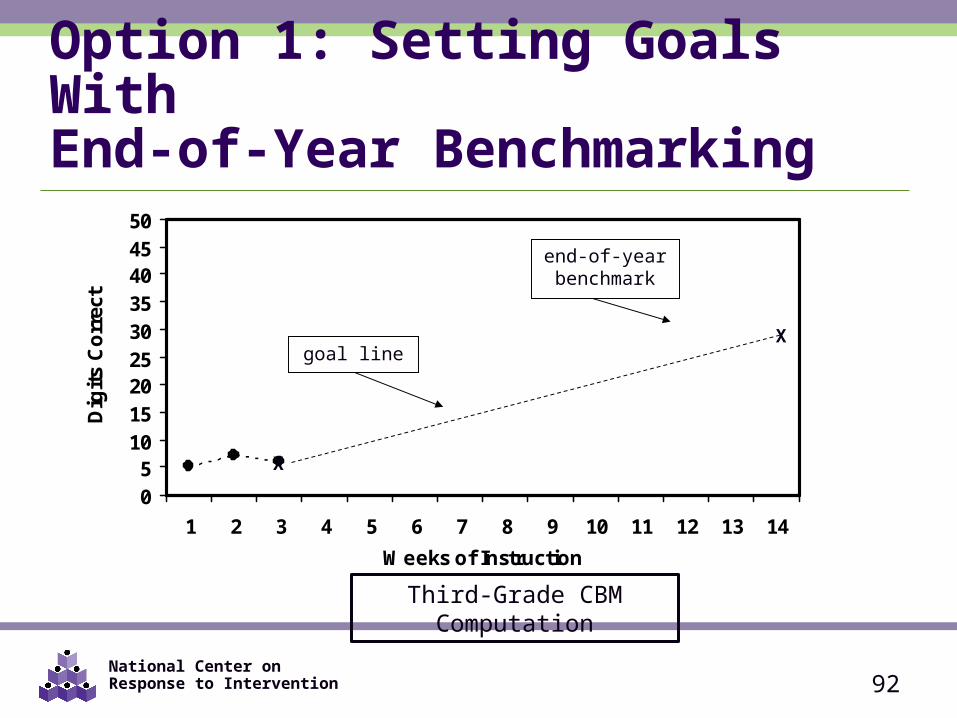
end-of-year benchmark
Option 1: Setting Goals With End-of-Year Benchmarking
92
X
Third-Grade CBM Computation
National Center on Response to Intervention 93
05
101520253035404550
1 2 3 4 5 6 7 8 9 10 11 12 13 14
Weeks of Instruction
Dig
its
Co
rrec
t
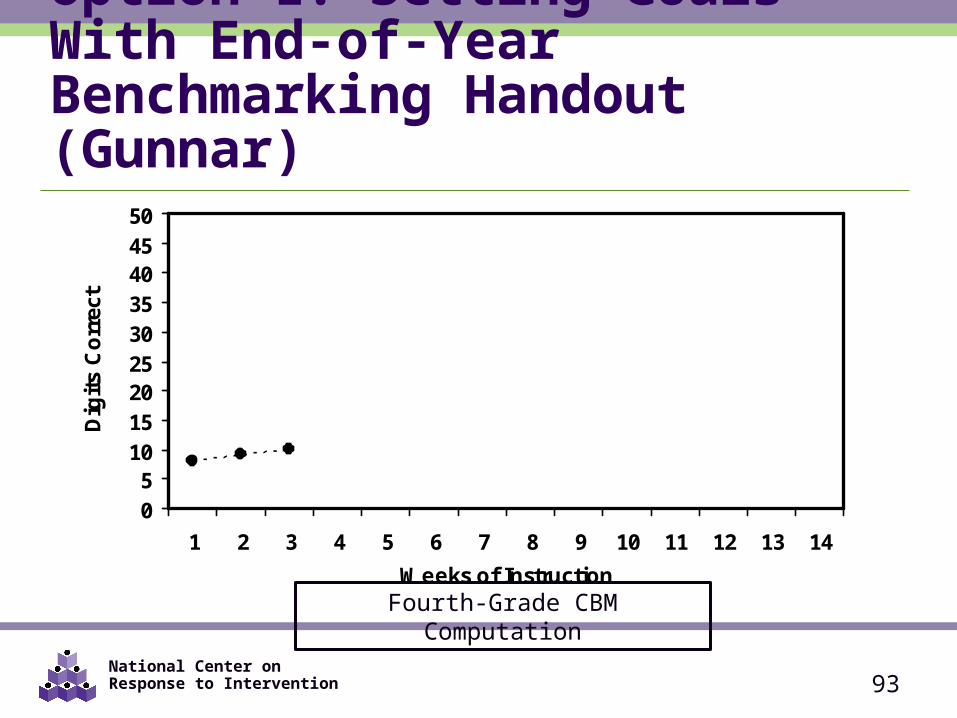
Option 1: Setting Goals With End-of-Year Benchmarking Handout (Gunnar)
Fourth-Grade CBM Computation
National Center on Response to Intervention 94
05
101520253035404550
1 2 3 4 5 6 7 8 9 10 11 12 13 14
Weeks of Instruction
Dig
its
Co
rrec
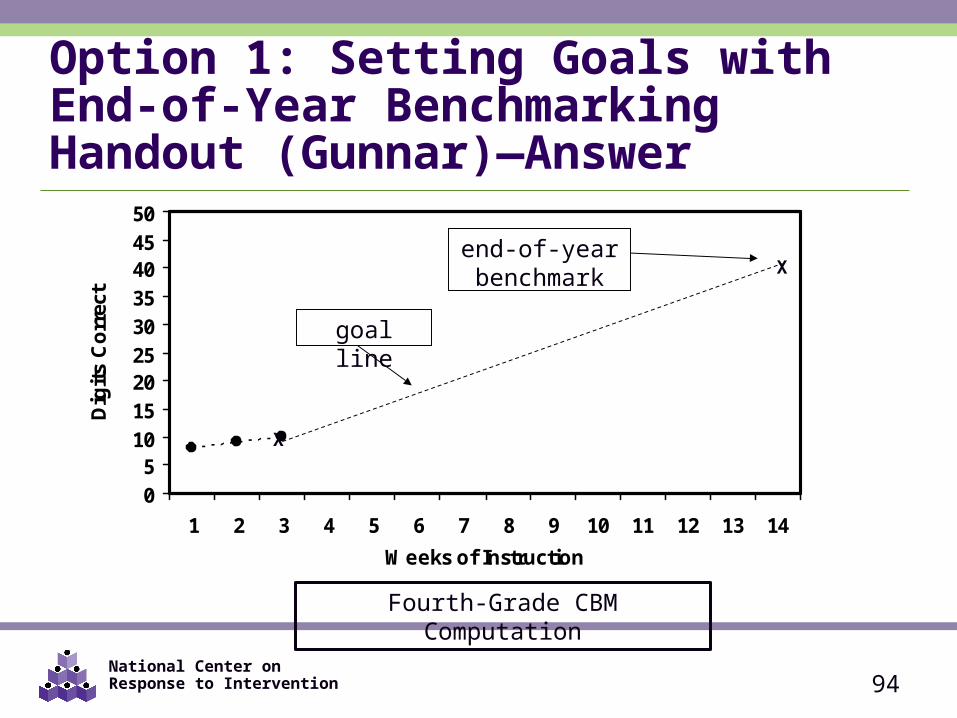
t X
goal line
end-of-year benchmark
Option 1: Setting Goals with End-of-Year Benchmarking Handout (Gunnar)—Answer
X
Fourth-Grade CBM Computation
National Center on Response to Intervention 95
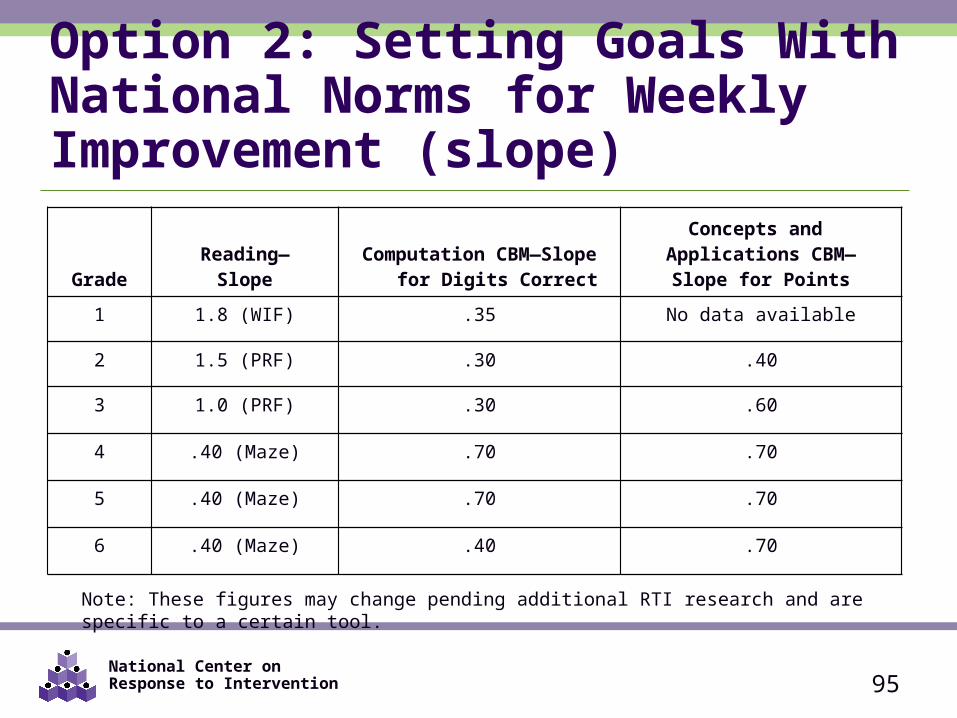
Option 2: Setting Goals With National Norms for Weekly Improvement (slope)
GradeReading—
SlopeComputation CBM—Slope
for Digits Correct
Concepts and Applications CBM—
Slope for Points
1 1.8 (WIF) .35 No data available
2 1.5 (PRF) .30 .40
3 1.0 (PRF) .30 .60
4 .40 (Maze) .70 .70
5 .40 (Maze) .70 .70
6 .40 (Maze) .40 .70
Note: These figures may change pending additional RTI research and are specific to a certain tool.
National Center on Response to Intervention 96
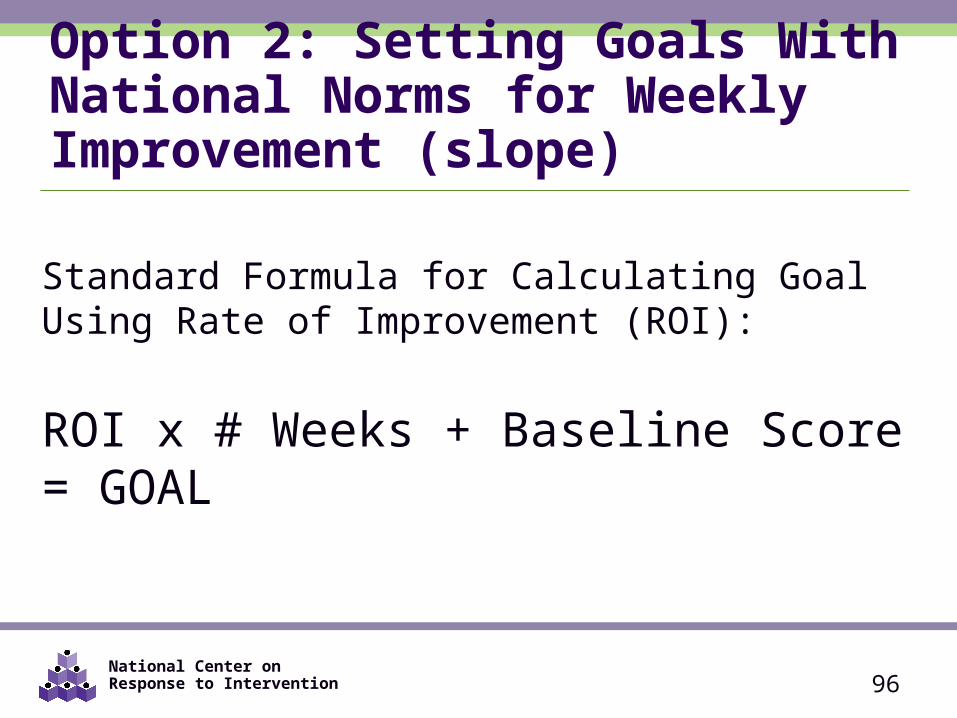
Option 2: Setting Goals With National Norms for Weekly Improvement (slope)
Standard Formula for Calculating Goal Using Rate of Improvement (ROI):
ROI x # Weeks + Baseline Score = GOAL
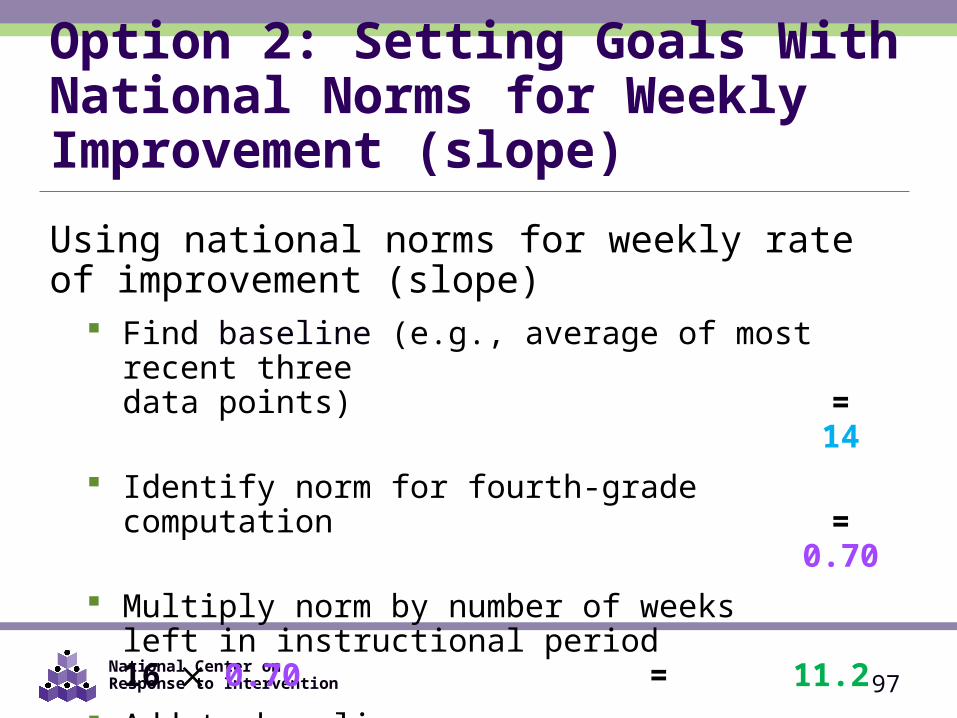
National Center on Response to Intervention
Option 2: Setting Goals With National Norms for Weekly Improvement (slope)
Using national norms for weekly rate of improvement (slope)
Find baseline (e.g., average of most recent three data points) =
14 Identify norm for fourth-grade computation =
0.70 Multiply norm by number of weeks
left in instructional period 16 0.70 =11.2
Add to baseline 11.2 + 14 =25.2
Set goal = end-of-year goal is 25.2 (or 25)
97
National Center on Response to Intervention 98
05
101520253035404550
1 2 3 4 5 6 7 8 9 10 11 12 13 14 15 16 17 18 19 20
Weeks of Instruction
Dig
its
Co
rrec
t
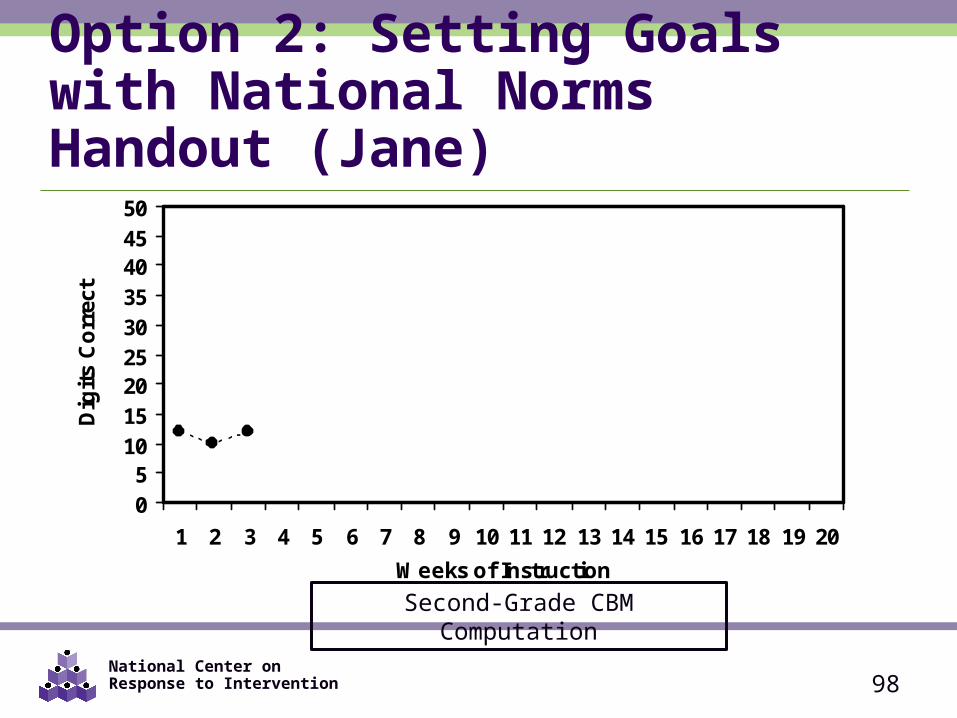
Option 2: Setting Goals with National Norms Handout (Jane)
Second-Grade CBM Computation
National Center on Response to Intervention 99
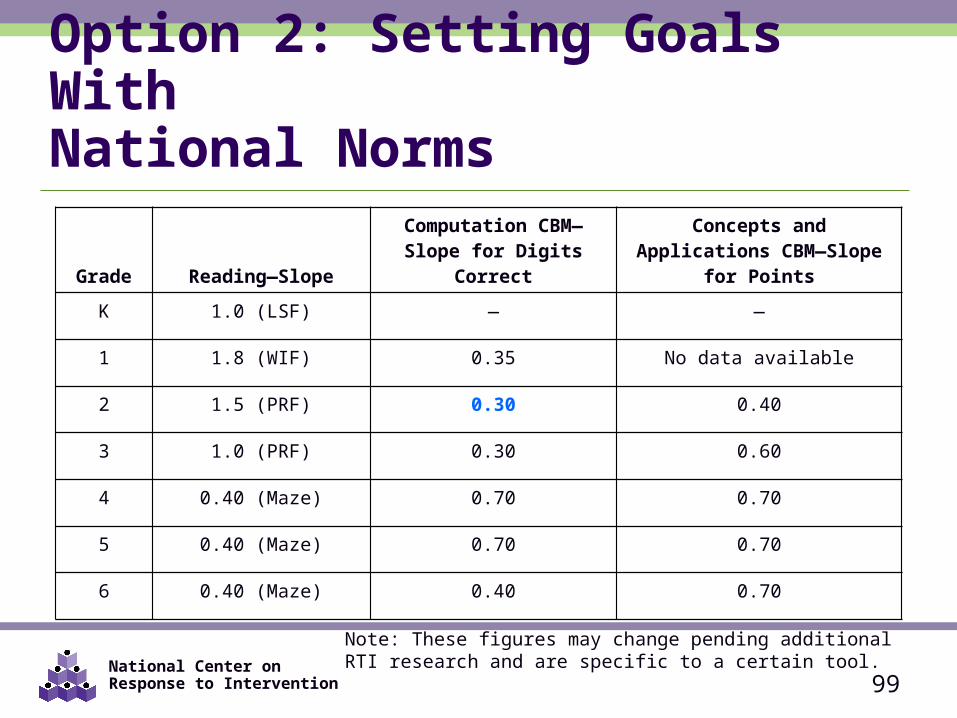
Option 2: Setting Goals WithNational Norms
Grade Reading—SlopeComputation CBM—
Slope for Digits CorrectConcepts and Applications
CBM—Slope for Points
K 1.0 (LSF) — —
1 1.8 (WIF) 0.35 No data available
2 1.5 (PRF) 0.30 0.40
3 1.0 (PRF) 0.30 0.60
4 0.40 (Maze) 0.70 0.70
5 0.40 (Maze) 0.70 0.70
6 0.40 (Maze) 0.40 0.70
Note: These figures may change pending additional RTI research and are specific to a certain tool.
National Center on Response to Intervention
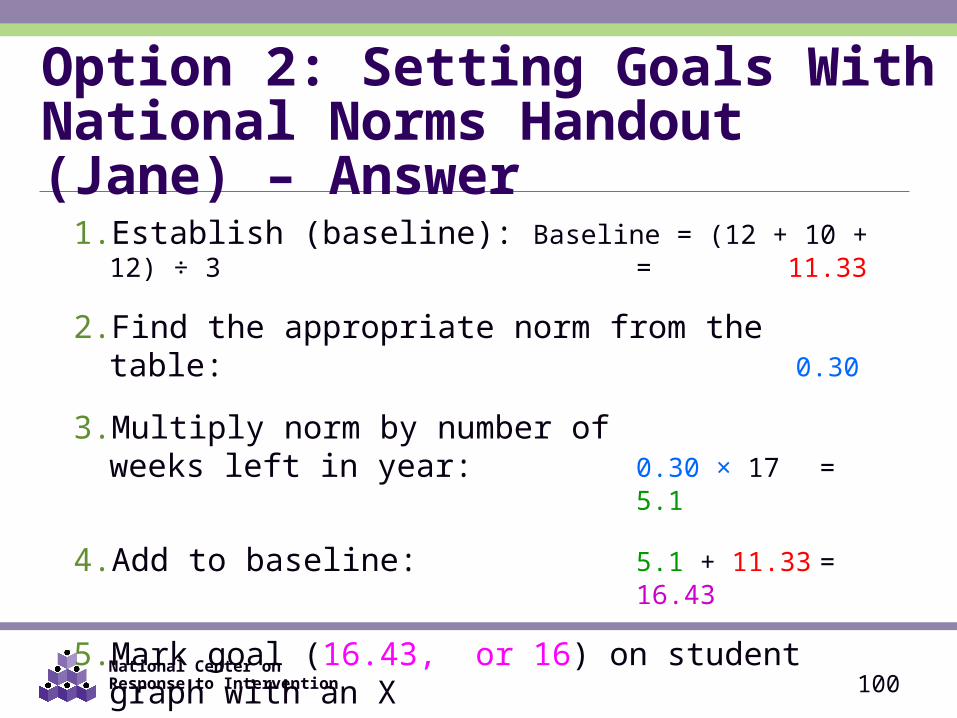
1. Establish (baseline): Baseline = (12 + 10 + 12) ÷ 3 = 11.33
2. Find the appropriate norm from the table:0.30
3. Multiply norm by number of weeks left in year: 0.30 × 17 =
5.1
4. Add to baseline: 5.1 + 11.33 =16.43
5. Mark goal (16.43, or 16) on student graph with an X
6. Draw goal line from baseline
Option 2: Setting Goals With National Norms Handout (Jane) – Answer
100
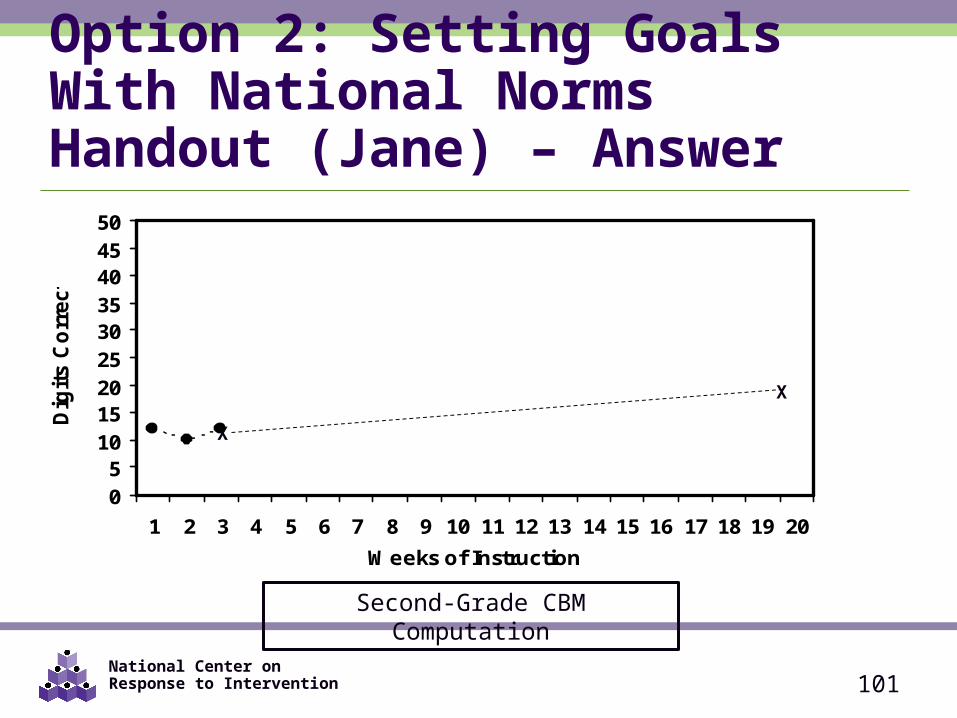
National Center on Response to Intervention 101
05
101520253035404550
1 2 3 4 5 6 7 8 9 10 11 12 13 14 15 16 17 18 19 20
Weeks of Instruction
Dig
its C
orr
ect
X
Option 2: Setting Goals With National Norms Handout (Jane) – Answer
X
Second-Grade CBM Computation
National Center on Response to Intervention
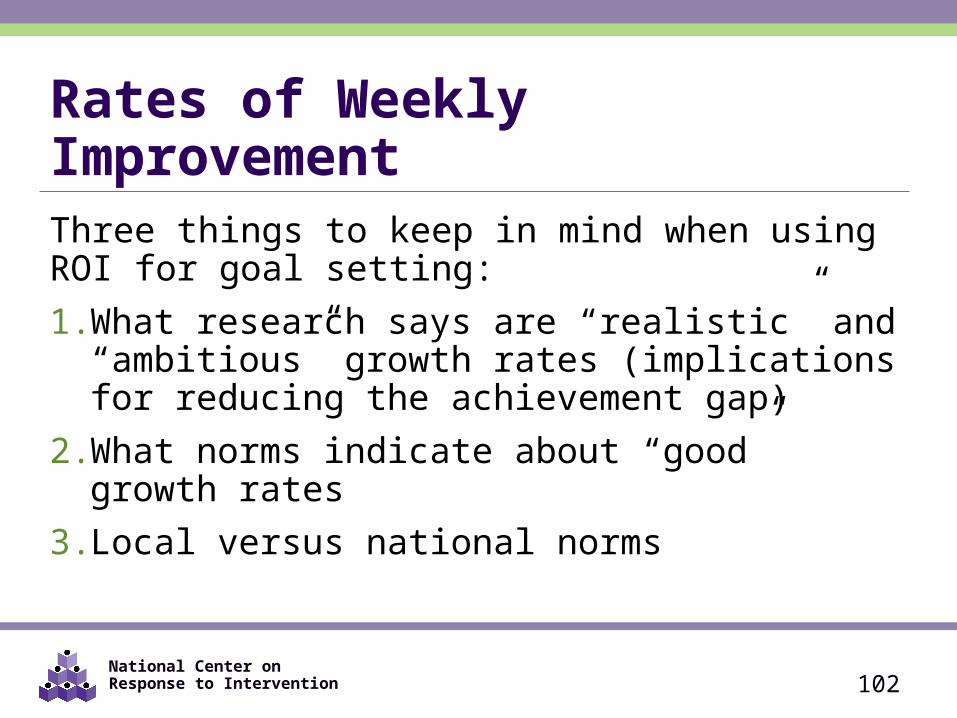
Rates of Weekly Improvement Three things to keep in mind when using ROI for goal setting:1. What research says are “realistic” and “ambitious”
growth rates (implications for reducing the achievement gap)
2. What norms indicate about “good” growth rates3. Local versus national norms
102
National Center on Response to Intervention 103
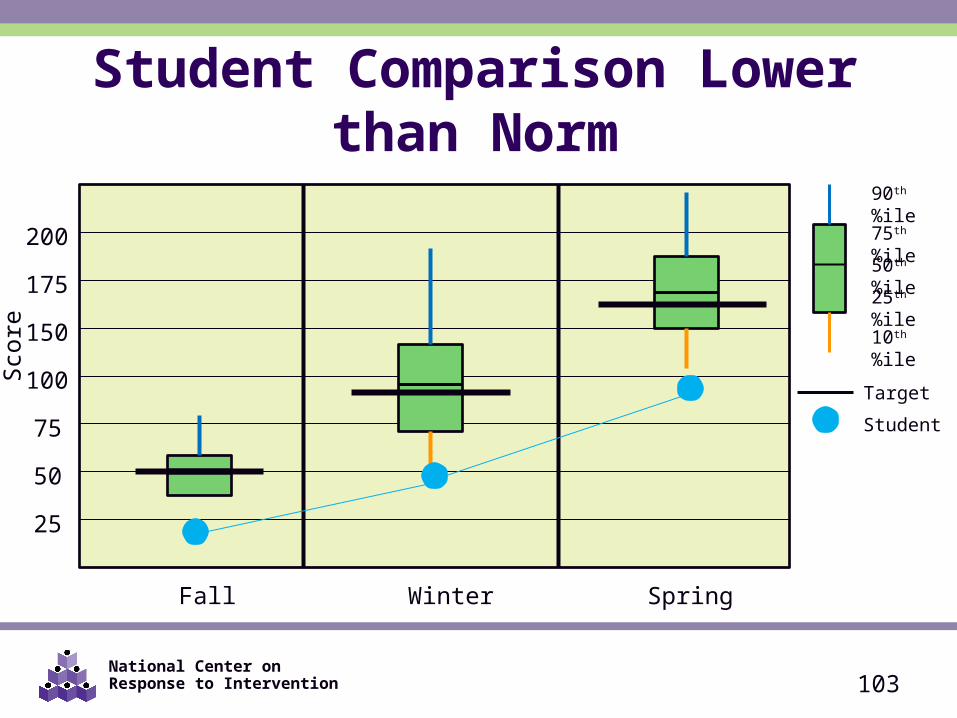
25
175
150
75
100
50
200
Fall SpringWinter
Student Comparison Lower than Norm90th%ile
75th%ile
50th%ile
25th%ile
10th %ile
Target
Scor
e
Student
National Center on Response to Intervention
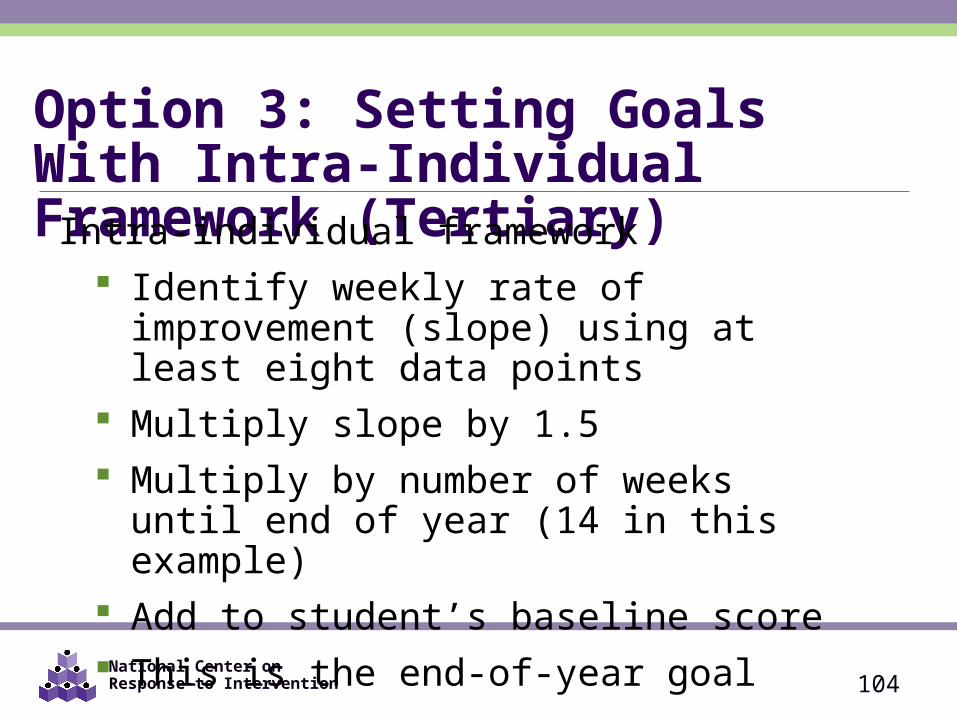
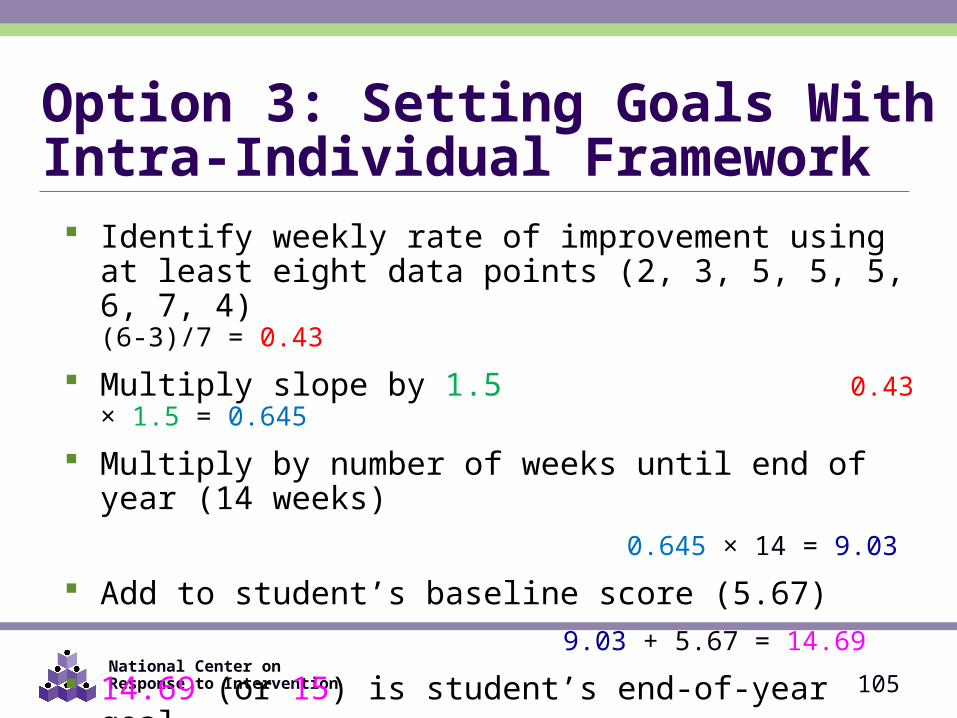
Option 3: Setting Goals With Intra-Individual Framework (Tertiary)
Intra-individual framework Identify weekly rate of improvement (slope)
using at least eight data points Multiply slope by 1.5 Multiply by number of weeks until end of year
(14 in this example) Add to student’s baseline score This is the end-of-year goal
104
National Center on Response to Intervention
Identify weekly rate of improvement using at least eight data points (2, 3, 5, 5, 5, 6, 7, 4) (6-3)/7 = 0.43
Multiply slope by 1.5 0.43 × 1.5 = 0.645
Multiply by number of weeks until end of year (14 weeks) 0.645 × 14 =
9.03
Add to student’s baseline score (5.67) 9.03 + 5.67 =
14.69
14.69 (or 15) is student’s end-of-year goal
Option 3: Setting Goals With Intra-Individual Framework
105
National Center on Response to Intervention
05
101520253035404550
1 2 3 4 5 6 7 8 9 10 11 12 13 14 15 16 17 18 19 20
Weeks of Instruction
Dig
its
Co
rrec
t
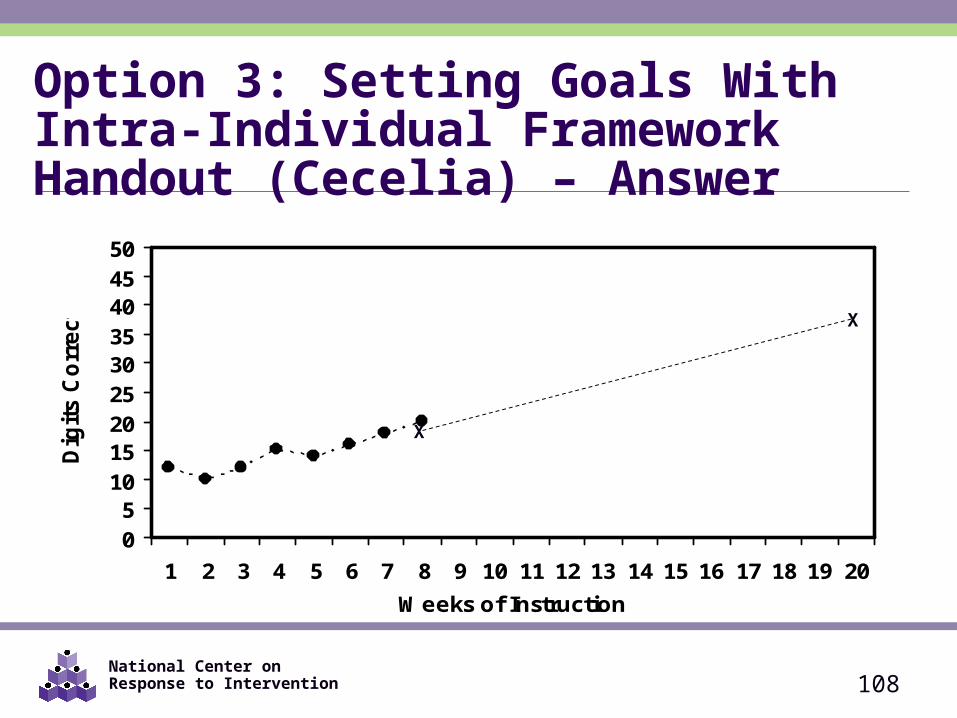
Option 3: Setting Goals With Intra-Individual Framework Handout (Cecelia)
106
X
Slope = (18 – 11) / 7 = 1.0
X
National Center on Response to Intervention
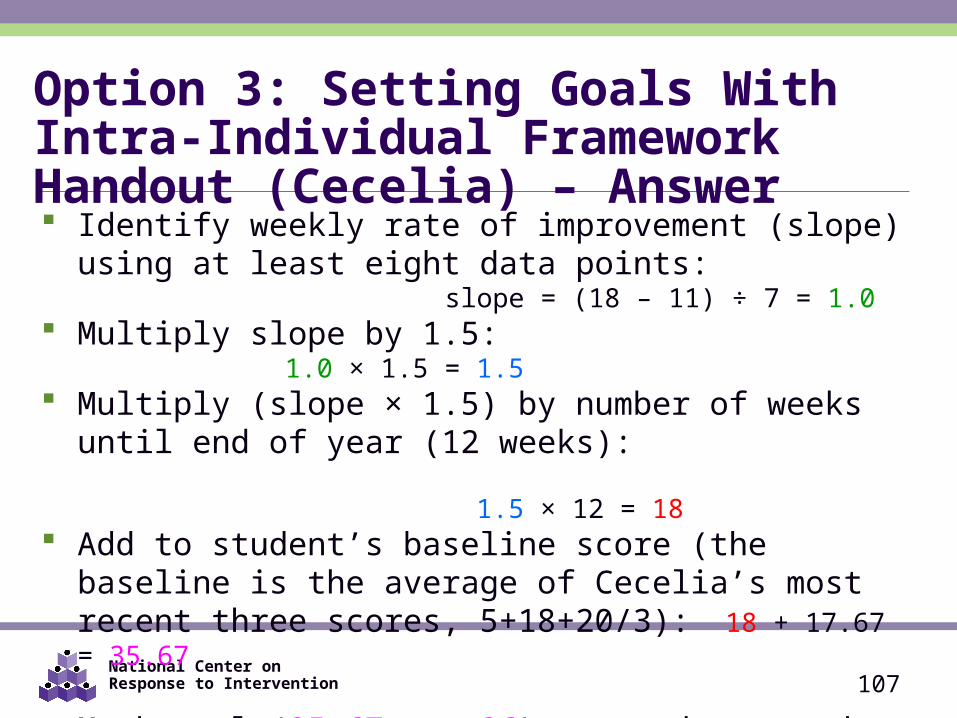
Identify weekly rate of improvement (slope) using at least eight data points: slope = (18 – 11) ÷ 7 = 1.0
Multiply slope by 1.5: 1.0 × 1.5 = 1.5 Multiply (slope × 1.5) by number of weeks until end of year (12
weeks): 1.5 × 12 = 18 Add to student’s baseline score (the baseline is the average of
Cecelia’s most recent three scores, 5+18+20/3): 18 + 17.67 = 35.67
Mark goal (35.67, or 36) on student graph with an X
Draw goal-line from baseline to X
Option 3: Setting Goals With Intra-Individual Framework Handout (Cecelia) – Answer
107
National Center on Response to Intervention
05
101520253035404550
1 2 3 4 5 6 7 8 9 10 11 12 13 14 15 16 17 18 19 20
Weeks of Instruction
Dig
its C
orr
ect
X
Option 3: Setting Goals With Intra-Individual Framework Handout (Cecelia) – Answer
108
X
National Center on Response to Intervention
Steps in the Decision Making Process1. Establish Data Review Team2. Establish Baseline Data and Progress Monitoring
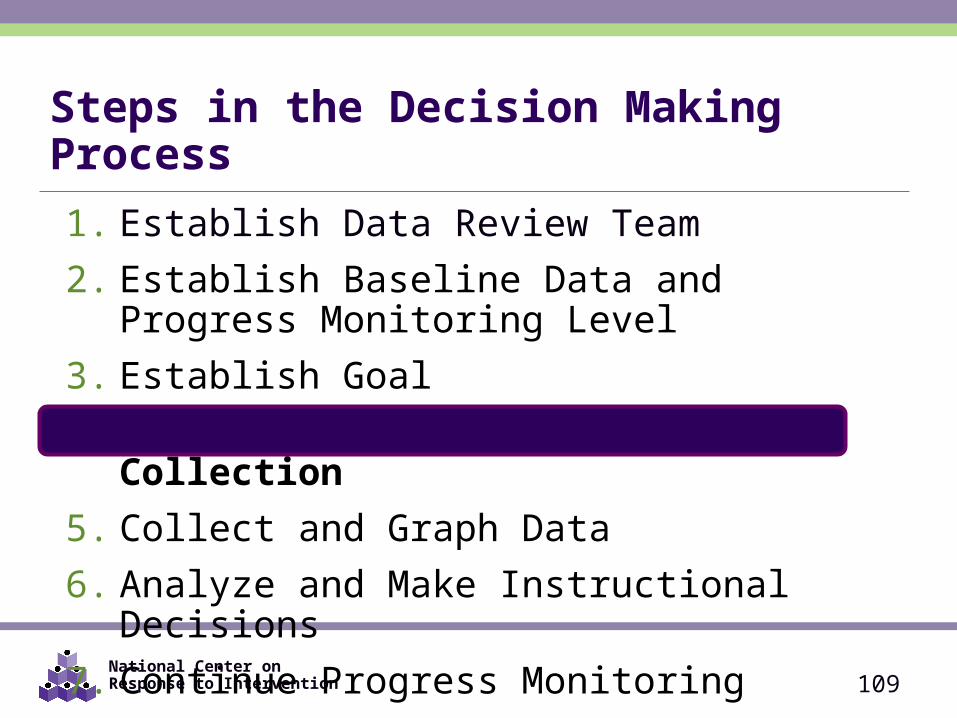
Level3. Establish Goal4. Determine Frequency of Data Collection5. Collect and Graph Data6. Analyze and Make Instructional Decisions7. Continue Progress Monitoring
109
National Center on Response to Intervention 110
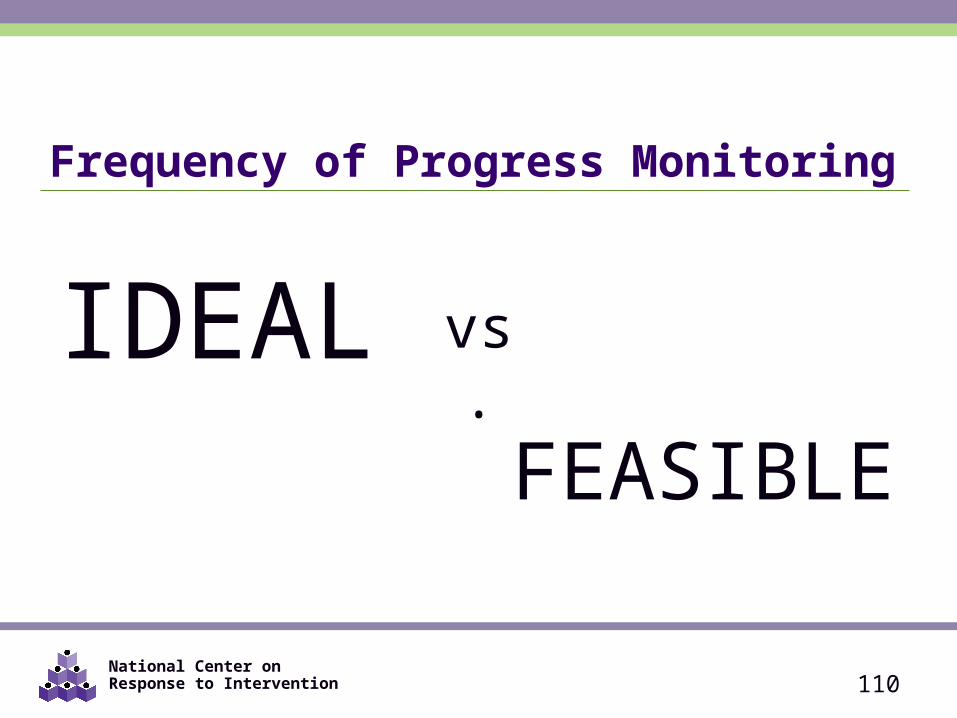
Frequency of Progress Monitoring
IDEAL
FEASIBLEvs.
National Center on Response to Intervention
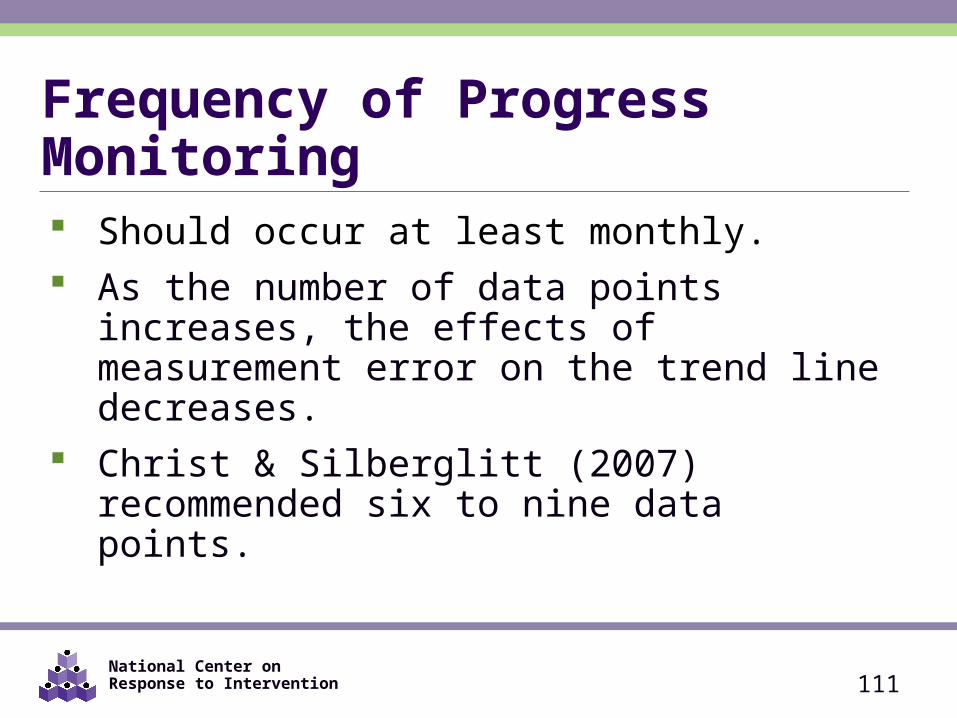
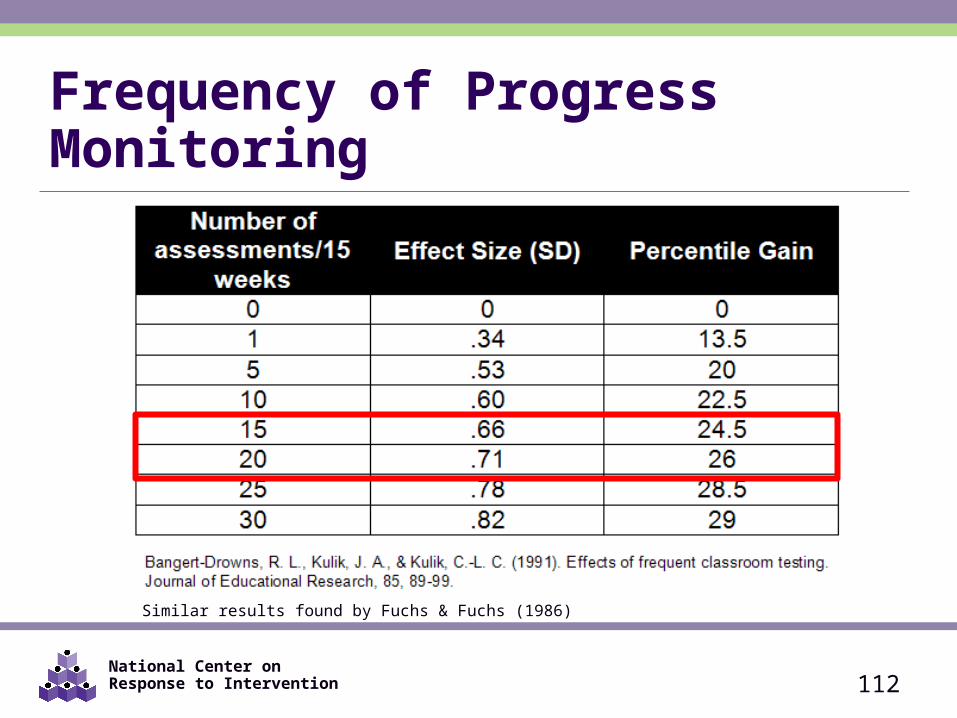
Frequency of Progress Monitoring Should occur at least monthly. As the number of data points increases, the effects
of measurement error on the trend line decreases. Christ & Silberglitt (2007) recommended six to nine
data points.
111
National Center on Response to Intervention
Frequency of Progress Monitoring
112
Similar results found by Fuchs & Fuchs (1986)
National Center on Response to Intervention
Steps in the Decision Making Process1. Establish Data Review Team2. Establish Baseline Data and Progress Monitoring
Level3. Establish Goal4. Determine Frequency of Data Collection5. Collect and Graph Data6. Analyze and Make Instructional Decisions7. Continue Progress Monitoring
113
National Center on Response to Intervention
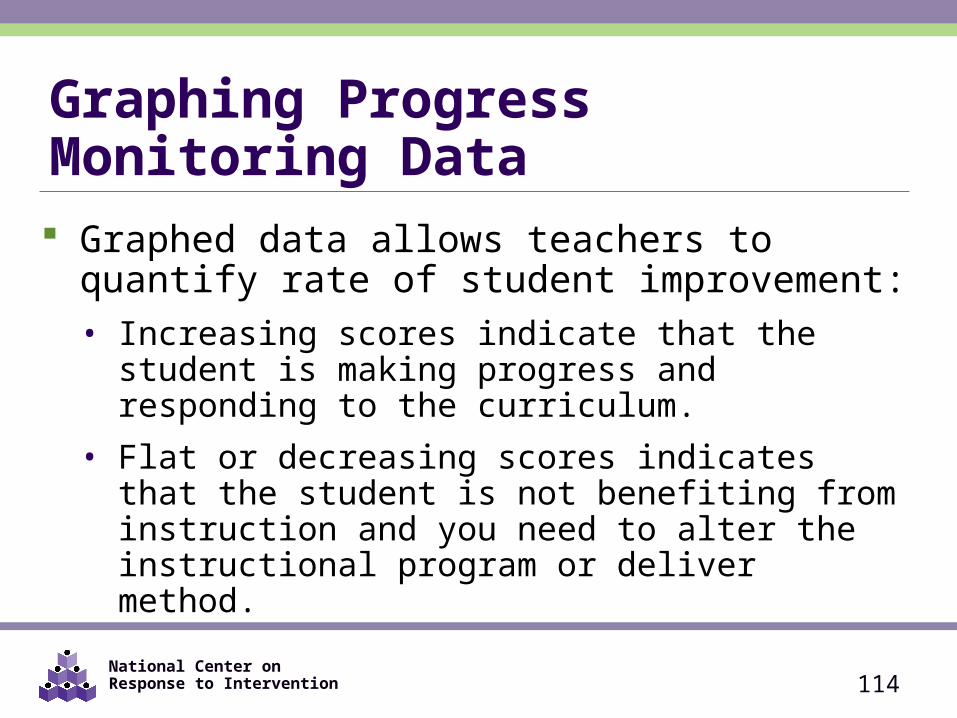
Graphing Progress Monitoring Data Graphed data allows teachers to quantify rate of
student improvement:• Increasing scores indicate that the student is making
progress and responding to the curriculum.• Flat or decreasing scores indicates that the student is not
benefiting from instruction and you need to alter the instructional program or deliver method.
114
National Center on Response to Intervention
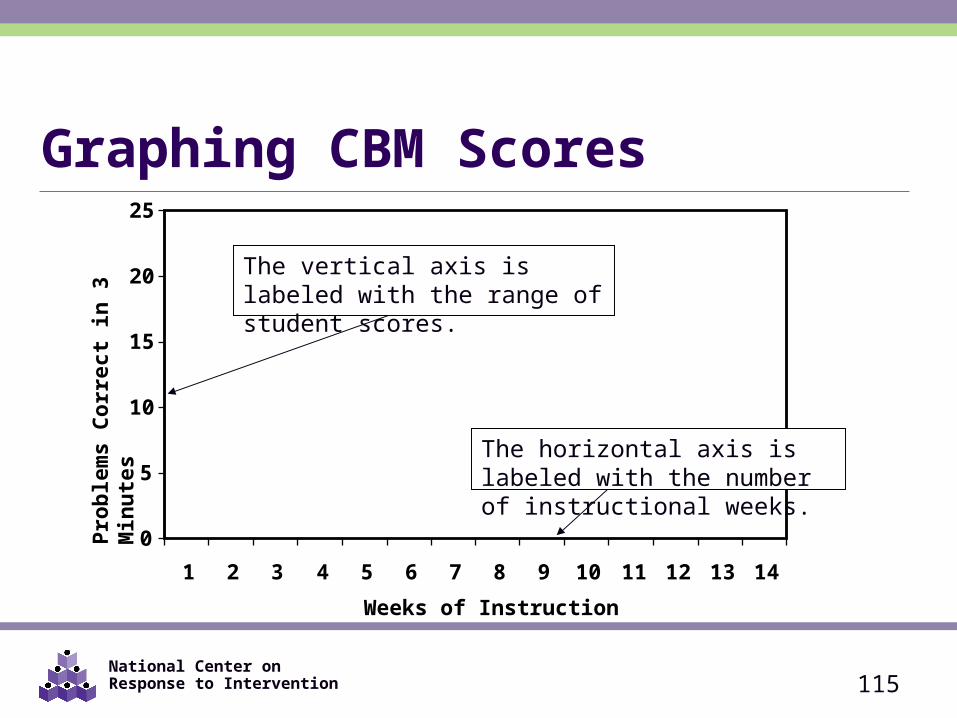
0
5
10
15
20
25
1 2 3 4 5 6 7 8 9 10 11 12 13 14
Weeks of Instruction
Pro
ble
ms
Co
rrec
t in
3 M
inu
tes
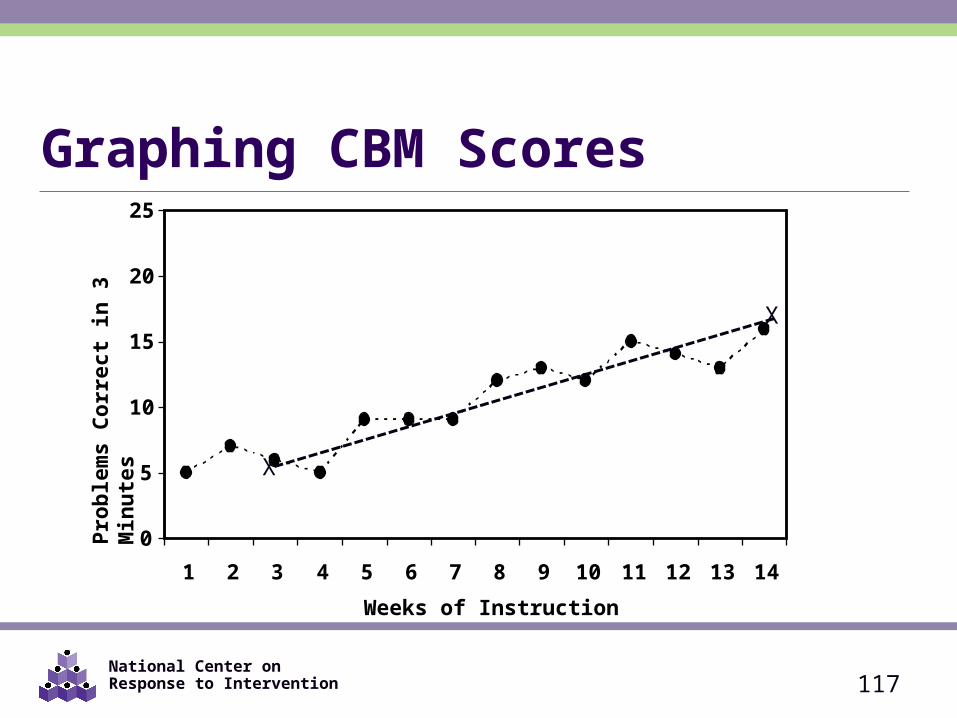
Graphing CBM Scores
115
The vertical axis is labeled with the range of student scores.
The horizontal axis is labeled with the number of instructional weeks.
National Center on Response to Intervention
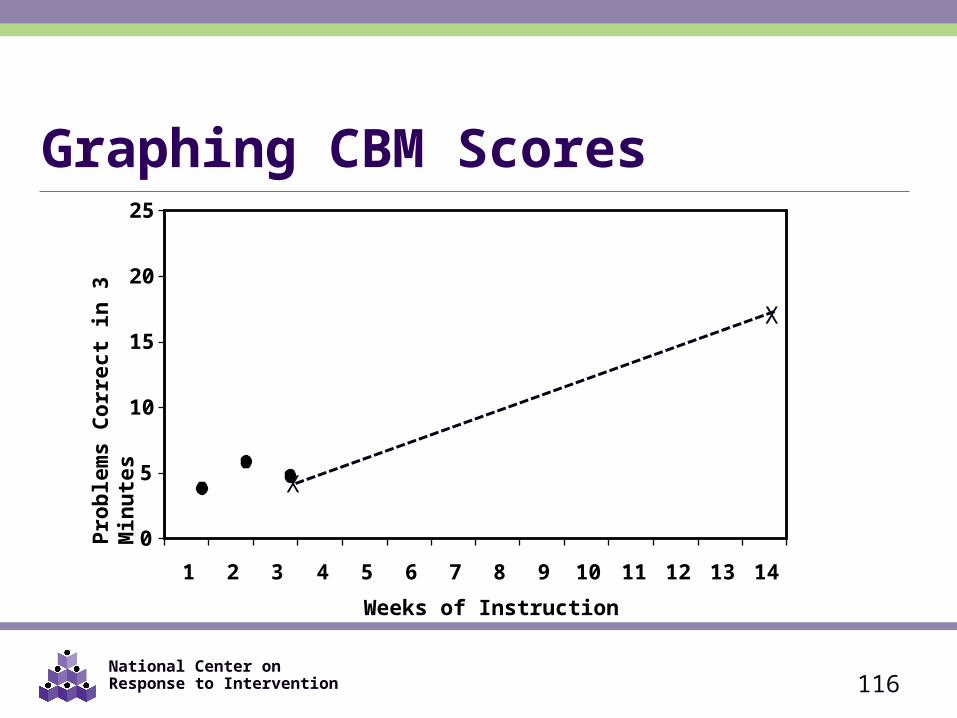
0
5
10
15
20
25
1 2 3 4 5 6 7 8 9 10 11 12 13 14
Weeks of Instruction
Pro
ble
ms
Co
rrec
t in
3 M
inu
tes
Graphing CBM Scores
116
X
X
National Center on Response to Intervention
0
5
10
15
20
25
1 2 3 4 5 6 7 8 9 10 11 12 13 14
Weeks of Instruction
Pro
ble
ms
Co
rrec
t in
3 M
inu
tes
Graphing CBM Scores
117
X
X
National Center on Response to Intervention
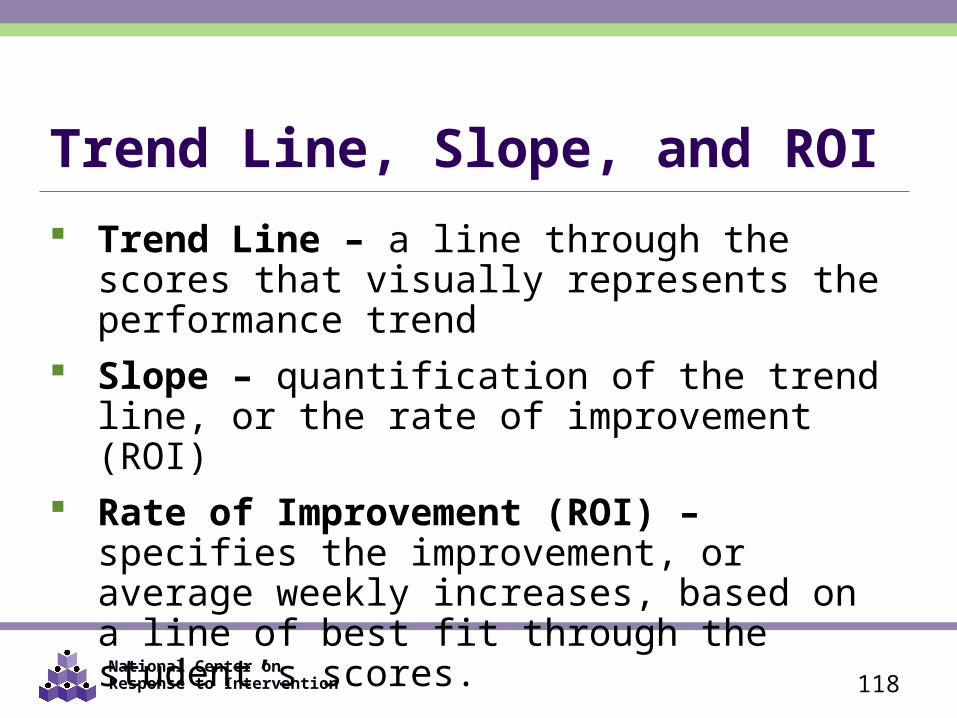
Trend Line, Slope, and ROI Trend Line – a line through the scores that visually
represents the performance trend Slope – quantification of the trend line, or the rate of
improvement (ROI) Rate of Improvement (ROI) – specifies the
improvement, or average weekly increases, based on a line of best fit through the student’s scores.
118
National Center on Response to Intervention
0
10
20
30
40
50
60
70
80
90
100
1 2 3 4 5 6 7 8 9 10 11 12 13 14
Weeks of Primary Prevention
WIF
: C
orr
ec
tly
Re
ad
Wo
rds
Pe
r M
inu
te
X
Xtrend line
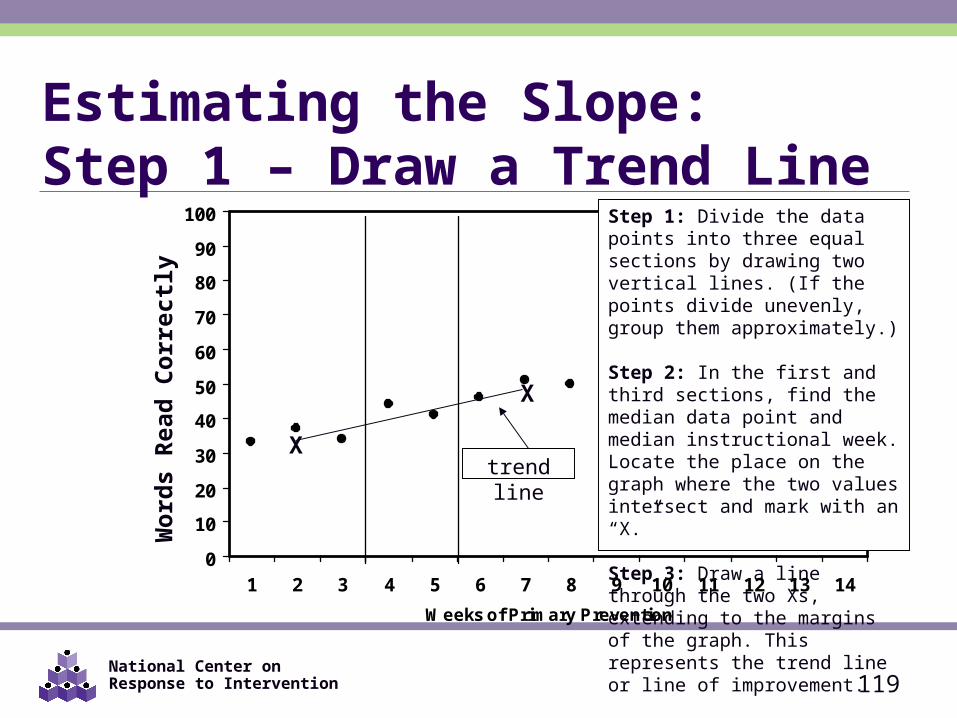
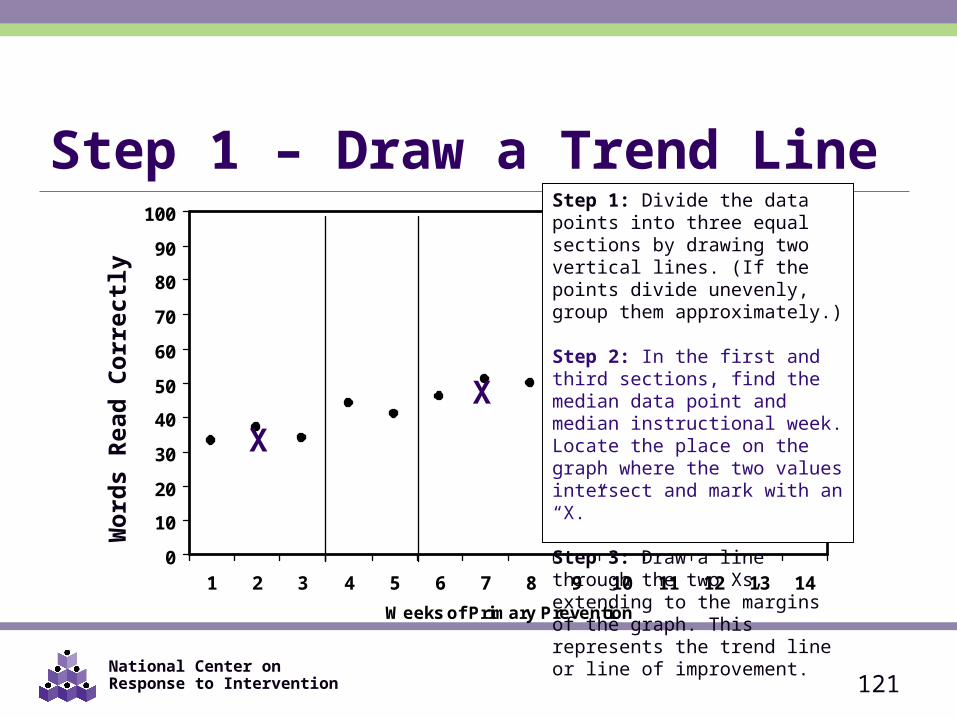
Step 1: Divide the data points into three equal sections by drawing two vertical lines. (If the points divide unevenly, group them approximately.)
Step 2: In the first and third sections, find the median data point and median instructional week. Locate the place on the graph where the two values intersect and mark with an “X.”
Step 3: Draw a line through the two Xs, extending to the margins of the graph. This represents the trend line or line of improvement.
Estimating the Slope: Step 1 – Draw a Trend Line
119
Wor
ds R
ead
Corr
ectly
National Center on Response to Intervention
0
10
20
30
40
50
60
70
80
90
100
1 2 3 4 5 6 7 8 9 10 11 12 13 14
Weeks of Primary Prevention
WIF
: C
orr
ect
ly R
ead
Wo
rds
Per
Min
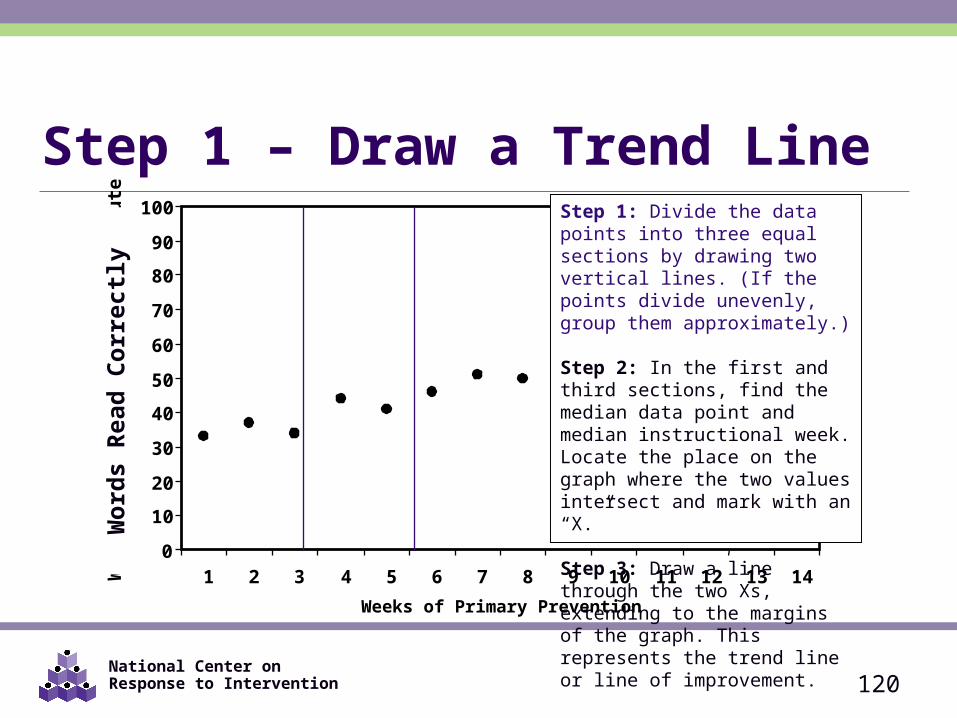
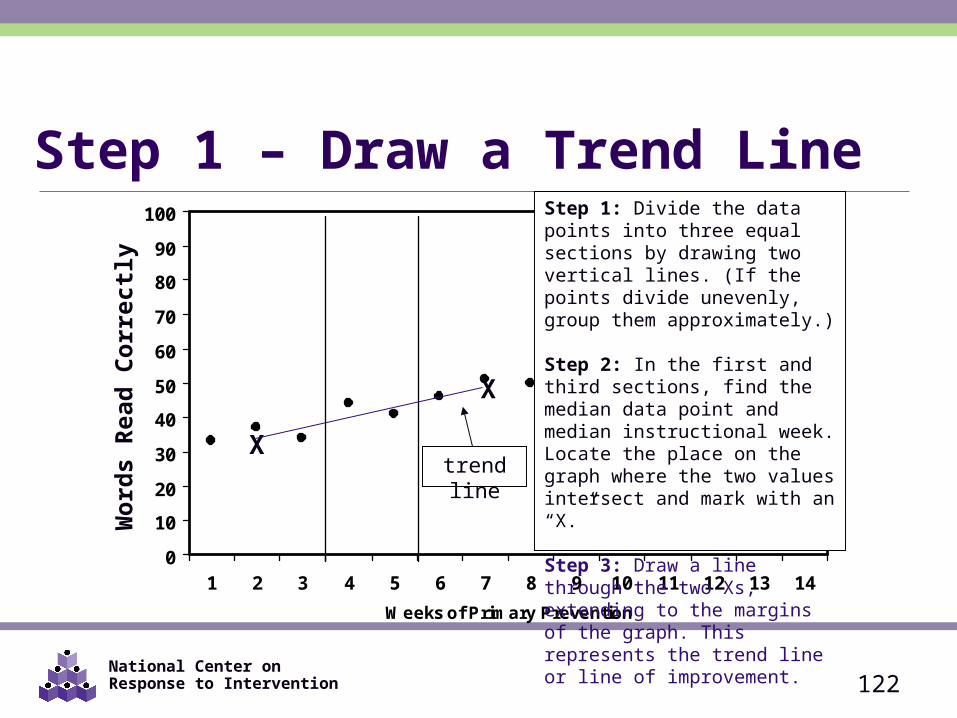
ute Step 1: Divide the data points into
three equal sections by drawing two vertical lines. (If the points divide unevenly, group them approximately.)
Step 2: In the first and third sections, find the median data point and median instructional week. Locate the place on the graph where the two values intersect and mark with an “X.”
Step 3: Draw a line through the two Xs, extending to the margins of the graph. This represents the trend line or line of improvement.
Step 1 – Draw a Trend Line
120
Wor
ds R
ead
Corr
ectly
National Center on Response to Intervention
0
10
20
30
40
50
60
70
80
90
100
1 2 3 4 5 6 7 8 9 10 11 12 13 14
Weeks of Primary Prevention
WIF
: C
orr
ec
tly
Re
ad
Wo
rds
Pe
r M
inu
te
X
X
Step 1: Divide the data points into three equal sections by drawing two vertical lines. (If the points divide unevenly, group them approximately.)
Step 2: In the first and third sections, find the median data point and median instructional week. Locate the place on the graph where the two values intersect and mark with an “X.”
Step 3: Draw a line through the two Xs, extending to the margins of the graph. This represents the trend line or line of improvement.
Step 1 – Draw a Trend Line
121
Wor
ds R
ead
Corr
ectly
National Center on Response to Intervention
0
10
20
30
40
50
60
70
80
90
100
1 2 3 4 5 6 7 8 9 10 11 12 13 14
Weeks of Primary Prevention
WIF
: C
orr
ec
tly
Re
ad
Wo
rds
Pe
r M
inu
te
X
Xtrend line
Step 1: Divide the data points into three equal sections by drawing two vertical lines. (If the points divide unevenly, group them approximately.)
Step 2: In the first and third sections, find the median data point and median instructional week. Locate the place on the graph where the two values intersect and mark with an “X.”
Step 3: Draw a line through the two Xs, extending to the margins of the graph. This represents the trend line or line of improvement.
Step 1 – Draw a Trend Line
122
Wor
ds R
ead
Corr
ectly
National Center on Response to Intervention
0
10
20
30
40
50
60
70
80
90
100
1 2 3 4 5 6 7 8 9 10 11 12 13 14
Weeks of Primary Prevention
WIF
: C
orr
ec
tly
Re
ad
Wo
rds
Pe
r M
inu
te
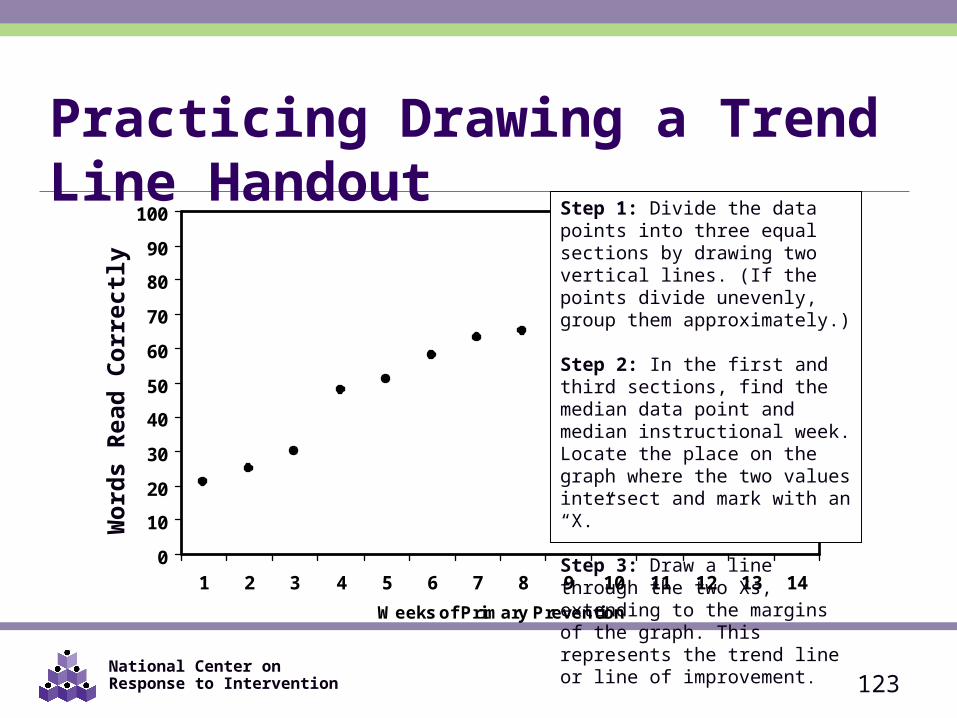
Step 1: Divide the data points into three equal sections by drawing two vertical lines. (If the points divide unevenly, group them approximately.)
Step 2: In the first and third sections, find the median data point and median instructional week. Locate the place on the graph where the two values intersect and mark with an “X.”
Step 3: Draw a line through the two Xs, extending to the margins of the graph. This represents the trend line or line of improvement.
Practicing Drawing a Trend Line Handout
123
Wor
ds R
ead
Corr
ectly
National Center on Response to Intervention
0
10
20
30
40
50
60
70
80
90
100
1 2 3 4 5 6 7 8 9 10 11 12 13 14
Weeks of Primary Prevention
WIF
: C
orr
ec
tly
Re
ad
Wo
rds
Pe
r M
inu
te
X
X
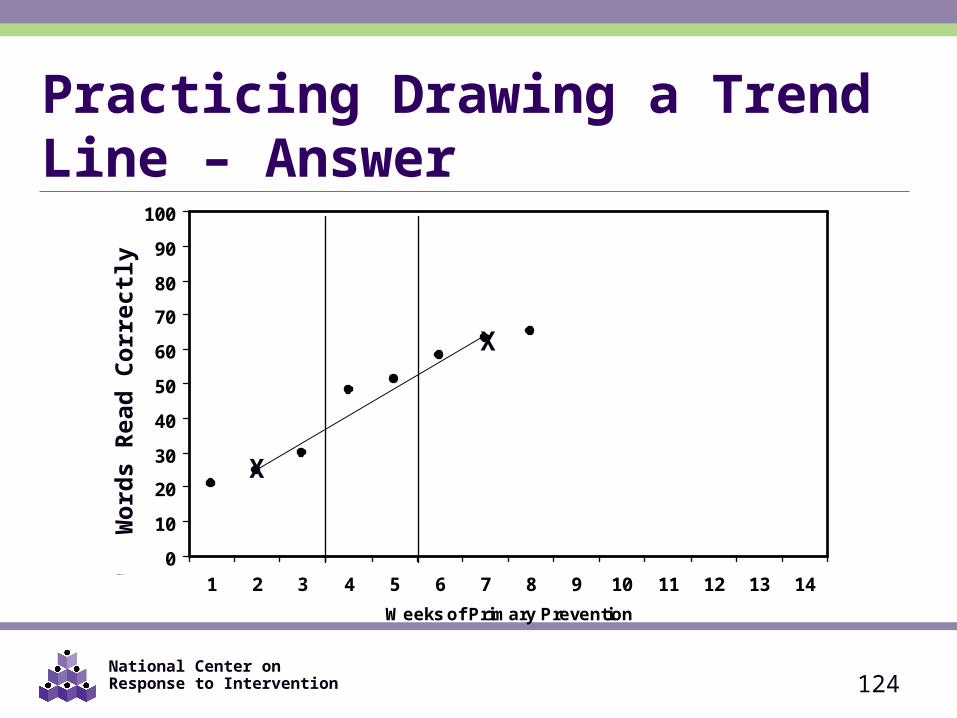
Practicing Drawing a Trend Line – Answer
124
Wor
ds R
ead
Corr
ectly
National Center on Response to Intervention
0
10
20
30
40
50
60
70
80
90
100
1 2 3 4 5 6 7 8 9 10 11 12 13 14
Weeks of Primary Prevention
WIF
: C
orr
ec
tly
Re
ad
Wo
rds
Pe
r M
inu
te
X
X
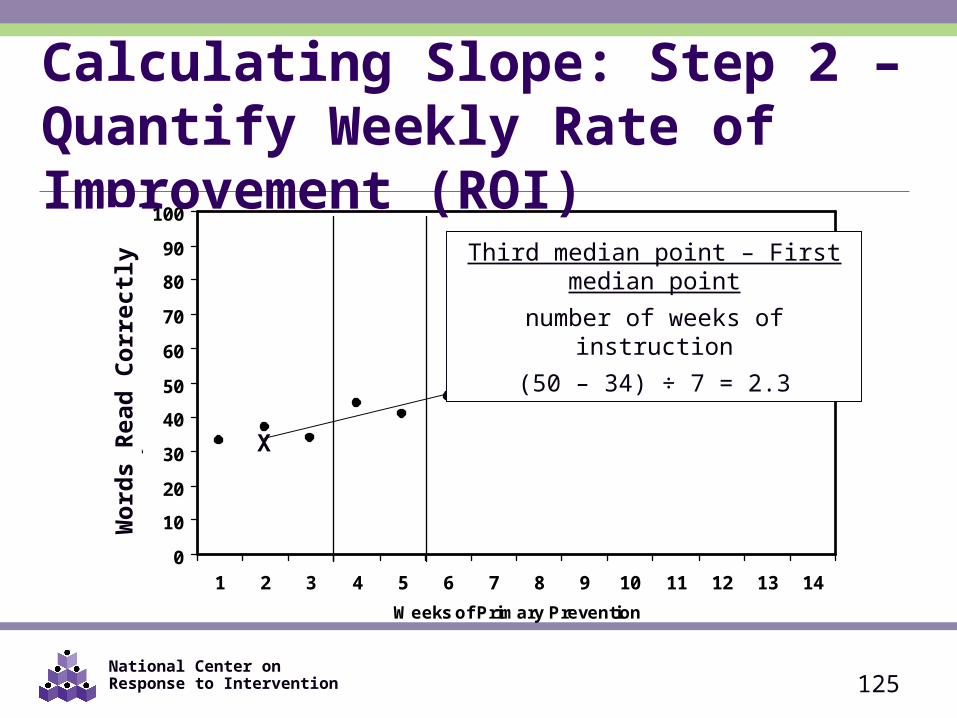
Third median point – First median point
number of weeks of instruction
(50 – 34) ÷ 7 = 2.3
Calculating Slope: Step 2 – Quantify Weekly Rate of Improvement (ROI)
125
Wor
ds R
ead
Corr
ectly
National Center on Response to Intervention
0
10
20
30
40
50
60
70
80
90
100
1 2 3 4 5 6 7 8 9 10 11 12 13 14
Weeks of Primary Prevention
WIF
: C
orr
ec
tly
Re
ad
Wo
rds
Pe
r M
inu
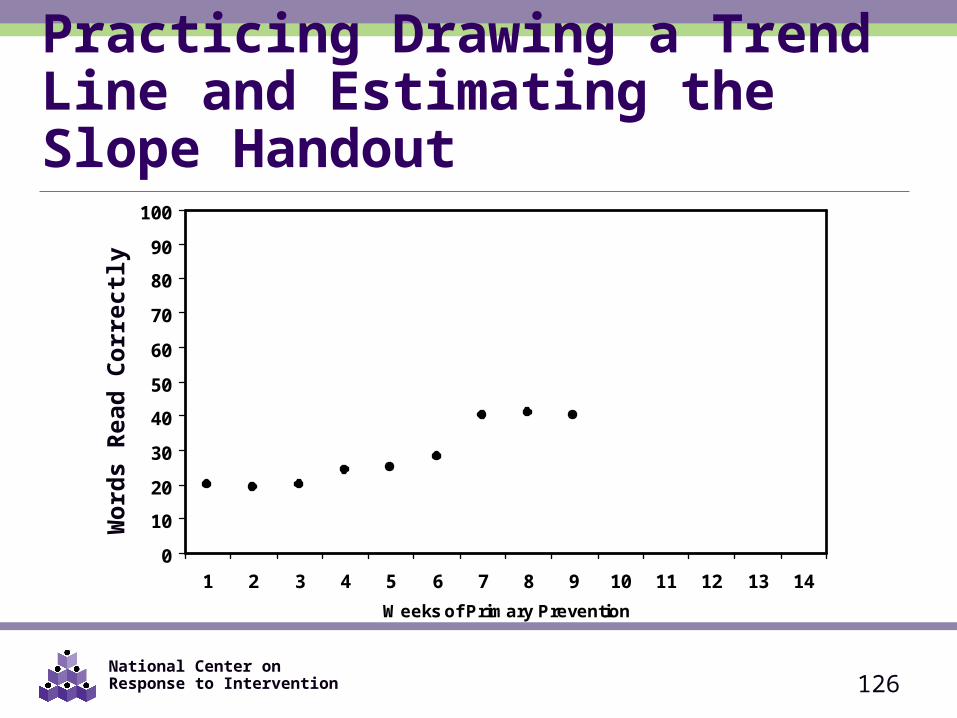
tePracticing Drawing a Trend Line and Estimating the Slope Handout
126
Wor
ds R
ead
Corr
ectly
National Center on Response to Intervention 127
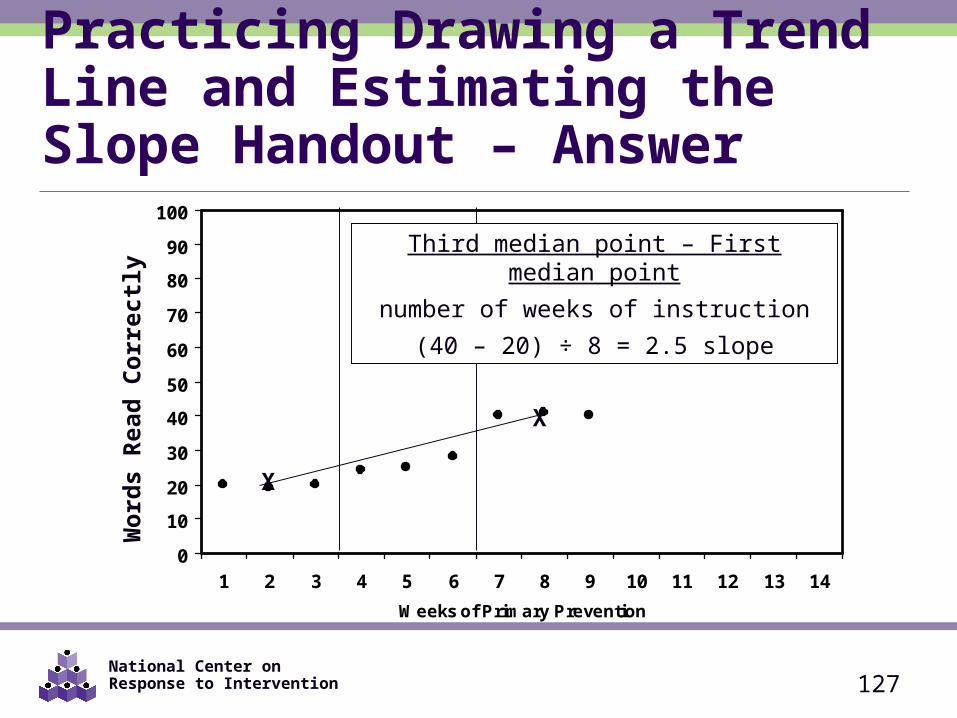
Practicing Drawing a Trend Line and Estimating the Slope Handout – Answer
0
10
20
30
40
50
60
70
80
90
100
1 2 3 4 5 6 7 8 9 10 11 12 13 14
Weeks of Primary Prevention
WIF
: C
orr
ec
tly
Re
ad
Wo
rds
Pe
r M
inu
te
X
X
Third median point – First median point
number of weeks of instruction
(40 – 20) ÷ 8 = 2.5 slope
Wor
ds R
ead
Corr
ectly
National Center on Response to Intervention 128
Sarah’s Graph: Primary Prevention
02468
101214161820
1 2 3 4 5 6 7 8 9 10 11 12 13 14 15 16 17 18 19 20
Weeks of Instruction
Wo
rds
Rea
d C
orr
ectl
y
X
X
Sarah’s slope:
(16 – 3) ÷ 7 = 1.9 slope
First-Grade CBM Word Identification Fluency
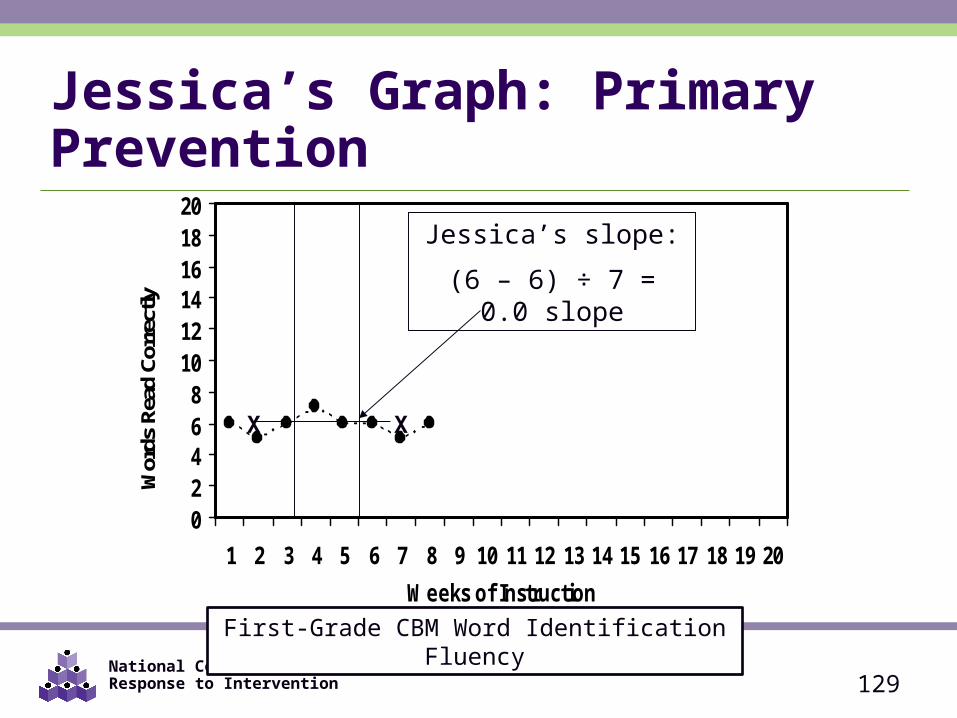
National Center on Response to Intervention 129
Jessica’s Graph: Primary Prevention
02468
101214161820
1 2 3 4 5 6 7 8 9 10 11 12 13 14 15 16 17 18 19 20
Weeks of Instruction
Wor
ds R
ead
Corr
ectly
X
Jessica’s slope:
(6 – 6) ÷ 7 = 0.0 slope
X
First-Grade CBM Word Identification Fluency
National Center on Response to Intervention 130
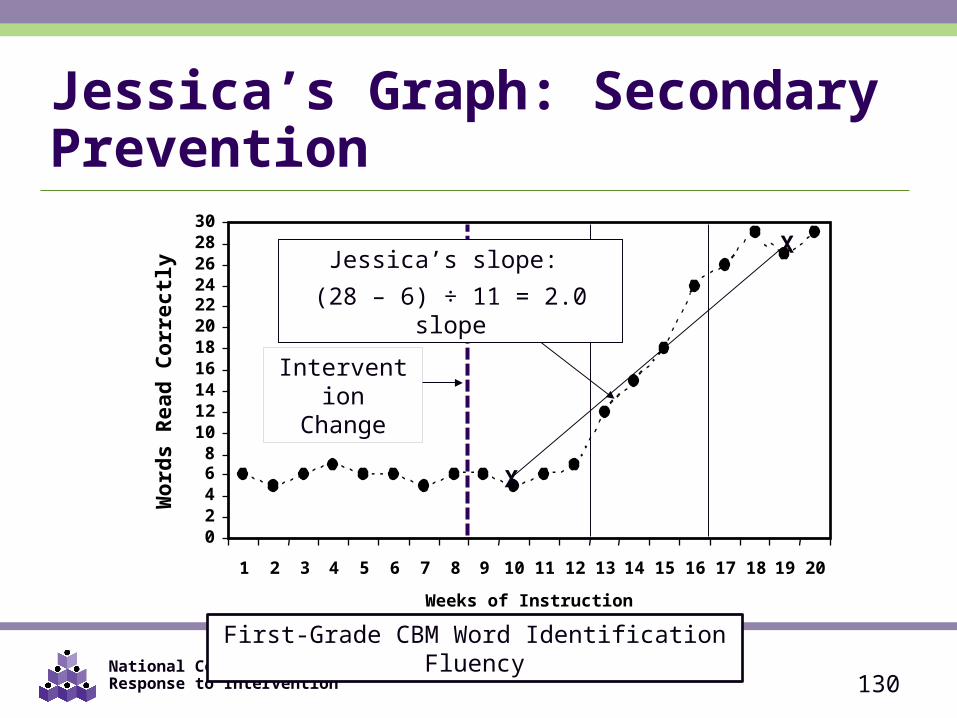
Jessica’s Graph: Secondary Prevention
XJessica’s slope:
(28 – 6) ÷ 11 = 2.0 slope
02468
1012141618202224262830
1 2 3 4 5 6 7 8 9 10 11 12 13 14 15 16 17 18 19 20
Weeks of Instruction
Wo
rds
Rea
d C
orr
ectl
y
X
InterventionChange
First-Grade CBM Word Identification Fluency
National Center on Response to Intervention
Steps in the Decision Making Process1. Establish Data Review Team2. Establish Baseline Data and Progress Monitoring
Level3. Establish Goal4. Determine Frequency of Data Collection5. Collect and Graph Data6. Analyze and Make Instructional Decisions7. Continue Progress Monitoring
131
National Center on Response to Intervention
Collecting Data Is Great… But using data to make instructional decisions is
most important. Select a decision making rule and stick with it.
132
National Center on Response to Intervention
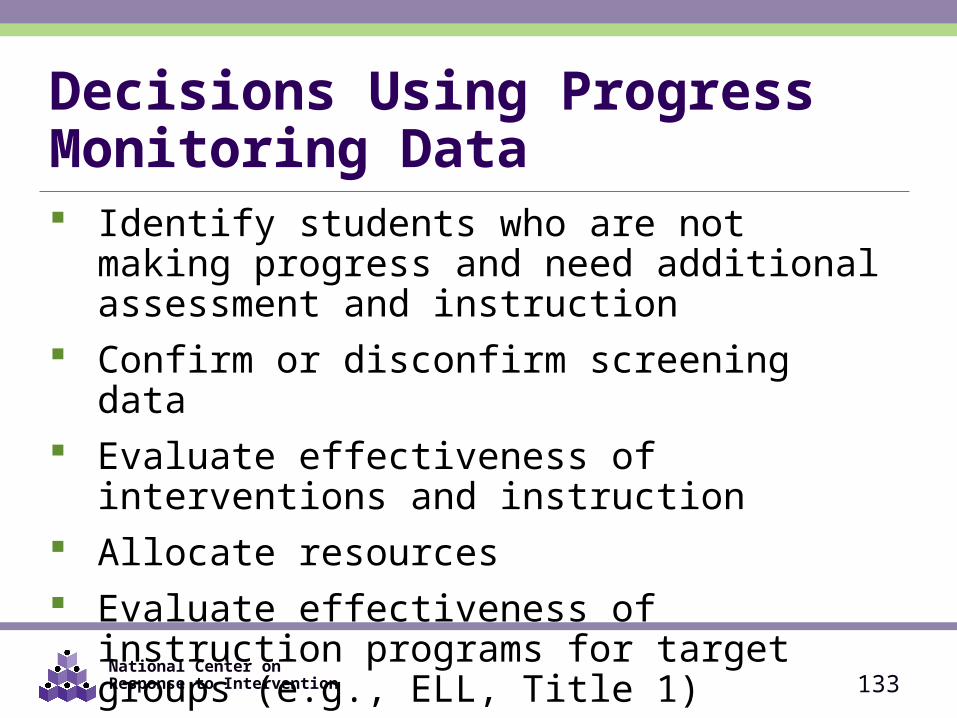
Decisions Using Progress Monitoring Data Identify students who are not making progress and
need additional assessment and instruction Confirm or disconfirm screening data Evaluate effectiveness of interventions and
instruction Allocate resources Evaluate effectiveness of instruction programs for
target groups (e.g., ELL, Title 1)
133
National Center on Response to Intervention
PM Instructional Decision Making Decision rules for PM graphs
• Based on four most recent consecutive scores• Based on student’s trend line
134
National Center on Response to Intervention
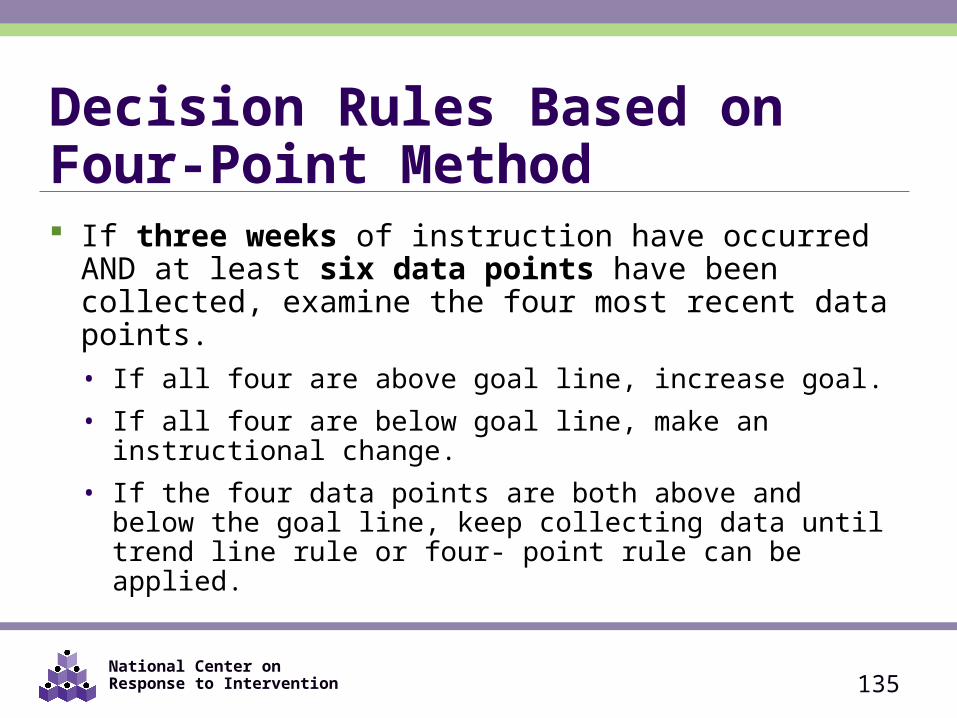
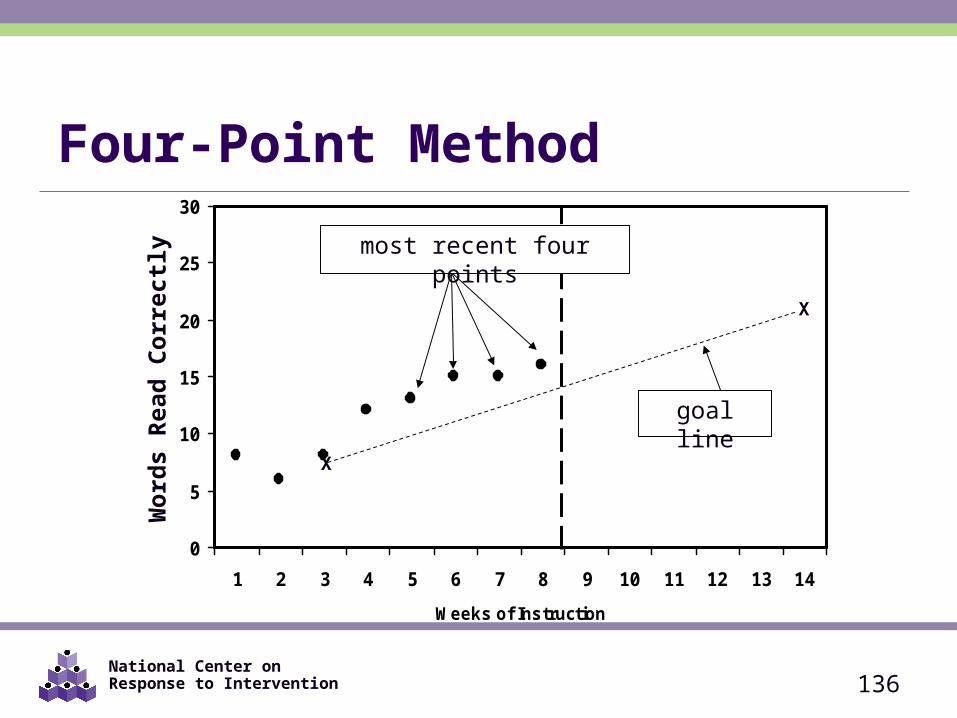
Decision Rules Based on Four-Point Method If three weeks of instruction have occurred AND at
least six data points have been collected, examine the four most recent data points.• If all four are above goal line, increase goal.• If all four are below goal line, make an instructional
change.• If the four data points are both above and below the goal
line, keep collecting data until trend line rule or four- point rule can be applied.
135
National Center on Response to Intervention
Four-Point Method
136
0
5
10
15
20
25
30
1 2 3 4 5 6 7 8 9 10 11 12 13 14
Weeks of Instruction
Pro
blem
s C
orre
ct in
7 M
inut
es
X
most recent four points
goal line
Wor
ds R
ead
Corr
ectly
X
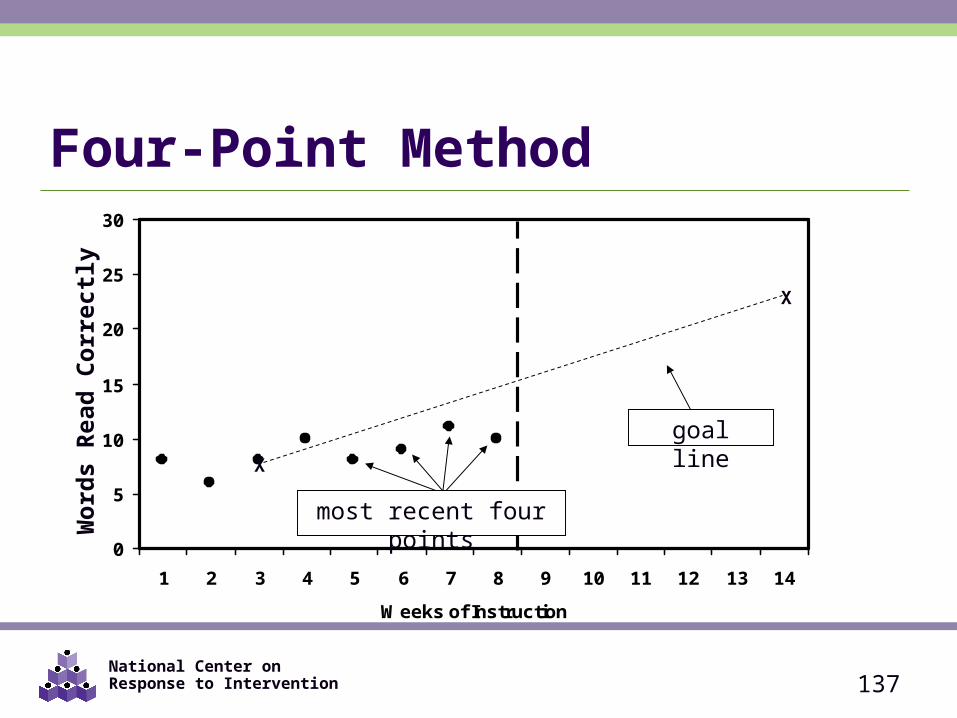
National Center on Response to Intervention 137
0
5
10
15
20
25
30
1 2 3 4 5 6 7 8 9 10 11 12 13 14
Weeks of Instruction
Pro
ble
ms
Co
rre
ct
in 7
Min
ute
s
X
goal line
most recent four points
Four-Point MethodW
ords
Rea
d Co
rrec
tly
X
National Center on Response to Intervention
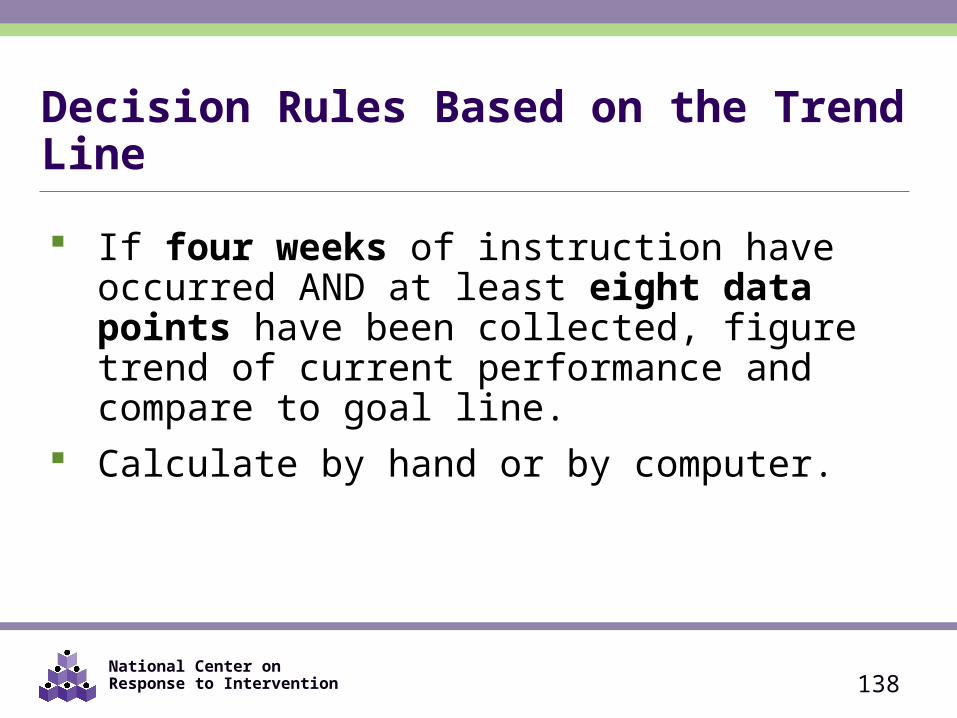
Decision Rules Based on the Trend Line
If four weeks of instruction have occurred AND at least eight data points have been collected, figure trend of current performance and compare to goal line.
Calculate by hand or by computer.
138
National Center on Response to Intervention
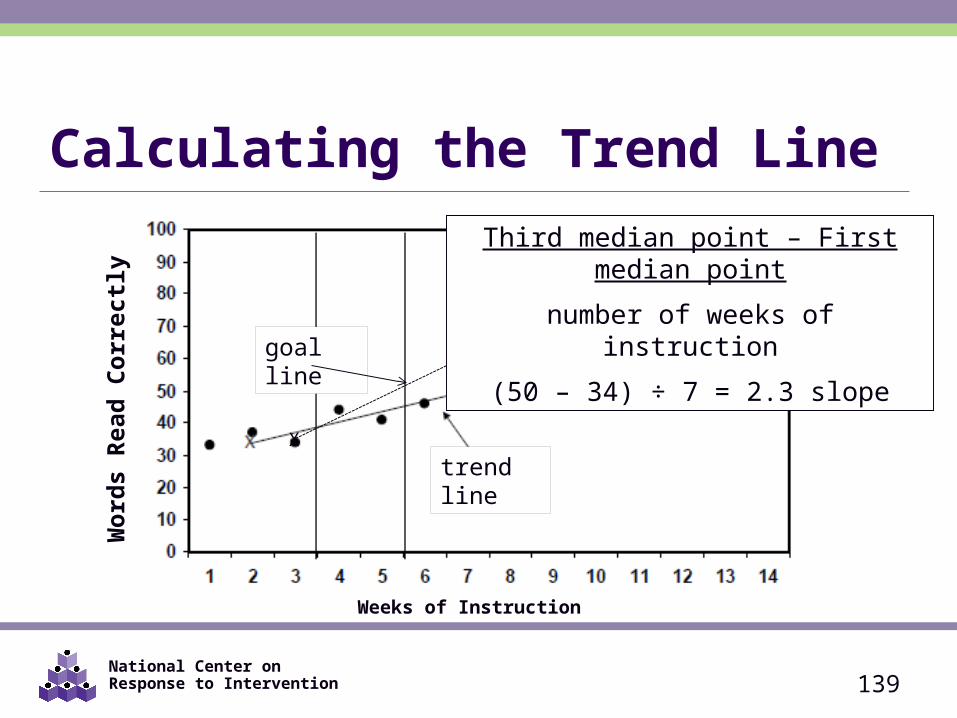
Calculating the Trend Line
139
Third median point – First median point
number of weeks of instruction
(50 – 34) ÷ 7 = 2.3 slope
trend line
Weeks of Instruction
Wor
ds R
ead
Corr
ectly
goal line
X
National Center on Response to Intervention
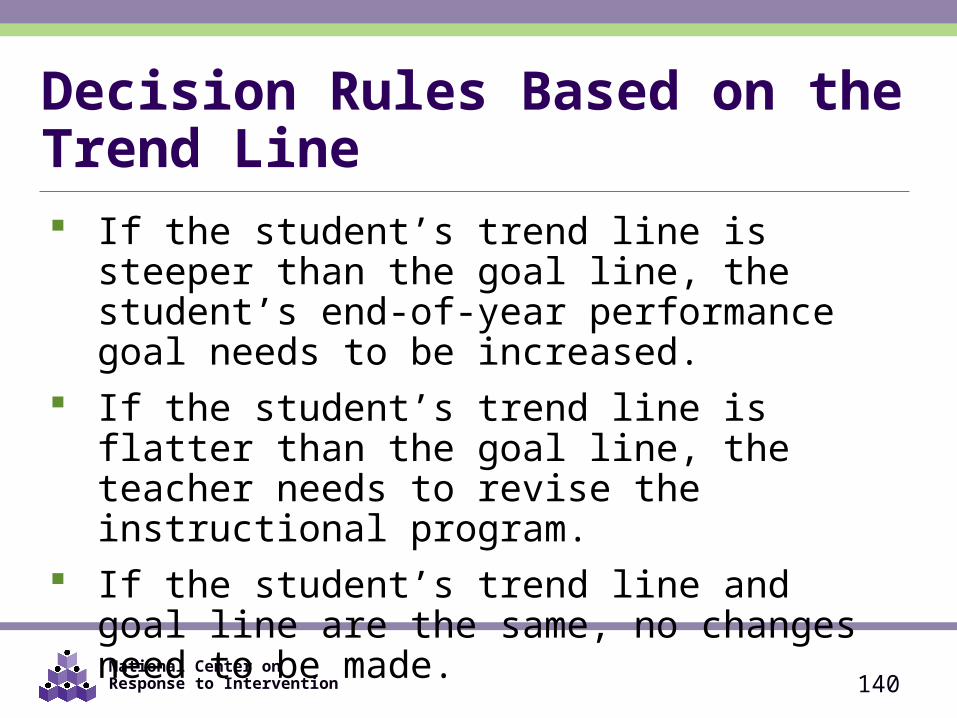
Decision Rules Based on the Trend Line If the student’s trend line is steeper than the goal
line, the student’s end-of-year performance goal needs to be increased.
If the student’s trend line is flatter than the goal line, the teacher needs to revise the instructional program.
If the student’s trend line and goal line are the same, no changes need to be made.
140
National Center on Response to Intervention
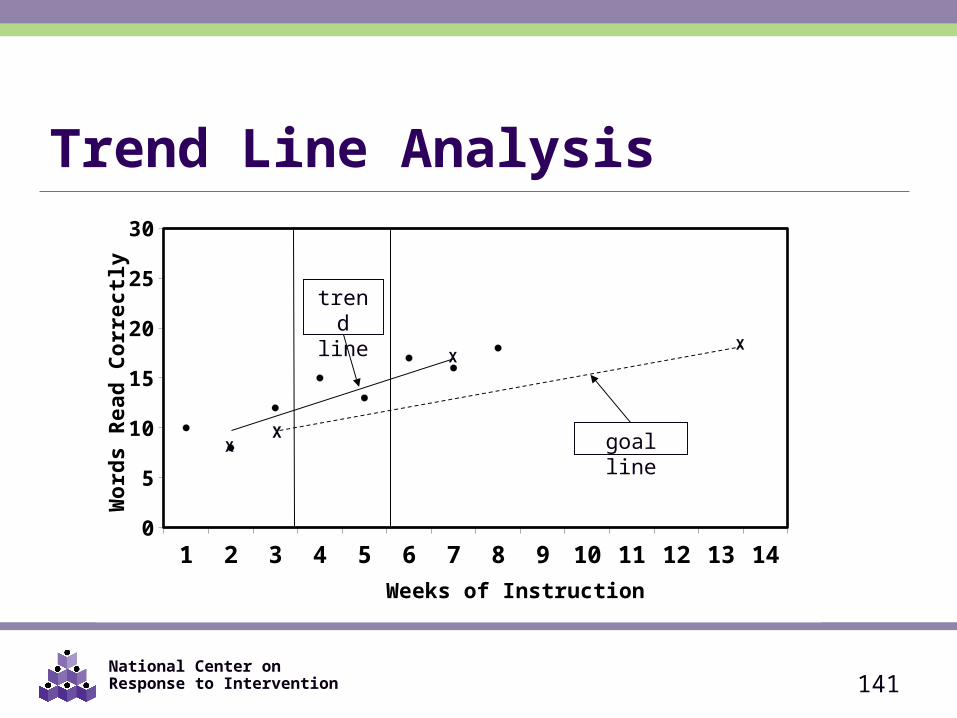
Trend Line Analysis
141
1 2 3 4 5 6 7 8 9 10 11 12 13 140
5
10
15
20
25
30
Weeks of Instruction
Wo
rds
Re
ad
Co
rre
ctl
y
X X
XX
goal line
trend line
National Center on Response to Intervention 142
0
5
10
15
20
25
30
1 2 3 4 5 6 7 8 9 10 11 12 13 14
Weeks of Instruction
Pro
ble
ms
Co
rre
ct
in 7
Min
ute
s
X
X
X
trend line
Trend Line Analysis
Xrevised
goal line
indicates change
Wor
ds R
ead
Corr
ectly
originalgoal line
X
X
National Center on Response to Intervention 143
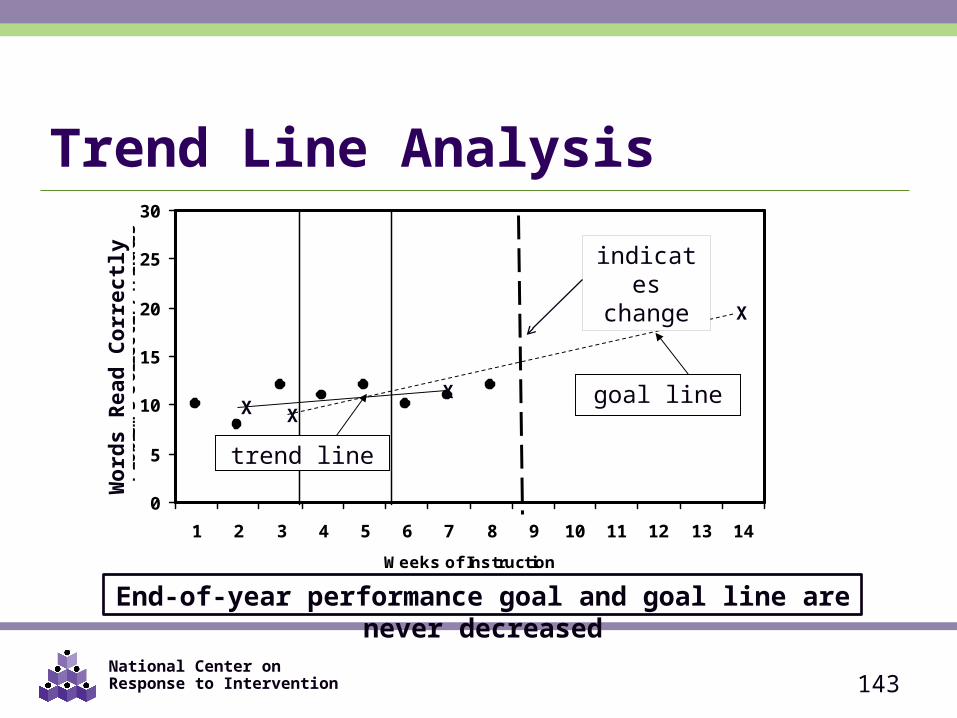
0
5
10
15
20
25
30
1 2 3 4 5 6 7 8 9 10 11 12 13 14
Weeks of Instruction
Pro
ble
ms
Co
rre
ct
in 7
Min
ute
s
XX
X
goal line
trend line
Trend Line Analysis
indicates change
End-of-year performance goal and goal line are never decreased
Wor
ds R
ead
Corr
ectly
X
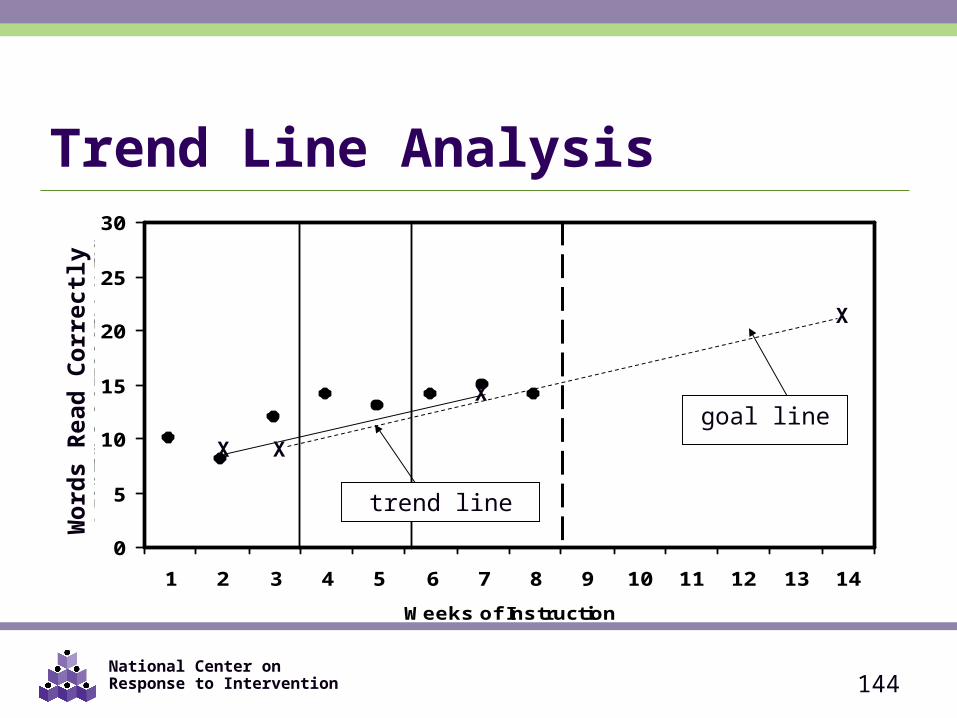
National Center on Response to Intervention 144
0
5
10
15
20
25
30
1 2 3 4 5 6 7 8 9 10 11 12 13 14
Weeks of Instruction
Pro
ble
ms
Co
rre
ct
in 7
Min
ute
s
X
X
X
trend line
goal line
Trend Line Analysis
Wor
ds R
ead
Corr
ectly
X
National Center on Response to Intervention
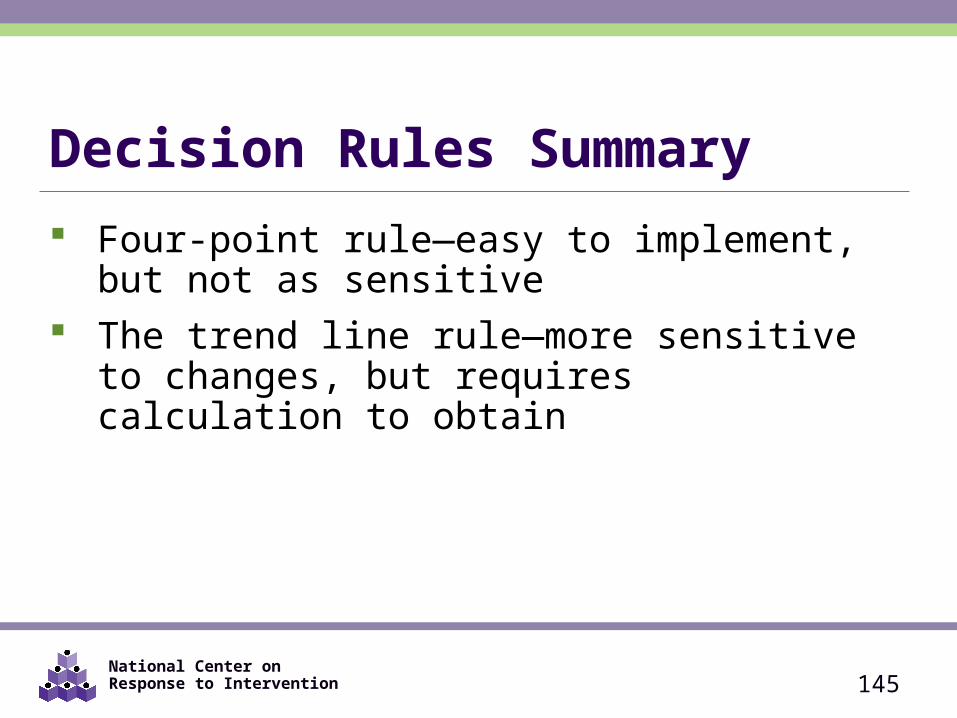
Decision Rules Summary Four-point rule—easy to implement, but not as
sensitive The trend line rule—more sensitive to changes, but
requires calculation to obtain
145
National Center on Response to Intervention 146
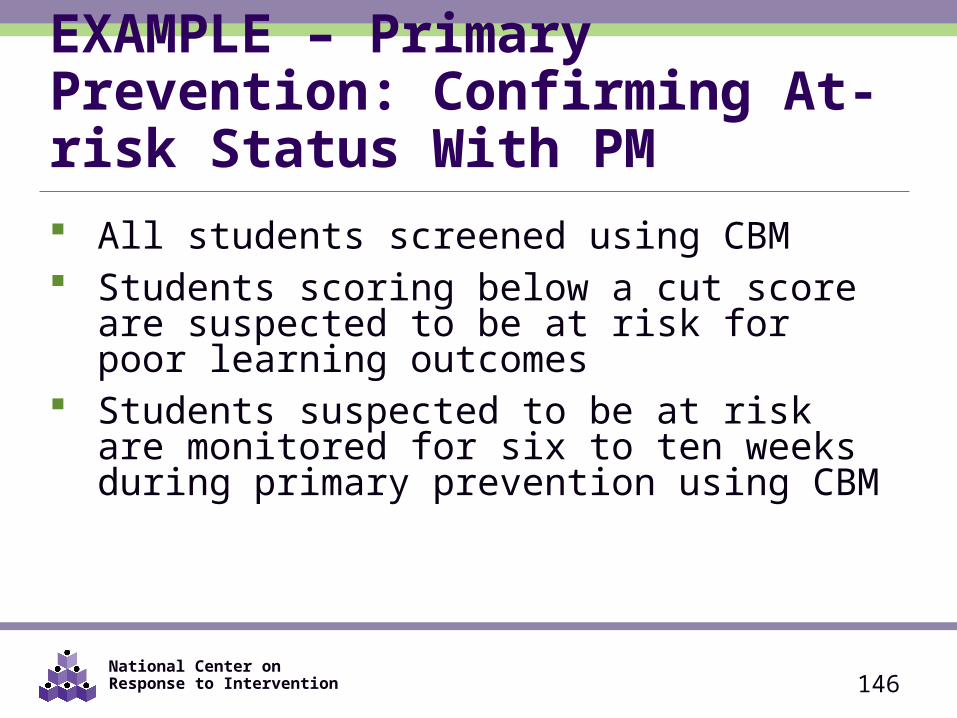
EXAMPLE – Primary Prevention: Confirming At-risk Status With PM All students screened using CBM Students scoring below a cut score are suspected to
be at risk for poor learning outcomes Students suspected to be at risk are monitored for
six to ten weeks during primary prevention using CBM
National Center on Response to Intervention 147
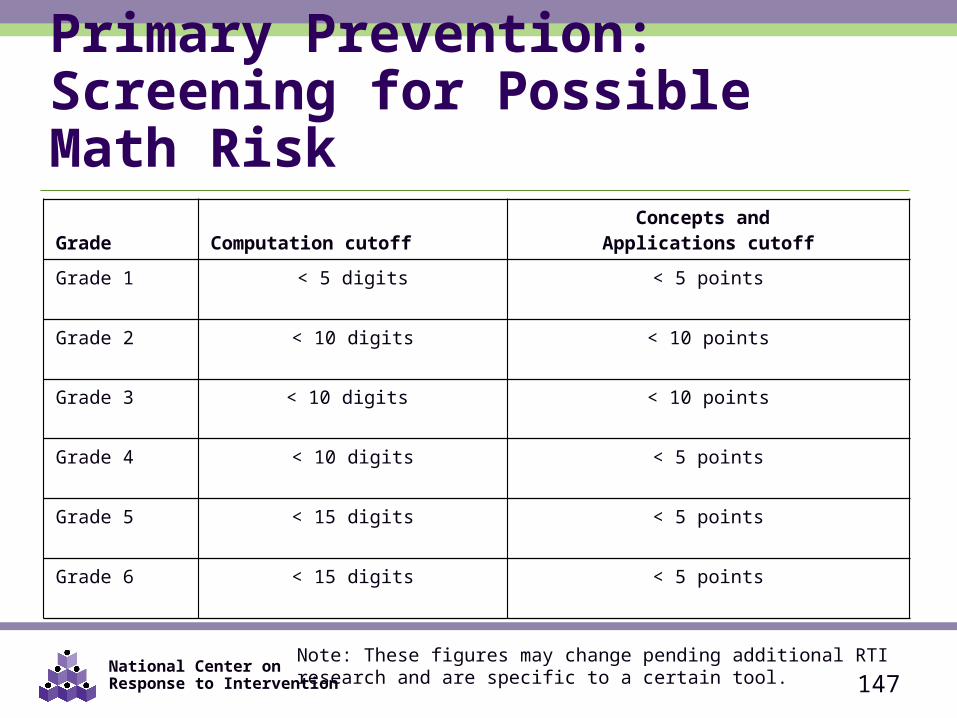
Primary Prevention:Screening for Possible Math Risk
Grade Computation cutoffConcepts and
Applications cutoff
Grade 1 < 5 digits < 5 points
Grade 2 < 10 digits < 10 points
Grade 3 < 10 digits < 10 points
Grade 4 < 10 digits < 5 points
Grade 5 < 15 digits < 5 points
Grade 6 < 15 digits < 5 points
Note: These figures may change pending additional RTI research and are specific to a certain tool.
National Center on Response to Intervention 148
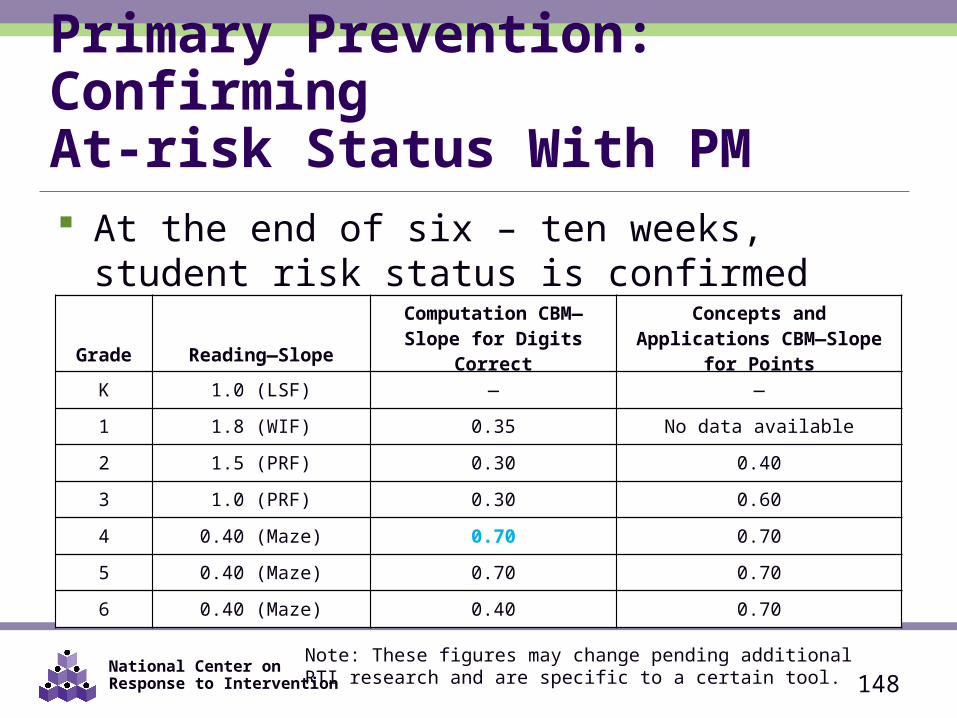
Primary Prevention: Confirming At-risk Status With PM At the end of six – ten weeks, student risk status is
confirmed or disconfirmed.
Note: These figures may change pending additional RTI research and are specific to a certain tool.
Grade Reading—SlopeComputation CBM—
Slope for Digits CorrectConcepts and Applications
CBM—Slope for Points
K 1.0 (LSF) — —
1 1.8 (WIF) 0.35 No data available
2 1.5 (PRF) 0.30 0.40
3 1.0 (PRF) 0.30 0.60
4 0.40 (Maze) 0.70 0.70
5 0.40 (Maze) 0.70 0.70
6 0.40 (Maze) 0.40 0.70
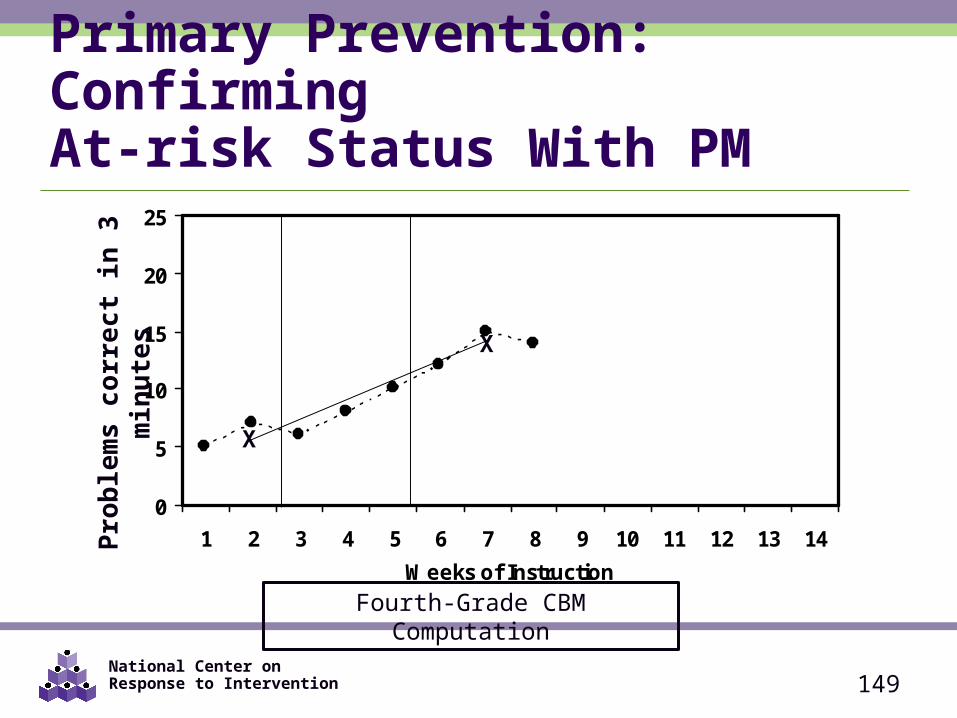
National Center on Response to Intervention 149
Primary Prevention: Confirming At-risk Status With PM
0
5
10
15
20
25
1 2 3 4 5 6 7 8 9 10 11 12 13 14
Weeks of Instruction
Dig
its
Co
rrec
t in
3 M
inu
tes
X
X
Prob
lem
s co
rrec
t in
3 m
inut
es
Fourth-Grade CBM Computation
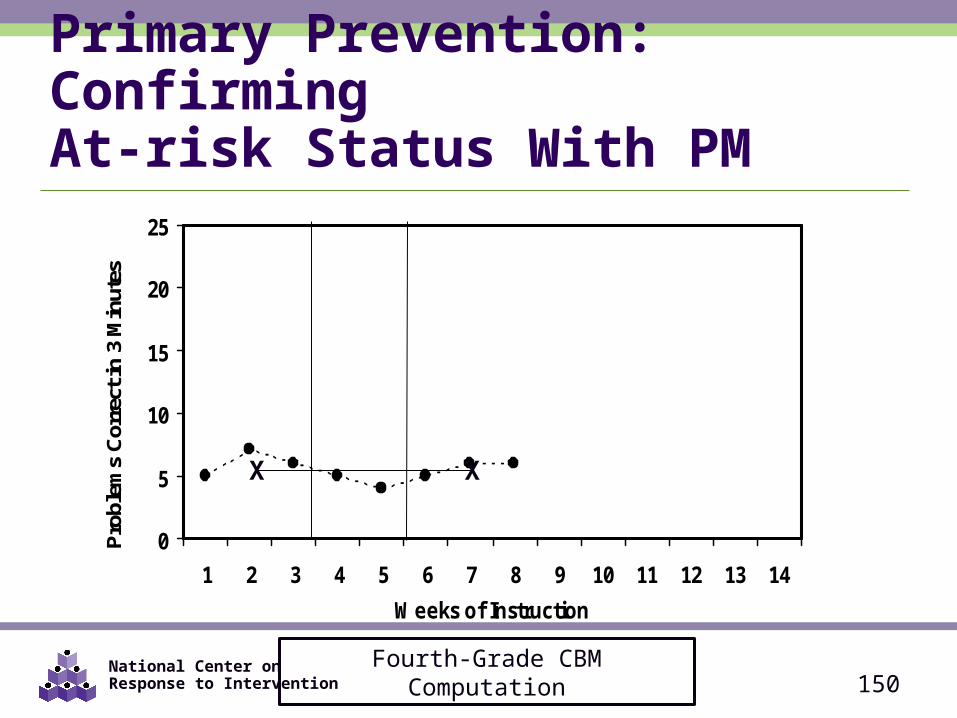
National Center on Response to Intervention 150
Primary Prevention: Confirming At-risk Status With PM
0
5
10
15
20
25
1 2 3 4 5 6 7 8 9 10 11 12 13 14
Weeks of Instruction
Pro
blem
s C
orre
ct in
3 M
inut
es
XX
Fourth-Grade CBM Computation
National Center on Response to Intervention 151
0
5
10
15
20
25
1 2 3 4 5 6 7 8 9 10 11 12 13 14
Weeks of Instruction
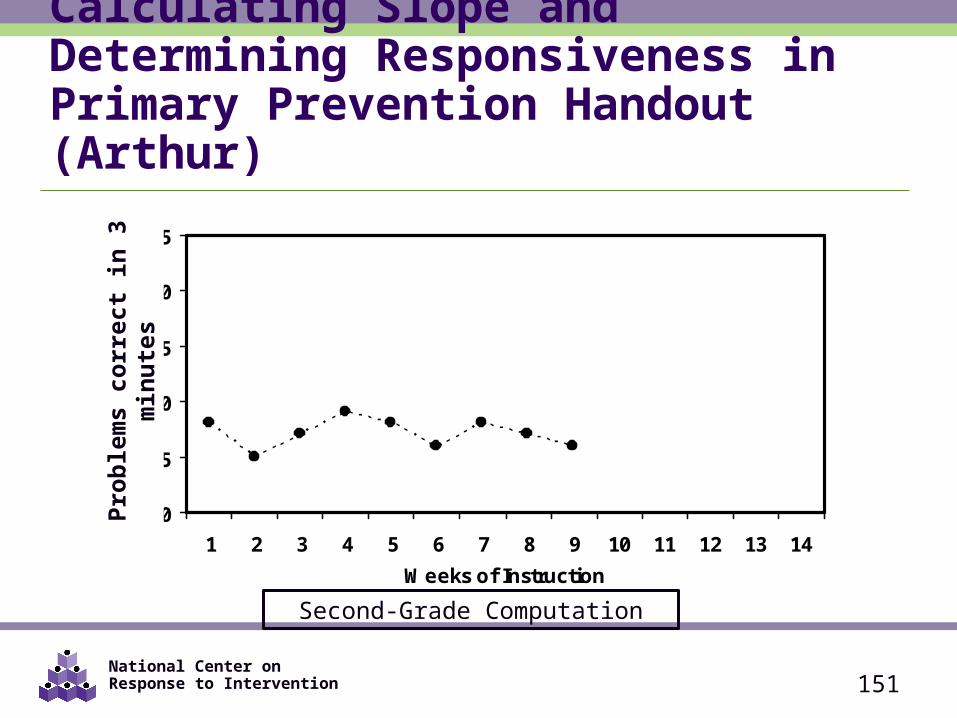
Dig
its
Co
rrec
t in
2 M
inu
tes
Calculating Slope and Determining Responsiveness in Primary Prevention Handout (Arthur)
Prob
lem
s co
rrec
t in
3 m
inut
es
Second-Grade Computation
National Center on Response to Intervention 152
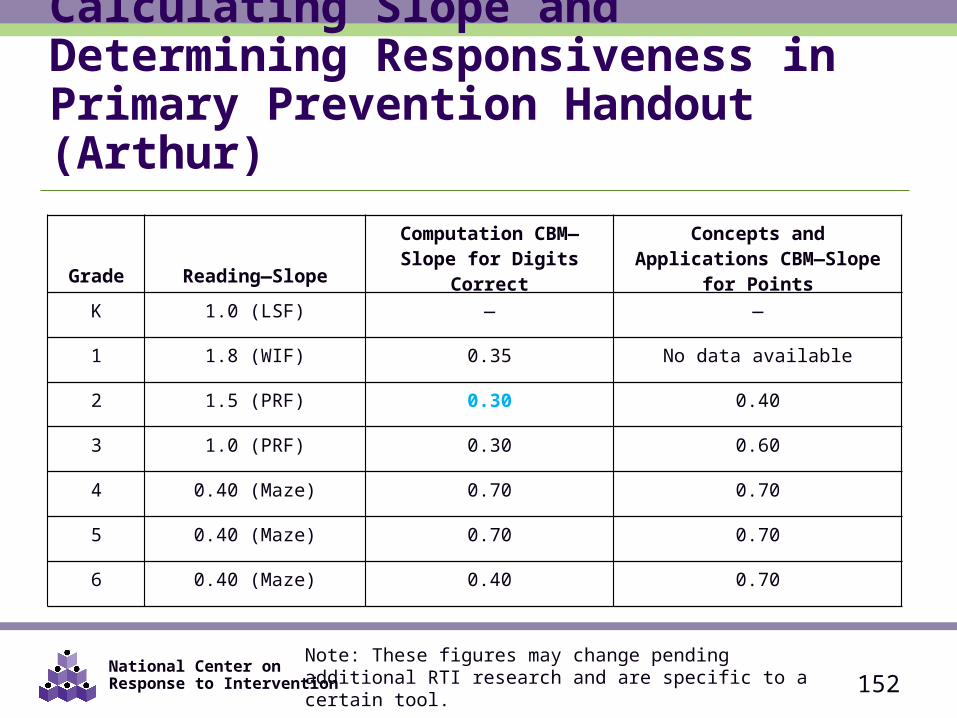
Calculating Slope and Determining Responsiveness in Primary Prevention Handout (Arthur)
Note: These figures may change pending additional RTI research and are specific to a certain tool.
Grade Reading—SlopeComputation CBM—
Slope for Digits CorrectConcepts and Applications
CBM—Slope for Points
K 1.0 (LSF) — —
1 1.8 (WIF) 0.35 No data available
2 1.5 (PRF) 0.30 0.40
3 1.0 (PRF) 0.30 0.60
4 0.40 (Maze) 0.70 0.70
5 0.40 (Maze) 0.70 0.70
6 0.40 (Maze) 0.40 0.70
National Center on Response to Intervention 153
0
5
10
15
20
25
1 2 3 4 5 6 7 8 9 10 11 12 13 14
Weeks of Instruction
Dig
its
Co
rrec
t in
2 M
inu
tes
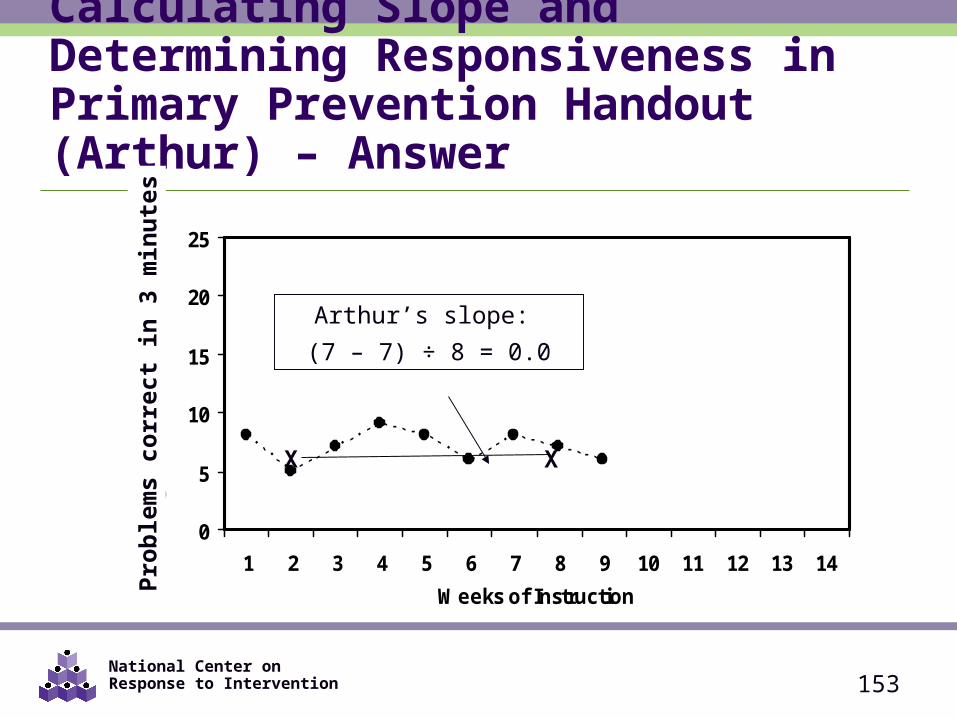
Arthur’s slope:
(7 – 7) ÷ 8 = 0.0
X X
Calculating Slope and Determining Responsiveness in Primary Prevention Handout (Arthur) – Answer
Pro
ble
ms
corr
ect
in 3
min
ute
s
National Center on Response to Intervention
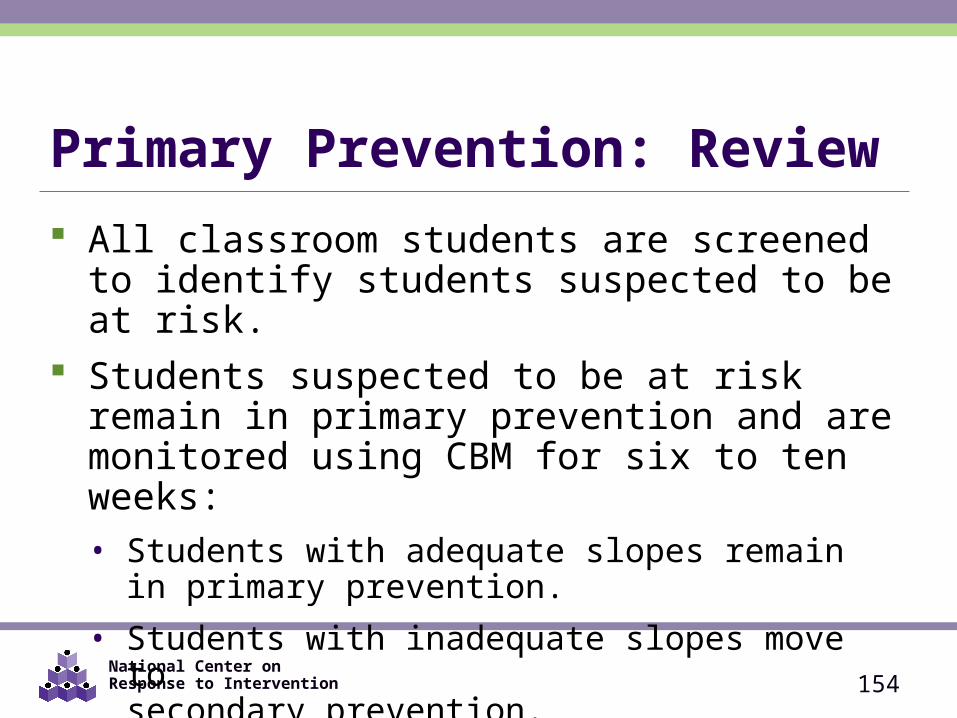
Primary Prevention: Review All classroom students are screened to identify
students suspected to be at risk. Students suspected to be at risk remain in primary
prevention and are monitored using CBM for six to ten weeks:• Students with adequate slopes remain in primary
prevention.• Students with inadequate slopes move to
secondary prevention.
154
National Center on Response to Intervention 155
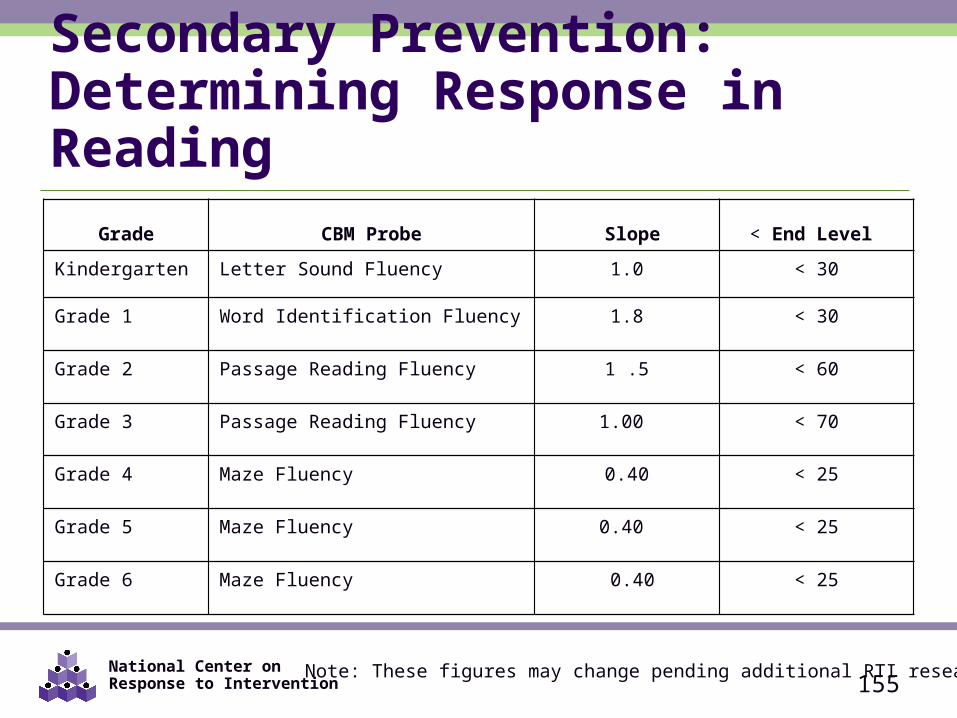
Secondary Prevention:Determining Response in Reading
Grade CBM Probe Slope < End Level
Kindergarten Letter Sound Fluency 1.0 < 30
Grade 1 Word Identification Fluency 1.8 < 30
Grade 2 Passage Reading Fluency 1 .5 < 60
Grade 3 Passage Reading Fluency 1.00 < 70
Grade 4 Maze Fluency 0.40 < 25
Grade 5 Maze Fluency 0.40 < 25
Grade 6 Maze Fluency 0.40 < 25
Note: These figures may change pending additional RTI research.
National Center on Response to Intervention 156
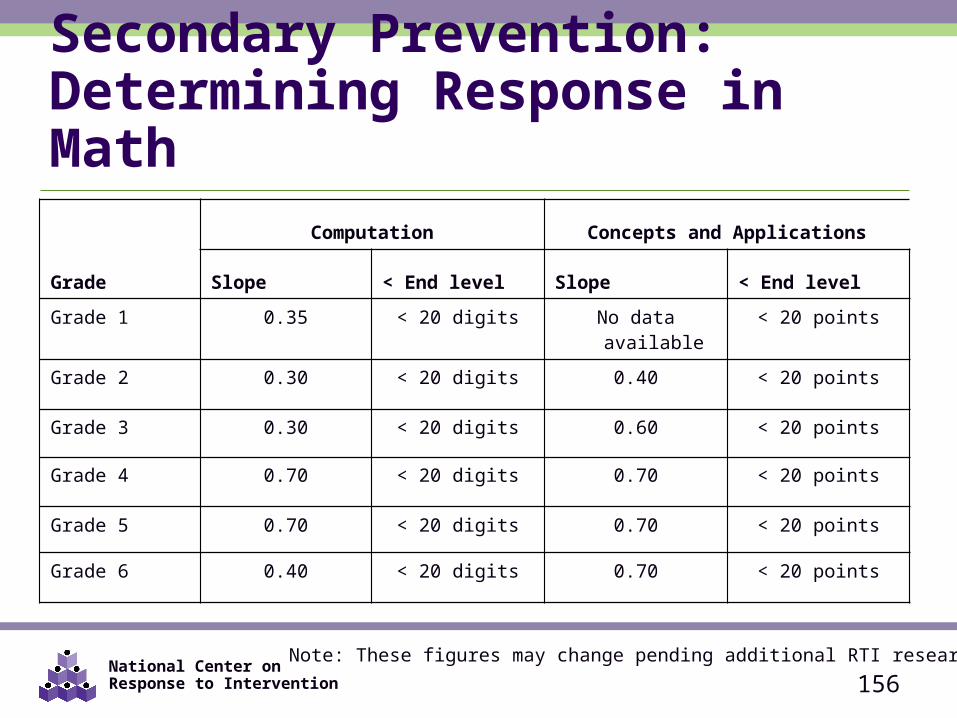
Secondary Prevention:Determining Response in Math
Grade
Computation Concepts and Applications
Slope < End level Slope < End level
Grade 1 0.35 < 20 digits No data available < 20 points
Grade 2 0.30 < 20 digits 0.40 < 20 points
Grade 3 0.30 < 20 digits 0.60 < 20 points
Grade 4 0.70 < 20 digits 0.70 < 20 points
Grade 5 0.70 < 20 digits 0.70 < 20 points
Grade 6 0.40 < 20 digits 0.70 < 20 points
Note: These figures may change pending additional RTI research.
National Center on Response to Intervention
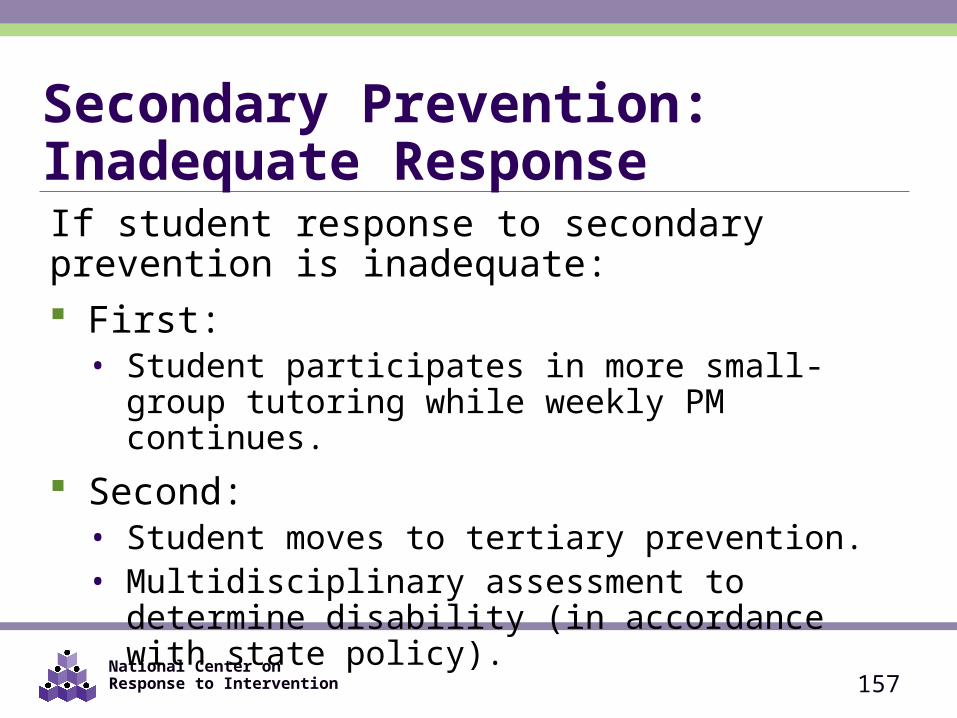
Secondary Prevention: Inadequate ResponseIf student response to secondary prevention is inadequate: First:
• Student participates in more small-group tutoring while weekly PM continues.
Second:• Student moves to tertiary prevention.• Multidisciplinary assessment to determine disability (in
accordance with state policy).
157
National Center on Response to Intervention 158
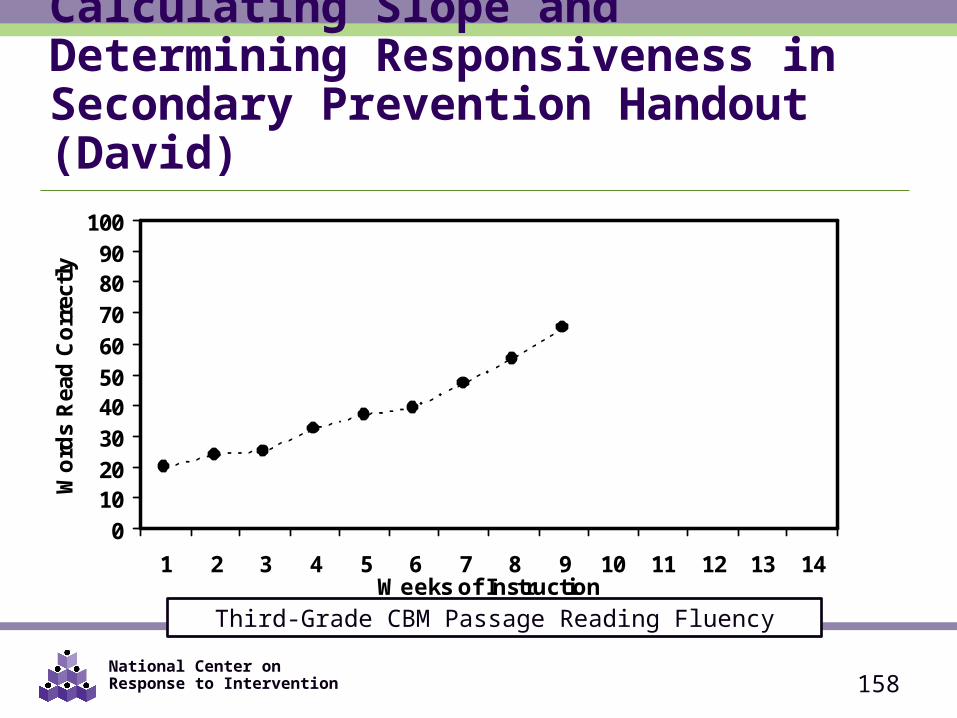
Calculating Slope and Determining Responsiveness in Secondary Prevention Handout (David)
0102030405060708090
100
1 2 3 4 5 6 7 8 9 10 11 12 13 14Weeks of Instruction
Wo
rds
Rea
d C
orr
ectl
y
Third-Grade CBM Passage Reading Fluency
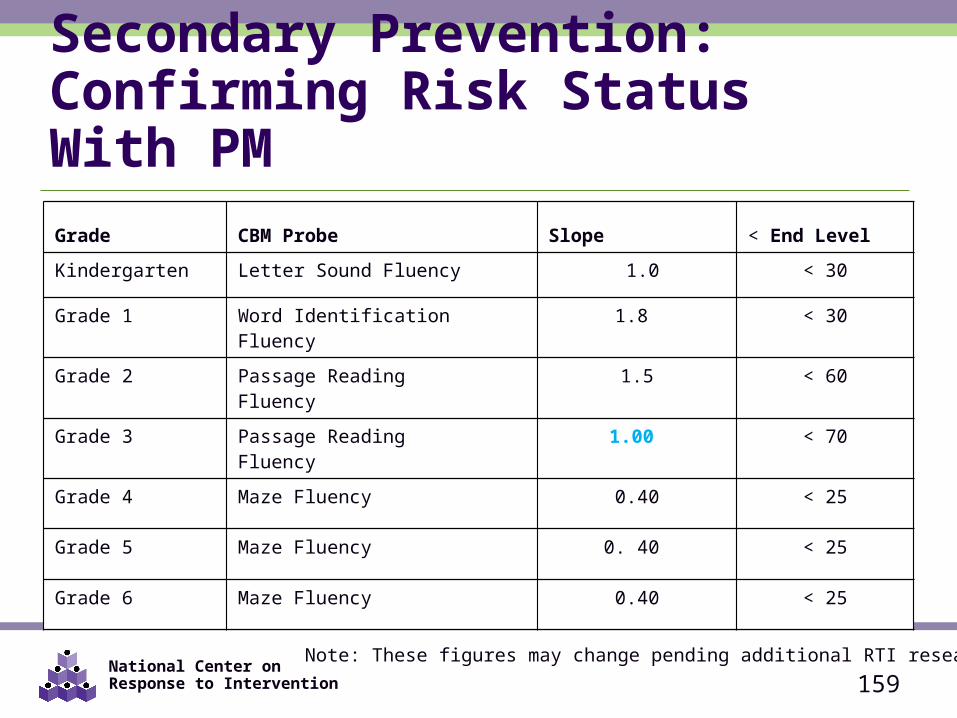
National Center on Response to Intervention 159
Secondary Prevention:Confirming Risk Status With PMGrade CBM Probe Slope < End Level
Kindergarten Letter Sound Fluency 1.0 < 30
Grade 1 Word IdentificationFluency
1.8 < 30
Grade 2 Passage ReadingFluency
1.5 < 60
Grade 3 Passage ReadingFluency
1.00 < 70
Grade 4 Maze Fluency 0.40 < 25
Grade 5 Maze Fluency 0. 40 < 25
Grade 6 Maze Fluency 0.40 < 25
Note: These figures may change pending additional RTI research.
National Center on Response to Intervention 160
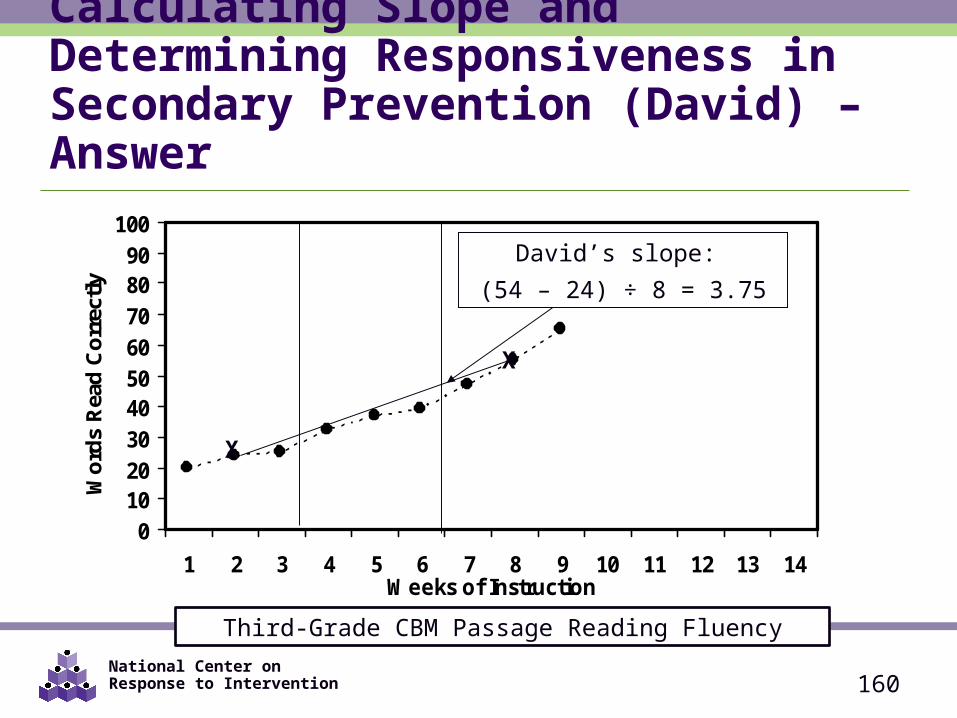
0102030405060708090
100
1 2 3 4 5 6 7 8 9 10 11 12 13 14Weeks of Instruction
Wo
rds
Rea
d C
orr
ectl
y
X
X
David’s slope:
(54 – 24) ÷ 8 = 3.75
Calculating Slope and Determining Responsiveness in Secondary Prevention (David) – Answer
Third-Grade CBM Passage Reading Fluency
National Center on Response to Intervention 161
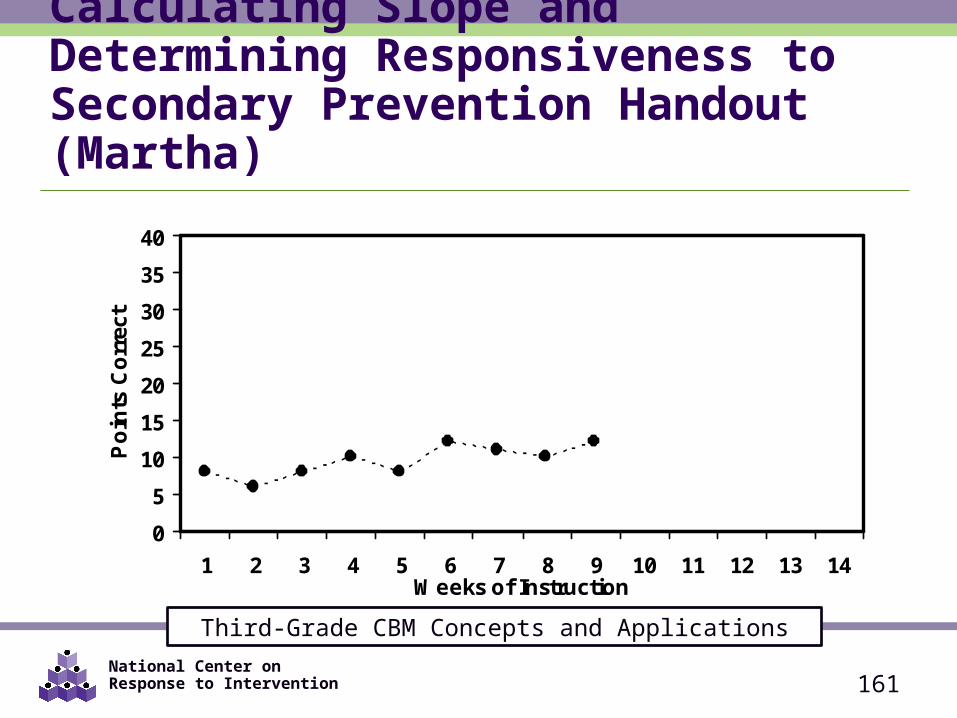
Calculating Slope and Determining Responsiveness to Secondary Prevention Handout (Martha)
0
5
10
15
20
25
30
35
40
1 2 3 4 5 6 7 8 9 10 11 12 13 14Weeks of Instruction
Po
ints
Co
rrec
t
Third-Grade CBM Concepts and Applications
National Center on Response to Intervention
Secondary Prevention:Confirming Risk Status With PM
162
Grade
Computation Concepts & Applications
Slope < End level < Slope < End level
Grade 1 0.35 < 20 digits No data available --
Grade 2 0.30 < 20 digits 0.40 < 20 points
Grade 3 0.30 < 20 digits 0.60 < 20 points
Grade 4 0.70 < 20 digits 0.70 < 20 points
Grade 5 0.70 < 20 digits 0.70 < 20 points
Grade 6 0.40 < 20 digits 0.70 < 20 points
Note: These figures may change pending additional RTI research.
National Center on Response to Intervention
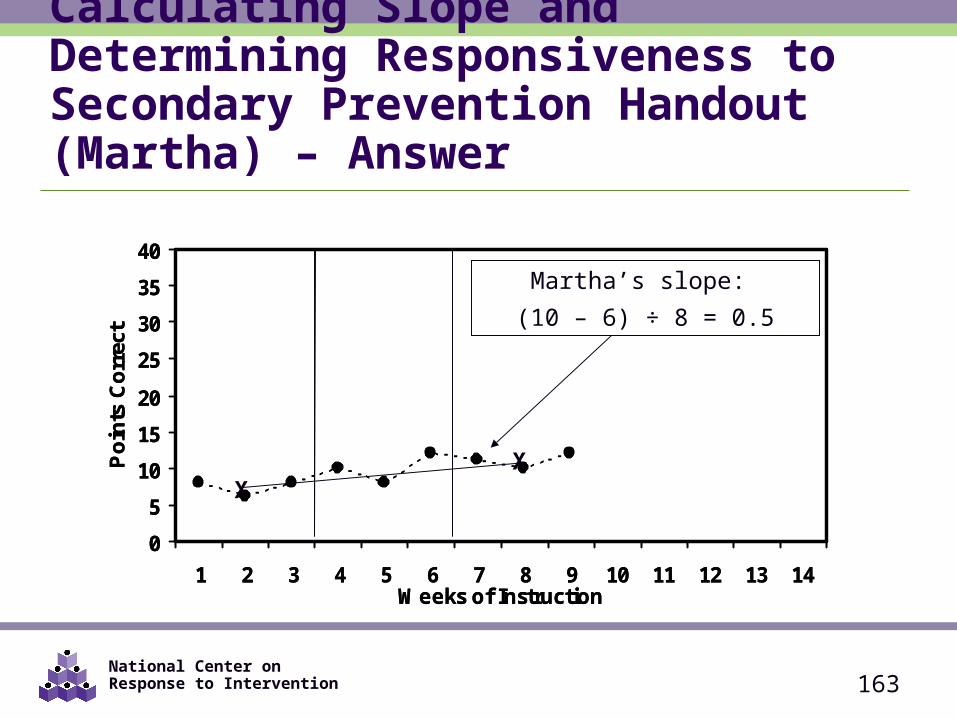
Calculating Slope and Determining Responsiveness to Secondary Prevention Handout (Martha) – Answer
163
0
5
10
15
20
25
30
35
40
1 2 3 4 5 6 7 8 9 10 11 12 13 14Weeks of Instruction
Po
ints
Co
rrec
t
0
5
10
15
20
25
30
35
40
1 2 3 4 5 6 7 8 9 10 11 12 13 14Weeks of Instruction
Po
ints
Co
rrec
t
XX
Martha’s slope:
(10 – 6) ÷ 8 = 0.5
National Center on Response to Intervention
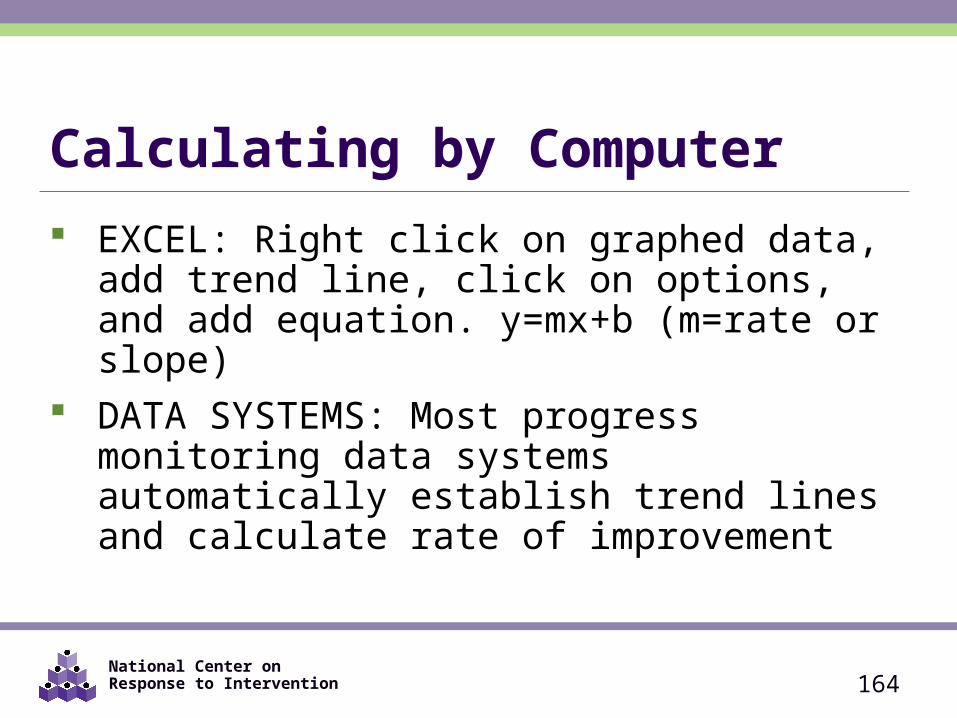
Calculating by Computer EXCEL: Right click on graphed data, add trend line,
click on options, and add equation. y=mx+b (m=rate or slope)
DATA SYSTEMS: Most progress monitoring data systems automatically establish trend lines and calculate rate of improvement
164
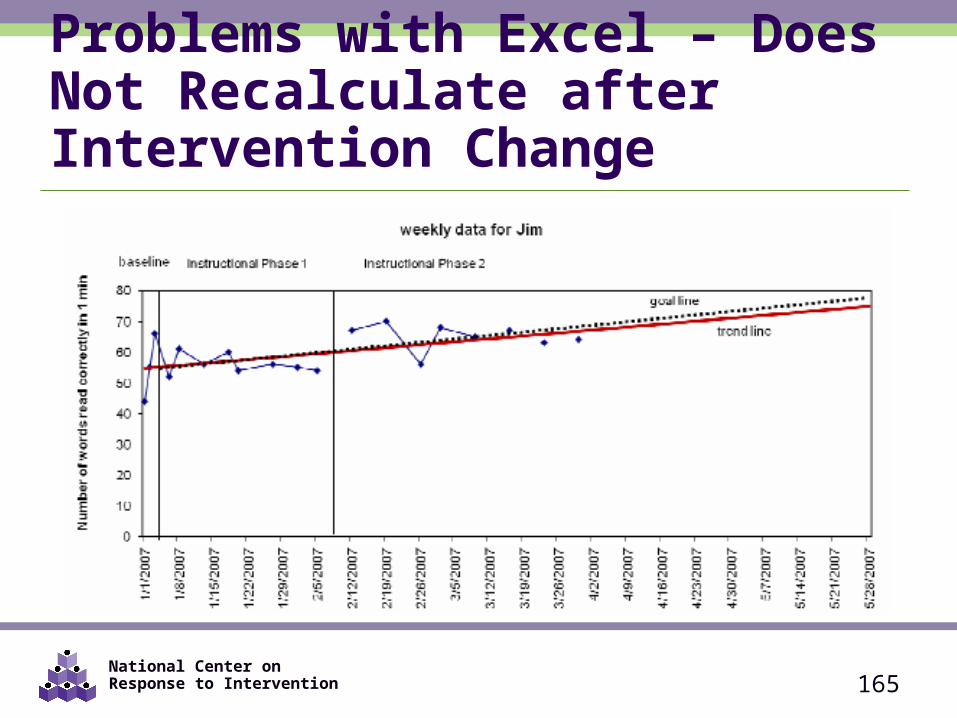
National Center on Response to Intervention 165
Problems with Excel – Does Not Recalculate after Intervention Change
National Center on Response to Intervention 166
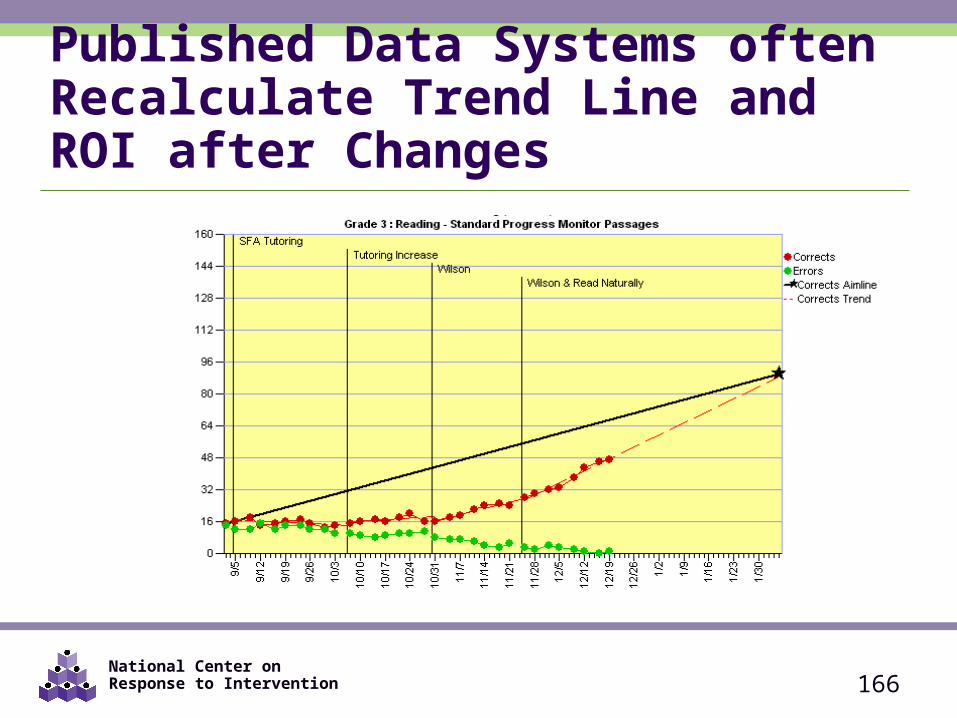
Published Data Systems often Recalculate Trend Line and ROI after Changes
National Center on Response to Intervention
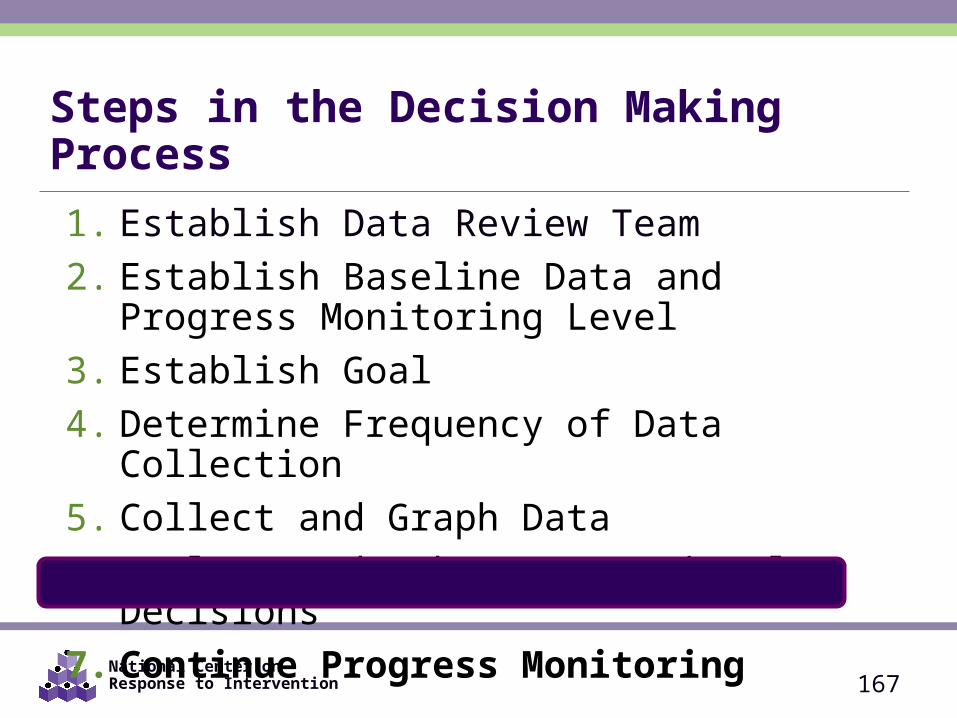
Steps in the Decision Making Process1. Establish Data Review Team2. Establish Baseline Data and Progress Monitoring
Level3. Establish Goal4. Determine Frequency of Data Collection5. Collect and Graph Data6. Analyze and Make Instructional Decisions7. Continue Progress Monitoring
167
National Center on Response to Intervention
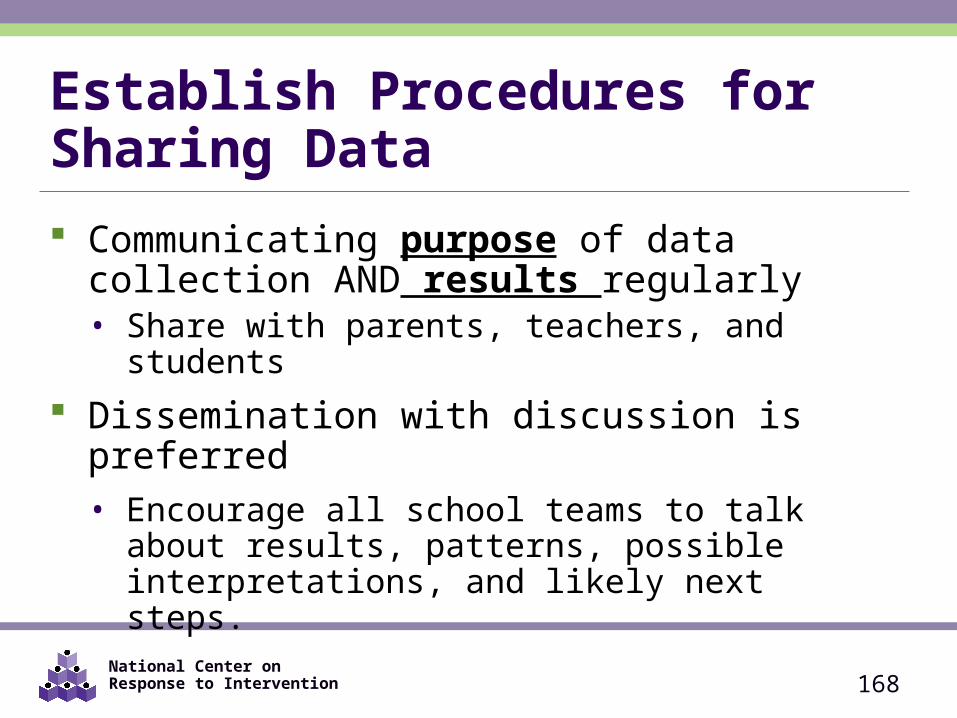
Establish Procedures for Sharing Data Communicating purpose of data collection AND
results regularly• Share with parents, teachers, and students
Dissemination with discussion is preferred• Encourage all school teams to talk about results,
patterns, possible interpretations, and likely next steps.
168
National Center on Response to Intervention
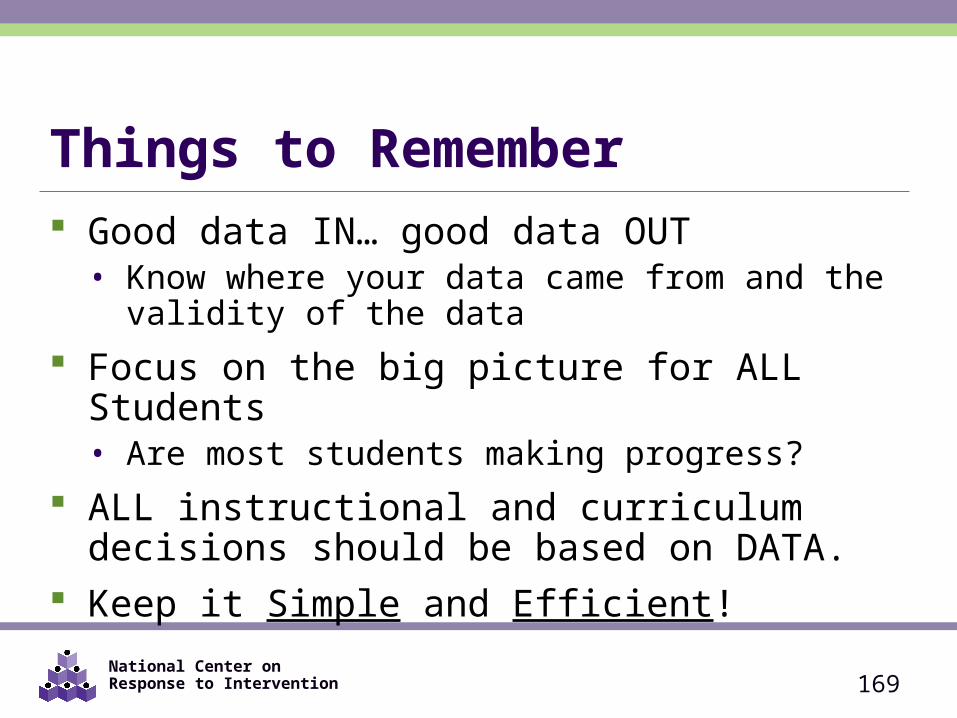
Things to Remember Good data IN… good data OUT
• Know where your data came from and the validity of the data
Focus on the big picture for ALL Students• Are most students making progress?
ALL instructional and curriculum decisions should be based on DATA.
Keep it Simple and Efficient!
169
National Center on Response to Intervention
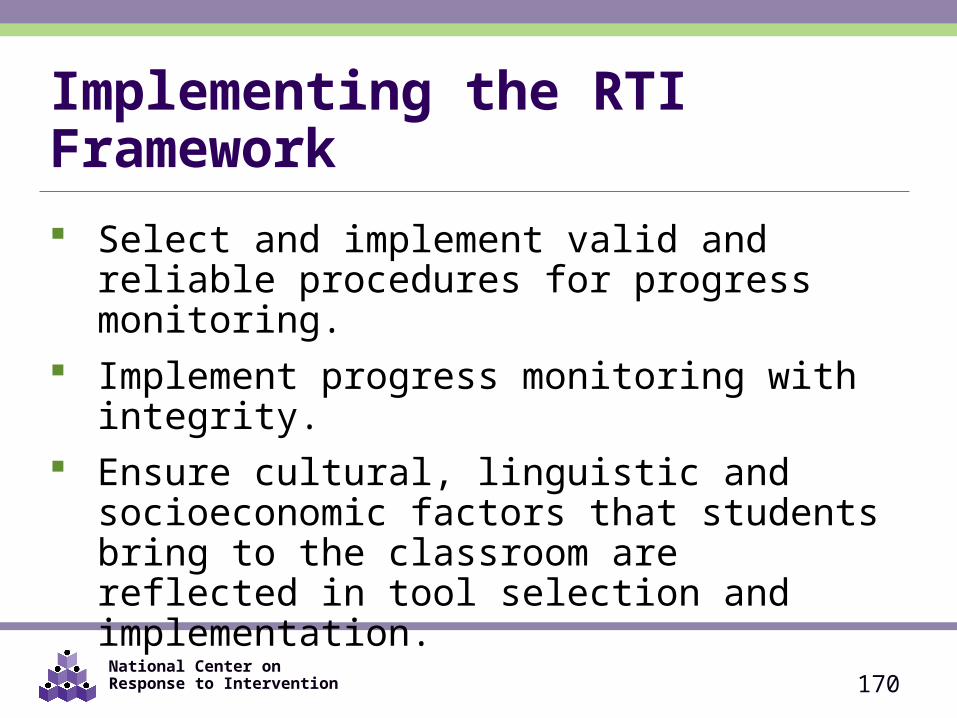
Implementing the RTI Framework Select and implement valid and reliable procedures
for progress monitoring. Implement progress monitoring with integrity. Ensure cultural, linguistic and socioeconomic factors
that students bring to the classroom are reflected in tool selection and implementation.
170
National Center on Response to Intervention
CLOSING
171
National Center on Response to Intervention
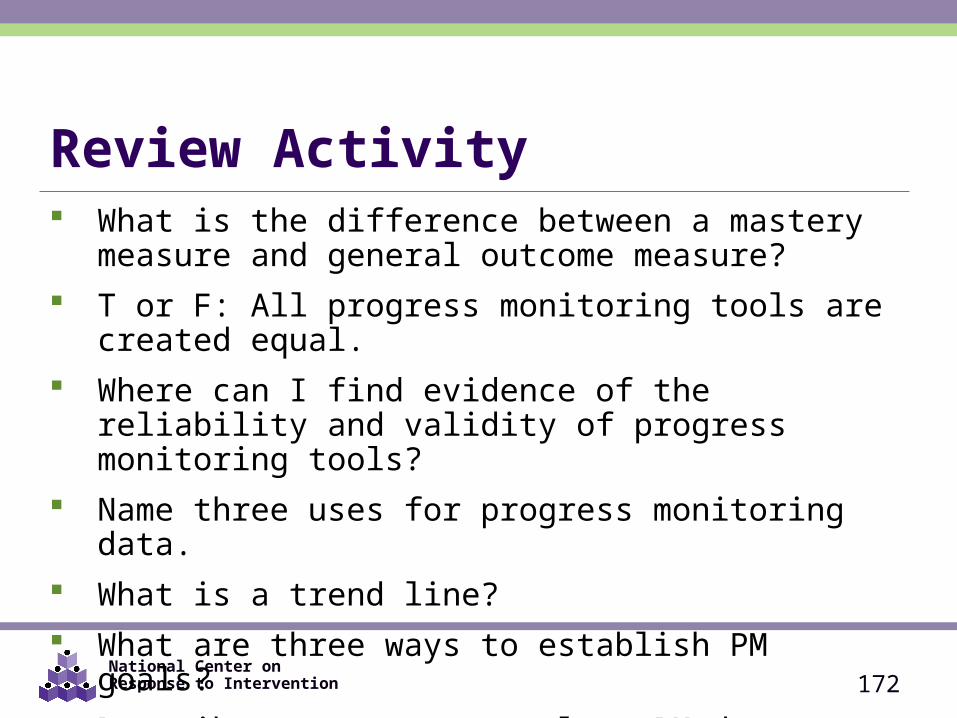
Review Activity What is the difference between a mastery measure and
general outcome measure? T or F: All progress monitoring tools are created equal. Where can I find evidence of the reliability and validity of
progress monitoring tools? Name three uses for progress monitoring data. What is a trend line? What are three ways to establish PM goals? Describe two ways to analyze PM data.
172
National Center on Response to Intervention
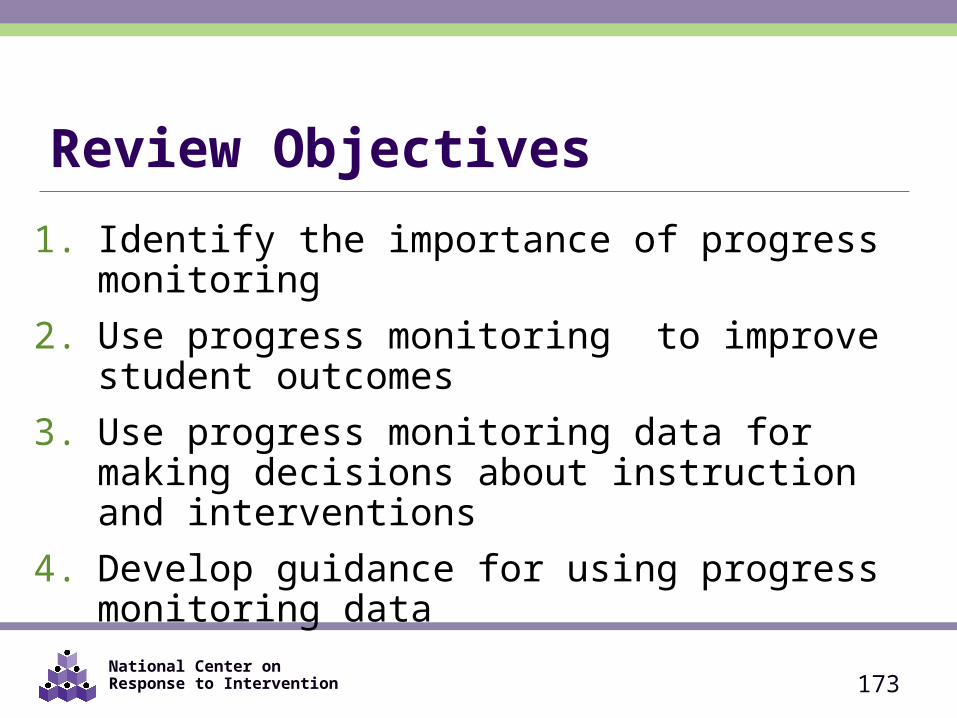
Review Objectives
1. Identify the importance of progress monitoring 2. Use progress monitoring to improve student
outcomes 3. Use progress monitoring data for making decisions
about instruction and interventions4. Develop guidance for using progress monitoring data
173
National Center on Response to Intervention
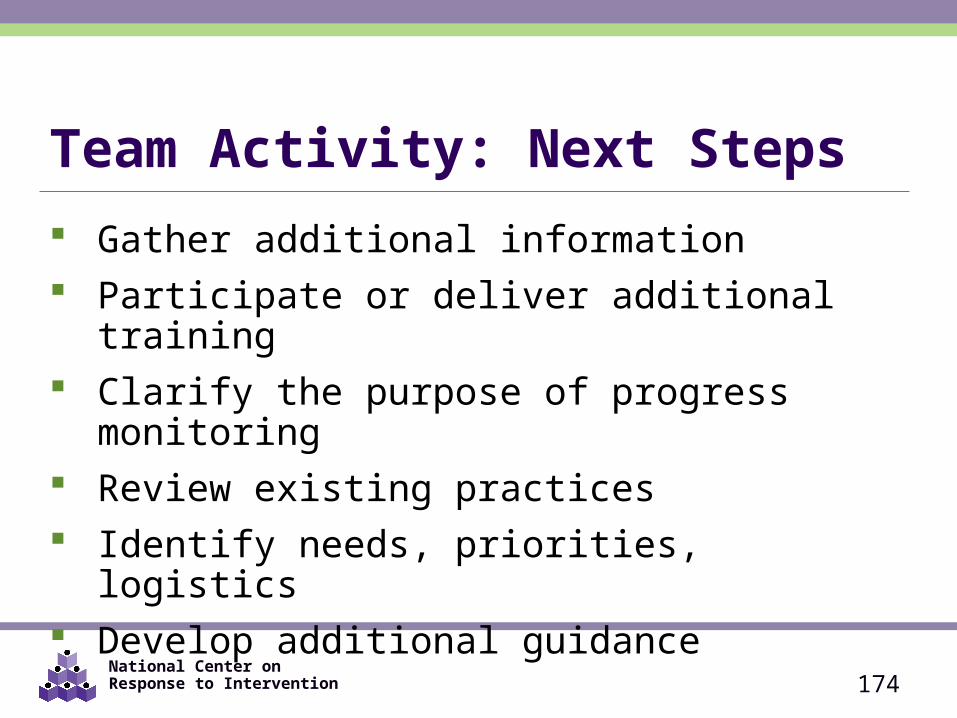
Team Activity: Next Steps Gather additional information Participate or deliver additional training Clarify the purpose of progress monitoring Review existing practices Identify needs, priorities, logistics Develop additional guidance
174
National Center on Response to Intervention
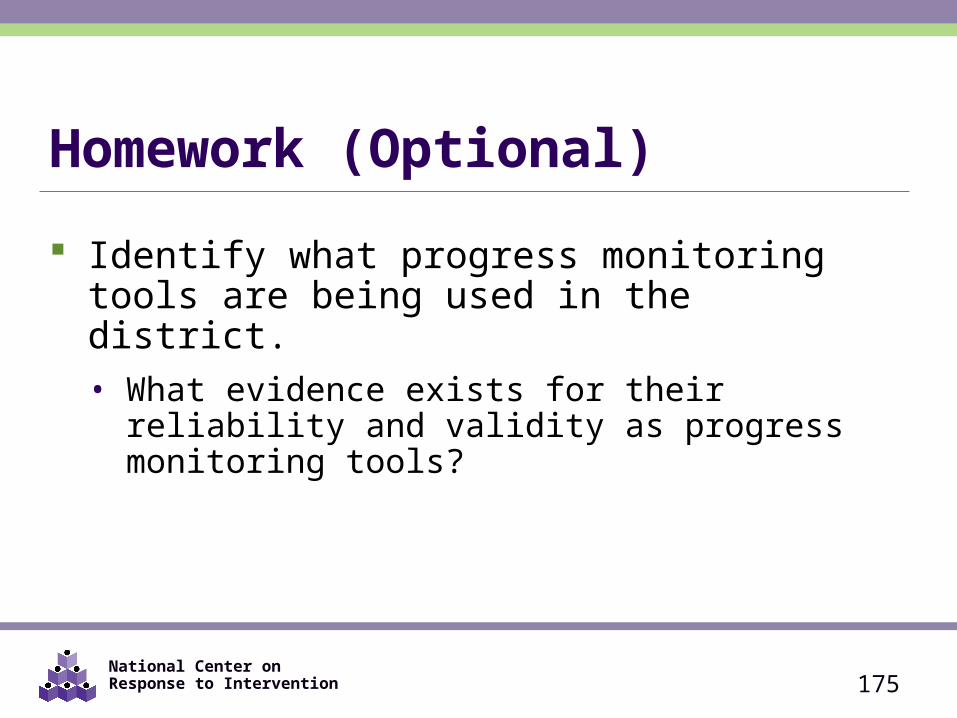
Homework (Optional)
Identify what progress monitoring tools are being used in the district. • What evidence exists for their reliability and validity as
progress monitoring tools?
175
National Center on Response to Intervention
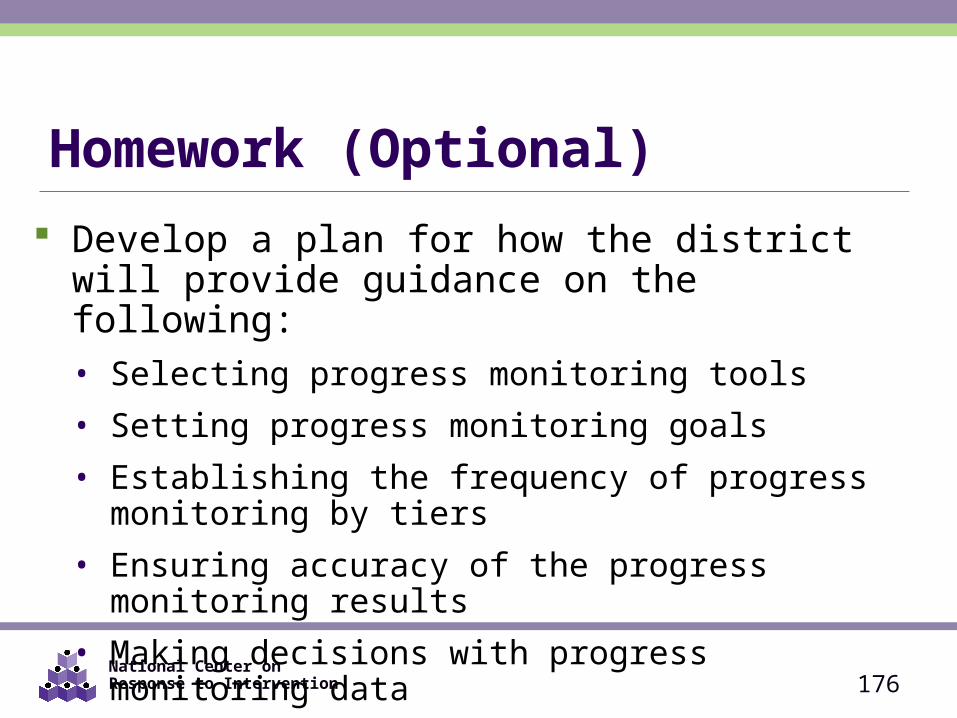
Homework (Optional) Develop a plan for how the district will provide
guidance on the following:• Selecting progress monitoring tools• Setting progress monitoring goals• Establishing the frequency of progress monitoring by tiers• Ensuring accuracy of the progress monitoring results• Making decisions with progress monitoring data
176
National Center on Response to Intervention 177
National Center on Response to Interventionwww.rti4success.org
RTI Action Networkwww.rtinetwork.org
IDEA Partnershipwww.ideapartnership.org
Need More Information?
National Center on Response to Intervention 178
National Center on Response to Intervention
www.rti4success.org
Questions?
National Center on Response to Intervention 179
National Center on Response to Intervention
This document was produced under U.S. Department of Education, Office of Special Education Programs Grant No. H326E07000.4 Grace Zamora Durán and Tina Diamond served as the OSEP project officers. The views expressed herein do not necessarily represent the positions or policies of the Department of Education. No official endorsement by the U.S. Department of Education of any product, commodity, service or enterprise mentioned in this publication is intended or should be inferred. This product is public domain. Authorization to reproduce it in whole or in part is granted. While permission to reprint this publication is not necessary, the citation should be: www.rti4success.org.