Embed Size (px)
Citation preview

National Corn-to-Ethanol Research Center
Summary Report for
Pursuit Dynamics May 3, 2008
Prepared by: B.A. Wrenn
TM

Table of Contents page
Executive Summary 1
Introduction 2
Objective 4
Experimental 4
Slurry/Cook/Liquefaction 5
Fermentation 6
Postfermentation Processing 7
Feedstock and Coproduct Analysis 8
Results 9
Feedstock Composition 9
Liquefaction 10
Saccharification Potential 12
Fermentation 13
Fermentation Kinetics 13
Ethanol Yield 18
Coproduct Characteristics 20
Coproduct Composition 20
Particle-Size Distributions 24
Thin Stillage 25
Conclusions 26
Appendix A: Description of Analytical Methods
Appendix B: Derivation of Equation for Final Beer Volume
Appendix C: Raw Data

1
Executive Summary A study was conducted in the National Corn-to-Ethanol Research Center (NCERC) pilot
plant in December 2007 to evaluate the performance of the PDX technology. The pilot plant was modified to accommodate the high material processing rates of the PDX-25 units within the materials handling constraints of the NCERC pilot plant. Several different configurations and operating conditions were tested in this study. The objective of this study was to evaluate the performance of the PDX technology by comparison to standard NCERC operation conditions. Performance of this technology was evaluated based on the ethanol yield of 1500-gallon fermentations, the kinetics of ethanol production and sugar consumption, and the susceptibility of corn starch to enzymatic hydrolysis under standard conditions. In addition, the characteristics of the fermentation and distillation byproducts (e.g., wet cake, DDGS) produced from control and PDX-treated slurry were determined.
Key results of the trial include: • The ethanol yield of three configurations of the PDX process was significantly greater than
the ethanol yield of the standard NCERC process (control). • On average, the rate of ethanol production in fermentors containing PDX-processed material
was 27% faster than in control fermentors. • The saccharification potential (i.e., the susceptibility of starch to enzymatic hydrolysis) of
mash produced by two of the three configurations (Recirculation 2 and the Ethanol Reactor Tower) was significantly greater than the controls.
• DDGS produced from material processed by the Ethanol Reactor Tower configuration had a chemical composition that was similar to conventional DDGS as described in the industry literature. The chemical composition was determined by measuring the concentrations of moisture, residual fermentable sugars, crude protein, crude fat, and crude fiber.
• The particle-size distribution of the DDGS produced from PDX-processed slurry was within the range of values that are represented in the NCERC DDGS library, which contains samples collected quarterly from 38 dry-grind ethanol plants operating in the U.S.

2
Introduction The NCERC pilot plant contains all of the unit processes and operations that are common in
commercial dry-grind ethanol plants at a fraction of the size. Due to cost and time restrictions, process recycle and energy recovery strategies are not used at the NCERC as they would be at a full-scale commercial facility. With a capacity to produce approximately 200,000 gallons per year of fuel ethanol, the NCERC is 1/250th the size of a 50 million gallon per year (MGY) facility, which is currently the industry standard.
The standard NCERC pilot-scale process was modified to incorporate Pursuit Dynamics technology into the cooking and liquefaction processes. Several process configurations were evaluated during this trial. In these configurations, two to four PDX units replaced the NCERC Hydro-Thermal M Series jet cooker. Other modifications were made to accommodate the relatively high flow rates that are produced by operation of the PDX units (about 50 gpm) within the design constraints of the NCERC pilot plant (typical flow rates of about 3 gpm). These modifications included adding two 1500-gal tanks. One of the tanks (Tank A) was used to store the slurry of corn flour and water while it was being produced and before PDX processing, and the second (Tank B) was used to collect the PDX-processed slurry and provide residence time for liquefaction. A process-flow diagram (PFD) for the conventional NCERC process is shown in Figure 1, and the modified PFDs for trials involving PDX processing are shown in Figure 2. For fermentors R4-R6 (Fig. 2A), a single high-shear PDX unit was used to heat the slurry to 84 oC during recirculation, after which it was diverted to Tank B by opening a hand valve. The material used to fill fermentors R7-R9 (Fig. 2B) was processed through a high-shear PDX unit during recirculation until it reached 75 oC, after which the flow was diverted to tank B and the
TA-990 slurry
water
corn flour
jet cooker
TA-950 liquefaction
TA-13x0 fermentation
mash cooler
Figure 1: Process-flow diagram for the standard configuration of prefermentation processes
in the NCERC pilot plant.

3
TA-990 slurry
water corn flour
Tank A slurry build
Tank B liquefaction
TA-13x0 fermentation
mash cooler
high-shear PDX
A
TA-990 slurry
water corn flour
Tank A slurry build
Tank B liquefaction
TA-13x0 fermentation
mash cooler
high-shear PDX
low-shear PDX
B
TA-990 slurry
water corn flour
Tank A slurry build
Tank B liquefaction
TA-13x0 fermentation
mash cooler
low-shear PDX
C
high-shear PDX units Figure 2: Configuration of PDX units in the NCERC pilot plant for (A) fermentors R4-R6
(Recirculation 1), (B) fermentors R7-R9 (Recirculation 2), and (C) fermentors R12-R14 (Ethanol Reactor Tower, ERT, configuration). The high-shear PDX units were used for heating and starch processing and the low-shear PDX units were used only to raise the temperature.

4
slurry was heated to 84 to 85 oC by a low-shear PDX unit. Figure 2C shows the PFD for the Ethanol Reactor Tower (ERT) configuration, which was used to process material for fermentors R12-R14. The ERT configuration involved processing of slurry through three high-shear PDX units arranged in series, which raised the temperature to 75 oC, followed by a low-shear PDX that heated the slurry to 84 oC.
After liquefaction in the conventional NCERC process configuration (controls) or one of the PDX process configurations (treatments), the mash was cooled in a tube-in-tube-in-shell heat exchanger. The cooled mash was transferred to one of four fermentors, where it was inoculated with yeast, supplemented with nutrients and antibiotic, and fermented to completion (usually between 35 to 50 hrs). The resulting beer was distilled to remove the alcohol, and the whole stillage was separated into wet cake and thin stillage in a decanter centrifuge. The wet cake was fed into a rotary drum dryer where it was dried to produce distiller’s dried grains (DDG) or combined with concentrated thin stillage (syrup) before drying to produce distiller’s dried grains with solubles (DDGS). The thin stillage was condensed to syrup in a single-effect evaporator.
All treatment conditions were independently replicated in three fermentors. Final ethanol concentrations, ethanol yields, and production rates were estimated for all treatment conditions. In addition, samples of the process residuals from each treatment condition (wet cake, thin stillage, DDG, and DDGS) were collected after distillation and the composition was determined using standard wet-chemical analytical methods.
Objective The objective of this research was to evaluate the performance of the PDX slurry-processing
technology and compare it to the performance of the standard NCERC process. To achieve this objective performance was evaluated at several stages in the process by measuring the following parameters: 1) slurry/cooking/liquefaction
• dextrose equivalents (DE) • total solids concentration • saccharification potential
2) fermentation • ethanol production rate and sugar consumption rate • ethanol yield based on the final concentration of ethanol
3) coproduct characteristics • the composition of wet cake, thin stillage, and DDGS
Experimental The complete set of protocols for this study was provided to Pursuit Dynamics after
completion of the trial. Table 1 provides a summary of the operating conditions used during this pilot-plant trial.

5
Table 1: Operation conditions for NCERC pilot-plant trial (December 2007)
parameter controls (R1-R3)
Recirc 1 (R4-R6)
Recirc 2 (R7-R9)
ERT (R12-R14)
corn feed rate (lbs/hr) 277 518 518 518 process water feed rate (lb/min) 21.3 34.6 34.6 34.6 target total dry solids conc. (%) 15 17 17 17
TA-990 temperature (oC) 83 ambient ambient 50 TA-990 residence time (min) 30 30 30 30
TA-990 pH 5.8 5.8 5.8 5.8
TA-990 α-amylase flow rate (g/hr) R1-R2: 18 R3: 8 44 31 31
jet-cooker temperature (oC) 106 N/A N/A N/A jet-cooker residence time (min) 7 N/A N/A N/A
TA-950 temperature (oC) 85 N/A N/A N/A
TA-950 α-amylase flow rate (g/hr) R1-R2: 30 R3: 14 N/A N/A N/A
liquefaction residence time (min) 120 N/A N/A N/A Tank A divert temperature (oC) N/A 80 75 N/A
Tank B residence time (min) N/A >2 hrs R7-R8: >2 hrs R9: minimum minimum
mash cooler flow rate (gal/min) 3.0 4.0 4.0 4.0 fermentor temperature (oC) 32 32 32 32
Slurry/Cook/Liquefaction Whole kernel corn was fed through the standard NCERC system from corn bins through a
cleaning system and a loss-in-weight feeder that controlled the feed rate to the hammer mill. Ground feedstock was fed into the slurry mixer where it was combined with water and α-amylase enzymes. The residence time in the slurry tank (TA-990) was 30 minutes.
For the control fermentors, the slurry was pumped through the Hydro-Thermal M series jet cooker at 3 gpm and heated to 106 oC (222 oF). The slurry was held at this temperature for 7 minutes before flashing to atmospheric pressure into the first liquefaction tank (TA-950), where a second dose of α-amylase was added. The residence time in liquefaction (TA-950, TA-1030, and TA-1220) was 120 minutes. The mash was cooled to 32 oC (90 oF) in the mash cooler before being added to the fermentors. Note that the DE values for the slurry (TA-990) and liquefaction (TA-1220) samples were much higher than desired during processing of the material for fermentors R1 and R2 (slurry DE = 11 vs. target slurry DE = 6; mash DE = 26 vs. target mash DE = 12). This suggested that the α-amylase that was used, Liquozyme SC DS (Novozymes), was more active than expected (i.e., more than twice the activity of the enzyme we normally use, Liquozyme SC), and therefore, the enzyme dosages were reduced during processing of the material for R2. Because of the hold up in the transfer lines, these changes

6
took effect during filling of fermentor R3. DE values close to the target values were achieved after the changes in enzyme dose rates took effect (R3 slurry DE = 7; R3 mash DE = 14).
When material was processed through the PDX units, the slurry was prepared at a much lower temperature than was used for the control fermentors (Table 1). In these experiments, the slurry was diverted from the slurry tank (TA-990) to a 1500-gallon slurry-build tank (Tank A), which served as a holding tank to enable us to accumulate enough material to process at the relatively high flow rates produced by the PDX-25 units. The slurry was processed in three different ways in the PDX runs. 1) The first three PDX runs (Recirculation 1; R4-R6) were processed by recirculation through a
single high-shear PDX-25 to heat the slurry to 84 oC then diverted to the liquefaction tank, Tank B (Fig. 2A).
2) The second set of PDX runs (Recirculation 2; R7-R9) was similar except the slurry was heated to 75 oC by a high-shear PDX-25 during the recirculation phase, after which the slurry was diverted to Tank B through a low-shear PDX-47, which heated the slurry to about 84 oC (Fig. 2B).
3) The third set of PDX runs (Ethanol Reactor Tower, ERT; R12-R14) involved straight transfer of the slurry from Tank A to Tank B through three high-shear PDX-25 units, which raised the temperature from the build temperature (50 oC) to 75 oC. The slurry was then heated to its final temperature (83 to 84 oC) using a low-shear PDX-47 (Fig. 2C).
The residence time of the PDX-treated material in the liquefaction tank (Tank B) was poorly defined because the fill rate (~50 gpm) was much higher than the withdrawal rate (4 gpm), which was limited by the cooling capacity of the mash cooler. For the first five PDX runs (R4-R8), the residence time varied between about 2.5 hrs and 8.5 hrs with an average of about 5.5 hrs. In the last four PDX runs (R9, R12-R14), withdrawal of processed material from Tank B began as soon as there was enough material in the tank to allow the pump to operate without entraining air. For these runs, the liquefaction residence times varied between about 15 minutes and 7 hrs with an average of about 3.5 hrs. Due to higher-than-desired DE values in the mash from runs R4 to R6 (about 25 to 27), the enzyme dosage was reduced by about 30% beginning with the Recirculation 2 series. Despite this change, the DE values of the liquefied mash remained high (24 to 26) for fermentors R7 and R8. These high mash DE values prompted the reduction in liquefaction residence time that occurred beginning with fermentor R9. The result was a slight reduction in mash DE for R9 (21-22). The DE values for the Ethanol Reactor Tower configuration (R12-R14) were closer to the target value, but still higher than desired (DE = 17 to 21 vs. target value of 12).
Fermentation Liquefied mash was cooled to 32 oC and pumped into a fermentor at either 3 gpm (controls)
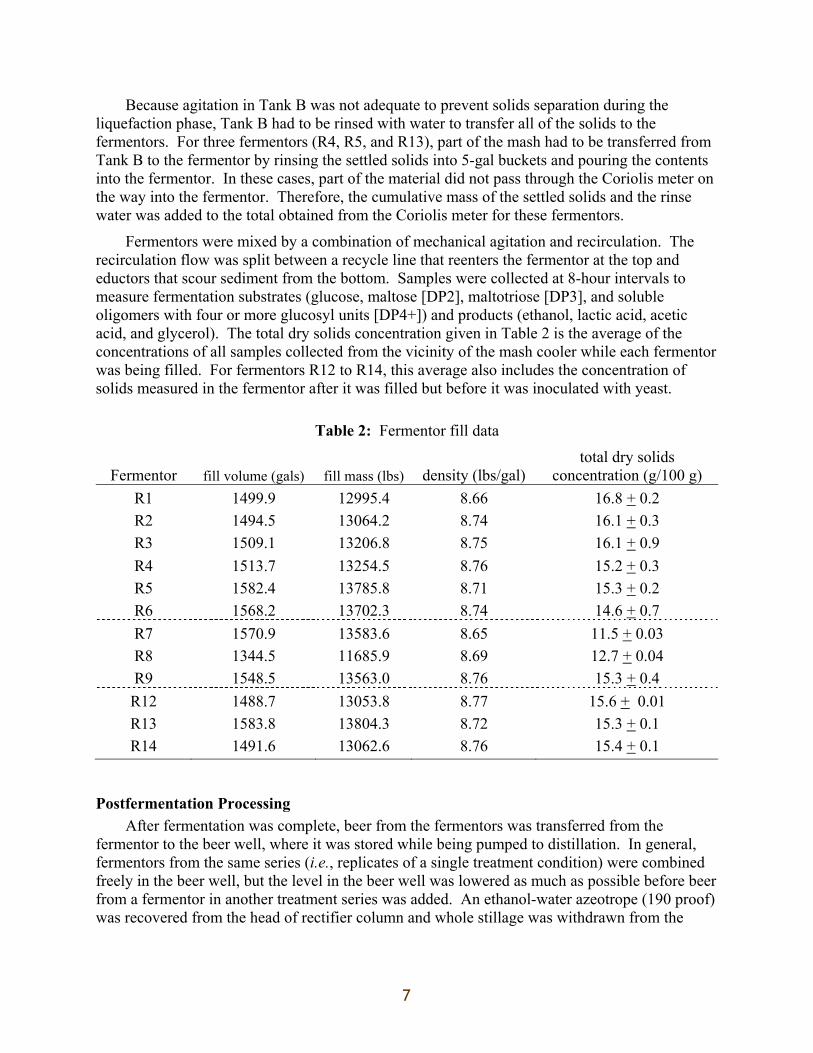
or 4 gpm (PDX treatments). Yeast, nutrients, gluco-amylase (Spirizyme Fuel; Novozymes), and antibiotic (Lactrol; Phibro, Ridgefield Park, NJ) were added to each fermentor after about 1 hour. Additional nutrients, enzyme, and antibiotic were added again 3 hours later. Each fermentor was filled with 1500 gallons of mash or, in the case of the PDX runs, the entire volume of mash that was prepared and could be pumped out of Tanks A and B. The cumulative mass and volume of the material introduced into each fermentor was measured using a Coriolis-type mass flow meter (Table 2).
7
Because agitation in Tank B was not adequate to prevent solids separation during the liquefaction phase, Tank B had to be rinsed with water to transfer all of the solids to the fermentors. For three fermentors (R4, R5, and R13), part of the mash had to be transferred from Tank B to the fermentor by rinsing the settled solids into 5-gal buckets and pouring the contents into the fermentor. In these cases, part of the material did not pass through the Coriolis meter on the way into the fermentor. Therefore, the cumulative mass of the settled solids and the rinse water was added to the total obtained from the Coriolis meter for these fermentors.
Fermentors were mixed by a combination of mechanical agitation and recirculation. The recirculation flow was split between a recycle line that reenters the fermentor at the top and eductors that scour sediment from the bottom. Samples were collected at 8-hour intervals to measure fermentation substrates (glucose, maltose [DP2], maltotriose [DP3], and soluble oligomers with four or more glucosyl units [DP4+]) and products (ethanol, lactic acid, acetic acid, and glycerol). The total dry solids concentration given in Table 2 is the average of the concentrations of all samples collected from the vicinity of the mash cooler while each fermentor was being filled. For fermentors R12 to R14, this average also includes the concentration of solids measured in the fermentor after it was filled but before it was inoculated with yeast.
Table 2: Fermentor fill data
Fermentor fill volume (gals) fill mass (lbs) density (lbs/gal) total dry solids
concentration (g/100 g) R1 1499.9 12995.4 8.66 16.8 + 0.2 R2 1494.5 13064.2 8.74 16.1 + 0.3 R3 1509.1 13206.8 8.75 16.1 + 0.9 R4 1513.7 13254.5 8.76 15.2 + 0.3 R5 1582.4 13785.8 8.71 15.3 + 0.2 R6 1568.2 13702.3 8.74 14.6 + 0.7 R7 1570.9 13583.6 8.65 11.5 + 0.03 R8 1344.5 11685.9 8.69 12.7 + 0.04 R9 1548.5 13563.0 8.76 15.3 + 0.4 R12 1488.7 13053.8 8.77 15.6 + 0.01 R13 1583.8 13804.3 8.72 15.3 + 0.1 R14 1491.6 13062.6 8.76 15.4 + 0.1
Postfermentation Processing After fermentation was complete, beer from the fermentors was transferred from the
fermentor to the beer well, where it was stored while being pumped to distillation. In general, fermentors from the same series (i.e., replicates of a single treatment condition) were combined freely in the beer well, but the level in the beer well was lowered as much as possible before beer from a fermentor in another treatment series was added. An ethanol-water azeotrope (190 proof) was recovered from the head of rectifier column and whole stillage was withdrawn from the

8
bottom of the beer column. The azeotropic water was removed from the 190-proof ethanol using molecular sieves producing a 200-proof fuel-grade product.
Whole stillage was separated into thin stillage and wet cake using a decanter centrifuge as quickly as it was processed through distillation. The thin stillage was condensed in a single-stage forced-circulation evaporator into condensed distiller’s solubles, which is known in the ethanol industry as syrup. The evaporator has a hold-up volume of 800 gallons, which using the concentration ratio observed in this experiment, represents over 10,000 gallons of thin stillage. As a result, thin stillage from about 7 fermentors was mixed together in the evaporator. Therefore, the syrup produced in this study is not traceable to any one fermentor or treatment condition. Thin stillage samples were collected periodically and stored frozen until they could be analyzed. The concentrations of total solids, dissolved solids, crude protein, and residual sugars were measured in the thin stillage samples.
Wet cake from the first seven fermentors was dried in a rotary drum dryer to produce distiller’s dried grains (DDG). After syrup became available, the syrup was combined with the wet cake and dried to produce dried distiller’s grains with solubles (DDGS). In the NCERC dryer system, wet cake and syrup are continuously combined in a mixer with recycled dried product from the dryer outlet. A fraction of the dry product is diverted to the coproduct storage bin and loaded into super sacks for long-term storage.
Feedstock and Coproduct Analysis The feedstock used in this study was standard No. 2 yellow dent corn from the 2007
growing season. The composition of the whole-kernel corn was monitored periodically using near infrared reflectance (NIR) spectroscopy. At least one flour sample was collected for every treatment condition and stored frozen until it could be analyzed using NCERC standard operating procedures (SOPs). The concentrations of starch, crude protein, crude fat, crude fiber, and moisture were measured and the particle-size distribution of the corn flour was determined using these SOPs. The SOPs used in this study are listed and described briefly in Appendix A.
The concentrations of moisture, residual fermentable sugars (called “starch” here for simplicity), crude fiber, crude fat, and crude protein were measured in all wet-cake samples that were collected in this study. These same parameters, plus the particle-size distributions, were also measured in selected DDG and DDGS samples. Three DDG samples from the control fermentors (R1-R3) were selected and compared to three DDG samples from the first series of PDX fermentors (R4-R6). The same parameters were measured in three DDGS samples collected from the final series of PDX fermentors (R12-R14). The measured characteristics of the DDGS samples were compared to the characteristics of samples from the NCERC’s DDGS library, which contains samples from full-scale fuel-ethanol plants from throughout the U.S. Midwest. In addition, the concentrations of acid-detergent fiber (ADF) and neutral-detergent fiber (NDF) were measured in selected wet-cake samples. Selected thin stillage samples were analyzed to measure the concentrations of total dry solids (TS), total dissolved solids (TDS), crude protein, and residual sugars by HPLC.

9
Results Feedstock Composition
The composition of the whole-kernel corn as determined by NIR spectroscopy is compared to the composition as measured by wet-chemical or other laboratory methods in Table 3. In general, the results from laboratory analysis agree well with the NIR data. The only exception is moisture content. The differences between the two measures of moisture content may be due to either changes in the moisture of the flour during processing or storage or to differences between the moisture method that is used in the NCERC laboratory and the method that was used to calibrate the NIR spectrometer.
Table 3: Composition of the corn used in this pilot-plant study
concentration (%)* component NIR laboratory moisture† 15.7 + 0.4 12.9 + 0.7 protein‡ 9.01 + 0.09 9.82 + 0.54 starch‡ 73.1 + 0.2 74.3 + 1.8
fat‡ 4.17 + 0.08 4.00 + 0.21 fiber‡ 2.81 + 0.30
*nNIR = 18; nlab = 5 †moisture reported on as-received basis (i.e., g water/g corn as received) ‡protein, starch, fiber, and fat reported on dry basis (e.g., g protein/g dry corn)
The average particle-size distributions for flour samples collected during processing of each of the treatment conditions are shown in Figure 3. Each of the size distributions represents the average of the size distributions for three independent samples for each treatment condition. The average diameters of mean mass for each treatment condition are given in Table 4. The diameter of mean mass (DMM) is the mass-average particle size and is given by:
∑
∑=i
ii
XdX
DMM (1)
where Xi (g/g) is the mass fraction of particles with average diameter di (mm). No statistically significant differences were observed between the treatment conditions, regardless of whether the diameters of mean mass or the mass fractions in any size class were compared.
Table 4: Diameters of mean mass (DMM) for treatments investigated in this study
treatment DMM (mm) control 0.492 + 0.039
Recirculation 1 0.456 + 0.021 Recirculation 2 0.427 + 0.027
Ethanol Reactor Tower 0.475 + 0.019

10
Liquefaction The alpha-amylase enzyme used in this study (Liquozyme SC DS, Novozymes) is a double-
strength enzyme that is similar to the alpha amylase that is typically used at the NCERC except its activity is about two-fold higher. Despite correcting for the higher activity, the enzyme dose that was initially used was too high. The excessive dosage was indicated by the DE values of the slurry and mash samples (Fig. 4) relative to the target values for the slurry and mash tanks. Therefore, the enzyme dose was adjusted as described in Table 1 during processing of the slurry for fermentor R2. The change took full effect during filling of fermentor R3, and the final DE values in the slurry (TA-990) and liquefaction (TA-1220) systems were close to the target ranges.
The DE values varied with location and with treatment condition during the three series of experiments that involved PDX-treatment of the slurry. In general, the DE increased with time and with distance through the system (Fig. 5). Two of the three series involved recirculation (i.e., multiple passes) through a high-shear PDX-25 to increase the temperature of the slurry from ambient to either 84 oC (Recirculation 1) or 75 oC (Recirculation 2), which took about 2.4 and 2.2 hrs, respectively. After the slurry reached the target temperature, the flow was diverted to Tank B. For the Recirculation 1 fermentors (R4-R6), no further treatment occurred.
average diameter of size class (mm)
0.0 0.5 1.0 1.5 2.0
mas
s fr
actio
n in
siz
e cl
ass
(g/g
)
0.0
0.1
0.2
0.3
0.4
0.5
control Recirculation 1Recirculation 2Ethanol Reactor Tower
Figure 3: Flour particle-size distributions for the four treatment conditions that were
investigated in this study. The error bars represent the standard deviation of three independent flour samples for each treatment condition.

11
Recirculation 2, however, involved passing the 75-oC slurry through a low-shear PDX-47 to raise the temperature to 84 oC. The third series of experiments (i.e., the Ethanol Reactor Tower) involved once-through processing through three high-shear PDX-25 units, which raised the temperature to 75 oC, followed by processing through a low-shear PDX-47 to raise the temperature to 84 oC.
The “Tank A” samples represent the DE values that were observed during the slurry build phase. Since the slurry was prepared at a temperature well below the optimal value for Liquozyme SC (about 83 oC), little hydrolysis was expected during this phase. The “high shear” samples represent the DE values that were observed after the slurry temperature reached the target value in the two recirculation experiments or after processing by both high-shear PDX-25 units in the Ethanol Reactor Tower configuration. The “Tank B inf” samples reflect the DE that was observed after all PDX processing was complete. The time required for the slurry to be transported between the location of the “high shear” and “Tank B inf” sample ports was not measured but was very short (i.e., on the order of seconds). Therefore, the observed changes in DE between these sample locations might have been due primarily to physical processing in the PDX unit rather than to enzymatic hydrolysis. The changes that occurred in DE between the “Tank B inf” and the “mash cooler”, “Tank B eff”, and “Ferm” sample ports all reflect enzymatic hydrolysis in Tank B. The DE values measured at the mash cooler sample port were
fermentor
R1 R2 R3
DE
0
5
10
15
20
25
30TA-990 (slurry)TA-1220 (mash)
Figure 4: DE values for slurry and liquefaction systems in the control series. The target DE
ranges are indicated by the horizontal dashed lines. The target ranges were 5 to 7 for the slurry system and 11 to 13 for the liquefaction system.

12
statistically indistinguishable from the DE values measured in samples collected from the Tank B effluent sample port and the fermentors.
Saccharification Potential The saccharification potential of fully processed mash was examined using a Client-
provided protocol. Two samples were collected from the final liquefaction tank (TA-1220) for each of the control fermentors, and two to four samples were collected from after the mash cooler for each fermentor that was filled with PDX-processed material. The samples were incubated with Spirizyme Fuel (Novozymes; 0.012 ml/g mash) without shaking for 18 hours at 30 oC in a circulating water bath. The total dry solids concentration of the samples was measured gravimetrically by drying at 105 oC for 3 hrs. The concentration of glucose measured after incubation was compared to the maximum theoretical glucose concentration based on the total dry solids concentration and the measured starch concentration of the corn flour.
The saccharification potentials of the three PDX treatments are compared to the control in Figure 6. Statistically significant differences (P = 0.008; where P is the probability that the two yields are equal; if P < 0.05, the difference is statistically significant at the 95% confidence level) among the treatments and controls were identified using a one-way analysis of variance
sample location
Tank A
high shear
Tank B inf
mash cooler
Tank B effFerm
DE
0
5
10
15
20
25
30Recirculate 1Recirculate 2Ethanol Reactor Tower
Figure 5: DE values measured at different locations in the PDX-treatment process. Error
bars represent one standard deviation of the DE values measured at each sample location in three independent replicate fermentors.

13
(ANOVA). Each of the treatments were compared to the controls using Dunnett’s test. This analysis showed that the saccharification potential of the Recirculation 1 treatment (heat to 84 oC before diverting to Tank B) was not significantly different from the controls, but the Recirculation 2 (heat to 75 oC then divert to Tank B with heating by a low-shear PDX-47) and the Ethanol Reactor Tower (once-through processing by three high-shear PDX-25 units followed by a low-shear PDX-47) configurations were significantly higher than the controls at the 95% confidence level.
Fermentation Fermentation Kinetics:
The kinetics of ethanol production and total dissolved sugar consumption are compared in Figures 7 to 10 for the controls and the three PDX treatments. The total sugar concentration is expressed as the glucose-equivalent concentration, which represents the concentration of glucose that would be observed if all of the dissolved sugars were hydrolyzed to glucose in the absence of glucose consumption by yeast. The glucose equivalent concentration (Cglucose,eq) is given by: Cglucose,eq = 1.09*CDP4+ + 1.07*CDP3 + 1.05*CDP2 + Cglucose (2)
treatment
control Recirc 1 Recirc 2 ERT
hydr
olys
is e
ffici
ency
(g/g
)
0.0
0.2
0.4
0.6
0.8
1.0
1.2
* *
Figure 6: Saccharification potential of fully processed mash. Hydrolysis efficiency is the
concentration of glucose observed after incubation with Spirizyme Fuel relative to the maximum expected glucose concentration. Error bars represent one standard deviation of three independent replicate fermentors. The dashed lines represent the 95% confidence interval for comparison to the controls. Bars labeled with an asterisk are significantly different from the controls.

14
where CDP4+ is the concentration of oligomers with four or more glucosyl units, CDP3 is the concentration of oligomers with three glucosyl units (e.g., maltotriose), CDP2 is the concentration of oligomers with two glucosyl units (e.g., maltose), and Cglucose is the concentration of glucose.
The rates of sugar consumption and ethanol production were estimated by assuming zero-order (i.e., linear) kinetics. So, least-squares linear regression was used to determine the best-fit line through the quasi-linear portion of both progress curves. The slope of the best-fit line provides an estimate of the rate for each fermentor, and the average rate for each treatment was used as the basis for comparison among treatments. Example fits for one of the three replicate fermentors for each treatment are shown in Figures 7 to 10. These examples are representative of the fits obtained for the other fermentors in each treatment series. The ethanol yield for each fermentor was estimated from the final ethanol concentration and the solids loading to the fermentor.
time (hrs)
0 10 20 30 40 50 60
etha
nol c
once
ntra
tion
(g/1
00 m
l)
0
1
2
3
4
5
6
gluc
ose
equi
vale
ntco
ncen
trat
ion
(g/1
00 m
l)
0
5
10
15
20
R1R2R3
Figure 7: Progress curves for sugar consumption (top) and ethanol production (bottom) in
the control fermentors. The lines represent best fits of linear models for consumption or production of glucose and ethanol, respectively, in fermentor R3. The horizontal line after 30 hours in the bottom panel shows the average final concentration of ethanol that was used to calculate the ethanol yield for R3.

15
In general, the three replicate fermentors for each treatment series behaved similarly. The only exception was for the Recirculation 2 treatment series, in which the three fermentors exhibited somewhat different sugar-consumption kinetics and final ethanol concentrations. These differences among replicates probably reflect processing problems that developed during this treatment series. Specifically, the surge feeder, which is located between the hammer mill and the slurry mixer, bridged sometime during the slurry-build phase for fermentor R7. This problem was discovered and fixed before beginning run R9, but it caused the solids loading to fermentors R7 and R8 to be lower than intended. Therefore, the three replicates for this
time (hrs)
0 10 20 30 40 50
etha
nol c
once
ntra
tion
(g/1
00 m
l)
0
1
2
3
4
5
6
gluc
ose
equi
vale
ntco
ncen
trat
ion
(g/1
00 m
l)
0
5
10
15
20R4R5 R6
Figure 8: Progress curves for sugar consumption (top) and ethanol production (bottom) in
the fermentors filled with material processed using the Recirculation 1 treatment. The lines represent best fits of linear models for consumption or production of glucose and ethanol, respectively, in fermentor R5. The horizontal line after 25 hours in the bottom panel shows the average final concentration of ethanol that was used to calculate the ethanol yield for R5.

16
treatment series were more different from each other than were the replicates in any other treatment series.
The average rates of sugar consumption and ethanol production for the controls and the three PDX treatments are compared in Table 5. The lag times that preceded the start of fermentation were also estimated using a zero-order kinetics model, and the average values for each of the treatments and controls are shown in Table 5. Although the rates of sugar consumption in the fermentors that were filled with PDX-processed material are generally faster than the rates observed in the control fermentors, these differences among the treatments were not statistically significant (P = 0.17) based on a one-way ANOVA. The rates of ethanol production, however, were significantly different among the treatments (P = 0.04). A least-
gluc
ose
equi
vale
ntco
ncen
trat
ion
(g/1
00 m
l)
0
5
10
15
20
time (hrs)
0 10 20 30 40 50 60
etha
nol c
once
ntra
tion
(g/1
00 m
l)
0
1
2
3
4
5
6
R7R8R9
Figure 9: Progress curves for sugar consumption (top) and ethanol production (bottom) in
the fermentors filled with material processed using the Recirculation 2 treatment. The lines represent best fits of linear models for consumption or production of glucose and ethanol, respectively, in fermentor R8. The horizontal line after 25 hours in the bottom panel shows the average final concentration of ethanol that was used to calculate the ethanol yield for R8.

17
significant difference (LSD) test showed that the rates were faster in fermentors containing PDX-processed material than in the controls but that the PDX treatments were not significantly different from each other. On average, the rate of ethanol production was about 30% faster in fermentors containing PDX-processed material. Although the lag times appeared to be generally shorter in fermentors containing PDX processed material, those differences were not statistically significant (P = 0.13). Regardless of whether the effects of PDX treatment on sugar consumption rate and lag time were statistically significant, however, Figures 7 to 10 clearly show that the fermentors containing PDX-processed material were finished (i.e., reached stationary phase) faster than the control fermentors. Ethanol production in the control fermentors appeared to be complete after about 30 hrs, but it was complete after between 20 to 25 hours in the fermentors containing PDX-processed material.
time (hrs)
0 10 20 30 40 50
etha
nol c
once
ntra
tion
(g/1
00 m
l)
0
1
2
3
4
5
6
gluc
ose
equi
vale
ntco
ncen
trat
ion
(g/1
00 m
l)
0
5
10
15
20
R12R13R14
Figure 10: Progress curves for sugar consumption (top) and ethanol production (bottom) in
the fermentors filled with material processed using the Ethanol Reactor Tower treatment configuration. The lines represent best fits of linear models for consumption or production of glucose and ethanol, respectively, in fermentor R14. The horizontal line after 25 hours in the bottom panel shows the average final concentration of ethanol that was used to calculate the ethanol yield for R14.

18
Table 5: Comparison of the rates of sugar consumption, ethanol production, and lag times among treatments and controls
treatment sugar consumption rate
(%-hr-1) ethanol production rate
(%-hr-1) lag time (hrs) control 0.536 + 0.008 0.228 + 0.004 5.93 + 0.27
Recirculation 1 0.652 + 0.014 0.304 + 0.013* 5.68 + 0.26
Recirculation 2 0.588 + 0.094 0.289 + 0.040* 5.75 + 1.04
ERT 0.691 + 0.109 0.277 + 0.020* 4.69 + 0.25 *significantly greater than the control at the 95% confidence level
Ethanol Yield: The ethanol yield for each fermentor was calculated based on the ratio of the total mass of
ethanol produced to the mass of corn introduced into the fermentor. The mass of corn added to each fermentor was based on the fill mass as measured by the wort meter, which is a Coriolis-type mass-flow meter, and the total dry solids concentration measured in the mash as close as possible to the fermentor. For the control fermentors, this was measured in samples collected from the final liquefaction tank (TA-1220). For the PDX treatments, this was given by an average of the concentrations measured in samples collected from the mash cooler sample port (immediately upstream of the wort meter), the Tank B effluent sample port (on the discharge side of the Moyno pump used to transfer mash from Tank B to the mash cooler), and/or directly from a filled fermentor prior to inoculation (fermentors R12-R14). The mass of ethanol produced was given by the final concentration of ethanol in the beer when fermentation was complete (Figs. 7 to 10) and the volume of beer. The volume of beer was estimated from a mass balance that included water, ethanol, and nonvolatile dissolved solids in the fermentor. This mass balance considers water lost due to starch hydrolysis and the volume changes that occur due to mixing of ethanol and water.
The volume of beer, Vbeer (ml), at the end of fermentation is given by the sum of the volume of water, Vwater (ml), the volume of ethanol, VEtOH (ml), the volume of dissolved solids, Vds (ml), and the change in volume that occurs when ethanol and water mix, ∆Vmix (ml):
Vbeer = Vwater + VEtOH + Vds + ∆Vmix (3)
where ∆Vmix is the difference between the total volume of the ethanol-water mixture. The complete derivation is given in Appendix B, but the result is:
−
−+
+=
ds
mixdsEtOHmix
cornwater,owater,beer
ρρC
C11.11*0.511
0.11ρ
M MV (4)
where Mwater,o is the mass of process water added to the fermentor, Mwater,corn is the mass of water that enters the fermentor as corn, ρmix is the density of the ethanol-water mixture at 30 oC, CEtOH is the final concentration of ethanol, Cds is the concentration of nonvolatile dissolved solids, and ρds is the density of the nonvolatile dissolved solids. The constants represent the mass of water consumed by starch hydrolysis per unit mass of starch that is hydrolyzed (0.11), the mass of

19
glucose produced per unit mass of starch that is hydrolyzed (1.11), and the mass of ethanol produced per unit mass of glucose that is consumed (0.511). The density of dissolved solids is assumed to be similar to the density of protein (about 1.2 g/ml). The elements of the mass balance and the final ethanol yield for each fermentor are shown in Table 6.
Table 6: Fermentor mass balances
fermentor mass dry solids
(lbs)
final ethanol concentration
(lbs/gal) beer volume
(gals) mass ethanol
(lbs) ethanol yield
(lbs/lb dry corn) R1 2188 0.488 1422 694 0.317 R2 2109 0.460 1436 660 0.313 R3 2122 0.469 1455 682 0.321 R4 2015 0.472 1476 697 0.346 R5 2109 0.437 1526 667 0.316 R6 2005 0.467 1535 717 0.358 R7 1562 0.349 1554 542 0.347 R8 1487 0.388 1325 514 0.346 R9 2074 0.470 1508 710 0.342 R12 2040 0.482 1448 698 0.342 R13 2118 0.478 1536 734 0.347 R14 2008 0.487 1454 708 0.353
The average yields for each treatment are compared in Figure 11. The differences among treatments were statistically significant based on a one-way ANOVA (P = 0.04). The LSD test demonstrated that the ethanol yields in fermentors containing PDX-processed material were significantly greater than the yields in the controls, but their were no significant differences among the PDX treatments. Overall, the ethanol yields of fermentors containing PDX-processed material were, on average, 8.5% higher than the ethanol yield of the control fermentors, with the yield increases for different PDX configurations ranging from an average of 7.2% (Recirculation 1) to an average of 9.5% (ERT). Note that, although no attempt was made to measure it in this study, increased ethanol yield from PDX-processed material could result in a corresponding decrease in the yield of DDGS due to more extensive conversion of starch.

20
Coproduct Characteristics Chemical Composition:
The effect of PDX processing on the chemical composition of fermentation coproducts was evaluated by measuring the concentrations of total dry solids, residual fermentable sugars (“starch”), crude protein, crude fat, and crude fiber. The average concentrations for all five component are shown in Figure 12 for each of the four treatments. Analysis of variance showed that there are no differences among the treatments for moisture, crude protein, crude fat, and crude fiber, but significant differences were observed for starch. The LSD tests indicated that the wet cake produced from fermentors containing PDX-processed material had a higher concentration of residual fermentable sugars than did the control fermentors, but the wet cake from the PDX treatments were not different from each other. Higher concentrations of residual fermentable sugars in the coproducts appears to be inconsistent with higher ethanol yields, and these observations certainly deserve further investigation. It is important to recall, however, that these two measurements are completely independent, and it might be unreasonable to expect them to be in complete agreement. For example, the differences between the starch
treatment
control Recirc 1 Recirc 2 ERT
etha
nol y
ield
(g/g
dry
cor
n)
0.0
0.1
0.2
0.3
0.4
A
B B B
Figure 11: Comparison of ethanol yields among PDX treatments and controls. The ethanol
yields were estimated using the data shown in Table 6. Error bars represent one standard deviation of three independent replicate fermentors. Treatments labeled with the same letter are not significantly different from each other at the 95% confidence level.

21
moi
stur
e(g
/g to
tal)
0.00
0.25
0.50
0.75
1.00
star
ch(g
/g d
ry)
0.00
0.01
0.02
0.03
0.04
crud
e pr
otei
n(g
/g d
ry)
0.00
0.10
0.20
0.30
0.40
0.50
treatment
control Recirc 1 Recirc 2 ERT
crud
e fa
t(g
/g d
ry)
0.00
0.02
0.04
0.06
0.08
A
B B B
crud
e fib
er(g
/g d
ry)
0.00
0.02
0.04
0.06
Figure 12: Chemical composition of wet cake produced from each treatment condition in
this study. Error bars represent one standard deviation of three independent replicate fermentors for each treatment. Bars labeled with the same letter are not significantly different from each other at the 95% confidence level.

22
concentrations in wet cake from the PDX treatments and controls are statistically significant, but they represent a small fraction of the total starch available in the incoming corn. Small changes in the biomass yield between the treatment and control fermentors or errors in estimating the solids loading to the fermentor could affect the estimates of ethanol yield independently of the concentration of residual fermentable sugars in the wet cake.
Since the differences among wet cake samples produced from fermentors containing material that was processed by different PDX treatments were not statistically significant, the overall average values for these parameters are summarized in Table 7 and compared to the NCERC controls and average values for wet cake as reported in the DDGS User Handbook (U.S. Grains Council). Overall, the data from this study agree well with the “typical” values cited by the U.S. Grains Council except that the protein concentration in the samples from this study may be a little high.
Table 7: Comparison of wet cake composition to “typical” values
concentration (g/100 g) parameter PDX treatments NCERC controls U.S. Grains Council dry solids* 30.8 + 4.0 29.0 + 0.5 33.7 to 34.9
crude protein† 37.4 + 3.0 41.3 + 2.6 31.3 to 36.0
crude fiber† 10.0 + 0.8 10.0 + 0.2 8.2 to 9.9
crude fat† 5.5 + 0.6 6.1 + 0.9 2.1 to 10.1
starch† 3.3 + 0.4 2.0 + 0.3 not reported *dry solids concentration is reported on a total mass (i.e., as-is) basis †concentrations are reported on a dry matter basis
In addition to the parameters shown in Figure 12, a small subset of wet cake samples were also analyzed for acid-detergent fiber (ADF) and neutral-detergent fiber (NDF) content. ADF is a measure of the concentration of cellulose plus lignin, and NDF is a measure of the concentration of ADF plus hemicellulose. ADF and NDF were measured in wet-cake samples collected from the control fermentors (R1-R3) and the Ethanol Reactor Tower fermentors (R12-R14). The results are shown in Figure 13. The differences between the two treatments are not significantly different from each other (P > 0.33). No values for the ADF and NDF content of wet cake or DDG are available from the literature for comparison, but it seems reasonable to assume that most of the fiber comes into DDGS in the wet cake. If this is true, the expected concentrations of ADF and NDF in DDGS would be about 19% and 35%, respectively, which are similar to values reported in the literature (ADF = 14 to 17% and NDF = 35 to 39%) (e.g., Cromwell et al., 1993; U.S. Grains Council, 2006; Belyea et al., 2004). These expected concentrations were estimated by assuming that DDGS would be prepared using a 3:1 wet cake to syrup ratio (based on dry solids).
Finally, the concentrations of moisture, crude protein, crude fiber, crude fat, and residual fermentable sugars was measured in three DDGS samples that were produced during back-end processing of beer from fermentors containing material that was processed using the Ethanol Reactor Tower treatment. These results are reported in Table 8 and are compared to “typical”

23
values as reported by the U.S. Grains Council in the DDGS User Handbook and Belyea et al. (2004). The Belyea study included samples collected monthly from a single dry-grind ethanol plant over a five-year period from 1997 to 2001. The values measured in the DDGS samples collected in this study are consistent with the values reported in the literature.
Table 8: Composition of DDGS produced from PDX-processed corn slurry
concentration (g/100 g) parameter PDX treatments U.S. Grains Council (2006) Belyea et al. (2004)‡ moisture* 14.7 + 4.2 11 not reported
crude protein† 27.8 + 1.8 27.2 31.3 + 0.2
crude fiber† 9.2 + 0.2 not reported 10.2 + 1.2
crude fat† 12.0 + 1.4 9.5 11.9 + 0.1
starch† 3.7 + 0.4 not reported 5.1 + 0.3 *dry solids concentration is reported on a total mass basis †concentrations are reported on a dry matter basis ‡Belyea et al. 2004. Bioresource Technology 94: 293-298.
treatment
control ERT
AD
F or
ND
F (g
/g d
ry)
0.0
0.1
0.2
0.3
0.4
0.5
0.6
ADF NDF
Figure 13: Concentrations of acid-detergent fiber (ADF) and neutral-detergent fiber (NDF)
in wet cake samples from the control and Ethanol Reactor Tower (ERT) fermentors.

24
Particle-Size Distributions: The particle-size distributions of DDG and DDGS were measured to determine whether
PDX treatment affected the size of the residual solids fraction remaining after fermentation. This was evaluated by comparing the size distribution of DDG produced from the control fermentors to that of DDG produced from fermentors containing PDX-processed material. In addition, the size distribution of DDGS produced from residual solids from the Ethanol Reactor Tower fermentors was compared to the size distributions of DDGS from the NCERC library of samples that were collected from 38 plants throughout the U.S. Midwest. The results are shown in Figure 14, and the diameters of mean mass (DMM) for each type of DDG(S) are summarized in Table 9. Although the size distribution of DDG from the PDX treatment appears to be shifted slightly to smaller particles than DDG from the control fermentors and the DMM is slightly smaller, the
mas
s fr
actio
n in
siz
e cl
ass
(g/g
)
0.0
0.1
0.2
0.3
0.4
0.5
0.6
DDG (control) DDG (Recirc. 1)
average diameter of size class (mm)
0.0 0.5 1.0 1.5 2.00.0
0.1
0.2
0.3
0.4
0.5 DDGS (ERT)DDGS (NCERC library)
Figure 14: Particle-size distributions of DDG (top panel) and DDGS (bottom panel)
produced during this study. The average particle-size distribution of samples in the NCERC DDGS library is also shown in the bottom panel. Error bars represent one standard deviation of independent replicates (i.e., samples from different fermentors or different plants).

25
differences are not statistically significant. Conversely, the size distribution of DDGS produced from PDX-treated material is shifted toward larger particles and the DMM is slightly larger than the average of the samples in the NCERC DDGS library. Again, however, the differences are not statistically significant. Therefore, this study provided no evidence that PDX processing produces significantly smaller DDG or DDGS particles than does conventional processing.
Table 9: Diameters of mean mass (DMM) for DDG and DDGS produced during this study
material source DMM (mm) P*
DDG control 1.00 + 0.39
0.51 Recirculation 1 0.83 + 0.18
DDGS Ethanol Reactor Tower 1.26 + 0.34
0.11 NCERC library 1.00 + 0.26
*P is the probability that the DMM for DDG(S) produced from PDX-processed material is the same as the material to which it is being compared; P > 0.05 indicates that the two values are not significantly different at the 95% confidence interval
Thin Stillage: The composition of thin stillage was examined to determine whether any changes occurred
that could be attributed to PDX processing. In particular, changes in the total or suspended solids concentrations could indicate whether PDX processing produced fine particles that cannot be easily separated by centrifugation. In addition, the thin stillage was analyzed by HPLC to determine whether residual soluble sugars were present (e.g., from hydrolysis of hemicellulose) and for crude protein by the standard combustion procedure. With the exception of a peak at the location of DP4+, there were no sugar peaks in the thin stillage chromatograms. The DP4+ peak was close to the detection limit. The observed aqueous-phase crude protein concentrations were also close to the detection limit. The concentrations of each parameter that were measured in thin stillage are shown in Figure 15. Except for the concentration of DP4+ (P = 0.031), none of these parameters were significantly different among treatments (P > 0.22). The concentration of DP4+ in thin stillage produced by fermentors containing material processed by the Ethanol Reactor Tower configuration was lower than the concentration of DP4+ in thin stillage from fermentors filled with material processed by the first recirculation protocol (i.e., heat to 84 oC then divert). The other treatments were not different from any other treatment, including the Ethanol Reactor Tower and Recirculation 1 treatments. So, despite the presence of significant differences in the DP4+ concentrations among the treatments, no systematic trends associated with PDX processing are apparent based on any of these parameters.

26
Conclusions In this pilot-plant trial, the performance of the PDX treatment process was evaluated by
comparison to the standard NCERC cooking and liquefaction process. Three configurations involving PDX processing were tested: two recirculation configurations and a once-through configuration (the Ethanol Reactor Tower process). The ethanol yield of all three PDX processes was significantly greater (P = 0.04) than the ethanol yield of the standard NCERC process (control). The rate of ethanol production in fermentors containing PDX-processed material was also significantly faster than the controls (P = 0.04). Finally, the saccharification potential of two of the three configurations (Recirculation 2 and Ethanol Reactor Tower) was
thin
stil
lage
sol
ids
conc
entr
atio
n (g
/g)
0.000
0.005
0.010
0.015
0.020
0.025total solids suspended solids
treatment
control Recirc. 1 Recirc. 2 ERT
aque
ous-
phas
eco
ncen
trat
ion
(g/m
l)
0.0000
0.0025
0.0050
crude protein DP4+
A,B A
B
A,B
Figure 15: Concentrations of total solids, suspended solids, protein, and DP4+ in thin
stillage produced from fermentors containing material that was processed by the standard NCERC process (“control”) and the three PDX treatments that were tested in this study.

27
significantly greater than the controls (P = 0.008). These results suggest that PDX processing may activate a larger fraction of the available starch than the conventional jet-cooking process.
The effects of PDX processing on the chemical and physical properties of the nonfermentable coproducts were also investigated, but other than a slightly higher concentration of residual fermentable sugars, no systematic differences between PDX-processed material and the control process could be discerned. DDGS produced from fermentors containing material processed by the Ethanol Reactor Tower configuration had a chemical composition that was similar to conventional DDGS as described in the industry literature. The particle size distribution of this DDGS was within the range of values that are represented in samples contained in the NCERC DDGS library, which contains samples from 38 full-scale fuel-ethanol plants in the U.S. Midwest.