Embed Size (px)
Citation preview
293
13c h a p t e r
National Income Accounting and the Balance of Payments
Between 2004 and 2007, the world economy boomed, its total real productgrowing at an annual average rate of nearly 5 percent per year. The growthrate of world production slowed to around 3 percent per year in 2008, before
dropping to minus 0.6 percent in 2009—a reduction in world output unprecedentedin the period since World War II. These aggregate patterns mask sharp differencesamong individual countries. Some, such as China, slowed relatively modestly in2008, while the output of other countries, such as the United States, contractedsharply. Can economic analysis help us to understand the behavior of the globaleconomy and the reasons why individual countries’ fortunes often differ?
Previous chapters have been concerned primarily with the problem of makingthe best use of the world’s scarce productive resources at a single point in time.The branch of economics called microeconomics studies this problem from theperspective of individual firms and consumers. Microeconomics works “from thebottom up” to show how individual economic actors, by pursuing their own inter-ests, collectively determine how resources are used. In our study of internationalmicroeconomics, we have learned how individual production and consumptiondecisions produce patterns of international trade and specialization. We have alsoseen that while free trade usually encourages efficient resource use, governmentintervention or market failures can cause waste even when all factors of produc-tion are fully employed.
With this chapter we shift our focus and ask: How can economic policyensure that factors of production are fully employed? And what determines howan economy’s capacity to produce goods and services changes over time? Toanswer these questions, we must understand macroeconomics, the branch ofeconomics that studies how economies’ overall levels of employment, produc-tion, and growth are determined. Like microeconomics, macroeconomics isconcerned with the effective use of scarce resources. But while microeconomicsfocuses on the economic decisions of individuals, macroeconomics analyzesthe behavior of an economy as a whole. In our study of international macroeco-nomics, we will learn how the interactions of national economies influence theworldwide pattern of macroeconomic activity.
Exch
ange R
ates and O
pen-E
conom
y Macroecon
omics
part three
M13_KRUG6654_09_SE_C13.QXD 10/21/10 10:57 PM Page 293
294 PART THREE Exchange Rates and Open-Economy Macroeconomics
Macroeconomic analysis emphasizes four aspects of economic life that, untilnow, we have usually kept in the background to simplify our discussion of inter-national economics:
1. Unemployment. We know that in the real world, workers may be unemployedand factories may be idle. Macroeconomics studies the factors that causeunemployment and the steps governments can take to prevent it. A main con-cern of international macroeconomics is the problem of ensuring full employ-ment in economies open to international trade.
2. Saving. In earlier chapters we usually assumed that every country consumes anamount exactly equal to its income—no more and no less. In reality, though,households can put aside part of their income to provide for the future, or theycan borrow temporarily to spend more than they earn. A country’s saving orborrowing behavior affects domestic employment and future levels of nationalwealth. From the standpoint of the international economy as a whole, theworld saving rate determines how quickly the world stock of productive capitalcan grow.
3. Trade imbalances. As we saw in earlier chapters, the value of a country’simports equals the value of its exports when spending equals income. Thisstate of balanced trade is seldom attained by actual economies, however. Inthe following chapters, trade imbalances play a large role because they redis-tribute wealth among countries and are a main channel through which onecountry’s macroeconomic policies affect its trading partners. It should be nosurprise, therefore, that trade imbalances, particularly when they are largeand persistent, quickly can become a source of international discord.
4. Money and the price level. The trade theory you have studied so far is abarter theory, one in which goods are exchanged directly for other goods onthe basis of their relative prices. In practice, it is more convenient to usemoney—a widely acceptable medium of exchange—in transactions, and toquote prices in terms of money. Because money changes hands in virtuallyevery transaction that takes place in a modern economy, fluctuations in thesupply of money or in the demand for it can affect both output and employ-ment. International macroeconomics takes into account that every countryuses a currency and that a monetary change (for example, a change inmoney supply) in one country can have effects that spill across its borders toother countries. Stability in money price levels is an important goal of inter-national macroeconomic policy.
This chapter takes the first step in our study of international macroeconomics byexplaining the accounting concepts economists use to describe a country’s level ofproduction and its international transactions. To get a complete picture of themacroeconomic linkages among economies that engage in international trade, wehave to master two related and essential tools. The first of these tools, nationalincome accounting, records all the expenditures that contribute to a country’sincome and output. The second tool, balance of payments accounting, helps us
M13_KRUG6654_09_SE_C13.QXD 10/21/10 10:57 PM Page 294
CHAPTER 13 National Income Accounting and the Balance of Payments 295
keep track of both changes in a country’s indebtedness to foreigners and thefortunes of its export- and import-competing industries. The balance of paymentsaccounts also show the connection between foreign transactions and nationalmoney supplies.
LEARNING GOALS
After reading this chapter, you will be able to:
• Discuss the concept of the current account balance.• Use the current account balance to extend national income accounting to
open economies.• Apply national income accounting to the interaction of saving, investment,
and net exports.• Describe the balance of payments accounts and explain their relationship to
the current account balance.• Relate the current account to changes in a country’s net foreign wealth.
The National Income AccountsOf central concern to macroeconomic analysis is a country’s gross national product(GNP), the value of all final goods and services produced by the country’s factors of pro-duction and sold on the market in a given time period. GNP, which is the basic measure ofa country’s output studied by macroeconomists, is calculated by adding up the marketvalue of all expenditures on final output. GNP therefore includes the value of goods likebread sold in a supermarket and textbooks sold in a bookstore, as well as the value of serv-ices provided by stock brokers and plumbers. Because output cannot be produced withoutthe aid of factor inputs, the expenditures that make up GNP are closely linked to theemployment of labor, capital, and other factors of production.
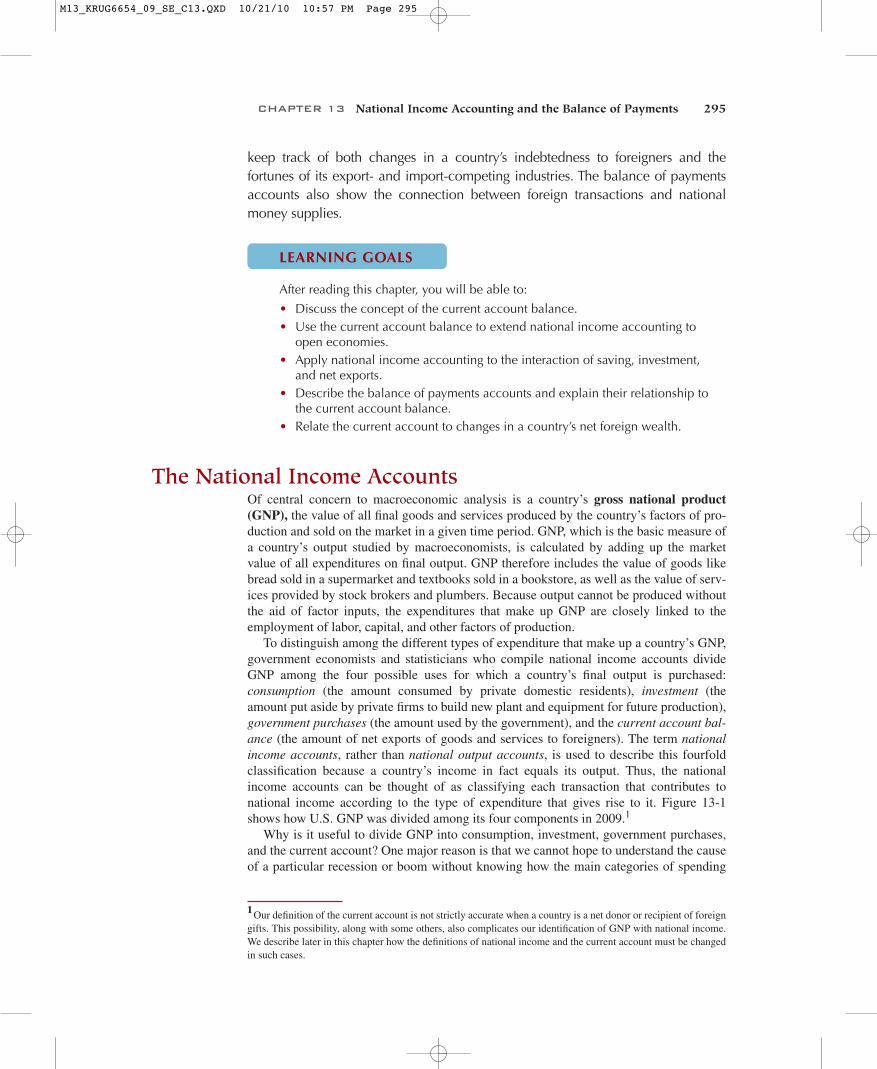
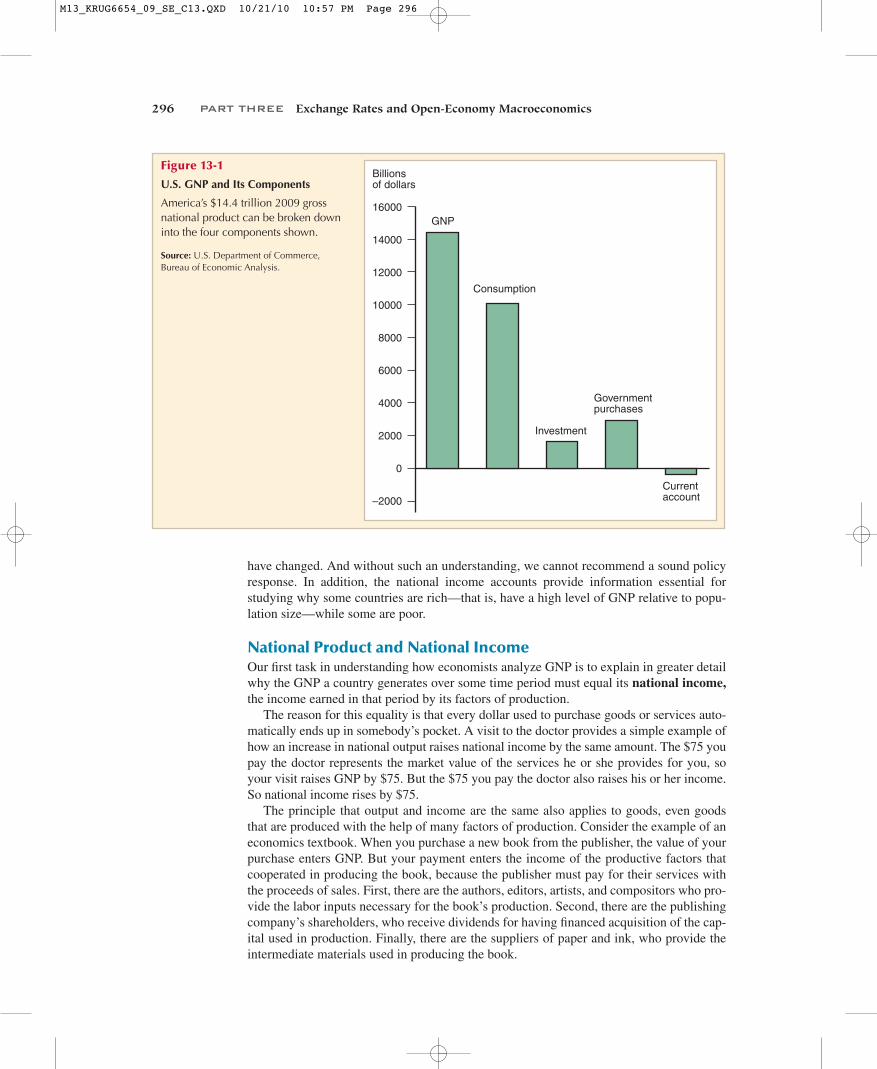
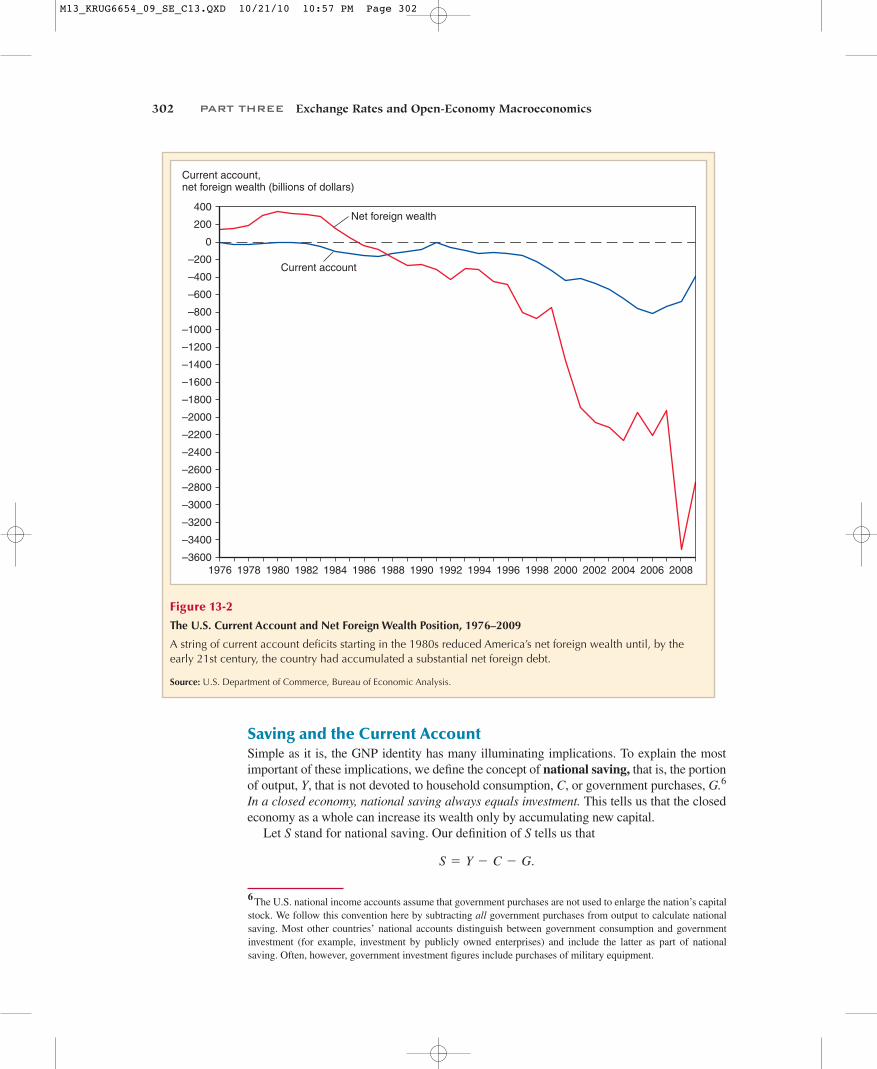
To distinguish among the different types of expenditure that make up a country’s GNP,government economists and statisticians who compile national income accounts divideGNP among the four possible uses for which a country’s final output is purchased:consumption (the amount consumed by private domestic residents), investment (theamount put aside by private firms to build new plant and equipment for future production),government purchases (the amount used by the government), and the current account bal-ance (the amount of net exports of goods and services to foreigners). The term nationalincome accounts, rather than national output accounts, is used to describe this fourfoldclassification because a country’s income in fact equals its output. Thus, the nationalincome accounts can be thought of as classifying each transaction that contributes tonational income according to the type of expenditure that gives rise to it. Figure 13-1shows how U.S. GNP was divided among its four components in 2009.1
Why is it useful to divide GNP into consumption, investment, government purchases,and the current account? One major reason is that we cannot hope to understand the causeof a particular recession or boom without knowing how the main categories of spending
1 Our definition of the current account is not strictly accurate when a country is a net donor or recipient of foreigngifts. This possibility, along with some others, also complicates our identification of GNP with national income.We describe later in this chapter how the definitions of national income and the current account must be changedin such cases.
M13_KRUG6654_09_SE_C13.QXD 10/21/10 10:57 PM Page 295
296 PART THREE Exchange Rates and Open-Economy Macroeconomics
Billionsof dollars
12000
16000
0
–2000
2000
4000
6000
8000
10000
GNP
Consumption
Investment
14000
Currentaccount
Governmentpurchases
Figure 13-1
U.S. GNP and Its Components
America’s $14.4 trillion 2009 grossnational product can be broken downinto the four components shown.
Source: U.S. Department of Commerce,Bureau of Economic Analysis.
have changed. And without such an understanding, we cannot recommend a sound policyresponse. In addition, the national income accounts provide information essential forstudying why some countries are rich—that is, have a high level of GNP relative to popu-lation size—while some are poor.
National Product and National IncomeOur first task in understanding how economists analyze GNP is to explain in greater detailwhy the GNP a country generates over some time period must equal its national income,the income earned in that period by its factors of production.
The reason for this equality is that every dollar used to purchase goods or services auto-matically ends up in somebody’s pocket. A visit to the doctor provides a simple example ofhow an increase in national output raises national income by the same amount. The $75 youpay the doctor represents the market value of the services he or she provides for you, soyour visit raises GNP by $75. But the $75 you pay the doctor also raises his or her income.So national income rises by $75.
The principle that output and income are the same also applies to goods, even goodsthat are produced with the help of many factors of production. Consider the example of aneconomics textbook. When you purchase a new book from the publisher, the value of yourpurchase enters GNP. But your payment enters the income of the productive factors thatcooperated in producing the book, because the publisher must pay for their services withthe proceeds of sales. First, there are the authors, editors, artists, and compositors who pro-vide the labor inputs necessary for the book’s production. Second, there are the publishingcompany’s shareholders, who receive dividends for having financed acquisition of the cap-ital used in production. Finally, there are the suppliers of paper and ink, who provide theintermediate materials used in producing the book.
M13_KRUG6654_09_SE_C13.QXD 10/21/10 10:57 PM Page 296
CHAPTER 13 National Income Accounting and the Balance of Payments 297
The paper and ink purchased by the publishing house to produce the book are notcounted separately in GNP because their contribution to the value of national output isalready included in the book’s price. It is to avoid such double counting that we allow onlythe sale of final goods and services to enter into the definition of GNP. Sales of intermedi-ate goods, such as paper and ink purchased by a publisher, are not counted. Notice alsothat the sale of a used textbook does not enter GNP. Our definition counts only final goodsand services that are produced, and a used textbook does not qualify: It was counted inGNP at the time it was first sold. Equivalently, the sale of a used textbook does not gener-ate income for any factor of production.
Capital Depreciation and International TransfersBecause we have defined GNP and national income so that they are necessarily equal,their equality is really an identity. Two adjustments to the definition of GNP must bemade, however, before the identification of GNP and national income is entirely correct inpractice.
1. GNP does not take into account the economic loss due to the tendency of machineryand structures to wear out as they are used. This loss, called depreciation, reduces theincome of capital owners. To calculate national income over a given period, we musttherefore subtract from GNP the depreciation of capital over the period. GNP lessdepreciation is called net national product (NNP).
2. A country’s income may include gifts from residents of foreign countries, calledunilateral transfers. Examples of unilateral transfers of income are pension paymentsto retired citizens living abroad, reparation payments, and foreign aid such as relieffunds donated to drought-stricken nations. For the United States in 2009, the balanceof such payments amounted to around –$130.2 billion, representing a 0.9 percent ofGNP net transfer to foreigners. Net unilateral transfers are part of a country’s incomebut are not part of its product, and they must be added to NNP in calculations ofnational income.
National income equals GNP less depreciation plus net unilateral transfers. The differ-ence between GNP and national income is by no means an insignificant amount, butmacroeconomics has little to say about it, and it is of little importance for macroeconomicanalysis. Therefore, for the purposes of this text, we usually use the terms GNP andnational income interchangeably, emphasizing the distinction between the two only whenit is essential.2
Gross Domestic ProductMost countries other than the United States have long reported gross domestic product(GDP) rather than GNP as their primary measure of national economic activity. In 1991 theUnited States began to follow this practice as well. GDP is supposed to measure the volumeof production within a country’s borders, whereas GNP equals GDP plus net receipts of fac-tor income from the rest of the world. These net receipts are primarily the income domestic
2 Strictly speaking, government statisticians refer to what we have called “national income” as national disposableincome. Their official concept of national income omits foreign net unilateral transfers. Once again, however, thedifference between national income and national disposable income is usually unimportant for macroeconomicanalysis. Unilateral transfers are alternatively referred to as secondary income payments to distinguish them fromprimary income payments consisting of cross-border wage and investment income. We will see this terminologybelow when we study balance of payments accounting.
M13_KRUG6654_09_SE_C13.QXD 10/21/10 10:57 PM Page 297
298 PART THREE Exchange Rates and Open-Economy Macroeconomics
residents earn on wealth they hold in other countries less the payments domestic residentsmake to foreign owners of wealth that is located in the domestic country.
GDP does not correct, as GNP does, for the portion of countries’ production carried outusing services provided by foreign-owned capital. Consider an example: The earnings of aSpanish factory with British owners are counted in Spain’s GDP but are part of Britain’s GNP.The services British capital provides in Spain are a service export from Britain, therefore theyare added to British GDP in calculating British GNP. At the same time, to figure Spain’s GNP,we must subtract from its GDP the corresponding service import from Britain.
As a practical matter, movements in GDP and GNP usually do not differ greatly. Wewill focus on GNP in this book, however, because GNP tracks national income moreclosely than GDP does, and national welfare depends more directly on national incomethan on domestic product.
National Income Accounting for an Open EconomyIn this section we extend to the case of an open economy the closed-economy nationalincome accounting framework you may have seen in earlier economics courses. We beginwith a discussion of the national income accounts because they highlight the key role ofinternational trade in open-economy macroeconomic theory. Since a closed economy’sresidents cannot purchase foreign output or sell their own to foreigners, all of nationalincome must be allocated to domestic consumption, investment, or government purchases.In an economy open to international trade, however, the closed-economy version ofnational income accounting must be modified because some domestic output is exportedto foreigners while some domestic income is spent on imported foreign products.
The main lesson of this section is the relationship among national saving, investment,and trade imbalances. We will see that in open economies, saving and investment are notnecessarily equal, as they are in a closed economy. This occurs because countries can savein the form of foreign wealth by exporting more than they import, and they can dissave—that is, reduce their foreign wealth—by exporting less than they import.
ConsumptionThe portion of GNP purchased by private households to fulfill current wants is calledconsumption. Purchases of movie tickets, food, dental work, and washing machines allfall into this category. Consumption expenditure is the largest component of GNP in mosteconomies. In the United States, for example, the fraction of GNP devoted to consumptionhas fluctuated in a range from about 62 to 70 percent over the past 60 years.
InvestmentThe part of output used by private firms to produce future output is called investment.Investment spending may be viewed as the portion of GNP used to increase the nation’sstock of capital. Steel and bricks used to build a factory are part of investment spending, asare services provided by a technician who helps build business computers. Firms’ pur-chases of inventories are also counted in investment spending because carrying inventoriesis just another way for firms to transfer output from current use to future use.
Investment is usually more variable than consumption. In the United States, (gross) invest-ment has fluctuated between 11 and 22 percent of GNP in recent years. We often use the wordinvestment to describe individual households’ purchases of stocks, bonds, or real estate, butyou should be careful not to confuse this everyday meaning of the word with the economicdefinition of investment as a part of GNP. When you buy a share of Microsoft stock, you arebuying neither a good nor a service, so your purchase does not show up in GNP.
M13_KRUG6654_09_SE_C13.QXD 10/21/10 10:57 PM Page 298
CHAPTER 13 National Income Accounting and the Balance of Payments 299
Government PurchasesAny goods and services purchased by federal, state, or local governments are classified asgovernment purchases in the national income accounts. Included in government purchasesare federal military spending, government support of cancer research, and governmentfunds spent on highway repair and education. Government purchases include investment aswell as consumption purchases. Government transfer payments such as social security andunemployment benefits do not require the recipient to give the government any goods or serv-ices in return. Thus, transfer payments are not included in government purchases.
Government purchases currently take up about 20 percent of U.S. GNP, and this share hasnot changed much since the late 1950s. (The corresponding figure for 1959, for example, wasaround 20 percent.) In 1929, however, government purchases accounted for only 8.5 percentof U.S. GNP.
The National Income Identity for an Open EconomyIn a closed economy, any final good or service that is not purchased by households or thegovernment must be used by firms to produce new plant, equipment, and inventories. Ifconsumption goods are not sold immediately to consumers or the government, firms(perhaps reluctantly) add them to existing inventories, thereby increasing their investment.
This information leads to a fundamental identity for closed economies. Let Y stand for GNP,C for consumption, I for investment, and G for government purchases. Since all of a closedeconomy’s output must be consumed, invested, or bought by the government, we can write
We derived the national income identity for a closed economy by assuming that alloutput is consumed or invested by the country’s citizens or purchased by its government.When foreign trade is possible, however, some output is purchased by foreigners whilesome domestic spending goes to purchase goods and services produced abroad. The GNPidentity for open economies shows how the national income a country earns by selling itsgoods and services is divided between sales to domestic residents and sales to foreignresidents.
Since residents of an open economy may spend some of their income on imports, thatis, goods and services purchased from abroad, only the portion of their spending that is notdevoted to imports is part of domestic GNP. The value of imports, denoted by IM, must besubtracted from total domestic spending, , to find the portion of domesticspending that generates domestic national income. Imports from abroad add to foreigncountries’ GNPs but do not add directly to domestic GNP.
Similarly, the goods and services sold to foreigners make up a country’s exports.Exports, denoted by EX, are the amount foreign residents’ purchases add to the nationalincome of the domestic economy.
The national income of an open economy is therefore the sum of domestic and foreignexpenditures on the goods and services produced by domestic factors of production. Thus,the national income identity for an open economy is
(13-1)
An Imaginary Open EconomyTo make identity (13-1) concrete, let’s consider an imaginary closed economy, Agraria,whose only output is wheat. Each citizen of Agraria is a consumer of wheat, but each isalso a farmer and therefore can be viewed as a firm. Farmers invest by putting aside a
Y = C + I + G + EX - IM.
C + I + G
Y = C + I + G.
M13_KRUG6654_09_SE_C13.QXD 10/21/10 10:57 PM Page 299
300 PART THREE Exchange Rates and Open-Economy Macroeconomics
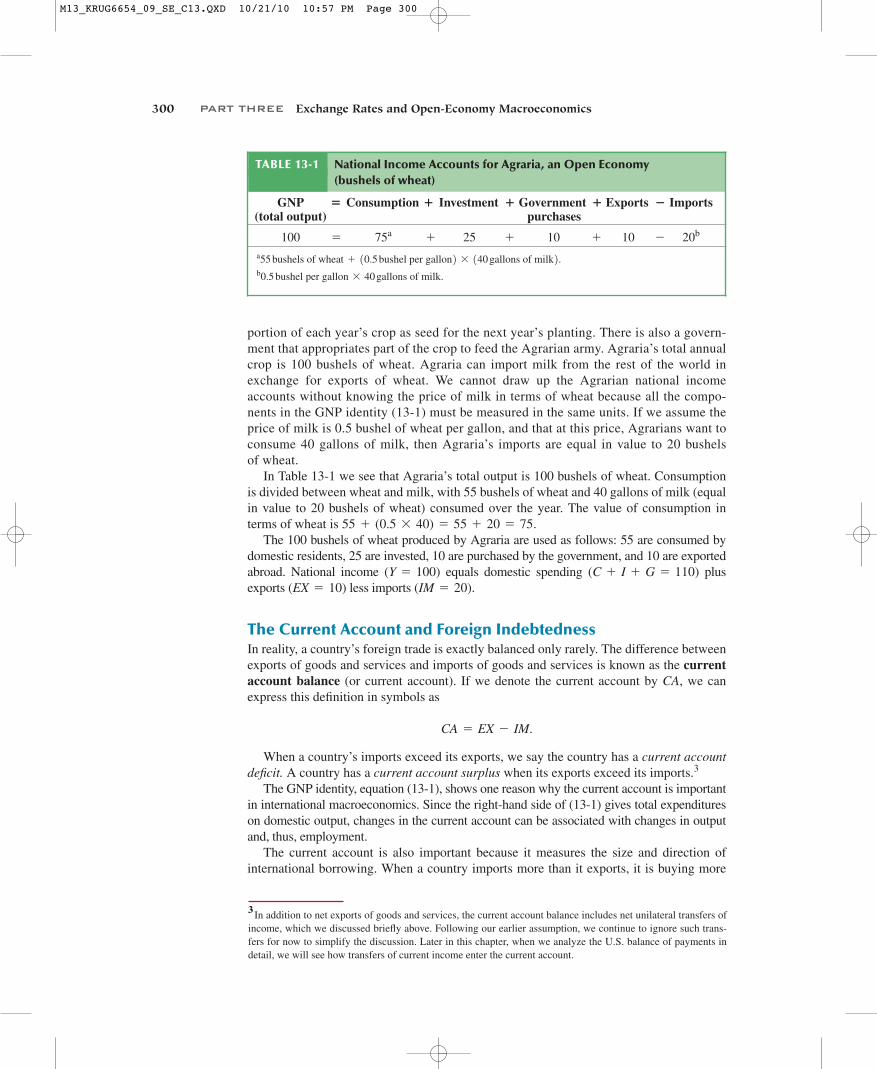
portion of each year’s crop as seed for the next year’s planting. There is also a govern-ment that appropriates part of the crop to feed the Agrarian army. Agraria’s total annualcrop is 100 bushels of wheat. Agraria can import milk from the rest of the world inexchange for exports of wheat. We cannot draw up the Agrarian national incomeaccounts without knowing the price of milk in terms of wheat because all the compo-nents in the GNP identity (13-1) must be measured in the same units. If we assume theprice of milk is 0.5 bushel of wheat per gallon, and that at this price, Agrarians want toconsume 40 gallons of milk, then Agraria’s imports are equal in value to 20 bushelsof wheat.
In Table 13-1 we see that Agraria’s total output is 100 bushels of wheat. Consumptionis divided between wheat and milk, with 55 bushels of wheat and 40 gallons of milk (equalin value to 20 bushels of wheat) consumed over the year. The value of consumption interms of wheat is .
The 100 bushels of wheat produced by Agraria are used as follows: 55 are consumed bydomestic residents, 25 are invested, 10 are purchased by the government, and 10 are exportedabroad. National income equals domestic spending plusexports less imports .
The Current Account and Foreign IndebtednessIn reality, a country’s foreign trade is exactly balanced only rarely. The difference betweenexports of goods and services and imports of goods and services is known as the currentaccount balance (or current account). If we denote the current account by CA, we canexpress this definition in symbols as
When a country’s imports exceed its exports, we say the country has a current accountdeficit. A country has a current account surplus when its exports exceed its imports.3
The GNP identity, equation (13-1), shows one reason why the current account is importantin international macroeconomics. Since the right-hand side of (13-1) gives total expenditureson domestic output, changes in the current account can be associated with changes in outputand, thus, employment.
The current account is also important because it measures the size and direction ofinternational borrowing. When a country imports more than it exports, it is buying more
CA = EX - IM.
(IM = 20)(EX = 10)(C + I + G = 110)(Y = 100)
55 + (0.5 * 40) = 55 + 20 = 75
TABLE 13-1 National Income Accounts for Agraria, an Open Economy (bushels of wheat)
GNP � Consumption � Investment � Government � Exports � Imports(total output) purchases
100 75a 25 10 10 20b-+++=
a
b0.5 bushel per gallon * 40 gallons of milk.
55 bushels of wheat + 10.5 bushel per gallon2 * 140 gallons of milk2.
3 In addition to net exports of goods and services, the current account balance includes net unilateral transfers ofincome, which we discussed briefly above. Following our earlier assumption, we continue to ignore such trans-fers for now to simplify the discussion. Later in this chapter, when we analyze the U.S. balance of payments indetail, we will see how transfers of current income enter the current account.
M13_KRUG6654_09_SE_C13.QXD 10/21/10 10:57 PM Page 300
CHAPTER 13 National Income Accounting and the Balance of Payments 301
from foreigners than it sells to them and must somehow finance this current accountdeficit. How does it pay for additional imports once it has spent its export earnings? Sincethe country as a whole can import more than it exports only if it can borrow the differencefrom foreigners, a country with a current account deficit must be increasing its net foreigndebts by the amount of the deficit. This is currently the position of the United States,which has a significant current account deficit (and borrowed a sum equal to roughly3 percent of its GNP in 2009).4
Similarly, a country with a current account surplus is earning more from its exportsthan it spends on imports. This country finances the current account deficit of its tradingpartners by lending to them. The foreign wealth of a surplus country rises because foreign-ers pay for any imports not covered by their exports by issuing IOUs that they will eventu-ally have to redeem. The preceding reasoning shows that a country’s current accountbalance equals the change in its net foreign wealth.
We have defined the current account as the difference between exports and imports.Equation (13-1) says that the current account is also equal to the difference betweennational income and domestic residents’ total spending :
It is only by borrowing abroad that a country can have a current account deficit and usemore output than it is currently producing. If it uses less than its output, it has a currentaccount surplus and is lending the surplus to foreigners.5 International borrowing andlending were identified with intertemporal trade in Chapter 6. A country with a currentaccount deficit is importing present consumption and exporting future consumption.A country with a current account surplus is exporting present consumption and importingfuture consumption.
As an example, consider again the imaginary economy of Agraria described in Table 13-1.The total value of its consumption, investment, and government purchases, at 110 bushels ofwheat, is greater than its output of 100 bushels. This inequality would be impossible in aclosed economy; it is possible in this open economy because Agraria now imports 40 gallonsof milk, worth 20 bushels of wheat, but exports only 10 bushels of wheat. The current accountdeficit of 10 bushels is the value of Agraria’s borrowing from foreigners, which the countrywill have to repay in the future.
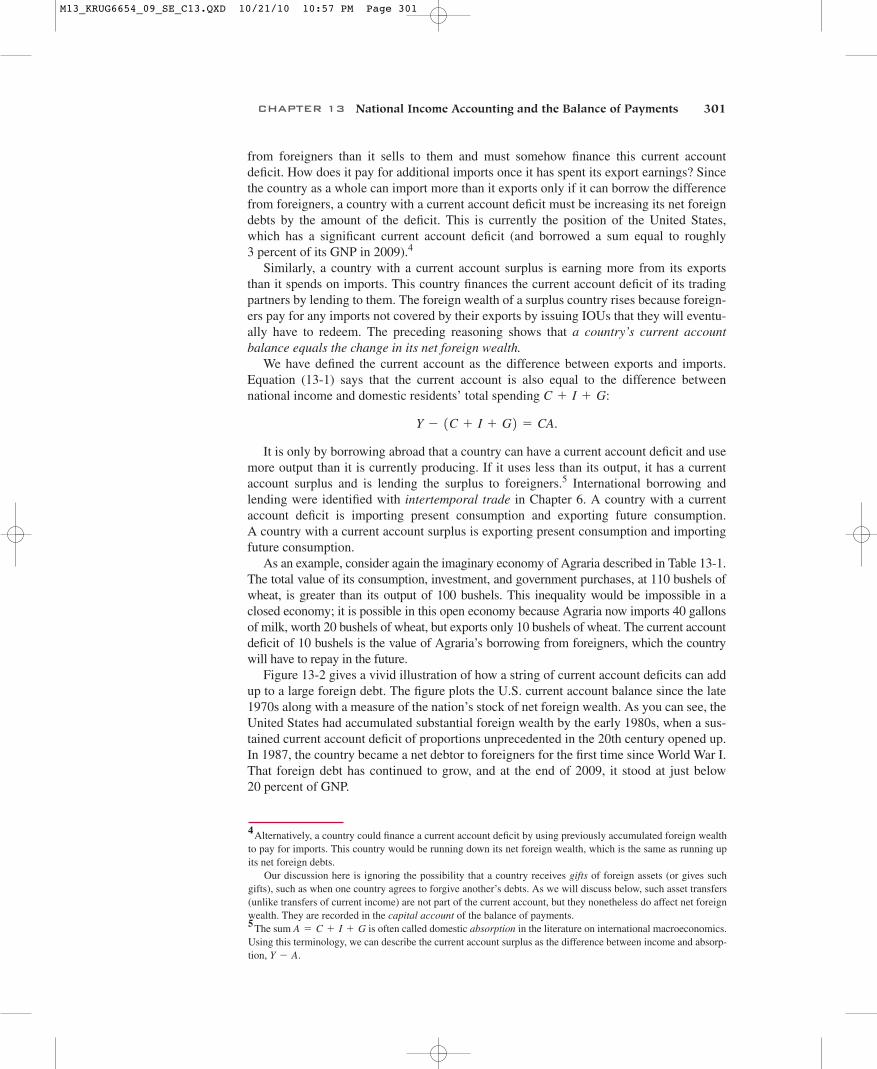
Figure 13-2 gives a vivid illustration of how a string of current account deficits can addup to a large foreign debt. The figure plots the U.S. current account balance since the late1970s along with a measure of the nation’s stock of net foreign wealth. As you can see, theUnited States had accumulated substantial foreign wealth by the early 1980s, when a sus-tained current account deficit of proportions unprecedented in the 20th century opened up.In 1987, the country became a net debtor to foreigners for the first time since World War I.That foreign debt has continued to grow, and at the end of 2009, it stood at just below20 percent of GNP.
Y - 1C + I + G2 = CA.
C + I + G
4 Alternatively, a country could finance a current account deficit by using previously accumulated foreign wealthto pay for imports. This country would be running down its net foreign wealth, which is the same as running upits net foreign debts.
Our discussion here is ignoring the possibility that a country receives gifts of foreign assets (or gives suchgifts), such as when one country agrees to forgive another’s debts. As we will discuss below, such asset transfers(unlike transfers of current income) are not part of the current account, but they nonetheless do affect net foreignwealth. They are recorded in the capital account of the balance of payments.5 The sum is often called domestic absorption in the literature on international macroeconomics.Using this terminology, we can describe the current account surplus as the difference between income and absorp-tion, .Y - A
A = C + I + G
M13_KRUG6654_09_SE_C13.QXD 10/21/10 10:57 PM Page 301
302 PART THREE Exchange Rates and Open-Economy Macroeconomics
–3000
–3200
–3600
–2400
–2600
–2800
–2200
–2000
–1800
–1600
–1400
–1200
–1000
–800
–600
–400
–200
0
200
400Net foreign wealth
Current account
1976 1978 1980 1982 1984 1986 1988 1990 1992 1994 1996 1998 2000 2002 2004 2006 2008
Current account,net foreign wealth (billions of dollars)
–3400
Figure 13-2
The U.S. Current Account and Net Foreign Wealth Position, 1976–2009
A string of current account deficits starting in the 1980s reduced America’s net foreign wealth until, by theearly 21st century, the country had accumulated a substantial net foreign debt.
Source: U.S. Department of Commerce, Bureau of Economic Analysis.
Saving and the Current AccountSimple as it is, the GNP identity has many illuminating implications. To explain the mostimportant of these implications, we define the concept of national saving, that is, the portionof output, Y, that is not devoted to household consumption, C, or government purchases, G.6
In a closed economy, national saving always equals investment. This tells us that the closedeconomy as a whole can increase its wealth only by accumulating new capital.
Let S stand for national saving. Our definition of S tells us that
S = Y - C - G.
6 The U.S. national income accounts assume that government purchases are not used to enlarge the nation’s capitalstock. We follow this convention here by subtracting all government purchases from output to calculate nationalsaving. Most other countries’ national accounts distinguish between government consumption and governmentinvestment (for example, investment by publicly owned enterprises) and include the latter as part of nationalsaving. Often, however, government investment figures include purchases of military equipment.
M13_KRUG6654_09_SE_C13.QXD 10/21/10 10:57 PM Page 302
CHAPTER 13 National Income Accounting and the Balance of Payments 303
Since the closed-economy GNP identity, , may also be written as, then
and national saving must equal investment in a closed economy. Whereas in a closed econ-omy, saving and investment must always be equal, in an open economy they can differ.Remembering that national saving, S, equals and that , wecan rewrite the GNP identity (13-1) as
The equation highlights an important difference between open and closed economies:An open economy can save either by building up its capital stock or by acquiring foreignwealth, but a closed economy can save only by building up its capital stock.
Unlike a closed economy, an open economy with profitable investment opportunities doesnot have to increase its saving in order to exploit them. The preceding expression shows that itis possible simultaneously to raise investment and foreign borrowing without changing sav-ing. For example, if New Zealand decides to build a new hydroelectric plant, it can import thematerials it needs from the United States and borrow American funds to pay for them. Thistransaction raises New Zealand’s domestic investment because the imported materialscontribute to expanding the country’s capital stock. The transaction also raises New Zealand’scurrent account deficit by an amount equal to the increase in investment. New Zealand’s sav-ing does not have to change, even though investment rises. For this to be possible, however,U.S. residents must be willing to save more so that the resources needed to build the plant arefreed for New Zealand’s use. The result is another example of intertemporal trade, in whichNew Zealand imports present consumption (when it borrows from the United States) andexports future consumption (when it pays off the loan).
Because one country’s savings can be borrowed by a second country in order toincrease the second country’s stock of capital, a country’s current account surplus is oftenreferred to as its net foreign investment. Of course, when one country lends to another tofinance investment, part of the income generated by the investment in future years must beused to pay back the lender. Domestic investment and foreign investment are two differentways in which a country can use current savings to increase its future income.
Private and Government SavingSo far our discussion of saving has not stressed the distinction between saving decisionsmade by the private sector and saving decisions made by the government. Unlike privatesaving decisions, however, government saving decisions are often made with an eyetoward their effect on output and employment. The national income identity can help us toanalyze the channels through which government saving decisions influence macroeco-nomic conditions. To use the national income identity in this way, we first have to dividenational saving into its private and government components.
Private saving is defined as the part of disposable income that is saved rather than con-sumed. Disposable income is national income, Y, less the net taxes collected from house-holds and firms by the government, T.7 Private saving, denoted , can therefore beexpressed as
Sp= Y - T - C.
Sp
S = I + CA.
CA = EX - IMY - C - G
S = I,
I = Y - C - GY = C + I + G
7 Net taxes are taxes less government transfer payments. The term government refers to the federal, state, andlocal governments considered as a single unit.
M13_KRUG6654_09_SE_C13.QXD 10/21/10 10:57 PM Page 303

304 PART THREE Exchange Rates and Open-Economy Macroeconomics
Government saving is defined similarly to private saving. The government’s “income”is its net tax revenue, T, while its “consumption” is government purchases, G. If we let stand for government saving, then
The two types of saving we have defined, private and government, add up to nationalsaving. To see why, recall the definition of national saving, S, as . Then
We can use the definitions of private and government saving to rewrite the nationalincome identity in a form that is useful for analyzing the effects of government savingdecisions on open economies. Because ,
(13-2)
Equation (13-2) relates private saving to domestic investment, the current account sur-plus, and government saving. To interpret equation (13-2), we define the governmentbudget deficit as , that is, as government saving preceded by a minus sign. Thegovernment budget deficit measures the extent to which the government is borrowing tofinance its expenditures. Equation (13-2) then states that a country’s private saving can takethree forms: investment in domestic capital (I), purchases of wealth from foreigners ,and purchases of the domestic government’s newly issued debt .8 The usefulnessof equation (13-2) is illustrated by the following Case Study.
Case Study
Government Deficit Reduction May Not Increase the Current Account SurplusThe linkage among the current account balance, investment, and private and governmentsaving given by equation (13-2) is very useful for thinking about the results of economicpolicies and events. Our predictions about such outcomes cannot possibly be correct unlessthe current account, investment, and saving rates are assumed to adjust in line with (13-2).Because that equation is an identity, however, and is not based on any theory of economicbehavior, we cannot forecast the results of policies without some model of the economy.Equation (13-2) is an identity because it must be included in any valid economic model,but there are any number of models consistent with identity (13-2).
A good example of how hard it can be to forecast policies’ effects comes from think-ing about the effects of government deficits on the current account. During the adminis-tration of President Ronald Reagan in the early 1980s, the United States slashed taxes andraised some government expenditures, which generated both a big government deficit anda sharply increased current account deficit. Those events gave rise to the argument thatthe government and the current account deficits were “twin deficits,” both generated pri-marily by the Reagan policies. If you rewrite identity (13-2) in the form
CA = Sp- I - 1G - T2,
(G - T)(CA)
G - T
Sp= I + CA - Sg
= I + CA - 1T - G2 = I + CA + 1G - T2.
S = Sp+ Sg
= I + CA
S = Y - C - G = 1Y - T - C2 + 1T - G2 = Sp+ Sg.
Y - C - G
Sg= T - G.
Sg
8 In a closed economy, the current account is always zero, so equation (13-2) is simply .Sp= I + (G - T)
M13_KRUG6654_09_SE_C13.QXD 10/21/10 10:57 PM Page 304
CHAPTER 13 National Income Accounting and the Balance of Payments 305
you can see how that outcome could have occurred. If the government deficit rises( goes up) and private saving and investment don’t change much, the currentaccount surplus must fall by roughly the same amount as the increase in the fiscaldeficit. In the United States between 1981 and 1985, the government deficit increasedby a bit more than 2 percent of GNP, while fell by about half a percent of GNP,so the current account fell from an approximately balanced position to about 23 percentof GNP. (The variables in identity (13-2) are expressed as percentages of GNP for easycomparison.) Thus, the twin deficits prediction is not too far off the mark.
The twin deficits theory can lead us seriously astray, however, when changes in gov-ernment deficits lead to bigger changes in private saving and investment behavior. A goodexample of these effects comes from European countries’ efforts to cut their governmentbudget deficits prior to the launch of their new common currency, the euro, in January1999. As we will discuss in Chapter 20, the European Union (EU) had agreed that nomember country with a large government deficit would be allowed to adopt the new cur-rency along with the initial wave of euro zone members. As 1999 approached, therefore,EU governments made frantic efforts to cut government spending and raise taxes.
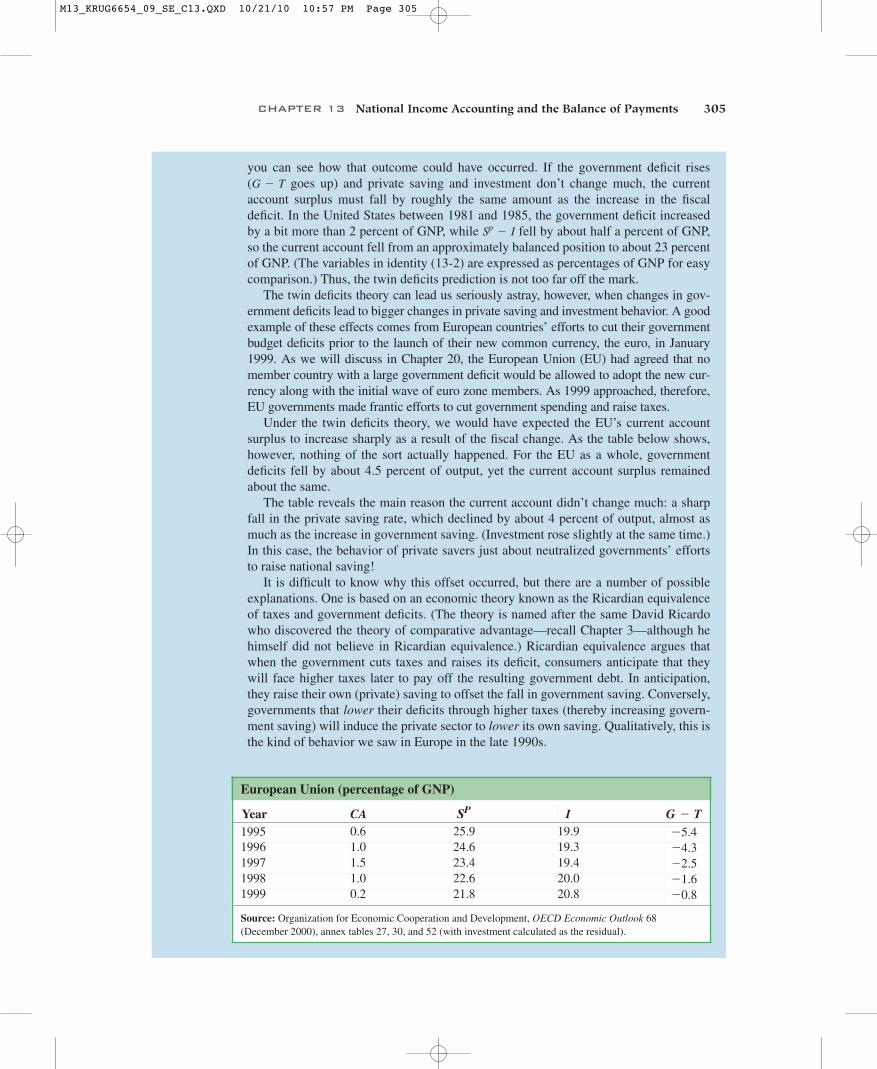
Under the twin deficits theory, we would have expected the EU’s current accountsurplus to increase sharply as a result of the fiscal change. As the table below shows,however, nothing of the sort actually happened. For the EU as a whole, governmentdeficits fell by about 4.5 percent of output, yet the current account surplus remainedabout the same.
The table reveals the main reason the current account didn’t change much: a sharpfall in the private saving rate, which declined by about 4 percent of output, almost asmuch as the increase in government saving. (Investment rose slightly at the same time.)In this case, the behavior of private savers just about neutralized governments’ effortsto raise national saving!
It is difficult to know why this offset occurred, but there are a number of possibleexplanations. One is based on an economic theory known as the Ricardian equivalenceof taxes and government deficits. (The theory is named after the same David Ricardowho discovered the theory of comparative advantage—recall Chapter 3—although hehimself did not believe in Ricardian equivalence.) Ricardian equivalence argues thatwhen the government cuts taxes and raises its deficit, consumers anticipate that theywill face higher taxes later to pay off the resulting government debt. In anticipation,they raise their own (private) saving to offset the fall in government saving. Conversely,governments that lower their deficits through higher taxes (thereby increasing govern-ment saving) will induce the private sector to lower its own saving. Qualitatively, this isthe kind of behavior we saw in Europe in the late 1990s.
Sp- I
G - T
European Union (percentage of GNP)
Year CA SP I G - T1995 0.6 25.9 19.9 -5.41996 1.0 24.6 19.3 -4.31997 1.5 23.4 19.4 -2.51998 1.0 22.6 20.0 -1.61999 0.2 21.8 20.8 -0.8
Source: Organization for Economic Cooperation and Development, OECD Economic Outlook 68 (December 2000), annex tables 27, 30, and 52 (with investment calculated as the residual).
M13_KRUG6654_09_SE_C13.QXD 10/21/10 10:57 PM Page 305
306 PART THREE Exchange Rates and Open-Economy Macroeconomics
Economists’ statistical studies suggest, however, that Ricardian equivalence doesn’thold exactly in practice. Most economists would attribute no more than half the declinein European private saving to Ricardian effects. What explains the rest of the decline?The values of European financial assets were generally rising in the late 1990s, a devel-opment fueled in part by optimism over the beneficial economic effects of the plannedcommon currency. It is likely that increased household wealth was a second factor low-ering the private saving rate in Europe.
Because private saving, investment, the current account, and the government deficitare jointly determined variables, we can never fully determine the cause of a currentaccount change using identity (13-2) alone. Nonetheless, the identity provides anessential framework for thinking about the current account and can furnish useful clues.
The Balance of Payments AccountsIn addition to national income accounts, government economists and statisticians alsokeep balance of payments accounts, a detailed record of the composition of the currentaccount balance and of the many transactions that finance it.9 Balance of payments figuresare of great interest to the general public, as indicated by the attention that various newsmedia pay to them. But press reports sometimes confuse different measures of interna-tional payments flows. Should we be alarmed or cheered by a Wall Street Journal headlineproclaiming, “U.S. Chalks Up Record Balance of Payments Deficit”? A thorough under-standing of balance of payments accounting will help us evaluate the implications of acountry’s international transactions.
A country’s balance of payments accounts keep track of both its payments to and itsreceipts from foreigners. Any transaction resulting in a receipt from foreigners is enteredin the balance of payments accounts as a credit. Any transaction resulting in a payment toforeigners is entered as a debit. Three types of international transaction are recorded in thebalance of payments:
1. Transactions that arise from the export or import of goods or services and thereforeenter directly into the current account. When a French consumer imports Americanblue jeans, for example, the transaction enters the U.S. balance of payments accountsas a credit on the current account.
2. Transactions that arise from the purchase or sale of financial assets. An asset is anyone of the forms in which wealth can be held, such as money, stocks, factories, orgovernment debt. The financial account of the balance of payments records allinternational purchases or sales of financial assets. When an American companybuys a French factory, the transaction enters the U.S. balance of payments as a debitin the financial account. It enters as a debit because the transaction requires a
9 The U.S. government is in the process of changing its balance of payments presentation to conform to prevail-ing international standards, so our discussion in this chapter differs in some respects from that in prior editions ofthis book. We follow the methodology described by Kristy L. Howell and Robert E. Yuskavage, “Modernizingand Enhancing BEA’s International Economic Accounts: Recent Progress and Future Directions,” Survey ofCurrent Business (May 2010), pp. 6–20. As of this writing the U.S. has not completed a full transition to the newsystem, but it is expected to do so over the early 2010s.
M13_KRUG6654_09_SE_C13.QXD 10/21/10 10:57 PM Page 306
CHAPTER 13 National Income Accounting and the Balance of Payments 307
payment from the United States to foreigners. Correspondingly, a U.S. sale of assetsto foreigners enters the financial account as a credit. The difference between a coun-try’s purchases and sales of foreign assets is called its financial account balance, orits net financial flows.
3. Certain other activities resulting in transfers of wealth between countries are recordedin the capital account. These international asset movements—which are generallyvery small for the United States—differ from those recorded in the financial account.For the most part they result from nonmarket activities or represent the acquisition ordisposal of nonproduced, nonfinancial, and possibly intangible assets (such as copy-rights and trademarks). For example, if the U.S. government forgives $1 billion in debtowed to it by the government of Pakistan, U.S. wealth declines by $1 billion and a $1 billion debit is recorded in the U.S. capital account.
You will find the complexities of the balance of payments accounts less confusing ifyou keep in mind the following simple rule of double-entry bookkeeping: Every inter-national transaction automatically enters the balance of payments twice, once as acredit and once as a debit. This principle of balance of payments accounting holds truebecause every transaction has two sides: If you buy something from a foreigner, youmust pay him in some way, and the foreigner must then somehow spend or store yourpayment.
Examples of Paired TransactionsSome examples will show how the principle of double-entry bookkeeping operates inpractice.
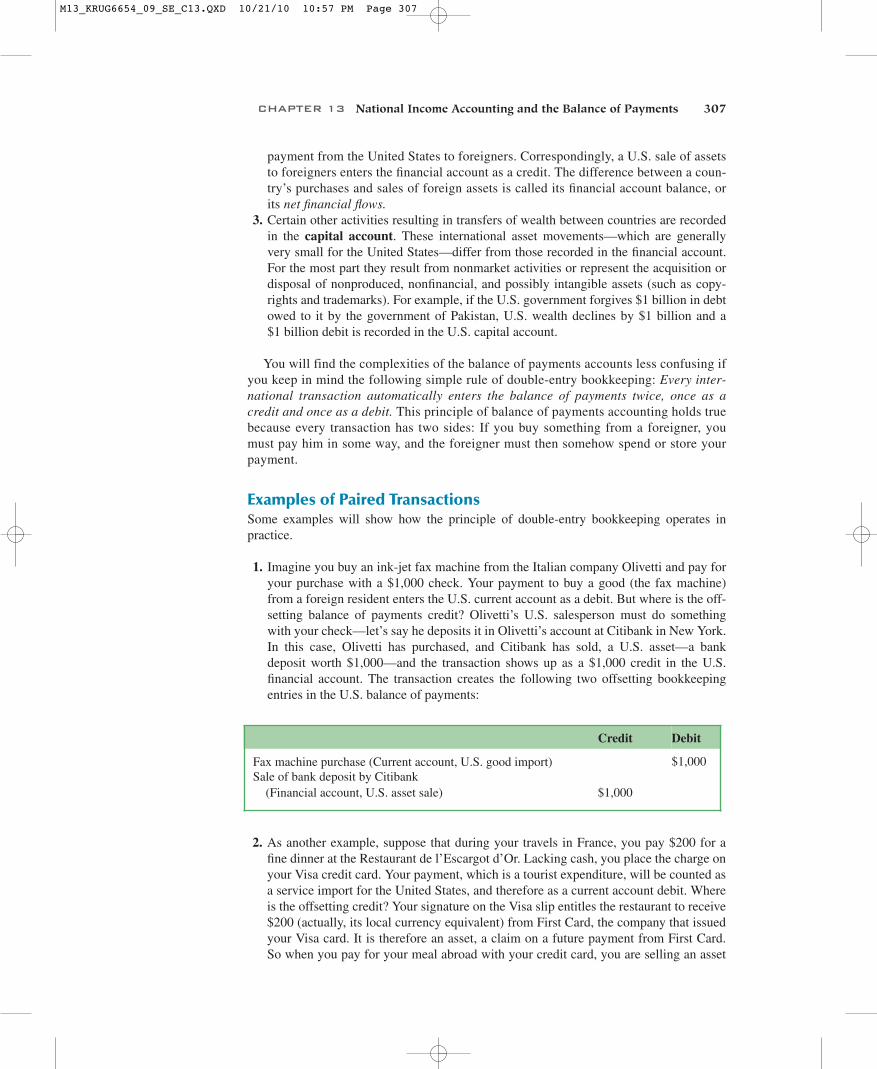
1. Imagine you buy an ink-jet fax machine from the Italian company Olivetti and pay foryour purchase with a $1,000 check. Your payment to buy a good (the fax machine)from a foreign resident enters the U.S. current account as a debit. But where is the off-setting balance of payments credit? Olivetti’s U.S. salesperson must do somethingwith your check—let’s say he deposits it in Olivetti’s account at Citibank in New York.In this case, Olivetti has purchased, and Citibank has sold, a U.S. asset—a bankdeposit worth $1,000—and the transaction shows up as a $1,000 credit in the U.S.financial account. The transaction creates the following two offsetting bookkeepingentries in the U.S. balance of payments:
Credit Debit
Fax machine purchase (Current account, U.S. good import) $1,000Sale of bank deposit by Citibank
(Financial account, U.S. asset sale) $1,000
2. As another example, suppose that during your travels in France, you pay $200 for afine dinner at the Restaurant de l’Escargot d’Or. Lacking cash, you place the charge onyour Visa credit card. Your payment, which is a tourist expenditure, will be counted asa service import for the United States, and therefore as a current account debit. Whereis the offsetting credit? Your signature on the Visa slip entitles the restaurant to receive$200 (actually, its local currency equivalent) from First Card, the company that issuedyour Visa card. It is therefore an asset, a claim on a future payment from First Card.So when you pay for your meal abroad with your credit card, you are selling an asset
M13_KRUG6654_09_SE_C13.QXD 10/21/10 10:57 PM Page 307
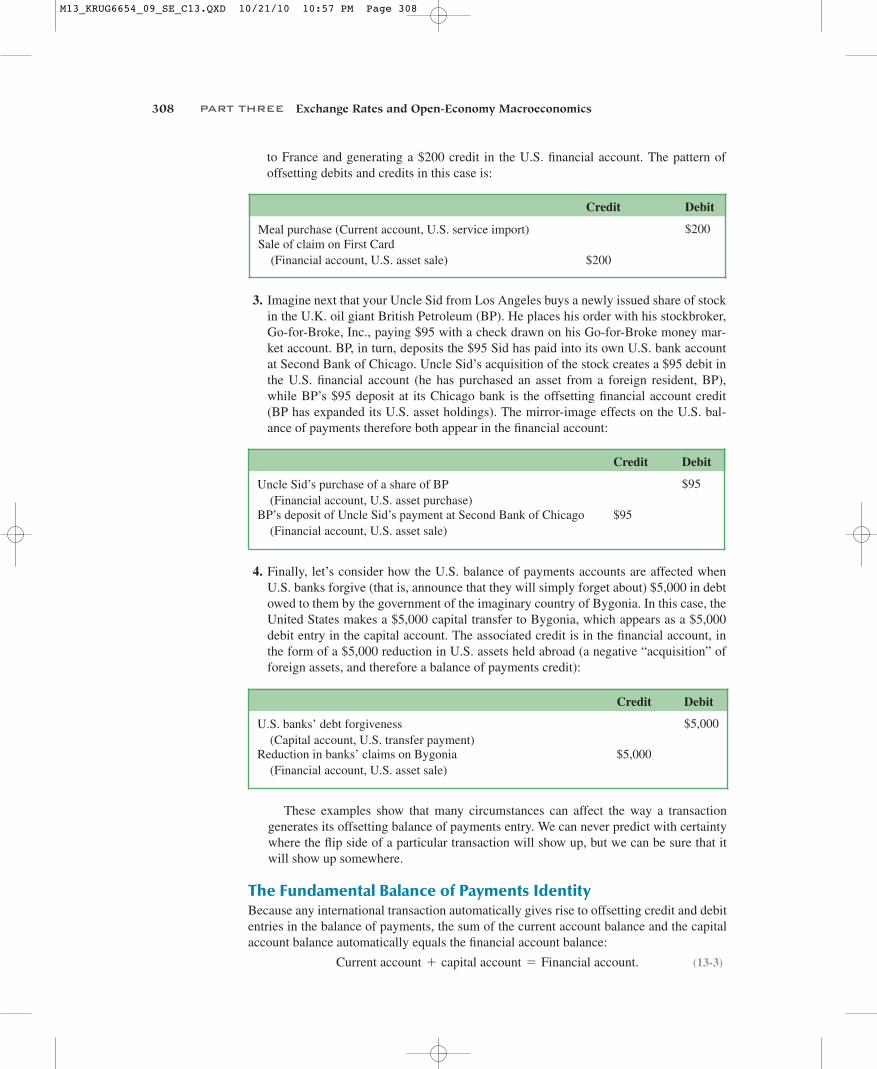
3. Imagine next that your Uncle Sid from Los Angeles buys a newly issued share of stockin the U.K. oil giant British Petroleum (BP). He places his order with his stockbroker,Go-for-Broke, Inc., paying $95 with a check drawn on his Go-for-Broke money mar-ket account. BP, in turn, deposits the $95 Sid has paid into its own U.S. bank accountat Second Bank of Chicago. Uncle Sid’s acquisition of the stock creates a $95 debit inthe U.S. financial account (he has purchased an asset from a foreign resident, BP),while BP’s $95 deposit at its Chicago bank is the offsetting financial account credit(BP has expanded its U.S. asset holdings). The mirror-image effects on the U.S. bal-ance of payments therefore both appear in the financial account:
308 PART THREE Exchange Rates and Open-Economy Macroeconomics
4. Finally, let’s consider how the U.S. balance of payments accounts are affected whenU.S. banks forgive (that is, announce that they will simply forget about) $5,000 in debtowed to them by the government of the imaginary country of Bygonia. In this case, theUnited States makes a $5,000 capital transfer to Bygonia, which appears as a $5,000debit entry in the capital account. The associated credit is in the financial account, inthe form of a $5,000 reduction in U.S. assets held abroad (a negative “acquisition” offoreign assets, and therefore a balance of payments credit):
These examples show that many circumstances can affect the way a transactiongenerates its offsetting balance of payments entry. We can never predict with certaintywhere the flip side of a particular transaction will show up, but we can be sure that itwill show up somewhere.
The Fundamental Balance of Payments IdentityBecause any international transaction automatically gives rise to offsetting credit and debitentries in the balance of payments, the sum of the current account balance and the capitalaccount balance automatically equals the financial account balance:
(13-3)Current account + capital account = Financial account.
Credit Debit
Uncle Sid’s purchase of a share of BP (Financial account, U.S. asset purchase)
$95
BP’s deposit of Uncle Sid’s payment at Second Bank of Chicago (Financial account, U.S. asset sale)
$95
Credit Debit
U.S. banks’ debt forgiveness (Capital account, U.S. transfer payment)
$5,000
Reduction in banks’ claims on Bygonia (Financial account, U.S. asset sale)
$5,000
Credit Debit
Meal purchase (Current account, U.S. service import) $200Sale of claim on First Card
(Financial account, U.S. asset sale) $200
to France and generating a $200 credit in the U.S. financial account. The pattern ofoffsetting debits and credits in this case is:
M13_KRUG6654_09_SE_C13.QXD 10/21/10 10:57 PM Page 308
CHAPTER 13 National Income Accounting and the Balance of Payments 309
In examples 1, 2, and 4 above, current or capital account entries have offsetting counterpartsin the financial account, while in example 3, two financial account entries offset each other.
You can understand this identity another way. Recall the relationship linking the cur-rent account to international lending and borrowing. Because the sum of the current andcapital accounts is the total change in a country’s net foreign assets (including, through thecapital account, nonmarket asset transfers), that sum necessarily equals the differencebetween a country’s purchases of assets from foreigners and its sales of assets to them—that is, the financial account balance (also called net financial flows).
We now turn to a more detailed description of the balance of payments accounts, usingas an example the U.S. accounts for 2009.
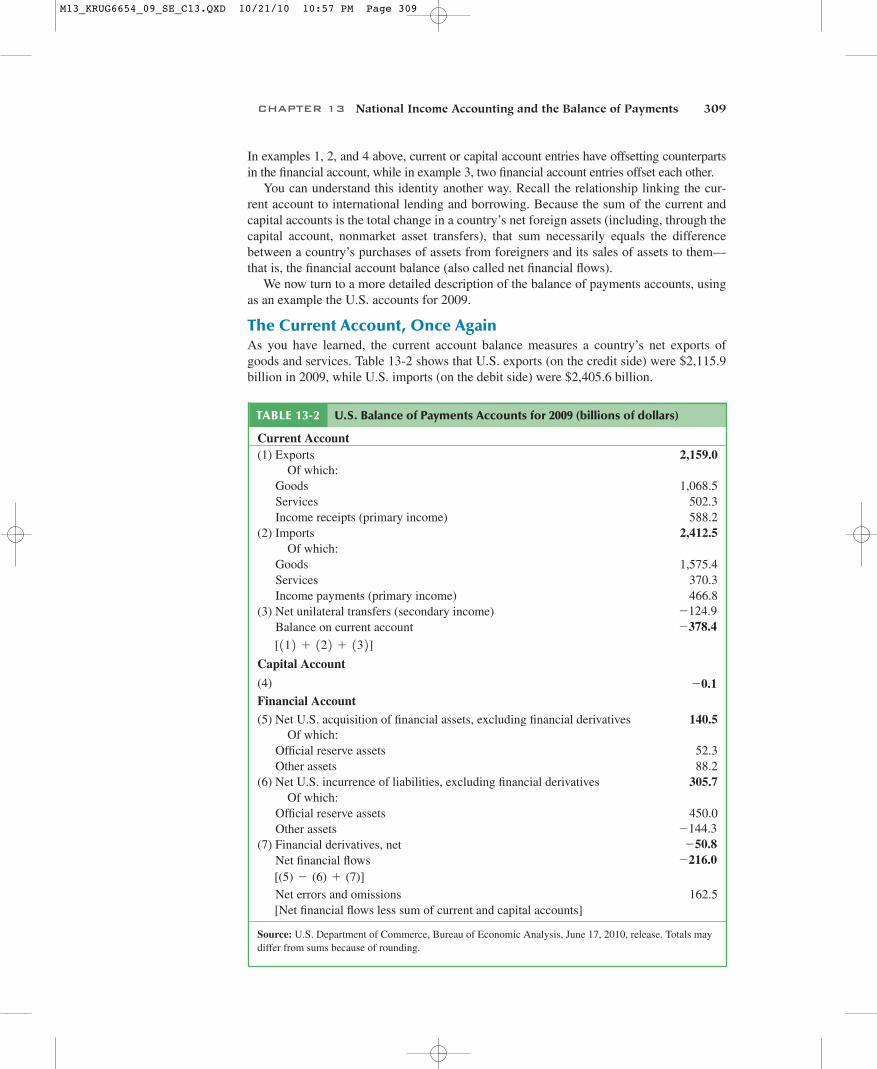
The Current Account, Once AgainAs you have learned, the current account balance measures a country’s net exports ofgoods and services. Table 13-2 shows that U.S. exports (on the credit side) were $2,115.9billion in 2009, while U.S. imports (on the debit side) were $2,405.6 billion.
TABLE 13-2 U.S. Balance of Payments Accounts for 2009 (billions of dollars)
Current Account(1) Exports 2,159.0
Of which:Goods 1,068.5Services 502.3Income receipts (primary income) 588.2
(2) Imports 2,412.5Of which:
Goods 1,575.4Services 370.3Income payments (primary income) 466.8
(3) Net unilateral transfers (secondary income) -124.9Balance on current account -378.4
[112 + 122 + 132]
Capital Account
(4) -0.1Financial Account
(5) Net U.S. acquisition of financial assets, excluding financial derivatives 140.5Of which:
Official reserve assets 52.3Other assets 88.2
(6) Net U.S. incurrence of liabilities, excluding financial derivatives 305.7Of which:
Official reserve assets 450.0Other assets -144.3
(7) Financial derivatives, net -50.8Net financial flows -216.0[(5) - (6) + (7)]Net errors and omissions 162.5[Net financial flows less sum of current and capital accounts]
Source: U.S. Department of Commerce, Bureau of Economic Analysis, June 17, 2010, release. Totals maydiffer from sums because of rounding.
M13_KRUG6654_09_SE_C13.QXD 10/21/10 10:57 PM Page 309
310 PART THREE Exchange Rates and Open-Economy Macroeconomics
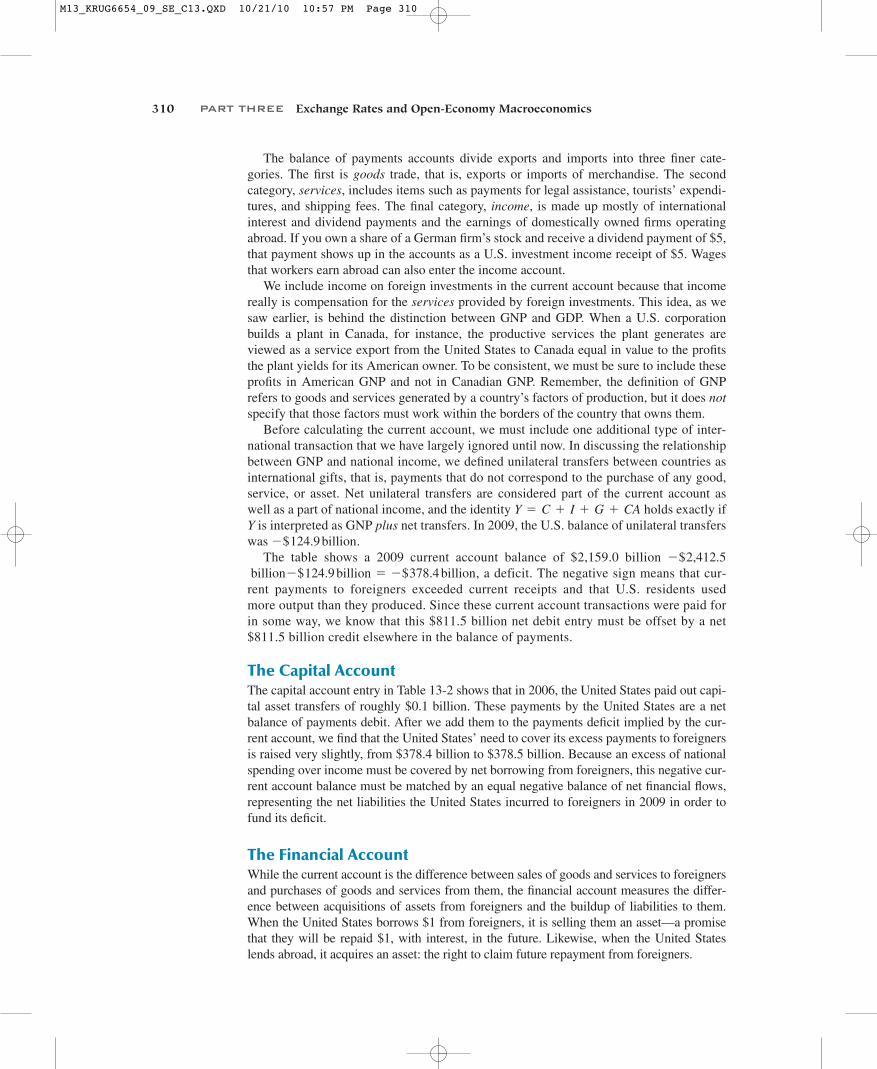
The balance of payments accounts divide exports and imports into three finer cate-gories. The first is goods trade, that is, exports or imports of merchandise. The secondcategory, services, includes items such as payments for legal assistance, tourists’ expendi-tures, and shipping fees. The final category, income, is made up mostly of internationalinterest and dividend payments and the earnings of domestically owned firms operatingabroad. If you own a share of a German firm’s stock and receive a dividend payment of $5,that payment shows up in the accounts as a U.S. investment income receipt of $5. Wagesthat workers earn abroad can also enter the income account.
We include income on foreign investments in the current account because that incomereally is compensation for the services provided by foreign investments. This idea, as wesaw earlier, is behind the distinction between GNP and GDP. When a U.S. corporationbuilds a plant in Canada, for instance, the productive services the plant generates areviewed as a service export from the United States to Canada equal in value to the profitsthe plant yields for its American owner. To be consistent, we must be sure to include theseprofits in American GNP and not in Canadian GNP. Remember, the definition of GNPrefers to goods and services generated by a country’s factors of production, but it does notspecify that those factors must work within the borders of the country that owns them.
Before calculating the current account, we must include one additional type of inter-national transaction that we have largely ignored until now. In discussing the relationshipbetween GNP and national income, we defined unilateral transfers between countries asinternational gifts, that is, payments that do not correspond to the purchase of any good,service, or asset. Net unilateral transfers are considered part of the current account aswell as a part of national income, and the identity holds exactly ifY is interpreted as GNP plus net transfers. In 2009, the U.S. balance of unilateral transferswas .
The table shows a 2009 current account balance of $2,159.0 billion , a deficit. The negative sign means that cur-
rent payments to foreigners exceeded current receipts and that U.S. residents usedmore output than they produced. Since these current account transactions were paid forin some way, we know that this $811.5 billion net debit entry must be offset by a net$811.5 billion credit elsewhere in the balance of payments.
The Capital AccountThe capital account entry in Table 13-2 shows that in 2006, the United States paid out capi-tal asset transfers of roughly $0.1 billion. These payments by the United States are a netbalance of payments debit. After we add them to the payments deficit implied by the cur-rent account, we find that the United States’ need to cover its excess payments to foreignersis raised very slightly, from $378.4 billion to $378.5 billion. Because an excess of nationalspending over income must be covered by net borrowing from foreigners, this negative cur-rent account balance must be matched by an equal negative balance of net financial flows,representing the net liabilities the United States incurred to foreigners in 2009 in order tofund its deficit.
The Financial AccountWhile the current account is the difference between sales of goods and services to foreignersand purchases of goods and services from them, the financial account measures the differ-ence between acquisitions of assets from foreigners and the buildup of liabilities to them.When the United States borrows $1 from foreigners, it is selling them an asset—a promisethat they will be repaid $1, with interest, in the future. Likewise, when the United Stateslends abroad, it acquires an asset: the right to claim future repayment from foreigners.
billion - $124.9 billion = - $378.4 billion- $2,412.5
- $124.9 billion
Y = C + I + G + CA
M13_KRUG6654_09_SE_C13.QXD 10/21/10 10:57 PM Page 310
CHAPTER 13 National Income Accounting and the Balance of Payments 311
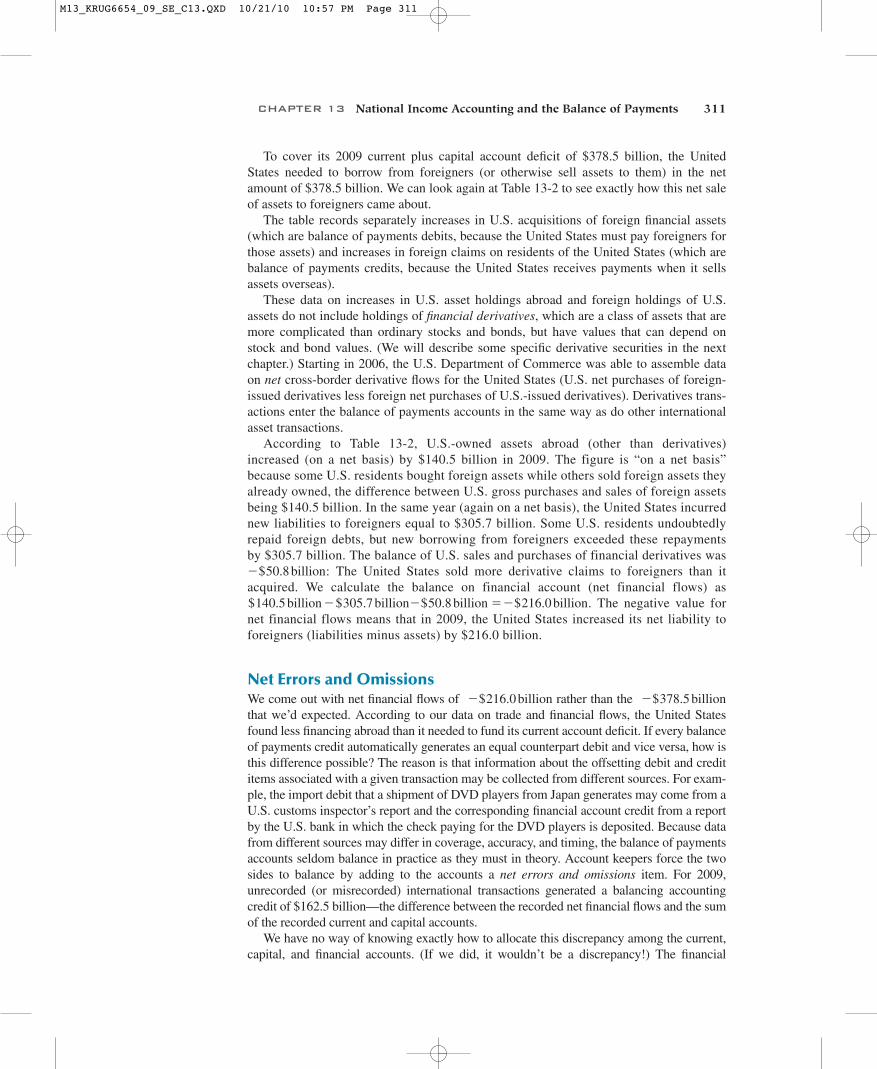
To cover its 2009 current plus capital account deficit of $378.5 billion, the UnitedStates needed to borrow from foreigners (or otherwise sell assets to them) in the netamount of $378.5 billion. We can look again at Table 13-2 to see exactly how this net saleof assets to foreigners came about.
The table records separately increases in U.S. acquisitions of foreign financial assets(which are balance of payments debits, because the United States must pay foreigners forthose assets) and increases in foreign claims on residents of the United States (which arebalance of payments credits, because the United States receives payments when it sellsassets overseas).
These data on increases in U.S. asset holdings abroad and foreign holdings of U.S.assets do not include holdings of financial derivatives, which are a class of assets that aremore complicated than ordinary stocks and bonds, but have values that can depend onstock and bond values. (We will describe some specific derivative securities in the nextchapter.) Starting in 2006, the U.S. Department of Commerce was able to assemble dataon net cross-border derivative flows for the United States (U.S. net purchases of foreign-issued derivatives less foreign net purchases of U.S.-issued derivatives). Derivatives trans-actions enter the balance of payments accounts in the same way as do other internationalasset transactions.
According to Table 13-2, U.S.-owned assets abroad (other than derivatives)increased (on a net basis) by $140.5 billion in 2009. The figure is “on a net basis”because some U.S. residents bought foreign assets while others sold foreign assets theyalready owned, the difference between U.S. gross purchases and sales of foreign assetsbeing $140.5 billion. In the same year (again on a net basis), the United States incurrednew liabilities to foreigners equal to $305.7 billion. Some U.S. residents undoubtedlyrepaid foreign debts, but new borrowing from foreigners exceeded these repaymentsby $305.7 billion. The balance of U.S. sales and purchases of financial derivatives was
: The United States sold more derivative claims to foreigners than itacquired. We calculate the balance on financial account (net financial flows) as
. The negative value fornet financial flows means that in 2009, the United States increased its net liability toforeigners (liabilities minus assets) by $216.0 billion.
Net Errors and OmissionsWe come out with net financial flows of rather than the that we’d expected. According to our data on trade and financial flows, the United Statesfound less financing abroad than it needed to fund its current account deficit. If every balanceof payments credit automatically generates an equal counterpart debit and vice versa, how isthis difference possible? The reason is that information about the offsetting debit and credititems associated with a given transaction may be collected from different sources. For exam-ple, the import debit that a shipment of DVD players from Japan generates may come from aU.S. customs inspector’s report and the corresponding financial account credit from a reportby the U.S. bank in which the check paying for the DVD players is deposited. Because datafrom different sources may differ in coverage, accuracy, and timing, the balance of paymentsaccounts seldom balance in practice as they must in theory. Account keepers force the twosides to balance by adding to the accounts a net errors and omissions item. For 2009,unrecorded (or misrecorded) international transactions generated a balancing accountingcredit of $162.5 billion—the difference between the recorded net financial flows and the sumof the recorded current and capital accounts.
We have no way of knowing exactly how to allocate this discrepancy among the current,capital, and financial accounts. (If we did, it wouldn’t be a discrepancy!) The financial
- $378.5 billion- $216.0 billion
- $50.8 billion = - $216.0 billion$140.5 billion - $305.7 billion
- $50.8 billion
M13_KRUG6654_09_SE_C13.QXD 10/21/10 10:57 PM Page 311
312 PART THREE Exchange Rates and Open-Economy Macroeconomics
account is the most likely culprit, since it is notoriously difficult to keep track of the compli-cated financial trades between residents of different countries. But we cannot conclude thatnet financial flows were $162.5 billion lower than recorded, because the current account isalso highly suspect. Balance of payments accountants consider merchandise trade data rela-tively reliable, but data on services are not. Service transactions such as sales of financialadvice and computer programming assistance may escape detection. Accurate measurementof international interest and dividend receipts is particularly difficult.
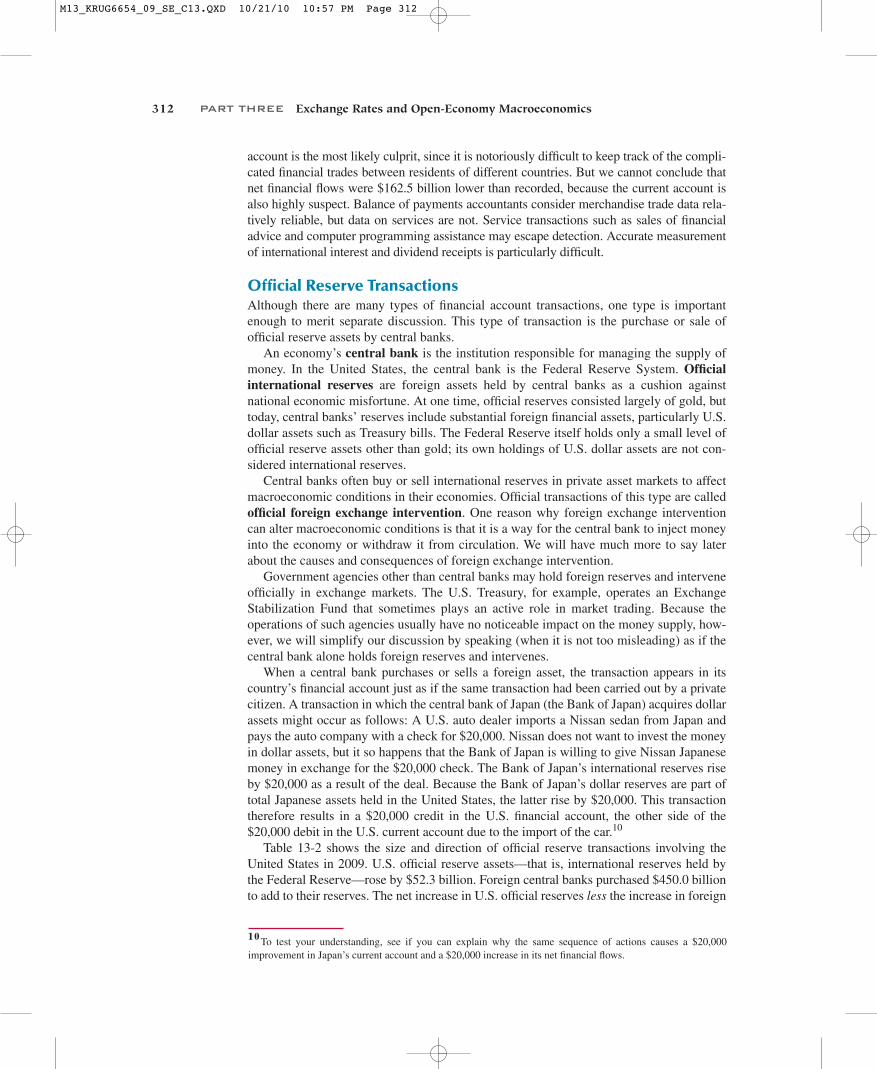
Official Reserve TransactionsAlthough there are many types of financial account transactions, one type is importantenough to merit separate discussion. This type of transaction is the purchase or sale ofofficial reserve assets by central banks.
An economy’s central bank is the institution responsible for managing the supply ofmoney. In the United States, the central bank is the Federal Reserve System. Officialinternational reserves are foreign assets held by central banks as a cushion againstnational economic misfortune. At one time, official reserves consisted largely of gold, buttoday, central banks’ reserves include substantial foreign financial assets, particularly U.S.dollar assets such as Treasury bills. The Federal Reserve itself holds only a small level ofofficial reserve assets other than gold; its own holdings of U.S. dollar assets are not con-sidered international reserves.
Central banks often buy or sell international reserves in private asset markets to affectmacroeconomic conditions in their economies. Official transactions of this type are calledofficial foreign exchange intervention. One reason why foreign exchange interventioncan alter macroeconomic conditions is that it is a way for the central bank to inject moneyinto the economy or withdraw it from circulation. We will have much more to say laterabout the causes and consequences of foreign exchange intervention.
Government agencies other than central banks may hold foreign reserves and interveneofficially in exchange markets. The U.S. Treasury, for example, operates an ExchangeStabilization Fund that sometimes plays an active role in market trading. Because theoperations of such agencies usually have no noticeable impact on the money supply, how-ever, we will simplify our discussion by speaking (when it is not too misleading) as if thecentral bank alone holds foreign reserves and intervenes.
When a central bank purchases or sells a foreign asset, the transaction appears in itscountry’s financial account just as if the same transaction had been carried out by a privatecitizen. A transaction in which the central bank of Japan (the Bank of Japan) acquires dollarassets might occur as follows: A U.S. auto dealer imports a Nissan sedan from Japan andpays the auto company with a check for $20,000. Nissan does not want to invest the moneyin dollar assets, but it so happens that the Bank of Japan is willing to give Nissan Japanesemoney in exchange for the $20,000 check. The Bank of Japan’s international reserves riseby $20,000 as a result of the deal. Because the Bank of Japan’s dollar reserves are part oftotal Japanese assets held in the United States, the latter rise by $20,000. This transactiontherefore results in a $20,000 credit in the U.S. financial account, the other side of the$20,000 debit in the U.S. current account due to the import of the car.10
Table 13-2 shows the size and direction of official reserve transactions involving theUnited States in 2009. U.S. official reserve assets—that is, international reserves held bythe Federal Reserve—rose by $52.3 billion. Foreign central banks purchased $450.0 billionto add to their reserves. The net increase in U.S. official reserves less the increase in foreign
1 0 To test your understanding, see if you can explain why the same sequence of actions causes a $20,000improvement in Japan’s current account and a $20,000 increase in its net financial flows.
M13_KRUG6654_09_SE_C13.QXD 10/21/10 10:57 PM Page 312
CHAPTER 13 National Income Accounting and the Balance of Payments 313
official reserve claims on the United States is the level of net central bank financial flows,which stood at in 2009.
You can think of this net central bank financial flow as measuring thedegree to which monetary authorities in the United States and abroad joined with otherlenders to cover the U.S. current account deficit. In the example above, the Bank of Japan,by acquiring a $20,000 U.S. bank deposit, indirectly finances an American import of a$20,000 Japanese car. The level of net central bank financial flows is called the officialsettlements balance or (in less formal usage) the balance of payments. This balance isthe sum of the current account and capital account balances, less the nonreserve portion ofthe financial account balance, and it indicates the payments gap that official reserve trans-actions need to cover. Thus the U.S. balance of payments in 2009 was .
The balance of payments played an important historical role as a measure of disequilib-rium in international payments, and for many countries it still plays this role. A negativebalance of payments (a deficit) may signal a crisis, for it means that a country is runningdown its international reserve assets or incurring debts to foreign monetary authorities. If acountry faces the risk of being suddenly cut off from foreign loans, it will want to maintaina “war chest” of international reserves as a precaution. Developing countries, in particular,are in this position (see Chapter 22).
Like any summary measure, however, the balance of payments must be interpreted withcaution. To return to our running example, the Bank of Japan’s decision to expand its U.S.bank deposit holdings by $20,000 swells the measured U.S. balance of payments deficit bythe same amount. Suppose the Bank of Japan instead places its $20,000 with BarclaysBank in London, which in turn deposits the money with Citibank in New York. The UnitedStates incurs an extra $20,000 in liabilities to private foreigners in this case, and the U.S.balance of payments deficit does not rise. But this “improvement” in the balance of pay-ments is of little economic importance: It makes no real difference to the United Stateswhether it borrows the Bank of Japan’s money directly or through a London bank.
Case Study
The Assets and Liabilities of the World’s Biggest DebtorWe saw earlier that the current account balance measures the flow of new net claims onforeign wealth that a country acquires by exporting more goods and services than it im-ports. This flow is not, however, the only important factor that causes a country’s netforeign wealth to change. In addition, changes in the market price of wealth previouslyacquired can alter a country’s net foreign wealth. When Japan’s stock market lost three-quarters of its value over the 1990s, for example, American and European owners ofJapanese shares saw the value of their claims on Japan plummet, and Japan’s netforeign wealth increased as a result. Exchange rate changes have a similar effect. Whenthe dollar depreciates against foreign currencies, for example, foreigners who hold dol-lar assets see their wealth fall when measured in their home currencies.
The Bureau of Economic Analysis (BEA) of the U.S. Department of Commerce,which oversees the vast job of data collection behind the U.S. national income and bal-ance of payments statistics, reports annual estimates of the net “international investmentposition” of the United States—the country’s foreign assets less its foreign liabilities.Because asset price and exchange rate changes alter the dollar values of foreign assetsand liabilities alike, the BEA must adjust the values of existing claims to reflect suchcapital gains and losses in order to estimate U.S. net foreign wealth. These estimates
- $397.7 billion
- $397.7 billion$52.3 - $450.0 billion = - $397.7 billion
M13_KRUG6654_09_SE_C13.QXD 10/21/10 10:57 PM Page 313
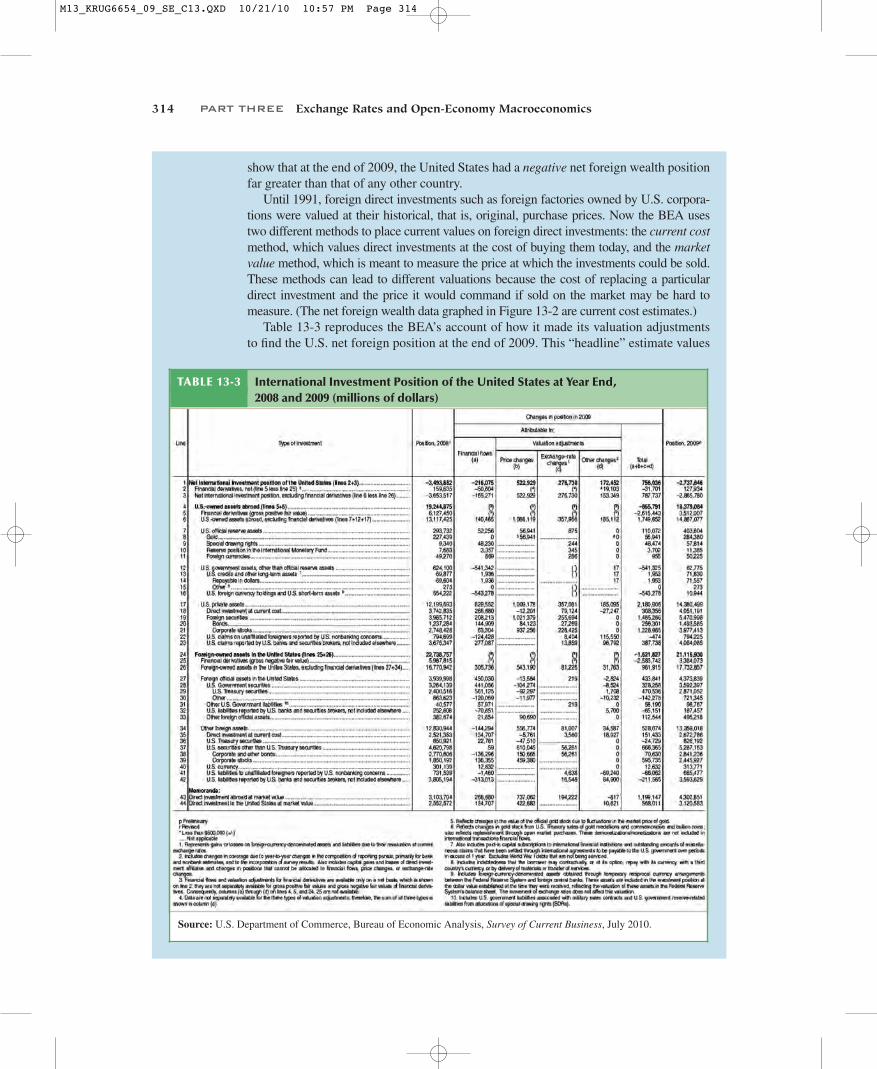
TABLE 13-3 International Investment Position of the United States at Year End, 2008 and 2009 (millions of dollars)
Source: U.S. Department of Commerce, Bureau of Economic Analysis, Survey of Current Business, July 2010.
314 PART THREE Exchange Rates and Open-Economy Macroeconomics
show that at the end of 2009, the United States had a negative net foreign wealth positionfar greater than that of any other country.
Until 1991, foreign direct investments such as foreign factories owned by U.S. corpora-tions were valued at their historical, that is, original, purchase prices. Now the BEA usestwo different methods to place current values on foreign direct investments: the current costmethod, which values direct investments at the cost of buying them today, and the marketvalue method, which is meant to measure the price at which the investments could be sold.These methods can lead to different valuations because the cost of replacing a particulardirect investment and the price it would command if sold on the market may be hard tomeasure. (The net foreign wealth data graphed in Figure 13-2 are current cost estimates.)
Table 13-3 reproduces the BEA’s account of how it made its valuation adjustmentsto find the U.S. net foreign position at the end of 2009. This “headline” estimate values
M13_KRUG6654_09_SE_C13.QXD 10/21/10 10:57 PM Page 314
CHAPTER 13 National Income Accounting and the Balance of Payments 315
direct investments at current cost. Starting with its estimate of 2008 net foreign wealth( at current cost), the BEA (column a) added the amount of the 2009U.S. net financial flow of —recall the figure reported in Table 13-2.Then the BEA adjusted the values of previously held assets and liabilities for variouschanges in their dollar prices (columns b, c, and d). As a result of these valuationchanges, U.S. net foreign wealth fell by an amount much smaller than the $216 billionin new net borrowing from foreigners—in fact, U.S. net foreign wealth actually rose, asshown in Figure 13-2! Based on the current cost method for valuing direct investments,the BEA’s 2009 estimate of U.S. net foreign wealth was .
This debt is larger than the total foreign debt owed by all the Central and EasternEuropean countries, which was about $1,100 billion in 2009. To put these figures in per-spective, however, it is important to realize that the U.S. net foreign debt amounted to justunder 20 percent of its GDP, while the foreign liabilities of Hungary, Poland, Romania,and the other Central and Eastern European debtors was nearly 70 percent of their collec-tive GDP! Thus, the U.S. external debt represents a much lower domestic income drain.
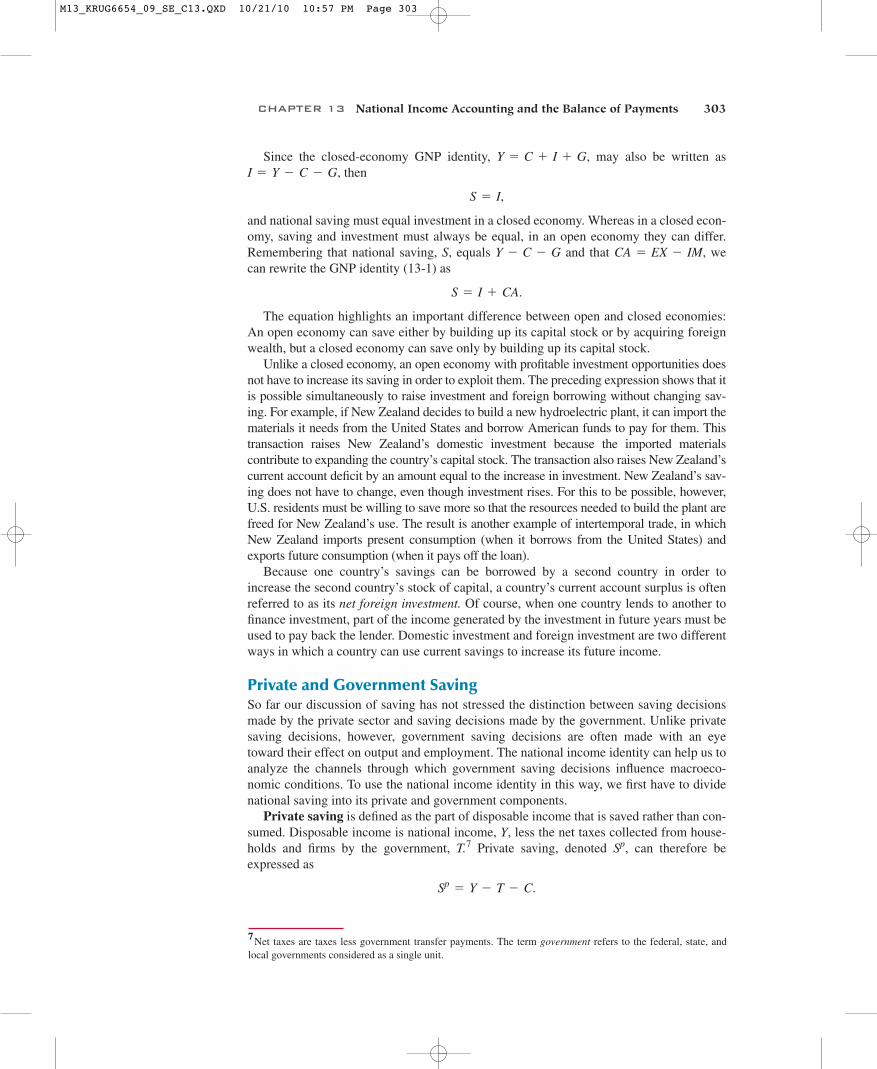
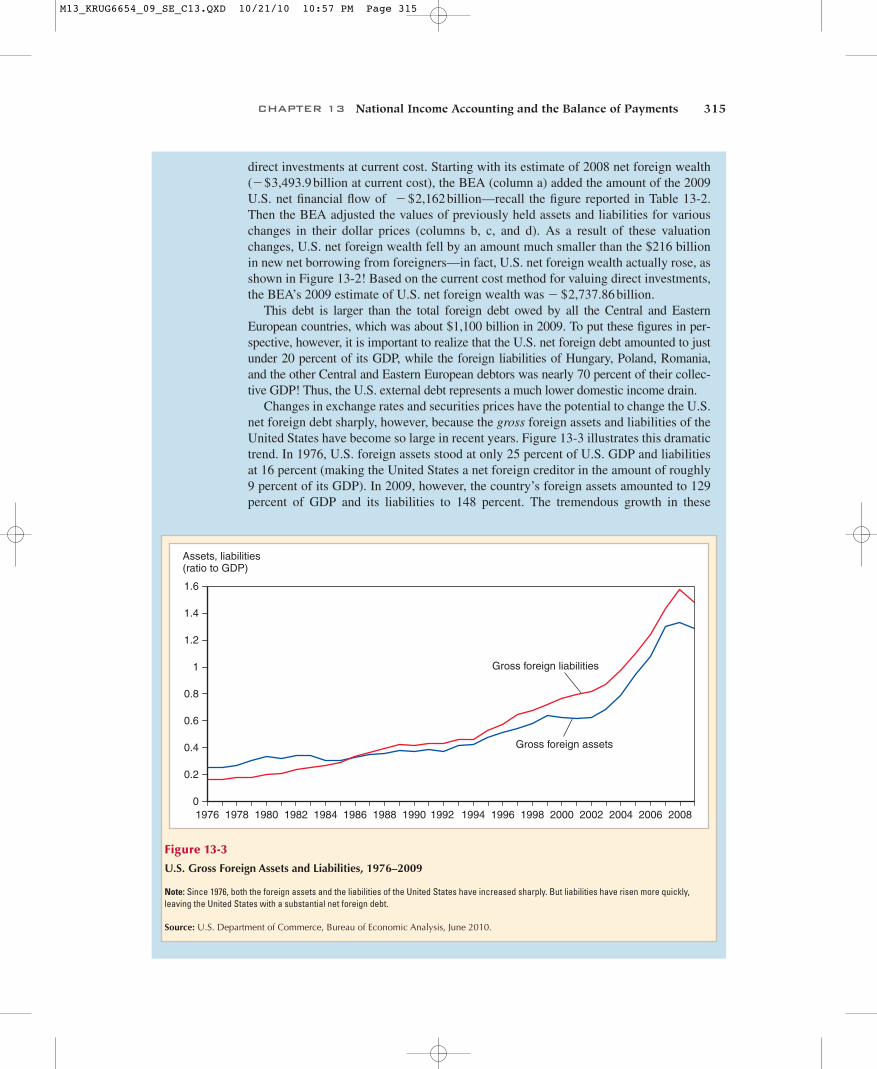
Changes in exchange rates and securities prices have the potential to change the U.S.net foreign debt sharply, however, because the gross foreign assets and liabilities of theUnited States have become so large in recent years. Figure 13-3 illustrates this dramatictrend. In 1976, U.S. foreign assets stood at only 25 percent of U.S. GDP and liabilitiesat 16 percent (making the United States a net foreign creditor in the amount of roughly9 percent of its GDP). In 2009, however, the country’s foreign assets amounted to 129percent of GDP and its liabilities to 148 percent. The tremendous growth in these
- $2,737.86 billion
- $2,162 billion- $3,493.9 billion
0
0.2
0.4
0.6
0.8
1
1.2
1.6
1.4
1976 1978 1980 1982 1984 1986 1988 1990 1992 1994 1996 1998 2000 2002 2004
Assets, liabilities(ratio to GDP)
2006 2008
Gross foreign liabilities
Gross foreign assets
Figure 13-3
U.S. Gross Foreign Assets and Liabilities, 1976–2009
Note: Since 1976, both the foreign assets and the liabilities of the United States have increased sharply. But liabilities have risen more quickly,leaving the United States with a substantial net foreign debt.
Source: U.S. Department of Commerce, Bureau of Economic Analysis, June 2010.
M13_KRUG6654_09_SE_C13.QXD 10/21/10 10:57 PM Page 315
316 PART THREE Exchange Rates and Open-Economy Macroeconomics
stocks of wealth reflects the rapid globalization of financial markets in the late 20thcentury, a phenomenon we will discuss further in Chapter 21.
Think about how wealth positions of this magnitude amplify the effects of exchangerate changes, however. Suppose that 70 percent of U.S. foreign assets are denominated inforeign currencies, but that all U.S. liabilities to foreigners are denominated in dollars(these are approximately the correct numbers). Because 2009 U.S. GDP was around $14.4trillion, a 10 percent depreciation of the dollar would leave U.S. liabilities unchanged butwould increase U.S. assets (measured in dollars) by percent ofGDP, or about $1.3 trillion. This number is approximately 3.5 times the U.S. currentaccount deficit of 2009! Indeed, due to sharp movements in exchange rates and stockprices, the U.S. economy lost about $800 billion in this way between 2007 and 2008 andgained a comparable amount between 2008 and 2009 (see Figure 13-2). The correspon-ding redistribution of wealth between foreigners and the United States would have beenmuch smaller back in 1976.
Does this possibility mean that policy makers should ignore their countries’ currentaccounts and instead try to manipulate currency values to prevent large buildups of netforeign debt? That would be a perilous strategy because, as we will see in the next chap-ter, expectations of future exchange rates are central to market participants’ behavior.Systematic government attempts to reduce foreign investors’ wealth through exchangerate changes would sharply reduce foreigners’ demand for domestic currency assets, thusdecreasing or eliminating any wealth benefit from depreciating the home currency.
0.1 * 0.7 * 1.29 = 9.0
SUMMARY
1. International macroeconomics is concerned with the full employment of scarce eco-nomic resources and price level stability throughout the world economy. Because theyreflect national expenditure patterns and their international repercussions, the nationalincome accounts and the balance of payments accounts are essential tools for studyingthe macroeconomics of open, interdependent economies.
2. A country’s gross national product (GNP) is equal to the income received by its factors ofproduction. The national income accounts divide national income according to the types ofspending that generate it: consumption, investment, government purchases, and the currentaccount balance. Gross domestic product (GDP), equal to GNP less net receipts of factorincome from abroad, measures the output produced within a country’s territorial borders.
3. In an economy closed to international trade, GNP must be consumed, invested, or pur-chased by the government. By using current output to build plant, equipment, andinventories, investment transforms present output into future output. For a closedeconomy, investment is the only way to save in the aggregate, so the sum of the savingcarried out by the private and public sectors, national saving, must equal investment.
4. In an open economy, GNP equals the sum of consumption, investment, governmentpurchases, and net exports of goods and services. Trade does not have to be balanced ifthe economy can borrow from and lend to the rest of the world. The differencebetween the economy’s exports and imports, the current account balance, equals thedifference between the economy’s output and its total use of goods and services.
5. The current account also equals the country’s net lending to foreigners. Unlike a closedeconomy, an open economy can save by domestic and foreign investments. Nationalsaving therefore equals domestic investment plus the current account balance.
M13_KRUG6654_09_SE_C13.QXD 10/21/10 10:57 PM Page 316
6. Balance of payments accounts provide a detailed picture of the composition and financingof the current account. All transactions between a country and the rest of the world arerecorded in the country’s balance of payments accounts. The accounts are based on theconvention that any transaction resulting in a payment to foreigners is entered as a debitwhile any transaction resulting in a receipt from foreigners is entered as a credit.
7. Transactions involving goods and services appear in the current account of the balance ofpayments, while international sales or purchases of assets appear in the financialaccount. The capital account records mainly nonmarket asset transfers and tends to besmall for the United States. The sum of the current and capital account balances mustequal the financial account balance (net financial flows). This feature of the accountsreflects the fact that discrepancies between export earnings and import expenditures mustbe matched by a promise to repay the difference, usually with interest, in the future.
8. International asset transactions carried out by central banks are included in the financialaccount. Any central bank transaction in private markets for foreign currency assets iscalled official foreign exchange intervention. One reason intervention is important is thatcentral banks use it as a way to change the amount of money in circulation. A country hasa deficit in its balance of payments when it is running down its official internationalreserves or borrowing from foreign central banks; it has a surplus in the opposite case.
KEY TERMS
CHAPTER 13 National Income Accounting and the Balance of Payments 317
asset, p. 306balance of payments
accounting, p. 294capital account, p. 307central bank, p. 312consumption, p. 298current account balance, p. 300financial account, p. 306government budget deficit, p. 304government purchases, p. 299
gross domestic product (GDP), p. 297
gross national product (GNP), p. 295
investment, p. 298macroeconomics, p. 293microeconomics, p. 293national income, p. 296national income accounting,
p. 294
national saving, p. 302official foreign exchange
intervention, p. 312official international reserves,
p. 312official settlements balance
(or balance of payments), p. 313
private saving, p. 303
PROBLEMS
1. We stated in this chapter that GNP accounts avoid double counting by including onlythe value of final goods and services sold on the market. Should the measure of im-ports used in the GNP accounts therefore be defined to include only imports of finalgoods and services from abroad? What about exports?
2. Equation (13-2) tells us that to reduce a current account deficit, a country must increaseits private saving, reduce domestic investment, or cut its government budget deficit.Nowadays, some people recommend restrictions on imports from China (and other coun-tries) to reduce the American current account deficit. How would higher U.S. barriers toimports affect its private saving, domestic investment, and government deficit? Do youagree that import restrictions would necessarily reduce a U.S. current account deficit?
3. Explain how each of the following transactions generates two entries—a credit and adebit—in the American balance of payments accounts, and describe how each entrywould be classified:a. An American buys a share of German stock, paying by writing a check on an
account with a Swiss bank.b. An American buys a share of German stock, paying the seller with a check on an
American bank.
M13_KRUG6654_09_SE_C13.QXD 10/21/10 10:57 PM Page 317
318 PART THREE Exchange Rates and Open-Economy Macroeconomics
c. The Korean government carries out an official foreign exchange intervention in whichit uses dollars held in an American bank to buy Korean currency from its citizens.
d. A tourist from Detroit buys a meal at an expensive restaurant in Lyons, France,paying with a traveler’s check.
e. A California winemaker contributes a case of cabernet sauvignon for a Londonwine tasting.
f. A U.S.-owned factory in Britain uses local earnings to buy additional machinery.4. A New Yorker travels to New Jersey to buy a $100 telephone answering machine. The
New Jersey company that sells the machine then deposits the $100 check in itsaccount at a New York bank. How would these transactions show up in the balance ofpayments accounts of New York and New Jersey? What if the New Yorker pays cashfor the machine?
5. The nation of Pecunia had a current account deficit of $1 billion and a nonreservefinancial account surplus of $500 million in 2008.a. What was the balance of payments of Pecunia in that year? What happened to the
country’s net foreign assets?b. Assume that foreign central banks neither buy nor sell Pecunian assets. How did
the Pecunian central bank’s foreign reserves change in 2008? How would this offi-cial intervention show up in the balance of payments accounts of Pecunia?
c. How would your answer to (b) change if you learned that foreign central banks hadpurchased $600 million of Pecunian assets in 2008? How would these official pur-chases enter foreign balance of payments accounts?
d. Draw up the Pecunian balance of payments accounts for 2008 under the assumptionthat the event described in (c) occurred in that year.
6. Can you think of reasons why a government might be concerned about a large currentaccount deficit or surplus? Why might a government be concerned about its officialsettlements balance (that is, its balance of payments)?
7. Do data on the U.S. official settlements balance give an accurate picture of the extentto which foreign central banks buy and sell dollars in currency markets?
8. Is it possible for a country to have a current account deficit at the same time it has asurplus in its balance of payments? Explain your answer, using hypothetical figuresfor the current and nonreserve financial accounts. Be sure to discuss the possibleimplications for official international reserve flows.
9. Suppose that the U.S. net foreign debt is 25 percent of U.S. GDP and that foreign as-sets and liabilities alike pay an interest rate of 5 percent per year. What would be thedrain on U.S. GDP (as a percentage) from paying interest on the net foreign debt? Doyou think this is a large number? What if the net foreign debt were 100 percent ofGDP? At what point do you think a country’s government should become worriedabout the size of its foreign debt?
10. If you go to the BEA website (http://www.bea.gov) and look at the Survey of CurrentBusiness for July 2010, the table on “U.S. International Transactions,” you will findthat in 2009, U.S. income receipts on its foreign assets were $585.2 billion (line 13),while the country’s payments on liabilities to foreigners were $456.0 billion (line 30).Yet we saw in this chapter that the United States is a substantial net debtor to foreign-ers. How, then, is it possible that the United States received more foreign asset incomethan it paid out?
11. Return to the example in this chapter’s final Case Study of how a 10 percent dollardepreciation affects U.S. net foreign wealth (page 000). Show the size of the effect onforeigners’ net foreign wealth measured in dollars (as a percent of U.S. GDP).
12. We mentioned in the chapter that capital gains and losses on a country’s net foreignassets are not included in the national income measure of the current account. How
M13_KRUG6654_09_SE_C13.QXD 10/21/10 10:57 PM Page 318
CHAPTER 13 National Income Accounting and the Balance of Payments 319
would economic statisticians have to modify the national income identity (13-1) if theywish to include such gains and losses as part of the definition of the current account? Inyour opinion, would this make sense? Why do you think this is not done in practice?
13. Using the data in the “Memoranda” to Table 13-3, calculate the U.S. 2009 net interna-tional investment position with direct investments valued at market prices.
FURTHER READINGS
European Commission, International Monetary Fund, Organisation for Economic Co-operation andDevelopment, United Nations, and World Bank. System of National Accounts 2008. New York:United Nations, 2009. Definitive guidelines for constructing national income and productaccounts.
William Griever, Gary Lee, and Francis Warnock. “The U.S. System for Measuring Cross-BorderInvestment in Securities: A Primer with a Discussion of Recent Developments.” Federal ReserveBulletin 87 (October 2001), pp. 633–650. Critical description of U.S. procedures for measuringforeign assets and liabilities.
International Monetary Fund. Balance of Payments and International Investment Position Manual,6th edition. Washington, D.C.: International Monetary Fund, 2009. Authoritative treatment ofbalance of payments accounting.
International Monetary Fund. Final Report of the Working Party on the Statistical Discrepancy inWorld Current Account Balances. Washington, D.C.: International Monetary Fund, September1987. Discusses the statistical discrepancy in the world current account balance, its implicationsfor policy analysis, and recommendations for more accurate measurement.
Philip R. Lane and Gian Maria Milesi-Ferretti. “The External Wealth of Nations Mark II: Revisedand Extended Estimates of Foreign Assets and Liabilities, 1970–2004.” Journal of InternationalEconomics 73 (November 2007), pp. 223–250. Applies a common methodology to constructinternational position data for a large sample of countries.
Robert E. Lipsey. “Changing Patterns of International Investment in and by the United States,” inMartin S. Feldstein, ed. The United States in the World Economy. Chicago: University ofChicago Press, 1988, pp. 475–545. Historical perspective on financial flows to and from theUnited States.
Catherine L. Mann. “Perspectives on the U.S. Current Account Deficit and Sustainability.” Journalof Economic Perspectives 16 (Summer 2002), pp. 131–152. Examines the causes and conse-quences of recent U.S. current account deficits.
James E. Meade. The Balance of Payments, Chapters 1–3. London: Oxford University Press, 1952.A classic analytical discussion of balance of payments concepts.
Cédric Tille. “The Impact of Exchange Rate Movements on U.S. Foreign Debt.” Current Issues inEconomics and Finance (Federal Reserve Bank of New York) 9 (January 2003), pp. 1–7.Discusses the implications of asset price changes for U.S. foreign assets.
MYECONLAB CAN HELP YOU GET A BETTER GRADEIf your exam were tomorrow, would you be ready? For each chapter,
MyEconLab Practice Tests and Study Plans pinpoint which sections you havemastered and which ones you need to study. That way, you are more efficientwith your study time, and you are better prepared for your exams.
To see how it works, turn to page 9 and then go to www.myeconlab.com/krugman
M13_KRUG6654_09_SE_C13.QXD 10/21/10 10:57 PM Page 319