Embed Size (px)
Citation preview
U.S. Department of Commerce | National Oceanic and Atmospheric Administration | National Marine Fisheries Service
National Snapshot, January-July 2020
NOAA Fisheries Updated Impact Assessment of the COVID-19 Crisis on the U.S. Commercial Seafood and Recreational For-Hire/Charter Industries
In April 2020, NOAA Fisheries prepared its first national report on the regional impacts of COVID-19 on the com-mercial, recreational and aquaculture sec-tors. This report updates that initial assessment, captur ing economic changes experienced by the fishing industry as the country began its phased reopening along with infusion of Federal funding through the CARES Act. NOAA Fisheries will continue to use this information to identify economic hard-ship where it exists and identify pathways for enhancing the resilience of the U.S. seafood and fisheries industries.
The COVID-19 virus emerged in January 2020 as a factor capable of disrupting global markets, includ-ing seafood markets. As documented in our earlier assessment, the broad-scale closure of ports and seafood processing facilities in China resulted in a 32% decrease in U.S. seafood exports to China in January, followed by a 45% decline in exports in February relative to the previous year. In March, the protective measures implemented in the United States and in many other countries to reduce the transmission of the disease—including closing restaurants but eventually extending to stay-at-home orders for all but essential workers—triggered a series of economic shockwaves across the seafood industry, including aquaculture and the for-hire fishing sector.
This report provides a snapshot of the effects of COVID-19 on the seafood and fishing industry through summer 2020. Overall, this sobering assessment reveals a deteriorating situation begin-ning in March 2020.
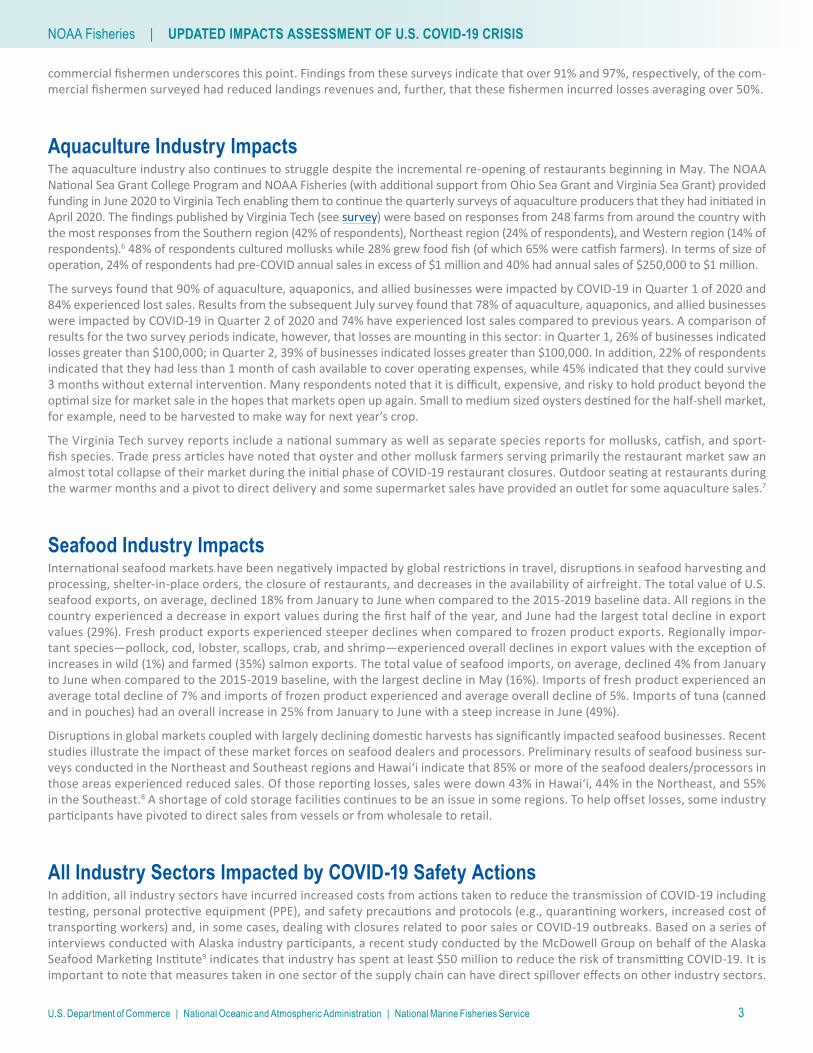
Commercial Fisheries Landings Trends and Impacts through July 2020NATIONAL LANDINGS REVENUEAs restaurant restrictions and other social distancing measures (including stay-at-home orders) were implemented both domestically and abroad beginning in March 2020, the seafood sector experienced an almost immediate impact on their sales. Commercial fisheries landings revenue, which averaged $5.8 billion annually from 2015 to 2019,1 declined 19% in March relative to the 5-year monthly aver-age (henceforth referred to as baseline) and continued to lose ground month over month throughout the spring.2 Preliminary data indicates that landings revenue declined 34% in April; 36% in May; 40% in June; and 45% in July (see Figure 1). Due to a relatively strong start to the year (landings revenues were up 3% for January through February), landings revenue was only down 22% through June 2020 relative to the baseline; sizable declines in almost all regions in July resulted in landings revenue declining 29% nationally for January through July 2020 relative to the baseline.
U.S. Department of Commerce | National Oceanic and Atmospheric Administration | National Marine Fisheries Service
NOAA Fisheries | UPDATED IMPACTS ASSESSMENT OF U.S. COVID-19 CRISIS
2
REGIONAL LANDINGS REVENUERelative to their respective baseline periods, regional landings revenue since March 2020 are down 29% to 42% (Alaska, -40%; West Coast, -31%; Hawaiʻi, -42%; Northeast, -34%; Southeast, -29%; Atlantic HMS, -37%).3 Depressed market conditions existed in all regions, with the timing of impacts varying across regions and fisheries. Since March only one region has posted an increase in monthly landings revenue—Southeast landings revenue for federally managed species was up 2% in June relative to 2019.
• Alaska – Alaska landings revenuedeclined 14% in March and April butwas down 51% in May through July.August landings are not as sharplydown (-32%) relative to the baseline,as some fisheries were able to moveeffort to later in the season.
• West Coast – On the West Coast, landings revenue declines forMarch through June fluctuated between 21% and 32% relative to the baseline, with the largest monthly decline occurring in June.
• Northeast – In the Northeast, landings revenue declines forMarch through June fluctuated between 25% and 49% relativeto the baseline, with the largest monthly declines occurringin April and May (49% and 45%, respectively).
• Southeast – Landings revenue in selected Southeast federallymanaged fisheries was down 39% in March and April rela-tive to 2019, improving slightly in May (-29%) and posting a2% increase in June.
• Hawaiʻi – Hawaiʻi landings revenue experienced its highestlosses in March and April relative to the baseline, in whichlandings revenue was down 49% and continued to experi-ence heavy losses in May through July (-37%).
• Atlantic HMS – Atlantic HMS landings revenue declined 50%in March through May but, based upon improved swordfishmarket conditions, landings revenue overall declined 27%for June and July.
Figure 1. January to July 2020 and 5-year baseline (2015-2019) of U.S. commercial fisheries landings revenue (in millions) by month.
LANDINGS REVENUE BY FISHERYThis report also documents broad declines across virtually all commercial fisheries. Landings revenue of high-value species (e.g., tunas, halibut, sablefish, lobster, sea scallops, salmon, snap-pers, and black sea bass) that typically rely on strong restaurant demand for fresh seafood here and abroad generally fell 30% to 80% relative to baseline values due to restaurant closures and reduced exports. However, losses are not limited to high-value fisheries. All regional snapshots document landings revenue declines across the majority of their respective fisheries.
Landings revenues of some species were relatively flat (e.g., Alaska flatfish, -4%) or improved relative to the baseline. Alaska crab and rockfish landings revenue increased relative to the baseline, as did West Coast market squid and California salmon landings revenue. It should be noted, however, that the California salmon landings
revenue increase can be attributed to poor stock conditions in prior years. In contrast, salmon landings revenue was down 59% and 82%, respectively, in Oregon and Washington and down 44% in Alaska relative to the baseline. Similar to California salmon, Alaska crab landings revenue increased, but this was largely due to Bering Sea snow crab total allowable catch (TAC) increasing for the third straight season.
In addition, there are some species for which the economic outlook may be improving. For example, in the Atlantic Highly Migratory Species fishery swordfish prices increased 20% in the second quarter relative to 2019 and landings revenue, though still down sharply for this quarter, showed an improving trend (land-ings revenue decreased 65.9% in April, 36.9% in May, and 12.0% in June as compared to those months in 2019). In July, the value of swordfish landings recovered substantially and far exceeded the weak July 2019 harvest.
While grocery store sales of shelf-stable and frozen seafood prod-uct forms had strong sales this spring,4 overall losses were signifi
-
cant as more than 70% of seafood is consumed in restaurants.5
Given the relative size of these two markets (restaurant versus grocery), the large gains from grocery store sales were unable to significantly offset severe losses from seafood restaurant sales, which were largely closed or operating under reduced capacity across the country and globally for much of this period. In addi-tion, it is unclear what percentage of grocery store seafood sales came from imported product.
All of the regional snapshots reflect substantial losses in the majority of their fisheries.
As documented herein, the fisheries/species with higher landings revenue or recently improved performance are the exceptions. All of the regional snapshots reflect substantial losses in the major-ity of their fisheries. A recent survey of Northeast and Southeast
U.S. Department of Commerce | National Oceanic and Atmospheric Administration | National Marine Fisheries Service
NOAA Fisheries | UPDATED IMPACTS ASSESSMENT OF U.S. COVID-19 CRISIS
3
commercial fishermen underscores this point. Findings from these surveys indicate that over 91% and 97%, respectively, of the com-mercial fishermen surveyed had reduced landings revenues and, further, that these fishermen incurred losses averaging over 50%.
Aquaculture Industry ImpactsThe aquaculture industry also continues to struggle despite the incremental re-opening of restaurants beginning in May. The NOAA National Sea Grant College Program and NOAA Fisheries (with additional support from Ohio Sea Grant and Virginia Sea Grant) provided funding in June 2020 to Virginia Tech enabling them to continue the quarterly surveys of aquaculture producers that they had initiated in April 2020. The findings published by Virginia Tech (see survey) were based on responses from 248 farms from around the country with the most responses from the Southern region (42% of respondents), Northeast region (24% of respondents), and Western region (14% of respondents).6 48% of respondents cultured mollusks while 28% grew food fish (of which 65% were catfish farmers). In terms of size of operation, 24% of respondents had pre-COVID annual sales in excess of $1 million and 40% had annual sales of $250,000 to $1 million.
The surveys found that 90% of aquaculture, aquaponics, and allied businesses were impacted by COVID-19 in Quarter 1 of 2020 and 84% experienced lost sales. Results from the subsequent July survey found that 78% of aquaculture, aquaponics, and allied businesses were impacted by COVID-19 in Quarter 2 of 2020 and 74% have experienced lost sales compared to previous years. A comparison of results for the two survey periods indicate, however, that losses are mounting in this sector: in Quarter 1, 26% of businesses indicated losses greater than $100,000; in Quarter 2, 39% of businesses indicated losses greater than $100,000. In addition, 22% of respondents indicated that they had less than 1 month of cash available to cover operating expenses, while 45% indicated that they could survive 3 months without external intervention. Many respondents noted that it is difficult, expensive, and risky to hold product beyond the optimal size for market sale in the hopes that markets open up again. Small to medium sized oysters destined for the half-shell market, for example, need to be harvested to make way for next year’s crop.
The Virginia Tech survey reports include a national summary as well as separate species reports for mollusks, catfish, and sport-fish species. Trade press articles have noted that oyster and other mollusk farmers serving primarily the restaurant market saw an almost total collapse of their market during the initial phase of COVID-19 restaurant closures. Outdoor seating at restaurants during the warmer months and a pivot to direct delivery and some supermarket sales have provided an outlet for some aquaculture sales.7
Seafood Industry ImpactsInternational seafood markets have been negatively impacted by global restrictions in travel, disruptions in seafood harvesting and processing, shelter-in-place orders, the closure of restaurants, and decreases in the availability of airfreight. The total value of U.S. seafood exports, on average, declined 18% from January to June when compared to the 2015-2019 baseline data. All regions in the country experienced a decrease in export values during the first half of the year, and June had the largest total decline in export values (29%). Fresh product exports experienced steeper declines when compared to frozen product exports. Regionally impor-tant species—pollock, cod, lobster, scallops, crab, and shrimp—experienced overall declines in export values with the exception of increases in wild (1%) and farmed (35%) salmon exports. The total value of seafood imports, on average, declined 4% from January to June when compared to the 2015-2019 baseline, with the largest decline in May (16%). Imports of fresh product experienced an average total decline of 7% and imports of frozen product experienced and average overall decline of 5%. Imports of tuna (canned and in pouches) had an overall increase in 25% from January to June with a steep increase in June (49%).
Disruptions in global markets coupled with largely declining domestic harvests has significantly impacted seafood businesses. Recent studies illustrate the impact of these market forces on seafood dealers and processors. Preliminary results of seafood business sur-veys conducted in the Northeast and Southeast regions and Hawaiʻi indicate that 85% or more of the seafood dealers/processors in those areas experienced reduced sales. Of those reporting losses, sales were down 43% in Hawaiʻi, 44% in the Northeast, and 55% in the Southeast.8 A shortage of cold storage facilities continues to be an issue in some regions. To help offset losses, some industry participants have pivoted to direct sales from vessels or from wholesale to retail.
All Industry Sectors Impacted by COVID-19 Safety ActionsIn addition, all industry sectors have incurred increased costs from actions taken to reduce the transmission of COVID-19 including testing, personal protective equipment (PPE), and safety precautions and protocols (e.g., quarantining workers, increased cost of transporting workers) and, in some cases, dealing with closures related to poor sales or COVID-19 outbreaks. Based on a series of interviews conducted with Alaska industry participants, a recent study conducted by the McDowell Group on behalf of the Alaska Seafood Marketing Institute9 indicates that industry has spent at least $50 million to reduce the risk of transmitting COVID-19. It is important to note that measures taken in one sector of the supply chain can have direct spillover effects on other industry sectors.
U.S. Department of Commerce | National Oceanic and Atmospheric Administration | National Marine Fisheries Service
NOAA Fisheries | UPDATED IMPACTS ASSESSMENT OF U.S. COVID-19 CRISIS
4
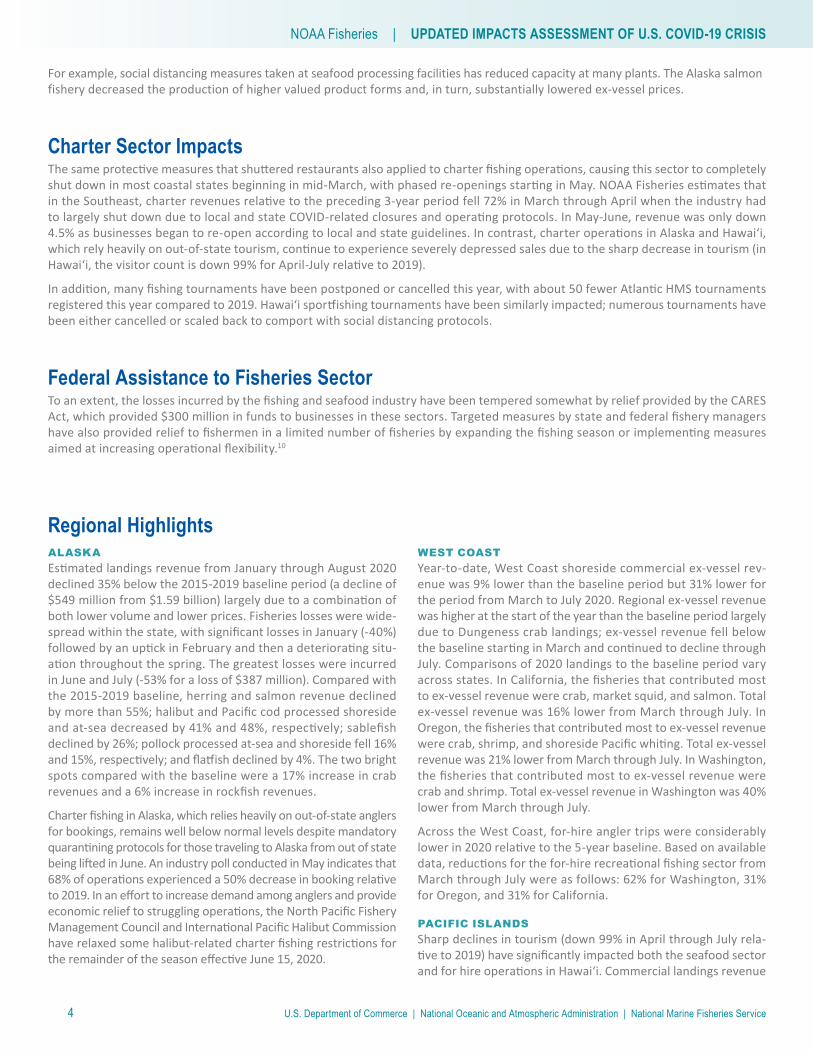
For example, social distancing measures taken at seafood processing facilities has reduced capacity at many plants. The Alaska salmon fishery decreased the production of higher valued product forms and, in turn, substantially lowered ex-vessel prices.
Charter Sector ImpactsThe same protective measures that shuttered restaurants also applied to charter fishing operations, causing this sector to completely shut down in most coastal states beginning in mid-March, with phased re-openings starting in May. NOAA Fisheries estimates that in the Southeast, charter revenues relative to the preceding 3-year period fell 72% in March through April when the industry had to largely shut down due to local and state COVID-related closures and operating protocols. In May-June, revenue was only down 4.5% as businesses began to re-open according to local and state guidelines. In contrast, charter operations in Alaska and Hawaiʻi, which rely heavily on out-of-state tourism, continue to experience severely depressed sales due to the sharp decrease in tourism (in Hawaiʻi, the visitor count is down 99% for April-July relative to 2019).
In addition, many fishing tournaments have been postponed or cancelled this year, with about 50 fewer Atlantic HMS tournaments registered this year compared to 2019. Hawaiʻi sportfishing tournaments have been similarly impacted; numerous tournaments have been either cancelled or scaled back to comport with social distancing protocols.
Federal Assistance to Fisheries SectorTo an extent, the losses incurred by the fishing and seafood industry have been tempered somewhat by relief provided by the CARES Act, which provided $300 million in funds to businesses in these sectors. Targeted measures by state and federal fishery managers have also provided relief to fishermen in a limited number of fisheries by expanding the fishing season or implementing measures aimed at increasing operational flexibility.10
Regional HighlightsALASKAEstimated landings revenue from January through August 2020 declined 35% below the 2015-2019 baseline period (a decline of $549 million from $1.59 billion) largely due to a combination of both lower volume and lower prices. Fisheries losses were wide-spread within the state, with significant losses in January (-40%) followed by an uptick in February and then a deteriorating situ-ation throughout the spring. The greatest losses were incurred in June and July (-53% for a loss of $387 million). Compared with the 2015-2019 baseline, herring and salmon revenue declined by more than 55%; halibut and Pacific cod processed shoreside and at-sea decreased by 41% and 48%, respectively; sablefish declined by 26%; pollock processed at-sea and shoreside fell 16% and 15%, respectively; and flatfish declined by 4%. The two bright spots compared with the baseline were a 17% increase in crab revenues and a 6% increase in rockfish revenues.
Charter fishing in Alaska, which relies heavily on out-of-state anglers for bookings, remains well below normal levels despite mandatory quarantining protocols for those traveling to Alaska from out of state being lifted in June. An industry poll conducted in May indicates that 68% of operations experienced a 50% decrease in booking relative to 2019. In an effort to increase demand among anglers and provide economic relief to struggling operations, the North Pacific Fishery Management Council and International Pacific Halibut Commission have relaxed some halibut-related charter fishing restrictions for the remainder of the season effective June 15, 2020.
WEST COASTYear-to-date, West Coast shoreside commercial ex-vessel rev-enue was 9% lower than the baseline period but 31% lower for the period from March to July 2020. Regional ex-vessel revenue was higher at the start of the year than the baseline period largely due to Dungeness crab landings; ex-vessel revenue fell below the baseline starting in March and continued to decline through July. Comparisons of 2020 landings to the baseline period vary across states. In California, the fisheries that contributed most to ex-vessel revenue were crab, market squid, and salmon. Total ex-vessel revenue was 16% lower from March through July. In Oregon, the fisheries that contributed most to ex-vessel revenue were crab, shrimp, and shoreside Pacific whiting. Total ex-vessel revenue was 21% lower from March through July. In Washington, the fisheries that contributed most to ex-vessel revenue were crab and shrimp. Total ex-vessel revenue in Washington was 40% lower from March through July.
Across the West Coast, for-hire angler trips were considerably lower in 2020 relative to the 5-year baseline. Based on available data, reductions for the for-hire recreational fishing sector from March through July were as follows: 62% for Washington, 31% for Oregon, and 31% for California.
PACIFIC ISLANDSSharp declines in tourism (down 99% in April through July rela-tive to 2019) have significantly impacted both the seafood sector and for hire operations in Hawaiʻi. Commercial landings revenue
U.S. Department of Commerce | National Oceanic and Atmospheric Administration | National Marine Fisheries Service
NOAA Fisheries | UPDATED IMPACTS ASSESSMENT OF U.S. COVID-19 CRISIS
5
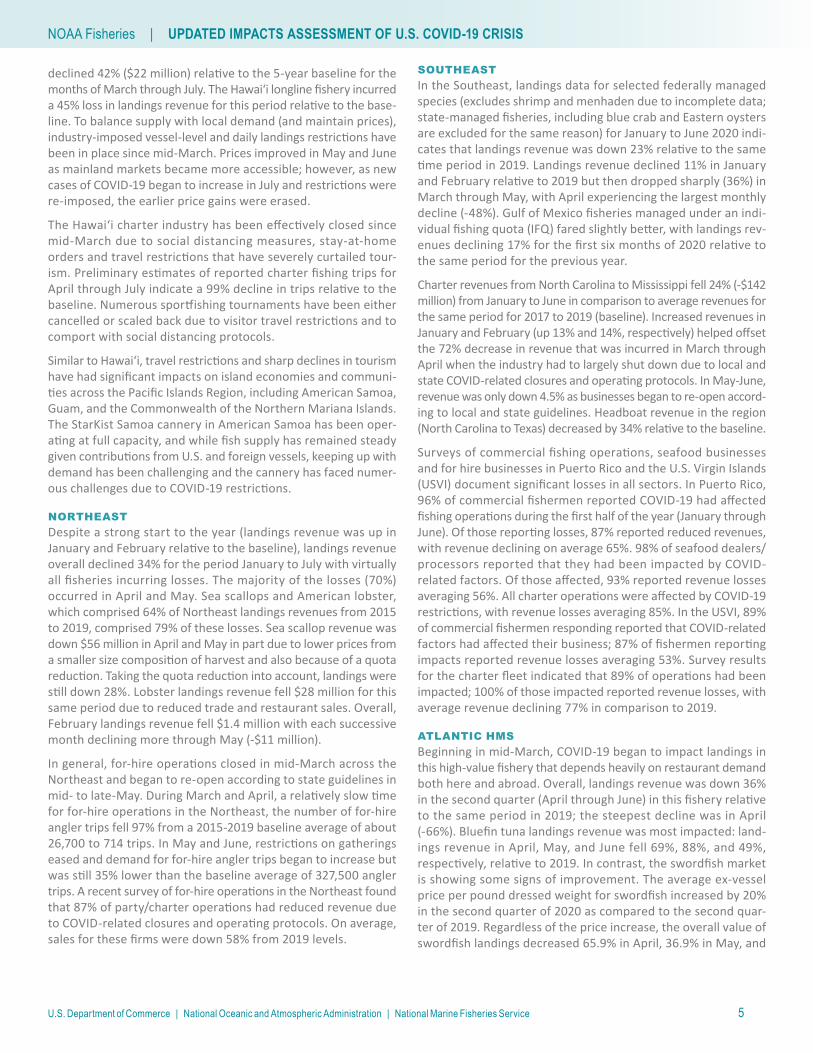
declined 42% ($22 million) relative to the 5-year baseline for the months of March through July. The Hawaiʻi longline fishery incurred a 45% loss in landings revenue for this period relative to the base-line. To balance supply with local demand (and maintain prices), industry-imposed vessel-level and daily landings restrictions have been in place since mid-March. Prices improved in May and June as mainland markets became more accessible; however, as new cases of COVID-19 began to increase in July and restrictions were re-imposed, the earlier price gains were erased.
The Hawaiʻi charter industry has been effectively closed since mid-March due to social distancing measures, stay-at-home orders and travel restrictions that have severely curtailed tour-ism. Preliminary estimates of reported charter fishing trips for April through July indicate a 99% decline in trips relative to the baseline. Numerous sportfishing tournaments have been either cancelled or scaled back due to visitor travel restrictions and to comport with social distancing protocols.
Similar to Hawaiʻi, travel restrictions and sharp declines in tourism have had significant impacts on island economies and communi-ties across the Pacific Islands Region, including American Samoa, Guam, and the Commonwealth of the Northern Mariana Islands. The StarKist Samoa cannery in American Samoa has been oper-ating at full capacity, and while fish supply has remained steady given contributions from U.S. and foreign vessels, keeping up with demand has been challenging and the cannery has faced numer-ous challenges due to COVID-19 restrictions.
NORTHEASTDespite a strong start to the year (landings revenue was up in January and February relative to the baseline), landings revenue overall declined 34% for the period January to July with virtually all fisheries incurring losses. The majority of the losses (70%) occurred in April and May. Sea scallops and American lobster, which comprised 64% of Northeast landings revenues from 2015 to 2019, comprised 79% of these losses. Sea scallop revenue was down $56 million in April and May in part due to lower prices from a smaller size composition of harvest and also because of a quota reduction. Taking the quota reduction into account, landings were still down 28%. Lobster landings revenue fell $28 million for this same period due to reduced trade and restaurant sales. Overall, February landings revenue fell $1.4 million with each successive month declining more through May (-$11 million).
In general, for-hire operations closed in mid-March across the Northeast and began to re-open according to state guidelines in mid- to late-May. During March and April, a relatively slow time for for-hire operations in the Northeast, the number of for-hire angler trips fell 97% from a 2015-2019 baseline average of about 26,700 to 714 trips. In May and June, restrictions on gatherings eased and demand for for-hire angler trips began to increase but was still 35% lower than the baseline average of 327,500 angler trips. A recent survey of for-hire operations in the Northeast found that 87% of party/charter operations had reduced revenue due to COVID-related closures and operating protocols. On average, sales for these firms were down 58% from 2019 levels.
SOUTHEASTIn the Southeast, landings data for selected federally managed species (excludes shrimp and menhaden due to incomplete data; state-managed fisheries, including blue crab and Eastern oysters are excluded for the same reason) for January to June 2020 indi-cates that landings revenue was down 23% relative to the same time period in 2019. Landings revenue declined 11% in January and February relative to 2019 but then dropped sharply (36%) in March through May, with April experiencing the largest monthly decline (-48%). Gulf of Mexico fisheries managed under an indi-vidual fishing quota (IFQ) fared slightly better, with landings rev-enues declining 17% for the first six months of 2020 relative to the same period for the previous year.
Charter revenues from North Carolina to Mississippi fell 24% (-$142 million) from January to June in comparison to average revenues for the same period for 2017 to 2019 (baseline). Increased revenues in January and February (up 13% and 14%, respectively) helped offset the 72% decrease in revenue that was incurred in March through April when the industry had to largely shut down due to local and state COVID-related closures and operating protocols. In May-June, revenue was only down 4.5% as businesses began to re-open accord-ing to local and state guidelines. Headboat revenue in the region (North Carolina to Texas) decreased by 34% relative to the baseline.
Surveys of commercial fishing operations, seafood businesses and for hire businesses in Puerto Rico and the U.S. Virgin Islands (USVI) document significant losses in all sectors. In Puerto Rico, 96% of commercial fishermen reported COVID-19 had affected fishing operations during the first half of the year (January through June). Of those reporting losses, 87% reported reduced revenues, with revenue declining on average 65%. 98% of seafood dealers/processors reported that they had been impacted by COVID-related factors. Of those affected, 93% reported revenue losses averaging 56%. All charter operations were affected by COVID-19 restrictions, with revenue losses averaging 85%. In the USVI, 89% of commercial fishermen responding reported that COVID-related factors had affected their business; 87% of fishermen reporting impacts reported revenue losses averaging 53%. Survey results for the charter fleet indicated that 89% of operations had been impacted; 100% of those impacted reported revenue losses, with average revenue declining 77% in comparison to 2019.
ATLANTIC HMSBeginning in mid-March, COVID-19 began to impact landings in this high-value fishery that depends heavily on restaurant demand both here and abroad. Overall, landings revenue was down 36% in the second quarter (April through June) in this fishery relative to the same period in 2019; the steepest decline was in April (-66%). Bluefin tuna landings revenue was most impacted: land-ings revenue in April, May, and June fell 69%, 88%, and 49%, respectively, relative to 2019. In contrast, the swordfish market is showing some signs of improvement. The average ex-vessel price per pound dressed weight for swordfish increased by 20% in the second quarter of 2020 as compared to the second quar-ter of 2019. Regardless of the price increase, the overall value of swordfish landings decreased 65.9% in April, 36.9% in May, and
12.0% in June as compared to those months in 2019. In July, the value of swordfish landings recov-ered substantially and far exceeded the weak July 2019 harvest.
Atlantic HMS charter operations have also been impacted by COVID-related closures and operat-ing protocols. Atlantic HMS staff interviewed charter operators in April to understand the impact of COVID-19 on their operations. Overall, vessel captains reported that 97% of April trips had been can-celled, and most reported cancellations extending into May. Atlantic HMS tournaments have also been impacted, with registration declining 40% compared to 2019 in the second quarter. Overall, there are 25% fewer registered tournaments occurring through August 2020 compared to 2019.
Endnotes1 All monetary figures are in inflation-adjusted 2020 dollars.
2 All data is preliminary; landings revenue for selected fisheries was deemed too incomplete or was unavailable to include in this assessment. In general, this included a number of state-managed fisheries and shellfish species. Southeast landings revenues are only for federally managed finfish spe-cies and the baseline period is 2019; the baseline period for Atlantic Highly Migratory Species is also 2019. In addition, the at-sea Pacific whiting fish-ery is excluded. See the regional assessments for more specific information on excluded fisheries.
3 Landings revenue for both 2020 and the baseline periods is through June for the Southeast region; through July for the Atlantic Highly Migratory Species (HMS) fishery and the Northeast, Hawai̒ i, and West Coast regions; and through August for Alaska.
4 SeafoodSource, citing Nielsen data, reported that frozen seafood sales surged 51% for March through May 2020 and grocery/ shelf-stable seafood surged 59% relative to previous year (see https://www.seafoodsource.com/news/foodservice-retail/covid-19-presenting-sales-boost-opportunity-for-retail-seafood. Notably, U.S. canned tuna retail sales in the first quar-ter of the year increased 44% while “fancy” tuna products, mainly pouches, increased 33% relative to 2019; sales in the second quarter improved 23% for canned tuna and 8% for pouches relative to 2019 (see https://ihsmarkit.com/research-analysis/article-canned-tuna-market-revival-in-the-context-of-global-cr.html).
5 National Marine Fisheries Service (2018) Fisheries of the United States,
2017. U.S. Department of Commerce, NOAA Current Fishery Statistics No. 2017 Available at: https://www.fisheries.noaa.gov/national/ fisheries-united-states-2017
6 13% of respondents did not answer this ques-tion; the North Central (5% of respondents) and Tropical & Sub-Tropical (2% of respondents) regions accounted for the remainder of responses.
7 For example, see https://thecounter.org/alaska-oyster-farmers-struggle-coronavirus-covid-19-pan-demic/; and https://www.aquaculturealliance.org/advocate/covid-19-has-the-west-coast-shellfish-sector-on-hold/
8 See regional snapshots for additional information.
9 https://uploads.alaskaseafood.org/2020/09/COVID-Alaska-Seafood-Impacts-September-2020-Revised.pdf
10 For example, see: a) https://www.federalreg-ister.gov/documents/2020/06/25/2020-13710/fisheries-of-the-exclusive-economic-zone-off-alaska-ifq-program-modify-temporary-transfer-provisions; b) https://www.federalregister.gov/documents/2020/06/19/2020-13288/fisheries-off-west-coast-states-emergency-action-to-temporarily-remove-seasonal-processing; c) https://www.mass.gov/doc/82020-mfac-business-meeting-summary/download (see https://www.gloucestertimes.com/news/fishing_industry_news/state-looks-to-extend-season-for-some-species/article_0eb0c870-e28d-5e4d-a88a-d7da7e374127.html for media story); and d) http://www.dem.ri.gov/programs/marine-fisheries/fishamnd.php (see https://www.thewesterlysun.com/news/covid-19/weathering-the-storm-rhode-islands-commercial-fishery-hit-hard-by-covid-19-pandemic/article_3305f058-783d-11ea-be3b-cf4ea09a73b5.html for additional information).
NOAA Fisheries Coronavirus (COVID-19) UpdateFor more information, visit:
https://www.fisheries.noaa.gov/national/noaa-fisheries-coronavirus-covid-19-update
U.S. Secretary of Commerce
Wilbur Ross
Acting Under Secretary of Commerce for Oceans and Atmosphere
Dr. Neil Jacobs
Assistant Administrator for Fisheries
Chris Oliver
Januar y 2021
w w w.f isher ies.noaa.gov
OFFICIAL BUSINESS
National Marine Fisheries Service1315 East-West HighwaySilver Spring, MD 20910