Embed Size (px)
Citation preview
AA
DU
National Ports Authority 2018
Highlights• Revenue increased by 12,7% to R11,7 billion• EBITDA increased to R7,2 billion• Operating expenses increased to R4,5 billion
Business overviewTransnet National Ports Authority (National Ports Authority) was established through the National Ports Act, No 12 of 2005 (the Ports Act) to be a landlord port responsible for the safe, efficient, effective and economic functioning of the national ports system which it manages, controls and administers on behalf of the State.
According to section 11 of the Ports Act, the core functions of the National Ports Authority are to:• Plan, provide, maintain and improve port infrastructure;• Promote the use, improvement and development of ports and
control land use within the ports, having the power to lease port land under conditions that it determines;
• Promote greater representation, in particular to increase participation of historically disadvantaged people in port operations;
• Provide or arrange marine-related services, i.e. pilotage services, tug assistance, berthing services, dredging and hydrographic services;
• Ensure that adequate, affordable and efficient port services and facilities are provided, including regulatory oversight over all port activities; and
• Provide aids such as tugs, pilot boats and other facilities and services for the navigation of vessels within port limits and along the coast.
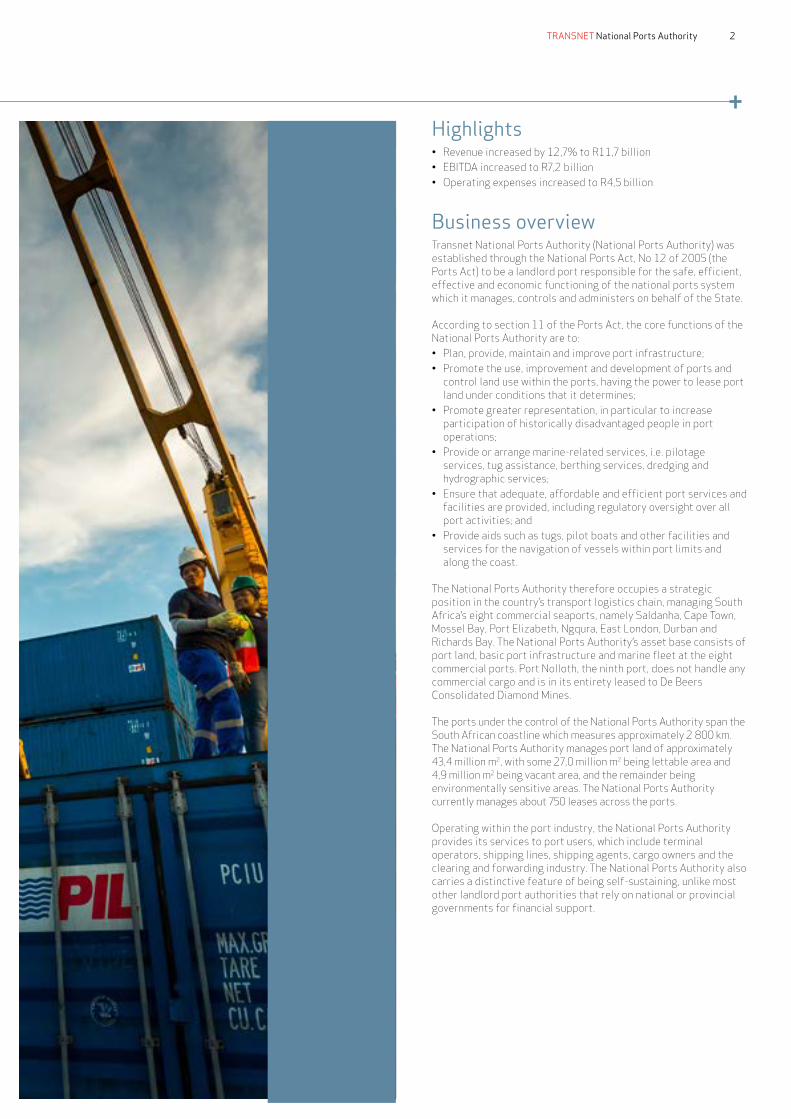
The National Ports Authority therefore occupies a strategic position in the country’s transport logistics chain, managing South Africa’s eight commercial seaports, namely Saldanha, Cape Town, Mossel Bay, Port Elizabeth, Ngqura, East London, Durban and Richards Bay. The National Ports Authority’s asset base consists of port land, basic port infrastructure and marine fleet at the eight commercial ports. Port Nolloth, the ninth port, does not handle any commercial cargo and is in its entirety leased to De Beers Consolidated Diamond Mines.
The ports under the control of the National Ports Authority span the South African coastline which measures approximately 2 800 km. The National Ports Authority manages port land of approximately 43,4 million m2, with some 27,0 million m2 being lettable area and 4,9 million m2 being vacant area, and the remainder being environmentally sensitive areas. The National Ports Authority currently manages about 750 leases across the ports.
Operating within the port industry, the National Ports Authority provides its services to port users, which include terminal operators, shipping lines, shipping agents, cargo owners and the clearing and forwarding industry. The National Ports Authority also carries a distinctive feature of being self-sustaining, unlike most other landlord port authorities that rely on national or provincial governments for financial support.
2TRANSNET National Ports Authority
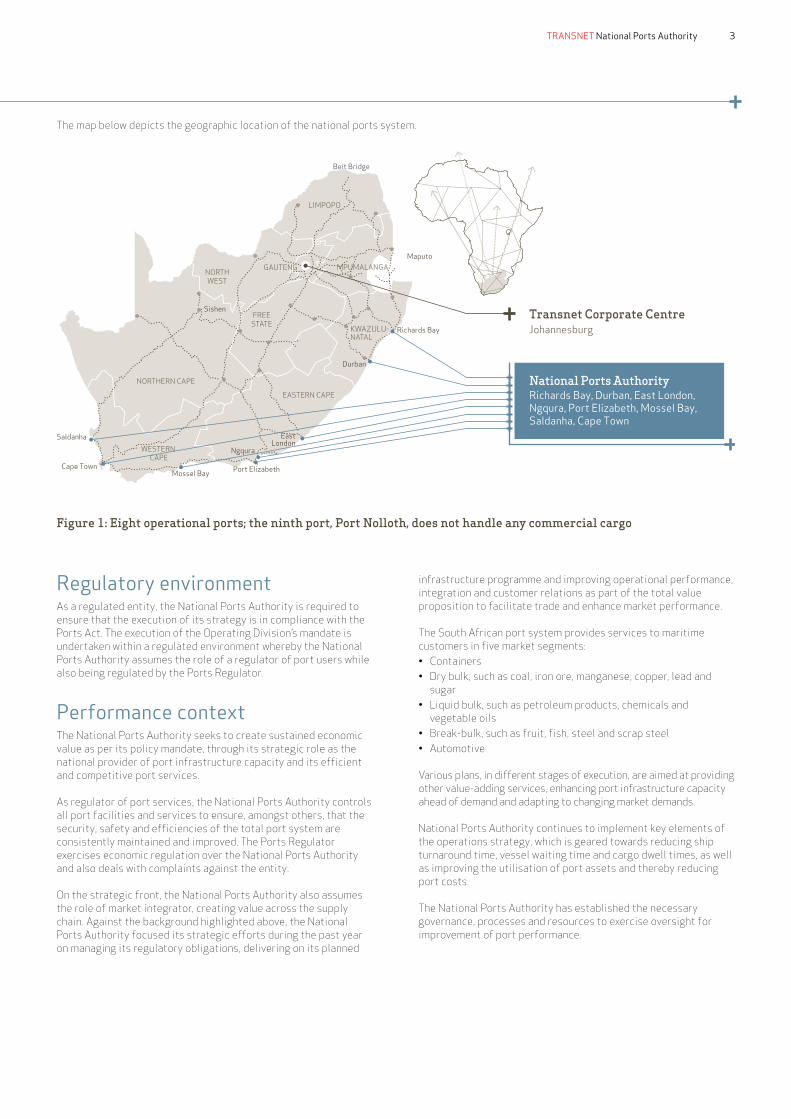
The map below depicts the geographic location of the national ports system.
Beit Bridge
LIMPOPO
MPUMALANGANORTHWEST
FREESTATE KWAZULU-
NATAL
EASTERN CAPE
GAUTENG
NORTHERN CAPE
Maputo
Richards Bay
Durban
Port ElizabethMossel BayCape Town
Saldanha
Sishen
Ngqura
EastLondon
WESTERN CAPE
Transnet Corporate CentreJohannesburg
National Ports AuthorityRichards Bay, Durban, East London, Ngqura, Port Elizabeth, Mossel Bay, Saldanha, Cape Town
Figure 1: Eight operational ports; the ninth port, Port Nolloth, does not handle any commercial cargo
Regulatory environmentAs a regulated entity, the National Ports Authority is required to ensure that the execution of its strategy is in compliance with the Ports Act. The execution of the Operating Division’s mandate is undertaken within a regulated environment whereby the National Ports Authority assumes the role of a regulator of port users while also being regulated by the Ports Regulator.
Performance contextThe National Ports Authority seeks to create sustained economic value as per its policy mandate, through its strategic role as the national provider of port infrastructure capacity and its efficient and competitive port services.
As regulator of port services, the National Ports Authority controls all port facilities and services to ensure, amongst others, that the security, safety and efficiencies of the total port system are consistently maintained and improved. The Ports Regulator exercises economic regulation over the National Ports Authority and also deals with complaints against the entity.
On the strategic front, the National Ports Authority also assumes the role of market integrator, creating value across the supply chain. Against the background highlighted above, the National Ports Authority focused its strategic efforts during the past year on managing its regulatory obligations, delivering on its planned
infrastructure programme and improving operational performance, integration and customer relations as part of the total value proposition to facilitate trade and enhance market performance.
The South African port system provides services to maritime customers in five market segments:• Containers• Dry bulk, such as coal, iron ore, manganese, copper, lead and
sugar• Liquid bulk, such as petroleum products, chemicals and
vegetable oils• Break-bulk, such as fruit, fish, steel and scrap steel• Automotive
Various plans, in different stages of execution, are aimed at providing other value-adding services, enhancing port infrastructure capacity ahead of demand and adapting to changing market demands.
National Ports Authority continues to implement key elements of the operations strategy, which is geared towards reducing ship turnaround time, vessel waiting time and cargo dwell times, as well as improving the utilisation of port assets and thereby reducing port costs.
The National Ports Authority has established the necessary governance, processes and resources to exercise oversight for improvement of port performance.
3TRANSNET National Ports Authority
Operational performanceCore initiatives for 2018A key initiative launched during the financial year was the roll out of a collaborative decision-making (CDM) platform to support the Joint Operating Centres (JOCs) across all South African ports. This undertaking necessitated stakeholder management workshops, which have resulted in memorandums of understanding and non-disclosure agreements with identified stakeholders. This exercise, which began in the 2018 financial year, will overlap into the 2019 financial year.
Process integration between the JOCs and port stakeholders includes the following:• Objective setting for all stakeholders• Information sharing and integration• Testing of the CDM model amongst the port stakeholders
National Ports Authority’s (TNPA) evolving digital culture is being embedded within JOCs through the integrated ports management system (IPMS). The Division aims to provide supply chain visibility and performance targets with Terminal Operations Performance Standards (TOPS). The TOPS process is in its sixth year. This process has been embedded into the port system in terms of governance and the assessments. The following was achieved during the year under review in relation to TOPS:• TOPS Year 2018/19 preparation workshop was conducted and
the data for target setting was distributed to respective stakeholders through all Port Manager’s offices.
• For TOPS Year 5 Q3 (Jan-Mar 2018), the terminal operators are to submit quarterly reports to TNPA for performance assessments through the Port Oversight Committee.
• Draft prepared and scheduled for discussion and consultations with terminal operators
• Request for International Benchmarking proposal documents submitted to Procurement for processing.
• Assessment of TOPS Year 5 Q2 completed.• The TNPA operations function is established to conduct root
cause analysis for poor performance of terminals and develop corrective actions.
In the coming year, TNPA will be conducting performance oversight of ports in consultation with terminal operators. The review of TOPS 2019 targets will continue with assessments and valuations of terminal performance achievements.
The Marine Operations Performance Standards (MOPS) improvement project, aimed at reducing delays – with Richards Bay intended to reach an all-time low of 0% delay, has consistently achieved a delay rate below 5% during the 2018 financial year.
Durban has also seen an improvement, reaching a low of 1% in November 2017.
TNPA finalised the development of Hauliers Operations Performance Standards (HOPS) and Rail Operations Performance Standards (ROPS) to ensure improvement in operations productivity. HOPS and ROPS development follows successful development and implementation of Waterside performance standards, i.e. MOPS.
Stakeholder engagements in the ports of Durban, Richards Bay and Cape Town have been completed. These engagements were to get the voice of the customer, as performance improvements are based on collaboration between all stakeholders.
Development of these performance standards and information management systems will assist TNPA in monitoring performance of stakeholders within the port system. This will also form the basis for collaborative work between TNPA and all stakeholders.
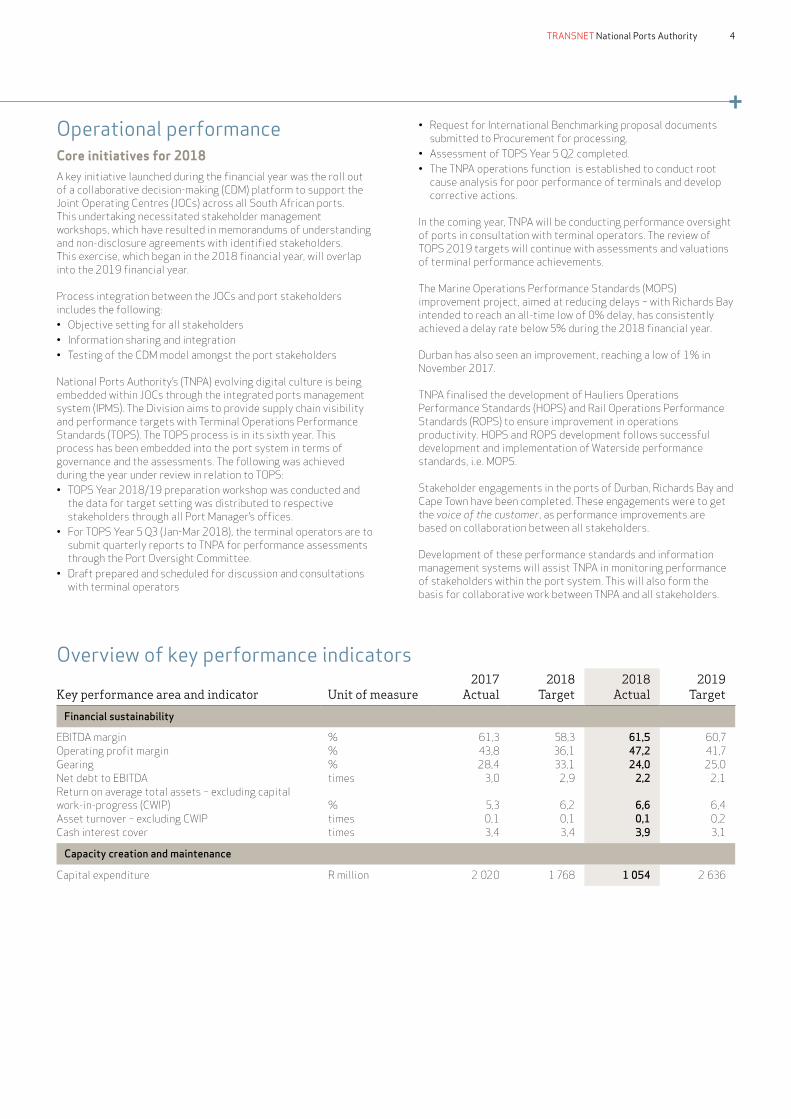
Overview of key performance indicators2017 2018 2018 2019
Key performance area and indicator Unit of measure Actual Target Actual Target
Financial sustainability
EBITDA margin % 61,3 58,3 61,5 60,7Operating profit margin % 43,8 36,1 47,2 41,7Gearing % 28,4 33,1 24,0 25,0Net debt to EBITDA times 3,0 2,9 2,2 2,1Return on average total assets – excluding capital work-in-progress (CWIP) % 5,3 6,2 6,6 6,4Asset turnover – excluding CWIP times 0,1 0,1 0,1 0,2Cash interest cover times 3,4 3,4 3,9 3,1
Capacity creation and maintenance
Capital expenditure R million 2 020 1 768 1 054 2 636
4TRANSNET National Ports Authority
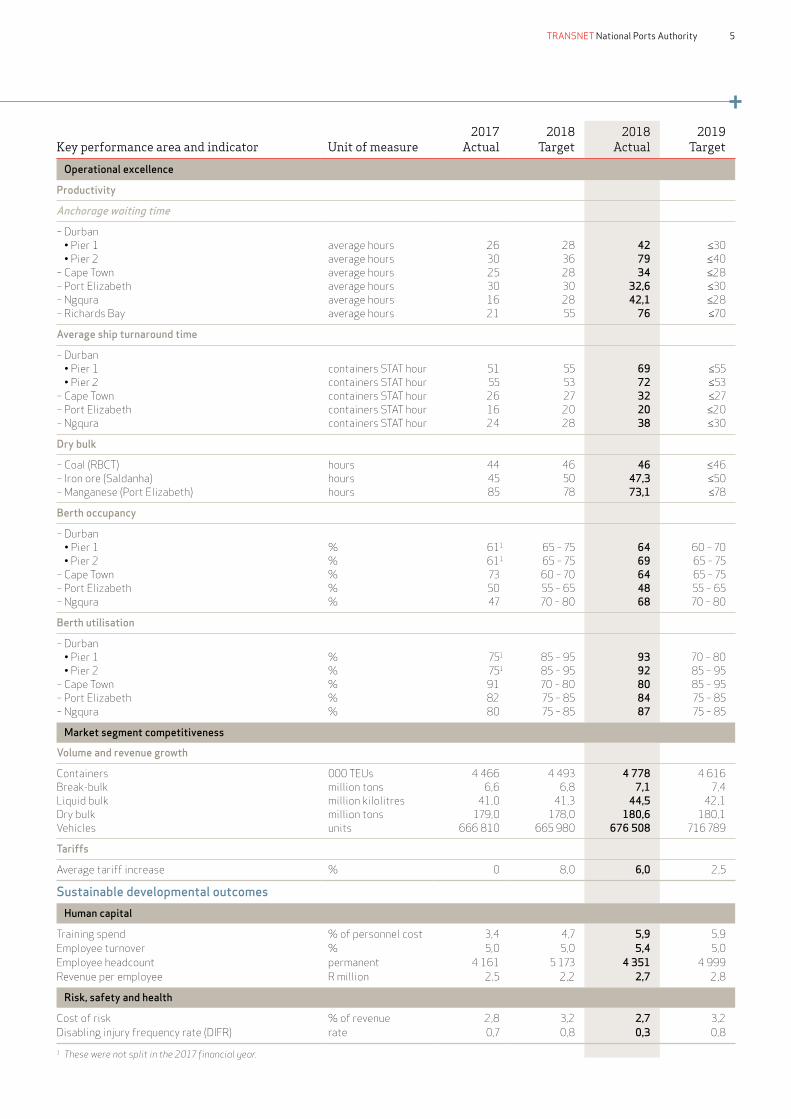
2017 2018 2018 2019Key performance area and indicator Unit of measure Actual Target Actual Target
Operational excellence
Productivity
Anchorage waiting time
– Durban • Pier 1 average hours 26 28 42 ≤30 • Pier 2 average hours 30 36 79 ≤40
– Cape Town average hours 25 28 34 ≤28– Port Elizabeth average hours 30 30 32,6 ≤30– Ngqura average hours 16 28 42,1 ≤28– Richards Bay average hours 21 55 76 ≤70
Average ship turnaround time
– Durban • Pier 1 containers STAT hour 51 55 69 ≤55 • Pier 2 containers STAT hour 55 53 72 ≤53
– Cape Town containers STAT hour 26 27 32 ≤27– Port Elizabeth containers STAT hour 16 20 20 ≤20– Ngqura containers STAT hour 24 28 38 ≤30
Dry bulk
– Coal (RBCT) hours 44 46 46 ≤46– Iron ore (Saldanha) hours 45 50 47,3 ≤50– Manganese (Port Elizabeth) hours 85 78 73,1 ≤78
Berth occupancy
– Durban • Pier 1 % 611 65 – 75 64 60 – 70 • Pier 2 % 611 65 – 75 69 65 – 75
– Cape Town % 73 60 – 70 64 65 – 75– Port Elizabeth % 50 55 – 65 48 55 – 65– Ngqura % 47 70 – 80 68 70 – 80
Berth utilisation
– Durban • Pier 1 % 751 85 – 95 93 70 – 80 • Pier 2 % 751 85 – 95 92 85 – 95
– Cape Town % 91 70 – 80 80 85 – 95– Port Elizabeth % 82 75 – 85 84 75 – 85– Ngqura % 80 75 – 85 87 75 – 85
Market segment competitiveness
Volume and revenue growth
Containers 000 TEUs 4 466 4 493 4 778 4 616Break-bulk million tons 6,6 6,8 7,1 7,4Liquid bulk million kilolitres 41,0 41,3 44,5 42,1Dry bulk million tons 179,0 178,0 180,6 180,1Vehicles units 666 810 665 980 676 508 716 789
Tariffs
Average tariff increase % 0 8,0 6,0 2,5
Sustainable developmental outcomesHuman capital
Training spend % of personnel cost 3,4 4,7 5,9 5,9Employee turnover % 5,0 5,0 5,4 5,0Employee headcount permanent 4 161 5 173 4 351 4 999Revenue per employee R million 2,5 2,2 2,7 2,8
Risk, safety and health
Cost of risk % of revenue 2,8 3,2 2,7 3,2Disabling injury frequency rate (DIFR) rate 0,7 0,8 0,3 0,8
1 These were not split in the 2017 financial year.
5TRANSNET National Ports Authority
Financial performance reviewYear ended Year ended
31 March 31 March2018 2017 %
Salient features R million R million change
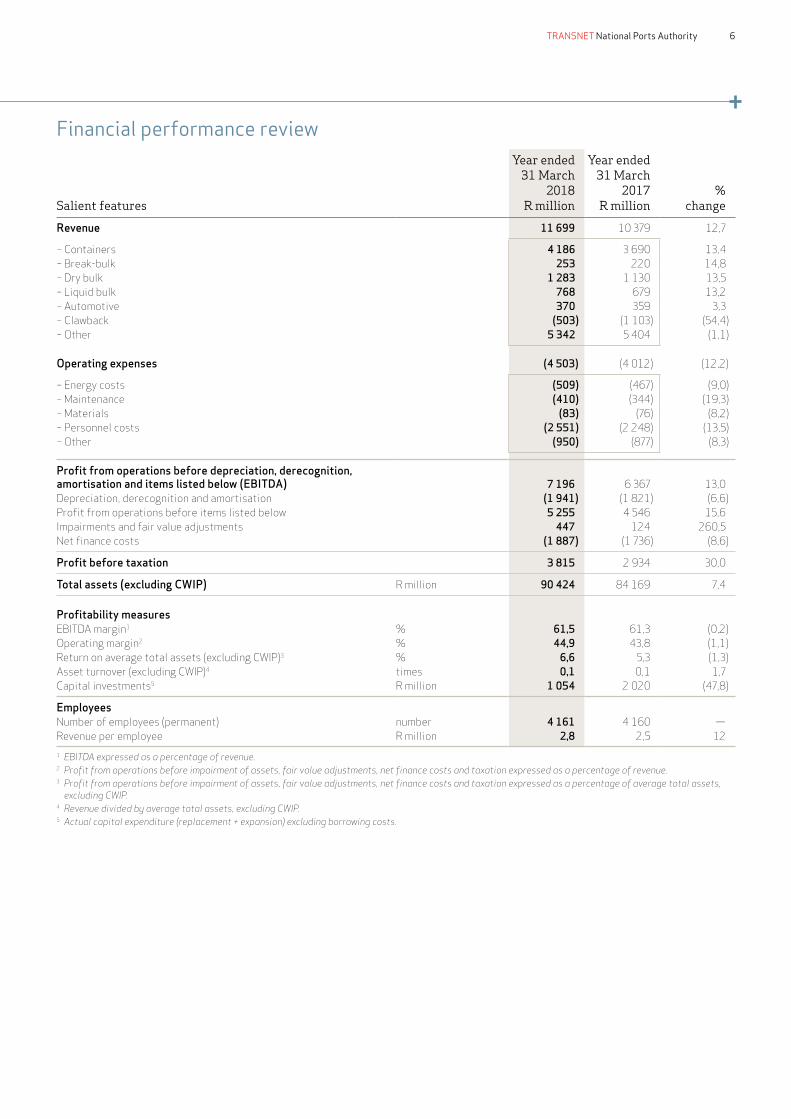
Revenue 11 699 10 379 12,7
– Containers 4 186 3 690 13,4– Break-bulk 253 220 14,8– Dry bulk 1 283 1 130 13,5– Liquid bulk 768 679 13,2– Automotive 370 359 3,3– Clawback (503) (1 103) (54,4)– Other 5 342 5 404 (1,1)
Operating expenses (4 503) (4 012) (12,2)
– Energy costs (509) (467) (9,0)– Maintenance (410) (344) (19,3)– Materials (83) (76) (8,2)– Personnel costs (2 551) (2 248) (13,5)– Other (950) (877) (8,3)
Profit from operations before depreciation, derecognition, amortisation and items listed below (EBITDA) 7 196 6 367 13,0Depreciation, derecognition and amortisation (1 941) (1 821) (6,6)Profit from operations before items listed below 5 255 4 546 15,6Impairments and fair value adjustments 447 124 260,5Net finance costs (1 887) (1 736) (8,6)
Profit before taxation 3 815 2 934 30,0
Total assets (excluding CWIP) R million 90 424 84 169 7,4
Profitability measuresEBITDA margin1 % 61,5 61,3 (0,2)Operating margin2 % 44,9 43,8 (1,1)Return on average total assets (excluding CWIP)3 % 6,6 5,3 (1,3)Asset turnover (excluding CWIP)4 times 0,1 0,1 1,7Capital investments5 R million 1 054 2 020 (47,8)
EmployeesNumber of employees (permanent) number 4 161 4 160 —Revenue per employee R million 2,8 2,5 12
1 EBITDA expressed as a percentage of revenue.2 Profit from operations before impairment of assets, fair value adjustments, net finance costs and taxation expressed as a percentage of revenue.3 Profit from operations before impairment of assets, fair value adjustments, net finance costs and taxation expressed as a percentage of average total assets,
excluding CWIP.4 Revenue divided by average total assets, excluding CWIP.5 Actual capital expenditure (replacement + expansion) excluding borrowing costs.
6TRANSNET National Ports Authority
Performance commentaryFinancial sustainability• Revenue increased by 12,7% to R11,7 billion (2017: R10,4 billion),
due to increases in volumes across all the commodities. When excluding clawback, revenue showed an incline of 7,9% to R12,2 billion (2016: R11,3 billion).
• Net operating expenses increased 12,2% to R4,5 billion (2017: R4,0 billion), mainly due to increases in personnel costs, maintenance and energy costs, and legal fees.
• EBITDA was 7,3% below budget (R7,8 billion) and showed a year-on-year improvement of 13% at R7,2 billion (2017: R6,4 billion). The improvement is largely attributable to focused cost-containment initiatives.
Capacity creation and maintenance• The National Ports Authority’s capital expenditure was 47,8%
below prior year at R1,1 billion (2017: R2,0 billion). In the coming financial year TNPA is committed to efficiently managing the capital expenditure programme to achieve set targets.
• Various Operation Phakisa initiatives were undertaken during the year and have advanced to varying levels of completion.
Looking ahead• The National Ports Authority plans to invest R2,6 billion during
the 2019 financial year and 26,3 billion in capacity creation, infrastructure renewal and modernisation projects over the next five years to 2023:
– Capacity creation in the 2019 financial year: � R33,1 million spend on lengthening and deepening
berths 203 to 205 at the Durban Container Terminal (DCT) � R68,0 million on DCT Pier 1 phase 2 infill � R42,0 million to operationalise port for containers � R258,0 million on tank farm berth B100, roads and port
entrance – Operation Phakisa projects in the 2019 financial year:
� R37,0 million on repair of inner caisson of dry dock � R28,0 million on refurbishment of graving dock – Caisson
gate � R32,0 million on the dry dock pump house upgrade
– Fleet replacement in the 2019 financial year: � R50,0 million on replacement of plough tug � R85,0 million on acquisition of new cutter suction dredger � R267,0 million on second grab hopper dredger
– Infrastructure in the 2019 financial year: � R168,0 million on bulk power supply to third tippler
Operational excellence
Grow volumes and market shareThe National Ports Authority will maintain and entrench activities that have led to the achievement of operational excellence, such as the continued implementation of the integrated business execution system. The following programmes are also currently being designed or implemented to achieve operational excellence:• Executing new section 56 projects to create port capacity that will
facilitate volume growth and attract private sector investment.• Increasing maritime and logistics connectivity through
integrated planning and alignment of investments between the National Ports Authority and industrial development zones/special economic zones.
7TRANSNET National Ports Authority
Market segment competitiveness• Container volumes achieved target mainly due to increased
transshipment as a result of incentive agreements with some of the shipping lines. Freight rates slowly recovered for the North/South trade, and volume growth from China, North Asia and South Asia increased 4,9%, 6,8% and 6,3% respectively from the 2017 financial year. The strengthening Rand also contributed to the increased import volumes. The price for some commodities has recovered along with demand, and commodities such as manganese have started moving in containers again. At 4 778 million TEUs (2017: 4 466 million TEUs), container volumes grew 6,97%.
• Break-bulk volumes exceeded the budget primarily due to the high demand for rice and also because we are the net importer of the commodity, and also due to the increased cement import from Pakistan due to the cheap price associated with it. Year-to-date tonnages reflected growth of 8,62% compared to previous financial year recording 7,1 mt against 6,6 mt for 2016.
• Improvement in liquid bulk was boosted by the exports gained from the stronger Rand as a result of changes in the domestic political environment. On average, the crude oil price was weaker as well, so despite low consumption the two balanced each other well. Liquid bulk volume grew 8,57% to 44,5 million kl (2017: 41 million kl).
• Dry bulk volumes achieved target mainly due to the high demand for manganese, which exceeded budget by a whopping 46,6%, offsetting iron ore volumes that could not meet target as a result of low production within the mines. Coal marginally made up the target due to the efficient infrastructure provided by rail and the improved marine services. Marginal growth of 2,47% was recorded as volumes grew to 180,6 mt (2017: 179,2 mt).
• Vehicles volumes achieved target as a result of increased transshipment within the Port of Durban. There has been increased transshipment of agricultural vehicles and machinery into Africa. Specific double-cab bakkies were also transshipped for three months to the African region as demand soared. Vehicle units reflected marginal growth of 1,45% recording 676 508 units for the current year compared to 666 810 units for 2017.
Looking ahead• Prioritised customer visitations will be undertaken.• Integrated company-wide customer engagement sessions will be
implemented.• The CRM system will be enhanced to enable an improved and
agile customer service culture.• Operation Phakisa initiatives will be advanced.• Capital projects will be executed and efficiency standards will be
met to meet market demand. • Consultations with other port users through the Port Consultative
Committees will commence in the new financial year according to the set dates. The draft of the TOPS governance, validation and verification model has been sent to port managers for their input. The international benchmarking will assist in comparing with best practices in other ports around the world by addressing the challenges in the following manner:
– Reducing the number of measures – Integrating performance standards (i-POPS) – Improving target setting methodology to allow terminals
adequate time to improve their performance – The JOCs will be operationalised.
Human capital• The permanent headcount increased marginally to 4 161
employees (2017: 4 160).• Black employees represented 88% of the total employee base
(2017: 85,8%).• Female employees represented 34% of the total employee base
(2017: 32,8%).• People with disabilities represented 1,9% of the total employee
base (2017: 2%).
• Implementing key infrastructure capital investment projects to create capacity at the:
– Port of Durban – DCT deepening at berths 203 to 205; – Port of Durban – Feasibility study on Pier 1 phase 2 infill
(Salisbury Island); and – Port of Ngqura – Infrastructure provision for tank farm
equipment, berth B100, roads, port entrance and services.• Developing a Weighted Efficiency Gains from Operations (WEGO)
performance reporting system to improve reporting to the Ports Regulator. Key performance indicator (KPI) simulations for terminal operators to confirm the KPIs in the WEGO baseline for implementation.
• Conducting a five-year review of Terminal Operations Performance Standards (TOPS), Marine Operations Performance Standards (MOPS) and Rail Operations Performance Standards (ROPS).
• Conducting a port survey (i.e. terminal operators, shipping lines, road, rail, marine) to obtain feedback on performance system.
• Validating that port terminal capacities are aligned to existing terminal operating models.
• Aligning the port performance standards (TOPS, ROPS and Haulier Operations Performance Standards (HOPS)) to terminal capacity.
• Implementing a weather forecasting and early warning system for all ports.
• Improving reliability and availability of the marine and dredging fleet (tugs, pilot boats, launches, helicopters and dredgers) by implementing:
– The marine fleet maintenance plan; – The marine fleet replacement and acquisition plan; – The dredging maintenance plan; and – The dredging replacement and acquisition plan.
• Conducting performance oversight by ensuring terminal performance is monitored by the Port Oversight Committee and deviations from TOPS are addressed timeously with terminal operators.
• Undertaking prioritised customer visitation programmes aligned with the Operating Divisions.
• Implementing integrated company-wide customer engagement sessions.
• Enhancing the customer relationship management (CRM) system to enable an improved and agile customer service culture.
• Implementing digital solutions to enable port supply chain visibility embracing the ‘smart ports’ concept including:
– Traffic (road/rail/vessels) planning through the JOCs; – Ethernet line termination equipment across the port system
to enable sharing of information with JOCs (access to aerial/aquatic drone and weather/wind information);
– Integrated Port Management System (IPMS) enhancements for WEGO implementation;
– Vessel traffic systems procedure reviews; and – IPMS and Order-to-Cash electronic enablement of manual
processes.• Improve operational efficiency and service delivery Average
Anchorage Waiting Time: Ports performance was a mixed bag, with DCT’s Pier 1 and Ngqura achieving target at 100% and 11% respectively for March 2018, while DCT’s Pier 2 and Cape Town had negative deviations of 66,7% and 153,6% respectively. All the ports performed negatively year to date.
• Ship Turnaround Time (STAT): Ports performance was a mixed bag, with DCT’s Pier 1 achieving set target and Cape Town achieving target at 51,9%, while DCT’s Pier 2 and Ngqura missed the target by 20,8% and 23% respectively for March 2018. All the ports performed negatively year to date.
The Corporate Plan and Shareholder’s Compact KPIs were achieved at 67% and 63% respectively for March 2018. This was due to adverse weather at the Western Cape ports and drastic storms that hit Durban ports towards the end of 2017, damaging equipment and port infrastructure.
8TRANSNET National Ports Authority
Organisational readiness
High-performance culture and environment• The National Ports Authority achieved Top Employer
certification for the second time, and is currently working on improving HR practices.
• We actively promoted the values and behaviours associated with the Culture Charter, focusing on the Dignity and Respect values through anti-bullying campaigns.
• The Operating Division introduced Port Managers/Business Unit and Head Office awards which culminated in the Chief Executive and Group Chief Executive awards.
Skills development• In total, 6 794 learners were exposed to the business to create
awareness of the port environment among the youth.• Some 3 634 pupils visited the port on school tours.• The Operating Division provided the following training in terms
of critical skills: – 31 engineers in training – 4 technicians in training – 7 marine pilots in training – 211 marine cadets were trained
Health and safety• A DIFR of 0,33 was recorded against a target of 0,75.• Incident management and monitoring are performed on an
annual basis.
Safety initiatives going forward1. Implement a supervisory and shop steward behavioural safety
coaching and training programme to empower our supervisors, who will learn the following:• All incidents are preventable• Stopping unsafe acts is everybody’s responsibility• Safety needs continual improvement• Visible felt leadership is a leadership tool to identify unsafe
act and conditions2. Implement “Zero Harm” to support behavioural programme.
This will include:• A mascot at all ports and business units to promote health
and safety• Leadership demonstrating its commitment by championing
a health and safety culture in the workplace• All employees taking ownership and responsibility for health
and safety in the workplace• Line managers integrating health and safety into their
everyday activities• Compulsory attendance of safety training sessions for all
employees 3. Health:
• The current medical surveillance model needs to be redesigned to improve medicals across all job categories and to also include specialised medical requirements for high risks jobs.
• All pre-employment and exit medical surveillances are being done and all employees are doing periodic medical surveillances.
Governance and ethics
Environmental stewardship• Establishment of Ports Air Quality Monitoring Station
– Installation of air quality monitoring station in line with the Air Quality Act
– Introducing the E-Nose Technology to manage odours in the Port of Durban
– Procurement of infrared cameras to identify fugitive emissions and leaks from chemical storage facilities in ports
• As part of the waste management initiative, the following were key: – Standardisation of the procurement of waste management
across all ports – A process of procuring national waste management
contracts commenced in 2017• Historical soil and groundwater contamination:
– Addressing legacy hydrocarbon contamination issues has been ongoing for a number of years. Soil and groundwater contamination is due to historical practices of the TNPA tenants. Solid and groundwater contamination forums have been set up and aligned at affected ports. At the Port of Durban extensive assessments have been undertaken. over the years and several isolated clean-ups have taken place. In 2017 the tenants compiled a consolidated report to present to the Department of Environmental Affairs (DEA). The DEA issued a remediation order with regards to suspected soil contamination around the petroleum storage site in East London. In Port Elizabeth, a project is in progress to decommission and rehabilitate the Dom Pedro Tank, and a remediation order has been issued by the Ports Regulator. At all the ports where contamination has been confirmed, Part 8 of the National Waste Act is followed to ensure compliance, and the TNPA further ensures there is compliance through tenant committees.
• Control and clearance of alien and invasive plants – In terms of the National Environmental Management:
Biodiversity Act, No 10 of 2004 and its Regulations (Alien and Invasive Species Regulations, 2014), Transnet, like all land owners, is required to monitor, control and eradicate alien and invasive plant species on their land. The clearance of alien plants is important for underground water conservation, protection and restoration of natural habitats. In this financial year the Port of Durban cleared 65 hectares of alien invasive plants; Port of Port Elizabeth cleared 120 hectares; Port of Ngqura cleared 112 hectares of alien invasive plants and relocated 28 indigenous plant species; and Port of Richards Bay cleared 331 hectares of alien invasive plants.
• Estuarine management: – Four of the Operating Divisions’ ports are estuaries. Estuaries
provide ecological functions that make them highly productive and very important to manage and protect. Pollution sources from the catchments outside the ports result in ecological degradation of these estuaries. The Integrated Coastal Management Act, No 24 of 2008 requires that all estuaries have management plans that will protect estuarine ecological systems. The National Ports Authority has been working with the DEA and other key regulatory bodies to develop the plans for estuaries that are ports. The Division's role and commitment are pertinent since the port operations are a primary source of pollution; albeit sources outside the ports also add to pollution in the ports. The Durban Bay Estuarine Management Plan was gazetted in September 2016 and an implementation plan was agreed by members in 2017.
9TRANSNET National Ports Authority
– Strategic objectives of the Durban Bay Estuarine Management Plan are to:
� Improve water and sediment quality and waste management;
� Develop project plans to manage activities impacting the estuary; and
� Protect and enhance remaining estuarine habitats and explore new opportunities.
– Two other plans, for Buffalo River (Port of East London) and Umhlatuze (Port of Richards Bay) are at advanced stages and have undergone public participation.
• Management of sensitive habitats – Development of ports resulted in significant transformation
of ecosystems over time. Even where transformation has been significant there is still high biodiversity value and the National Ports Authority is obliged to protect what is left. TNPA has ongoing management programmes to protect remaining sensitive habitats within its boundaries. The Port of Durban has seen mangrove forests decline from 200 hectares in 1900 to approximately 15 hectares currently. So as to protect the mangrove forest and mitigate further destruction, the forest has been demarcated a protected heritage site.
– The Richards Bay Port has one of the highest degrees of indigenous biodiversity. Any development in the ports has to happen within sensitive ecological constraints. The Transnet Project Lifecycle Process is a critical tool that has ensured that sensitive ecosystems are protected during port project development. TNPA works closely with authorities to ensure that port tenants extend biodiversity protection to projects. As a result, some of the environmental authorisations issued to tenants contain provisions to protect and, in some cases, to enhance biodiversity in areas that have been transformed. The port also maintains Echwebeni Heritage Site which is an untransformed conservation site inside the port with prime breeding and roosting habitats.
– In the Port of Ngqura the environmental authorisation required a permanent Environmental Control Officer that ensures that conditions in the Environmental Authorisation and the Environmental Management Plan of the port are complied with by Transnet. The Environmental Control Officer
conducts regular audits that are presented to the Environmental Management Committee, which exercises oversight over the port. Biodiversity management is at the centre of the Environmental Management Plan for the port due to sensitive ecosystems within port limits. For the past four years the National Ports Authority has co-funded biodiversity research on impacts of underwater noise (from vessels) on humpback whales in the port. This is the first time that this specific research has been undertaken in South Africa, and it is part of the Operating Division’s commitment to support scientific skills development in areas that will benefit Transnet.
– Linked to the 2002 port environmental authorisation requirements, the port has a “Search and Rescue Plan” for sensitive plants and animal species. If clearing is required before any construction, the plants are relocated to a nursery in order to maintain the area’s biodiversity. The relocated plants are used for rehabilitation of areas disturbed by construction. In 2017 the indigenous plants that were relocated in 2013 during the construction of the port office building were replanted around the port.
Social accountability• Working with the Department of Education, the National Ports
Authority adopted eight primary schools from the Western and Eastern Cape in 2017 and provided them with Mathematics and Science apparatus and manipulatives to create affinity for Mathematics and Science at a foundation phase.
• A six-year partnership with the adopted schools – Dr Vilakazi High School and Forest High School – resulted in supporting 100 learners from grades 10 to 12 with extra lessons in Mathematics, Physical Science and English. Fifteen went to Cape Town University of Technology to pursue Maritime Engineering.
• A long-standing partnership with Lawhill Maritime High School since 2006 has resulted in a total of 81 learners from disadvantaged backgrounds attending the prestigious high school in Simonstown. Post matric, about 70% of the learners get accepted at Cape Town University of Technology to study maritime.
10TRANSNET National Ports Authority
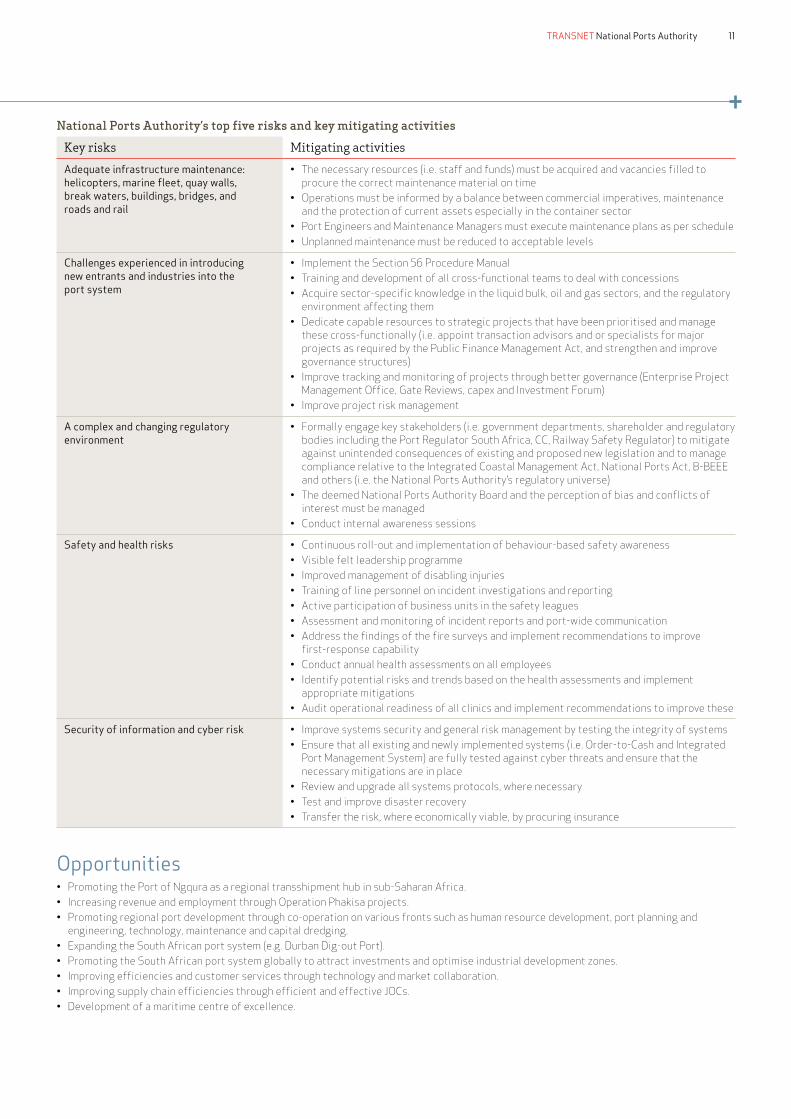
National Ports Authority’s top five risks and key mitigating activities
Key risks Mitigating activities
Adequate infrastructure maintenance: helicopters, marine fleet, quay walls, break waters, buildings, bridges, and roads and rail
• The necessary resources (i.e. staff and funds) must be acquired and vacancies filled to procure the correct maintenance material on time
• Operations must be informed by a balance between commercial imperatives, maintenance and the protection of current assets especially in the container sector
• Port Engineers and Maintenance Managers must execute maintenance plans as per schedule• Unplanned maintenance must be reduced to acceptable levels
Challenges experienced in introducing new entrants and industries into the port system
• Implement the Section 56 Procedure Manual• Training and development of all cross-functional teams to deal with concessions• Acquire sector-specific knowledge in the liquid bulk, oil and gas sectors, and the regulatory
environment affecting them• Dedicate capable resources to strategic projects that have been prioritised and manage
these cross-functionally (i.e. appoint transaction advisors and or specialists for major projects as required by the Public Finance Management Act, and strengthen and improve governance structures)
• Improve tracking and monitoring of projects through better governance (Enterprise Project Management Office, Gate Reviews, capex and Investment Forum)
• Improve project risk management
A complex and changing regulatory environment
• Formally engage key stakeholders (i.e. government departments, shareholder and regulatory bodies including the Port Regulator South Africa, CC, Railway Safety Regulator) to mitigate against unintended consequences of existing and proposed new legislation and to manage compliance relative to the Integrated Coastal Management Act, National Ports Act, B-BEEE and others (i.e. the National Ports Authority’s regulatory universe)
• The deemed National Ports Authority Board and the perception of bias and conflicts of interest must be managed
• Conduct internal awareness sessions
Safety and health risks • Continuous roll-out and implementation of behaviour-based safety awareness• Visible felt leadership programme• Improved management of disabling injuries• Training of line personnel on incident investigations and reporting• Active participation of business units in the safety leagues• Assessment and monitoring of incident reports and port-wide communication• Address the findings of the fire surveys and implement recommendations to improve
first-response capability• Conduct annual health assessments on all employees• Identify potential risks and trends based on the health assessments and implement
appropriate mitigations• Audit operational readiness of all clinics and implement recommendations to improve these
Security of information and cyber risk • Improve systems security and general risk management by testing the integrity of systems• Ensure that all existing and newly implemented systems (i.e. Order-to-Cash and Integrated
Port Management System) are fully tested against cyber threats and ensure that the necessary mitigations are in place
• Review and upgrade all systems protocols, where necessary• Test and improve disaster recovery• Transfer the risk, where economically viable, by procuring insurance
Opportunities• Promoting the Port of Ngqura as a regional transshipment hub in sub-Saharan Africa.• Increasing revenue and employment through Operation Phakisa projects.• Promoting regional port development through co-operation on various fronts such as human resource development, port planning and
engineering, technology, maintenance and capital dredging.• Expanding the South African port system (e.g. Durban Dig-out Port).• Promoting the South African port system globally to attract investments and optimise industrial development zones.• Improving efficiencies and customer services through technology and market collaboration.• Improving supply chain efficiencies through efficient and effective JOCs.• Development of a maritime centre of excellence.
11TRANSNET National Ports Authority
www.transnet.net