Embed Size (px)
Citation preview
National Vital Statistics Reports Volume 57, Number 12 March 18, 2009
Births: Preliminary Data for 2007 by Brady E. Hamilton, Ph.D.; Joyce A. Martin, M.P.H.; and Stephanie J. Ventura, M.A., Division of Vital Statistics
5 200
180
1
2
3
4 Number
Rate
160
140
120
100
80
60
40
20
0 0 1930 1940 1950 1960 1970 1980 1990 2000 2007
Year
Rate per 1,000 w
omen aged 15–44 years
Mill
ions
of b
irths
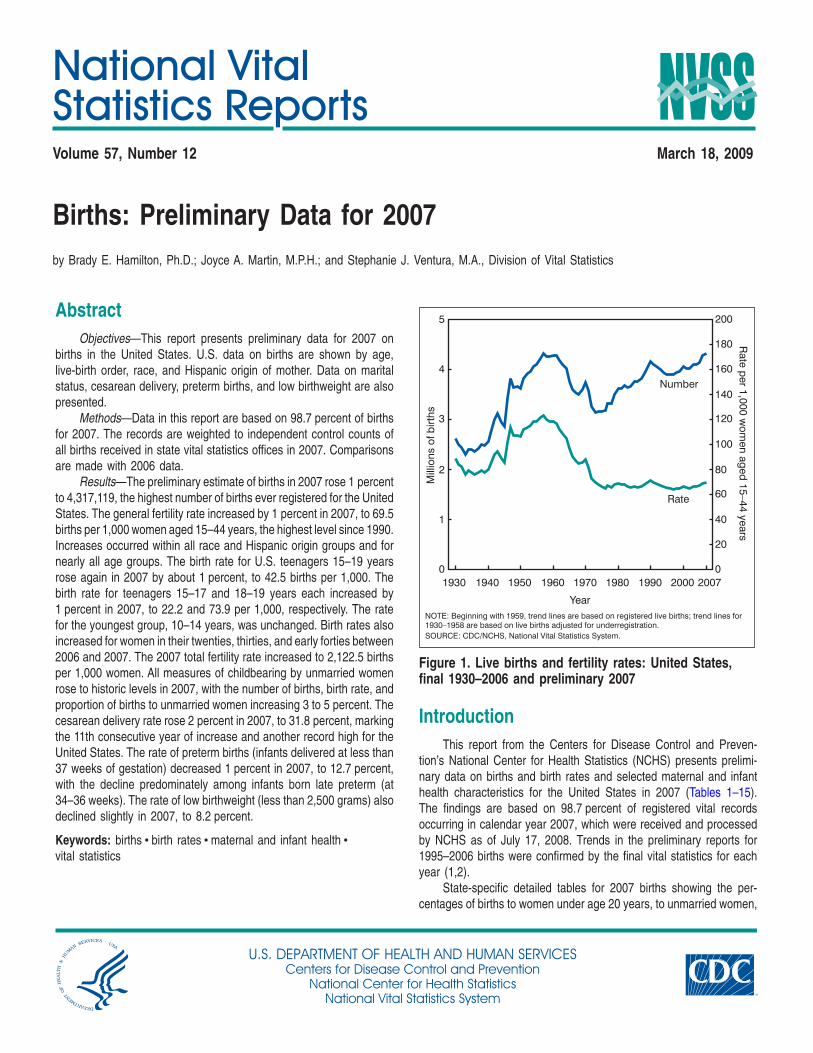
NOTE: Beginning with 1959, trend lines are based on registered live births; trend lines for 1930–1958 are based on live births adjusted for underregistration. SOURCE: CDC/NCHS, National Vital Statistics System.
Figure 1. Live births and fertility rates: United States, final 1930–2006 and preliminary 2007
Abstract Objectives—This report presents preliminary data for 2007 on
births in the United States. U.S. data on births are shown by age, live-birth order, race, and Hispanic origin of mother. Data on marital status, cesarean delivery, preterm births, and low birthweight are also presented.
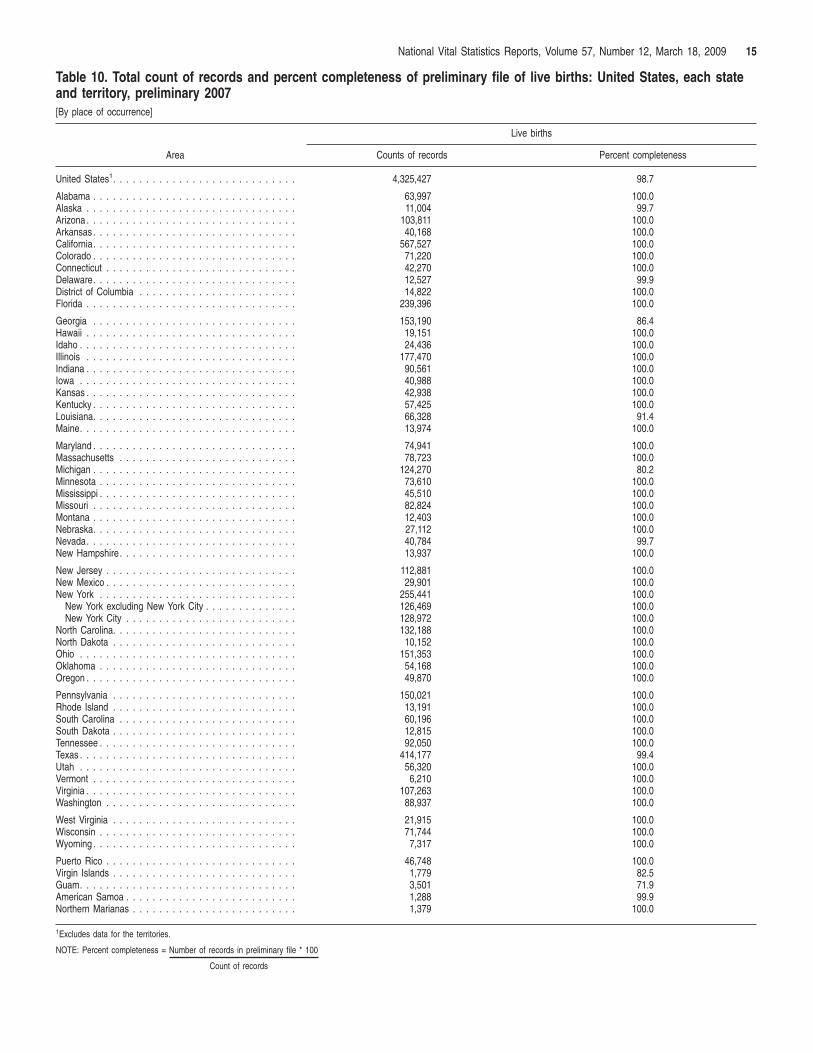
Methods—Data in this report are based on 98.7 percent of births for 2007. The records are weighted to independent control counts of all births received in state vital statistics offices in 2007. Comparisons are made with 2006 data.
Results—The preliminary estimate of births in 2007 rose 1 percent to 4,317,119, the highest number of births ever registered for the United States. The general fertility rate increased by 1 percent in 2007, to 69.5 births per 1,000 women aged 15–44 years, the highest level since 1990. Increases occurred within all race and Hispanic origin groups and for nearly all age groups. The birth rate for U.S. teenagers 15–19 years rose again in 2007 by about 1 percent, to 42.5 births per 1,000. The birth rate for teenagers 15–17 and 18–19 years each increased by 1 percent in 2007, to 22.2 and 73.9 per 1,000, respectively. The rate for the youngest group, 10–14 years, was unchanged. Birth rates also increased for women in their twenties, thirties, and early forties between 2006 and 2007. The 2007 total fertility rate increased to 2,122.5 births per 1,000 women. All measures of childbearing by unmarried women rose to historic levels in 2007, with the number of births, birth rate, and proportion of births to unmarried women increasing 3 to 5 percent. The cesarean delivery rate rose 2 percent in 2007, to 31.8 percent, marking the 11th consecutive year of increase and another record high for the United States. The rate of preterm births (infants delivered at less than 37 weeks of gestation) decreased 1 percent in 2007, to 12.7 percent, with the decline predominately among infants born late preterm (at 34–36 weeks). The rate of low birthweight (less than 2,500 grams) also declined slightly in 2007, to 8.2 percent.
Keywords: births c birth rates c maternal and infant health c vital statistics
U.S. DEPARTMENT OF HEALCenters for Disease C
National Center foNational Vital S
Introduction This report from the Centers for Disease Control and Preven
tion’s National Center for Health Statistics (NCHS) presents preliminary data on births and birth rates and selected maternal and infant health characteristics for the United States in 2007 (Tables 1–15). The findings are based on 98.7 percent of registered vital records occurring in calendar year 2007, which were received and processed by NCHS as of July 17, 2008. Trends in the preliminary reports for 1995–2006 births were confirmed by the final vital statistics for each year (1,2).
State-specific detailed tables for 2007 births showing the percentages of births to women under age 20 years, to unmarried women,
TH AND HUMAN SERVICES ontrol and Prevention r Health Statistics
tatistics System
2 National Vital Statistics Reports, Volume 57, Number 12, March 18, 2009
delivered by cesarean, delivered preterm, and of low birthweight (based on preliminary data) are also presented in this report (Tables 11–15).
Results
Births and birth rates Key findings, illustrated in Tables 1–7 and Figures 1 and 2,
show:
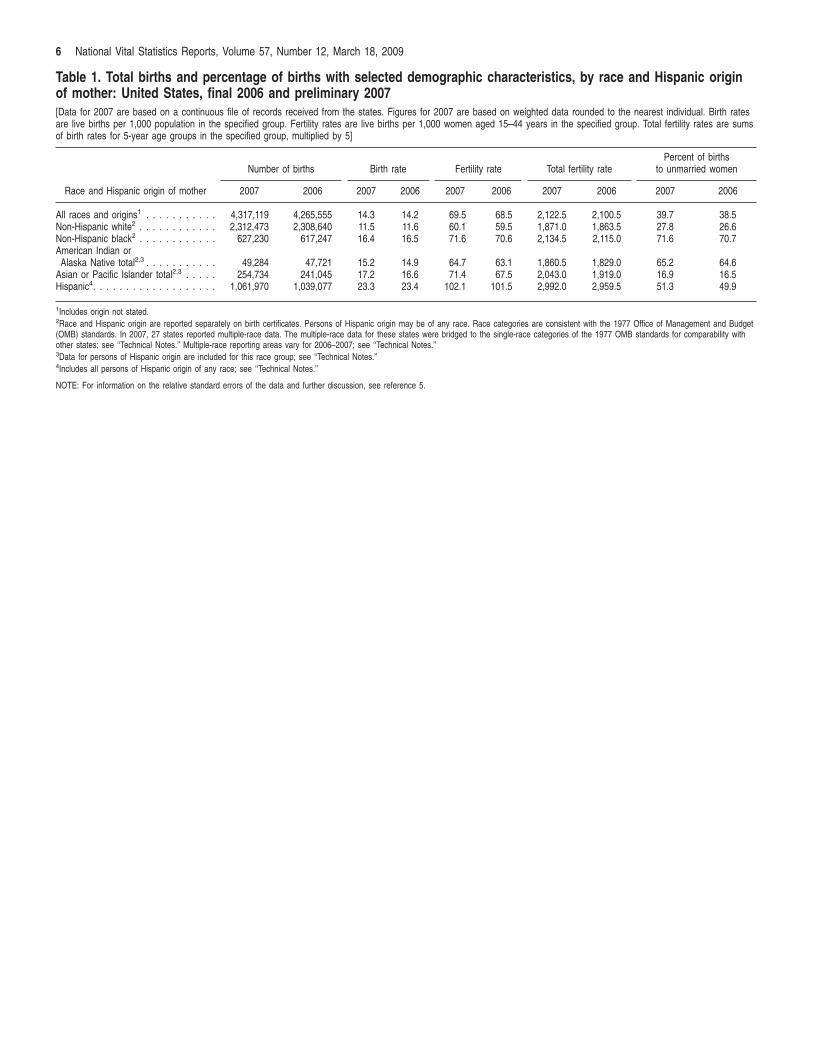
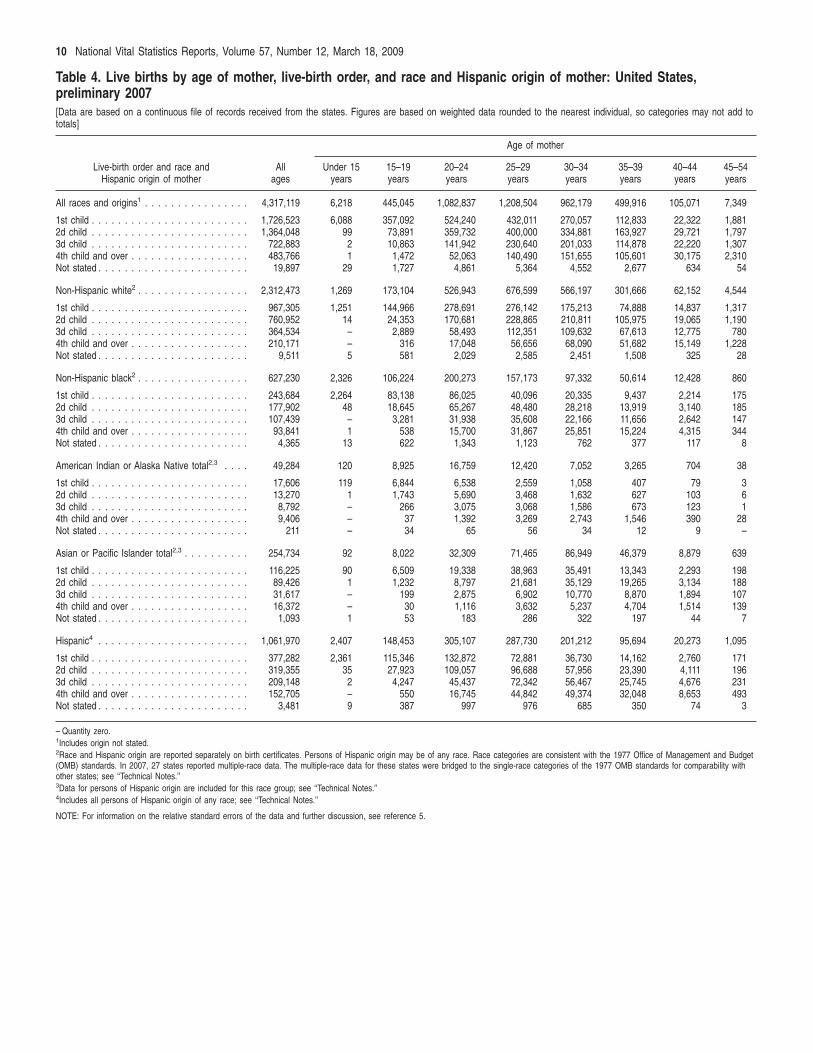
+ The preliminary estimate of births in 2007 was 4,317,119, 1 percent more than in 2006 (4,265,555) and the highest number ever registered for the United States (Tables 1 and 2; Figure 1) (1). This number surpasses the peak of the postwar ‘‘baby boom,’’ in 1957 (3). Births rose for each race and Hispanic origin group, with increases ranging from less than 1 percent for non-Hispanic white women to 6 percent for Asian or Pacific Islander (API) women. Births to non-Hispanic black and Hispanic women each increased by nearly 2 percent.
+ The preliminary crude birth rate (CBR) increased by nearly 1 percent in 2007 to 14.3 births per 1,000 total population from 14.2 in 2006. The general fertility rate (GFR) also increased in 2007, by 1 percent, to 69.5 births per 1,000 women aged 15–44 years, the highest level since 1990 (Figure 1) (1). The GFR rose for each race and Hispanic origin group, with increases ranging from less than 1 percent for Hispanic women to 6 percent for API women. The rates for non-Hispanic white and non-Hispanic black women, the two largest groups, each increased 1 percent.
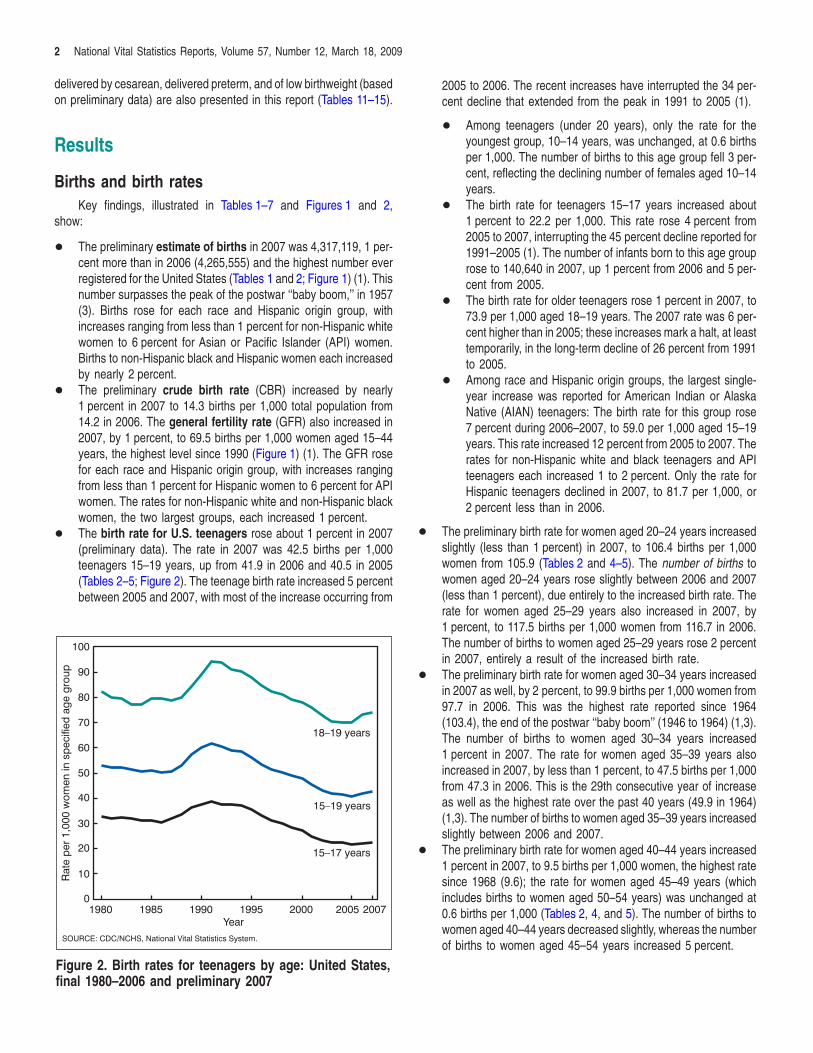
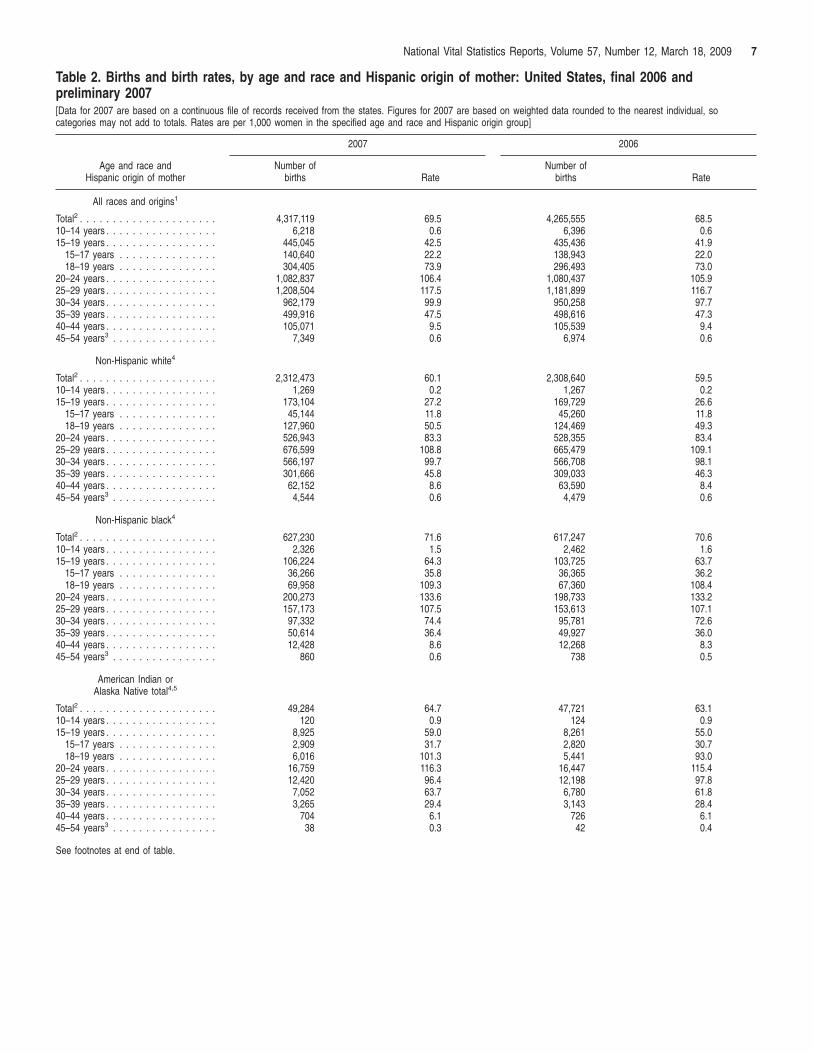
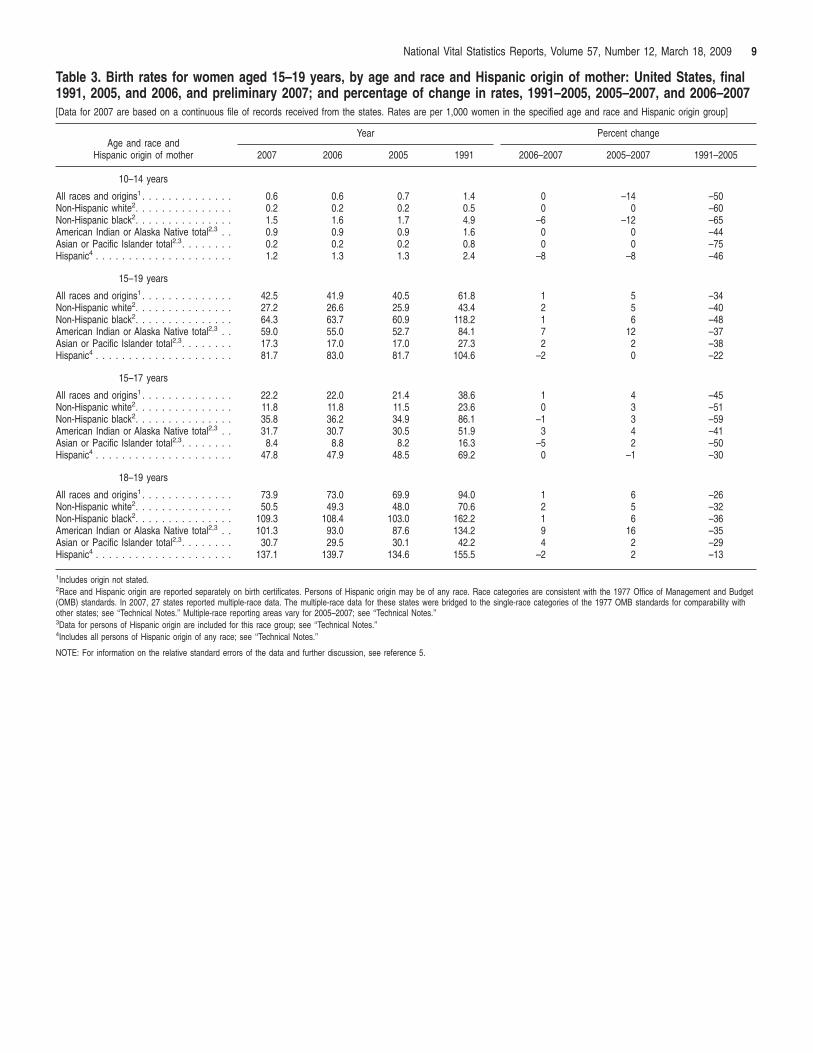
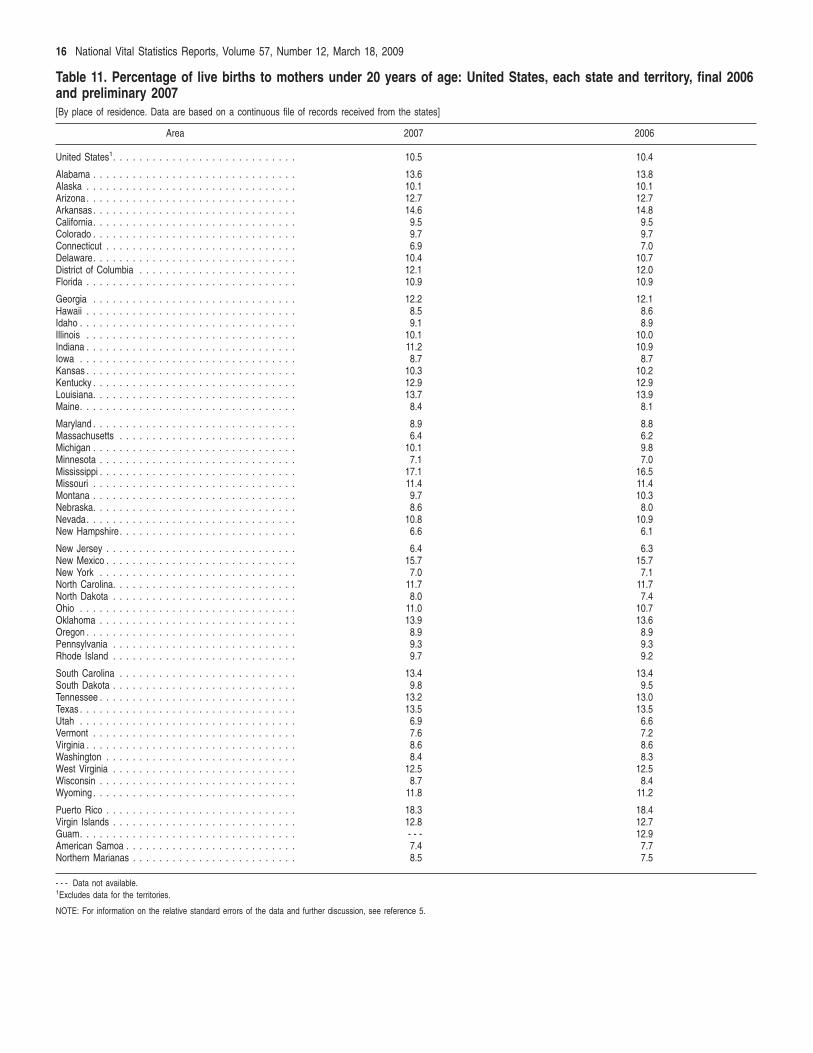
+ The birth rate for U.S. teenagers rose about 1 percent in 2007 (preliminary data). The rate in 2007 was 42.5 births per 1,000 teenagers 15–19 years, up from 41.9 in 2006 and 40.5 in 2005 (Tables 2–5; Figure 2). The teenage birth rate increased 5 percent between 2005 and 2007, with most of the increase occurring from
Rat
e pe
r 1,
000
wom
en in
spe
cifie
d ag
e gr
oup
100
90
80
70 18–19 years
60
50
40 15–19 years
30
20 15–17 years
10
0 20071980 1985 1990 1995 2000 2005
Year SOURCE: CDC/NCHS, National Vital Statistics System.
Figure 2. Birth rates for teenagers by age: United States, final 1980–2006 and preliminary 2007
2005 to 2006. The recent increases have interrupted the 34 percent decline that extended from the peak in 1991 to 2005 (1).
+ Among teenagers (under 20 years), only the rate for the youngest group, 10–14 years, was unchanged, at 0.6 births per 1,000. The number of births to this age group fell 3 percent, reflecting the declining number of females aged 10–14 years.
+ The birth rate for teenagers 15–17 years increased about 1 percent to 22.2 per 1,000. This rate rose 4 percent from 2005 to 2007, interrupting the 45 percent decline reported for 1991–2005 (1). The number of infants born to this age group rose to 140,640 in 2007, up 1 percent from 2006 and 5 percent from 2005.
+ The birth rate for older teenagers rose 1 percent in 2007, to 73.9 per 1,000 aged 18–19 years. The 2007 rate was 6 percent higher than in 2005; these increases mark a halt, at least temporarily, in the long-term decline of 26 percent from 1991 to 2005.
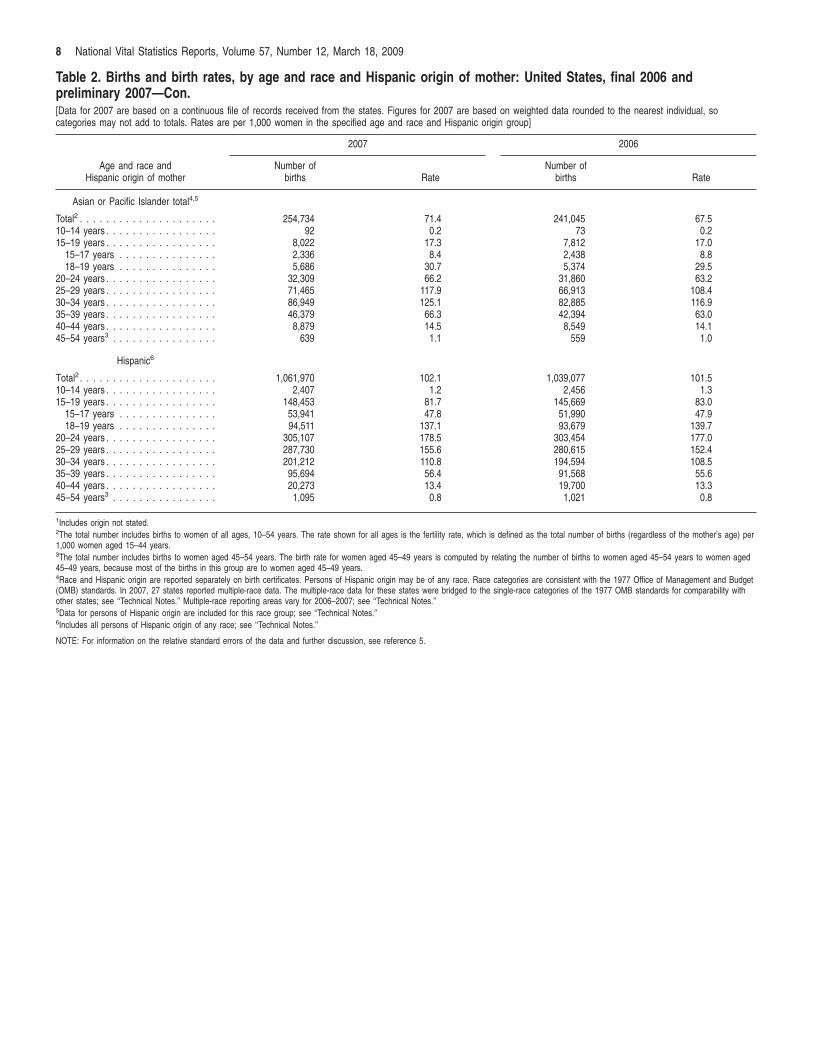
+ Among race and Hispanic origin groups, the largest single-year increase was reported for American Indian or Alaska Native (AIAN) teenagers: The birth rate for this group rose 7 percent during 2006–2007, to 59.0 per 1,000 aged 15–19 years. This rate increased 12 percent from 2005 to 2007. The rates for non-Hispanic white and black teenagers and API teenagers each increased 1 to 2 percent. Only the rate for Hispanic teenagers declined in 2007, to 81.7 per 1,000, or 2 percent less than in 2006.
+ The preliminary birth rate for women aged 20–24 years increased slightly (less than 1 percent) in 2007, to 106.4 births per 1,000 women from 105.9 (Tables 2 and 4–5). The number of births to women aged 20–24 years rose slightly between 2006 and 2007 (less than 1 percent), due entirely to the increased birth rate. The rate for women aged 25–29 years also increased in 2007, by 1 percent, to 117.5 births per 1,000 women from 116.7 in 2006. The number of births to women aged 25–29 years rose 2 percent in 2007, entirely a result of the increased birth rate.
+ The preliminary birth rate for women aged 30–34 years increased in 2007 as well, by 2 percent, to 99.9 births per 1,000 women from 97.7 in 2006. This was the highest rate reported since 1964 (103.4), the end of the postwar ‘‘baby boom’’ (1946 to 1964) (1,3). The number of births to women aged 30–34 years increased 1 percent in 2007. The rate for women aged 35–39 years also increased in 2007, by less than 1 percent, to 47.5 births per 1,000 from 47.3 in 2006. This is the 29th consecutive year of increase as well as the highest rate over the past 40 years (49.9 in 1964) (1,3). The number of births to women aged 35–39 years increased slightly between 2006 and 2007.
+ The preliminary birth rate for women aged 40–44 years increased 1 percent in 2007, to 9.5 births per 1,000 women, the highest rate since 1968 (9.6); the rate for women aged 45–49 years (which includes births to women aged 50–54 years) was unchanged at 0.6 births per 1,000 (Tables 2, 4, and 5). The number of births to women aged 40–44 years decreased slightly, whereas the number of births to women aged 45–54 years increased 5 percent.
3 National Vital Statistics Reports, Volume 57, Number 12, March 18, 2009
35
30
1989 1996 2000 2005 2007
Per
cent
25
20
0
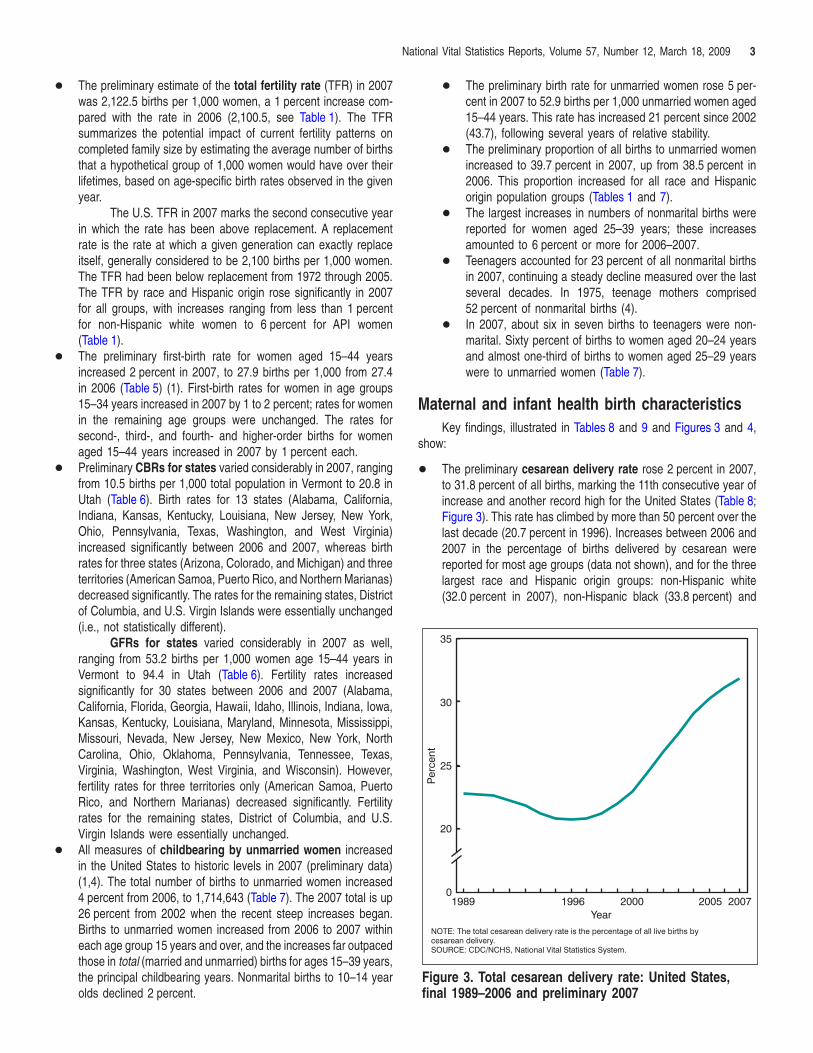
Year NOTE: The total cesarean delivery rate is the percentage of all live births by cesarean delivery. SOURCE: CDC/NCHS, National Vital Statistics System.
Figure 3. Total cesarean delivery rate: United States,
+ The preliminary estimate of the total fertility rate (TFR) in 2007 was 2,122.5 births per 1,000 women, a 1 percent increase compared with the rate in 2006 (2,100.5, see Table 1). The TFR summarizes the potential impact of current fertility patterns on completed family size by estimating the average number of births that a hypothetical group of 1,000 women would have over their lifetimes, based on age-specific birth rates observed in the given year.
The U.S. TFR in 2007 marks the second consecutive year in which the rate has been above replacement. A replacement rate is the rate at which a given generation can exactly replace itself, generally considered to be 2,100 births per 1,000 women. The TFR had been below replacement from 1972 through 2005. The TFR by race and Hispanic origin rose significantly in 2007 for all groups, with increases ranging from less than 1 percent for non-Hispanic white women to 6 percent for API women (Table 1).
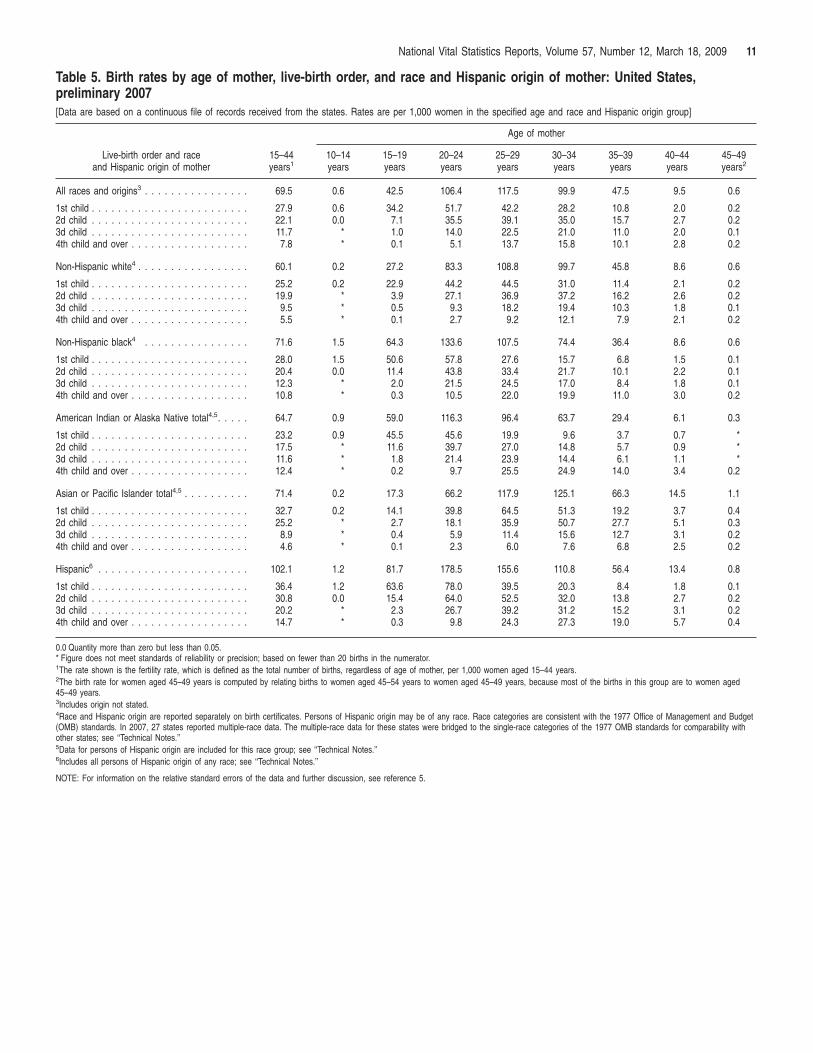
+ The preliminary first-birth rate for women aged 15–44 years increased 2 percent in 2007, to 27.9 births per 1,000 from 27.4 in 2006 (Table 5) (1). First-birth rates for women in age groups 15–34 years increased in 2007 by 1 to 2 percent; rates for women in the remaining age groups were unchanged. The rates for second-, third-, and fourth- and higher-order births for women aged 15–44 years increased in 2007 by 1 percent each.
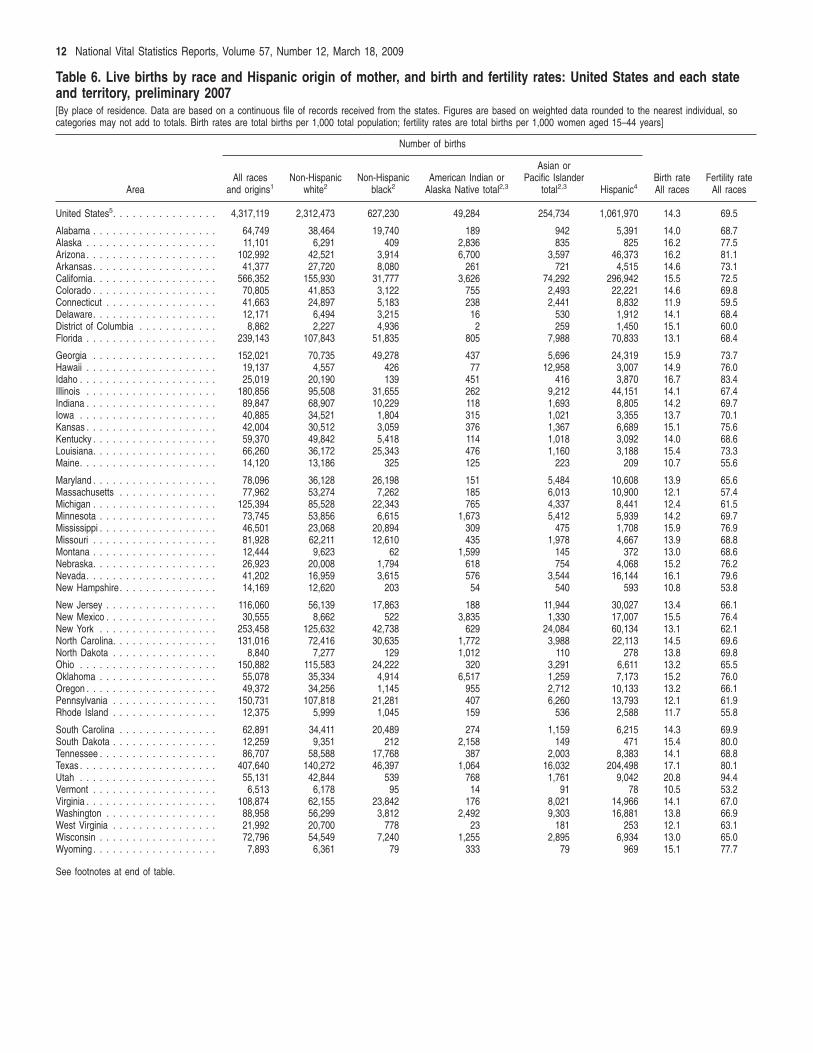
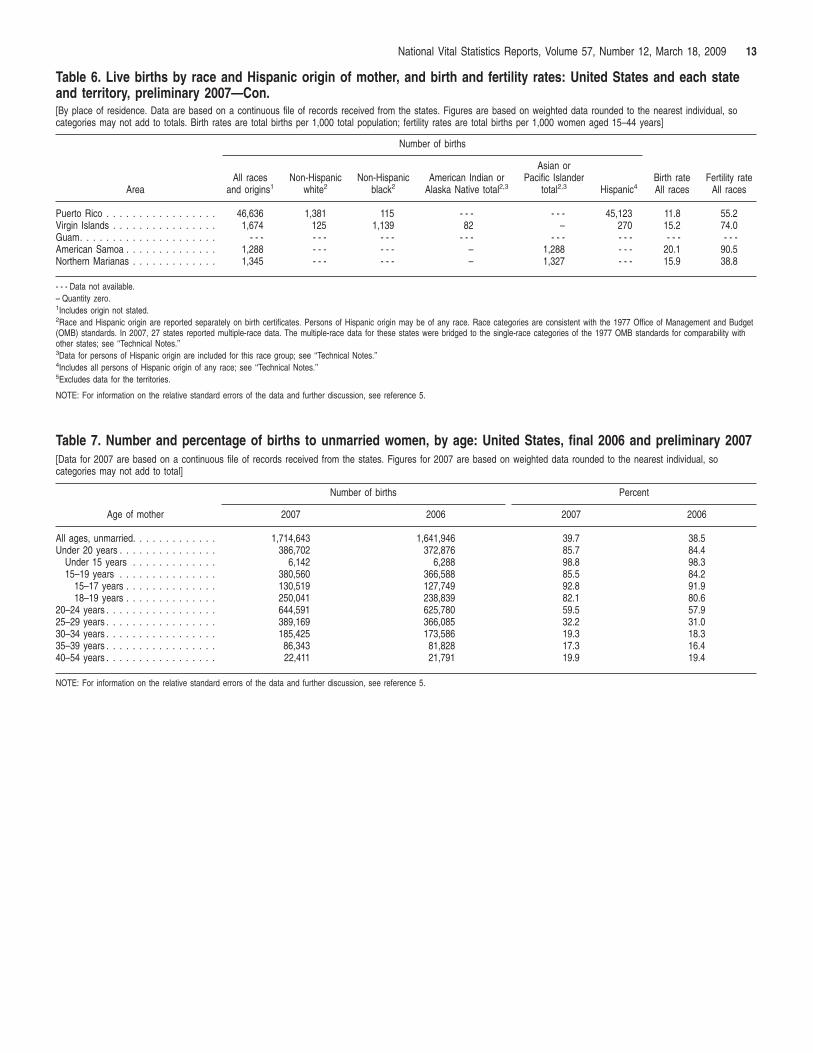
+ Preliminary CBRs for states varied considerably in 2007, ranging from 10.5 births per 1,000 total population in Vermont to 20.8 in Utah (Table 6). Birth rates for 13 states (Alabama, California, Indiana, Kansas, Kentucky, Louisiana, New Jersey, New York, Ohio, Pennsylvania, Texas, Washington, and West Virginia) increased significantly between 2006 and 2007, whereas birth rates for three states (Arizona, Colorado, and Michigan) and three territories (American Samoa, Puerto Rico, and Northern Marianas) decreased significantly. The rates for the remaining states, District of Columbia, and U.S. Virgin Islands were essentially unchanged (i.e., not statistically different).
GFRs for states varied considerably in 2007 as well, ranging from 53.2 births per 1,000 women age 15–44 years in Vermont to 94.4 in Utah (Table 6). Fertility rates increased significantly for 30 states between 2006 and 2007 (Alabama, California, Florida, Georgia, Hawaii, Idaho, Illinois, Indiana, Iowa, Kansas, Kentucky, Louisiana, Maryland, Minnesota, Mississippi, Missouri, Nevada, New Jersey, New Mexico, New York, North Carolina, Ohio, Oklahoma, Pennsylvania, Tennessee, Texas, Virginia, Washington, West Virginia, and Wisconsin). However, fertility rates for three territories only (American Samoa, Puerto Rico, and Northern Marianas) decreased significantly. Fertility rates for the remaining states, District of Columbia, and U.S. Virgin Islands were essentially unchanged.
+ All measures of childbearing by unmarried women increased in the United States to historic levels in 2007 (preliminary data) (1,4). The total number of births to unmarried women increased 4 percent from 2006, to 1,714,643 (Table 7). The 2007 total is up 26 percent from 2002 when the recent steep increases began. Births to unmarried women increased from 2006 to 2007 within each age group 15 years and over, and the increases far outpaced those in total (married and unmarried) births for ages 15–39 years, the principal childbearing years. Nonmarital births to 10–14 year
olds declined 2 percent.+ The preliminary birth rate for unmarried women rose 5 percent in 2007 to 52.9 births per 1,000 unmarried women aged 15–44 years. This rate has increased 21 percent since 2002 (43.7), following several years of relative stability.
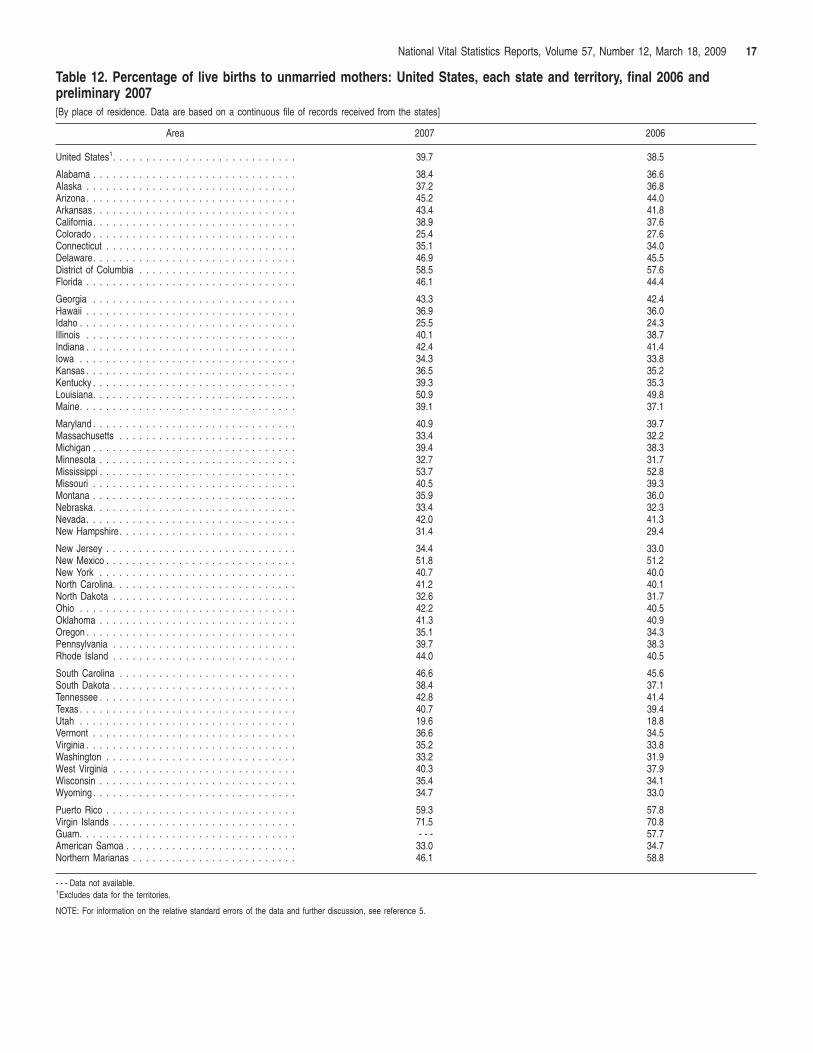
+ The preliminary proportion of all births to unmarried women increased to 39.7 percent in 2007, up from 38.5 percent in 2006. This proportion increased for all race and Hispanic origin population groups (Tables 1 and 7).
+ The largest increases in numbers of nonmarital births were reported for women aged 25–39 years; these increases amounted to 6 percent or more for 2006–2007.
+ Teenagers accounted for 23 percent of all nonmarital births in 2007, continuing a steady decline measured over the last several decades. In 1975, teenage mothers comprised 52 percent of nonmarital births (4).
+ In 2007, about six in seven births to teenagers were non-marital. Sixty percent of births to women aged 20–24 years and almost one-third of births to women aged 25–29 years were to unmarried women (Table 7).
Maternal and infant health birth characteristics Key findings, illustrated in Tables 8 and 9 and Figures 3 and 4,
show:
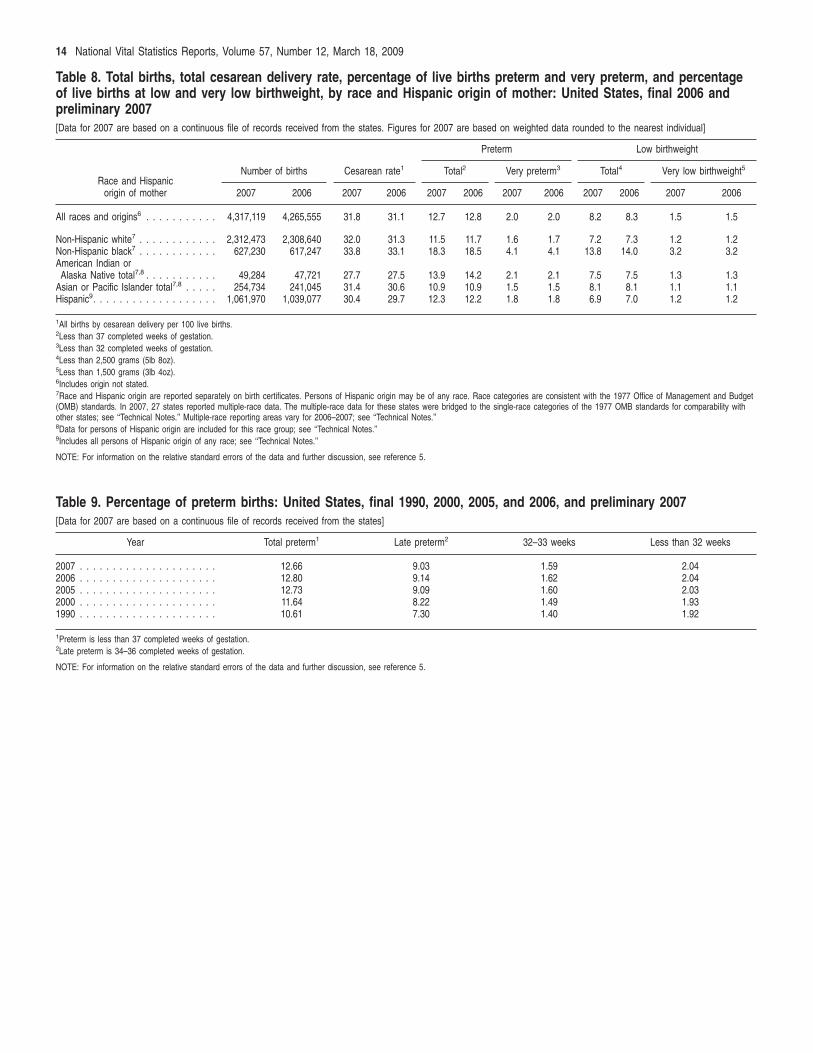
+ The preliminary cesarean delivery rate rose 2 percent in 2007, to 31.8 percent of all births, marking the 11th consecutive year of increase and another record high for the United States (Table 8; Figure 3). This rate has climbed by more than 50 percent over the last decade (20.7 percent in 1996). Increases between 2006 and 2007 in the percentage of births delivered by cesarean were reported for most age groups (data not shown), and for the three largest race and Hispanic origin groups: non-Hispanic white (32.0 percent in 2007), non-Hispanic black (33.8 percent) and
final 1989–2006 and preliminary 2007
0
5
10
15
Preterm
Late pretermPer
cent
1990 1995 2000 2005 2007 Year
NOTE: Preterm is less than 37 completed weeks of gestation. Late preterm is 34–36 completed weeks of gestation. SOURCE: CDC/NCHS, National Vital Statistics System.
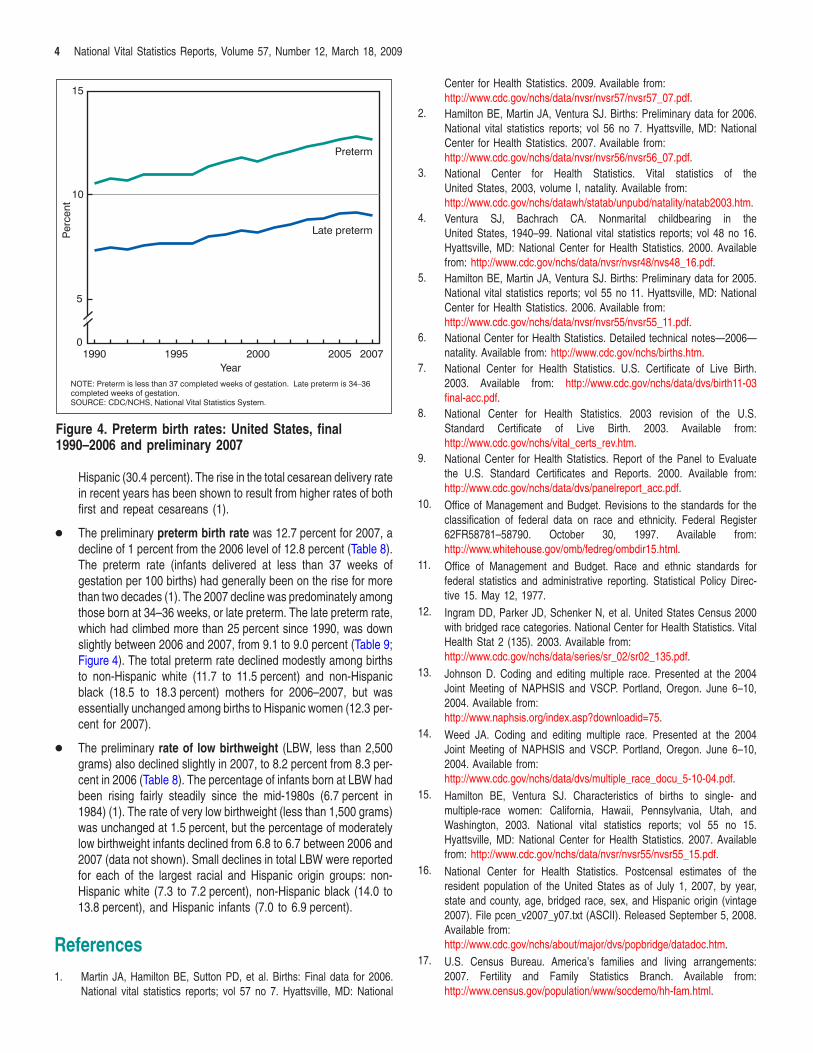
Figure 4. Preterm birth rates: United States, final 1990–2006 and preliminary 2007
4 National Vital Statistics Reports, Volume 57, Number 12, March 18, 2009
Hispanic (30.4 percent). The rise in the total cesarean delivery rate in recent years has been shown to result from higher rates of both first and repeat cesareans (1).
+ The preliminary preterm birth rate was 12.7 percent for 2007, a decline of 1 percent from the 2006 level of 12.8 percent (Table 8). The preterm rate (infants delivered at less than 37 weeks of gestation per 100 births) had generally been on the rise for more than two decades (1). The 2007 decline was predominately among those born at 34–36 weeks, or late preterm. The late preterm rate, which had climbed more than 25 percent since 1990, was down slightly between 2006 and 2007, from 9.1 to 9.0 percent (Table 9; Figure 4). The total preterm rate declined modestly among births to non-Hispanic white (11.7 to 11.5 percent) and non-Hispanic black (18.5 to 18.3 percent) mothers for 2006–2007, but was essentially unchanged among births to Hispanic women (12.3 percent for 2007).
+ The preliminary rate of low birthweight (LBW, less than 2,500 grams) also declined slightly in 2007, to 8.2 percent from 8.3 percent in 2006 (Table 8). The percentage of infants born at LBW had been rising fairly steadily since the mid-1980s (6.7 percent in 1984) (1). The rate of very low birthweight (less than 1,500 grams) was unchanged at 1.5 percent, but the percentage of moderately low birthweight infants declined from 6.8 to 6.7 between 2006 and 2007 (data not shown). Small declines in total LBW were reported for each of the largest racial and Hispanic origin groups: non-Hispanic white (7.3 to 7.2 percent), non-Hispanic black (14.0 to 13.8 percent), and Hispanic infants (7.0 to 6.9 percent).
References
1. Martin JA, Hamilton BE, Sutton PD, et al. Births: Final data for 2006. National vital statistics reports; vol 57 no 7. Hyattsville, MD: National
Center for Health Statistics. 2009. Available from: http://www.cdc.gov/nchs/data/nvsr/nvsr57/nvsr57_07.pdf.
2. Hamilton BE, Martin JA, Ventura SJ. Births: Preliminary data for 2006. National vital statistics reports; vol 56 no 7. Hyattsville, MD: National Center for Health Statistics. 2007. Available from: http://www.cdc.gov/nchs/data/nvsr/nvsr56/nvsr56_07.pdf.
3. National Center for Health Statistics. Vital statistics of the United States, 2003, volume I, natality. Available from: http://www.cdc.gov/nchs/datawh/statab/unpubd/natality/natab2003.htm.
4. Ventura SJ, Bachrach CA. Nonmarital childbearing in the United States, 1940–99. National vital statistics reports; vol 48 no 16. Hyattsville, MD: National Center for Health Statistics. 2000. Available from: http://www.cdc.gov/nchs/data/nvsr/nvsr48/nvs48_16.pdf.
5. Hamilton BE, Martin JA, Ventura SJ. Births: Preliminary data for 2005. National vital statistics reports; vol 55 no 11. Hyattsville, MD: National Center for Health Statistics. 2006. Available from: http://www.cdc.gov/nchs/data/nvsr/nvsr55/nvsr55_11.pdf.
6. National Center for Health Statistics. Detailed technical notes—2006— natality. Available from: http://www.cdc.gov/nchs/births.htm.
7. National Center for Health Statistics. U.S. Certificate of Live Birth. 2003. Available from: http://www.cdc.gov/nchs/data/dvs/birth11-03 final-acc.pdf.
8. National Center for Health Statistics. 2003 revision of the U.S. Standard Certificate of Live Birth. 2003. Available from: http://www.cdc.gov/nchs/vital_certs_rev.htm.
9. National Center for Health Statistics. Report of the Panel to Evaluate the U.S. Standard Certificates and Reports. 2000. Available from: http://www.cdc.gov/nchs/data/dvs/panelreport_acc.pdf.
10. Office of Management and Budget. Revisions to the standards for the classification of federal data on race and ethnicity. Federal Register 62FR58781–58790. October 30, 1997. Available from: http://www.whitehouse.gov/omb/fedreg/ombdir15.html.
11. Office of Management and Budget. Race and ethnic standards for federal statistics and administrative reporting. Statistical Policy Directive 15. May 12, 1977.
12. Ingram DD, Parker JD, Schenker N, et al. United States Census 2000 with bridged race categories. National Center for Health Statistics. Vital Health Stat 2 (135). 2003. Available from: http://www.cdc.gov/nchs/data/series/sr_02/sr02_135.pdf.
13. Johnson D. Coding and editing multiple race. Presented at the 2004 Joint Meeting of NAPHSIS and VSCP. Portland, Oregon. June 6–10, 2004. Available from: http://www.naphsis.org/index.asp?downloadid=75.
14. Weed JA. Coding and editing multiple race. Presented at the 2004 Joint Meeting of NAPHSIS and VSCP. Portland, Oregon. June 6–10, 2004. Available from: http://www.cdc.gov/nchs/data/dvs/multiple_race_docu_5-10-04.pdf.
15. Hamilton BE, Ventura SJ. Characteristics of births to single- and multiple-race women: California, Hawaii, Pennsylvania, Utah, and Washington, 2003. National vital statistics reports; vol 55 no 15. Hyattsville, MD: National Center for Health Statistics. 2007. Available from: http://www.cdc.gov/nchs/data/nvsr/nvsr55/nvsr55_15.pdf.
16. National Center for Health Statistics. Postcensal estimates of the resident population of the United States as of July 1, 2007, by year, state and county, age, bridged race, sex, and Hispanic origin (vintage 2007). File pcen_v2007_y07.txt (ASCII). Released September 5, 2008. Available from: http://www.cdc.gov/nchs/about/major/dvs/popbridge/datadoc.htm.
17. U.S. Census Bureau. America’s families and living arrangements: 2007. Fertility and Family Statistics Branch. Available from: http://www.census.gov/population/www/socdemo/hh-fam.html.
5 ational Vital Statistics Reports, Volume 57, Number 12, March 18, 2009
NList of Detailed Tables 1. Total births and percentage of births with selected demographic
characteristics, by race and Hispanic origin of mother: United States, final 2006 and preliminary 2007 . . . . . . . . . . . 6
2. Births and birth rates, by age and race and Hispanic origin of mother: United States, final 2006 and preliminary 2007 . . . . . 7
3. Birth rates for women aged 15–19 years, by age and race and Hispanic origin of mother: United States, final 1991, 2005, and 2006, and preliminary 2007; and percentage of change in rates, 1991–2005, 2005–2007, and 2006–2007 . . . . . . . . . . . . . . . 9
4. Live births by age of mother, live-birth order, and race and Hispanic origin of mother: United States, preliminary 2007 . . . 10
5. Birth rates by age of mother, live-birth order, and race and Hispanic origin of mother: United States, preliminary 2007 . . . 11
6. Live births by race and Hispanic origin of mother, and birth and fertility rates: United States and each state and territory, preliminary 2007 . . . . . . . . . . . . . . . . . . . . . . . . . . . . . . . . . . . 12
7. Number and percentage of births to unmarried women, by age: United States, final 2006 and preliminary 2007 . . . . . . . . . . . 13
8. Total births, total cesarean delivery rate, percentage of live births preterm and very preterm, and percentage of live births at low and very low birthweight, by race and Hispanic origin of mother: United States, final 2006 and preliminary 2007 . . . . . . . . . . . 14
9. Percentage of preterm births: United States, final 1990, 2000, 2005, and 2006, and preliminary 2007 . . . . . . . . . . . . . . . . 14
10. Total count of records and percent completeness of preliminary file of live births: United States, each state and territory, preliminary 2007. . . . . . . . . . . . . . . . . . . . . . . . . . . . . . . . 15
11. Percentage of live births to mothers under 20 years of age: United States, each state and territory, final 2006 and preliminary 2007 . . . . . . . . . . . . . . . . . . . . . . . . . . . . . . . . . . . . . . . 16
12. Percentage of live births to unmarried mothers: United States, each state and territory, final 2006 and preliminary 2007 . . . . . 17
13. Percentage low birthweight: United States, each state and territory, final 2006 and preliminary 2007 . . . . . . . . . . . . . . . 18
14. Percentage of live births by cesarean delivery: United States, each state and territory, final 2006 and preliminary 2007 . . . . . 19
15. Percentage of births preterm: United States, each state and territory, final 2006 and preliminary 2007 . . . . . . . . . . . . . . . 20
6 National Vital Statistics Reports, Volume 57, Number 12, March 18, 2009
Table 1. Total births and percentage of births with selected demographic characteristics, by race and Hispanic origin of mother: United States, final 2006 and preliminary 2007 [Data for 2007 are based on a continuous file of records received from the states. Figures for 2007 are based on weighted data rounded to the nearest individual. Birth rates are live births per 1,000 population in the specified group. Fertility rates are live births per 1,000 women aged 15–44 years in the specified group. Total fertility rates are sums of birth rates for 5-year age groups in the specified group, multiplied by 5]
Number of births Birth rate Fertility rate Total fertility rate Percent of
to unmarried births women
Race and Hispanic origin of mother 2007 2006 2007 2006 2007 2006 2007 2006 2007 2006
All races and origins1 . . . . . . . . . . . Non-Hispanic white2 . . . . . . . . . . . . Non-Hispanic black2 . . . . . . . . . . . .
American Indian or Alaska Native total2,3 . . . . . . . . . . .
Asian or Pacific Islander total2,3 . . . . . Hispanic4. . . . . . . . . . . . . . . . . . .
4,317,119 2,312,473
627,230
49,284 254,734
1,061,970
4,265,555 2,308,640
617,247
47,721 241,045
1,039,077
14.3 11.5 16.4
15.2 17.2 23.3
14.2 11.6 16.5
14.9 16.6 23.4
69.5 60.1 71.6
64.7 71.4
102.1
68.5 59.5 70.6
63.1 67.5
101.5
2,122.5 1,871.0 2,134.5
1,860.5 2,043.0 2,992.0
2,100.5 1,863.5 2,115.0
1,829.0 1,919.0 2,959.5
39.7 27.8 71.6
65.2 16.9 51.3
38.5 26.6 70.7
64.6 16.5 49.9
1Includes origin not stated. 2Race and Hispanic origin are reported separately on birth certificates. Persons of Hispanic origin may be of any race. (OMB) standards. In 2007, 27 states reported multiple-race data. The multiple-race data for these states were bridged other states; see ‘‘Technical Notes.’’ Multiple-race reporting areas vary for 2006–2007; see ‘‘Technical Notes.’’ 3Data for persons of Hispanic origin are included for this race group; see ‘‘Technical Notes.’’ 4Includes all persons of Hispanic origin of any race; see ‘‘Technical Notes.’’
NOTE: For information on the relative standard errors of the data and further discussion, see reference 5.
Race to the
categories single-race
are consistent categories of
with the the 1977
1977 OMB
Office of Management and Budget standards for comparability with
7 National Vital Statistics Reports, Volume 57, Number 12, March 18, 2009
Table 2. Births and birth rates, by age and race and Hispanic origin of mother: United States, final 2006 and preliminary 2007 [Data for 2007 are based on a continuous file of records received from the states. Figures for 2007 are based on weighted data rounded to the nearest individual, so categories may not add to totals. Rates are per 1,000 women in the specified age and race and Hispanic origin group]
2007
Age and race and Number of Number of
2006
Hispanic origin of mother births Rate births Rate
All races and origins1
Total2 . . . . . . . . . . . . . . . . . . . . . 4,317,119 69.5 4,265,555 68.5 10–14 years . . . . . . . . . . . . . . . . . 6,218 0.6 6,396 0.6 15–19 years . . . . . . . . . . . . . . . . . 445,045 42.5 435,436 41.9
15–17 years . . . . . . . . . . . . . . . 140,640 22.2 138,943 22.0 18–19 years . . . . . . . . . . . . . . . 304,405 73.9 296,493 73.0
20–24 years . . . . . . . . . . . . . . . . . 1,082,837 106.4 1,080,437 105.9 25–29 years . . . . . . . . . . . . . . . . . 1,208,504 117.5 1,181,899 116.7 30–34 years . . . . . . . . . . . . . . . . . 962,179 99.9 950,258 97.7 35–39 years . . . . . . . . . . . . . . . . . 499,916 47.5 498,616 47.3 40–44 years . . . . . . . . . . . . . . . . . 105,071 9.5 105,539 9.4
345–54 years . . . . . . . . . . . . . . . . 7,349 0.6 6,974 0.6
Non-Hispanic white4
Total2 . . . . . . . . . . . . . . . . . . . . . 2,312,473 60.1 2,308,640 59.5 10–14 years . . . . . . . . . . . . . . . . . 1,269 0.2 1,267 0.2 15–19 years . . . . . . . . . . . . . . . . . 173,104 27.2 169,729 26.6
15–17 years . . . . . . . . . . . . . . . 45,144 11.8 45,260 11.8 18–19 years . . . . . . . . . . . . . . . 127,960 50.5 124,469 49.3
20–24 years . . . . . . . . . . . . . . . . . 526,943 83.3 528,355 83.4 25–29 years . . . . . . . . . . . . . . . . . 676,599 108.8 665,479 109.1 30–34 years . . . . . . . . . . . . . . . . . 566,197 99.7 566,708 98.1 35–39 years . . . . . . . . . . . . . . . . . 301,666 45.8 309,033 46.3 40–44 years . . . . . . . . . . . . . . . . . 62,152 8.6 63,590 8.4
345–54 years . . . . . . . . . . . . . . . . 4,544 0.6 4,479 0.6
Non-Hispanic black4
Total2 . . . . . . . . . . . . . . . . . . . . . 627,230 71.6 617,247 70.6 10–14 years . . . . . . . . . . . . . . . . . 2,326 1.5 2,462 1.6 15–19 years . . . . . . . . . . . . . . . . . 106,224 64.3 103,725 63.7
15–17 years . . . . . . . . . . . . . . . 36,266 35.8 36,365 36.2 18–19 years . . . . . . . . . . . . . . . 69,958 109.3 67,360 108.4
20–24 years . . . . . . . . . . . . . . . . . 200,273 133.6 198,733 133.2 25–29 years . . . . . . . . . . . . . . . . . 157,173 107.5 153,613 107.1 30–34 years . . . . . . . . . . . . . . . . . 97,332 74.4 95,781 72.6 35–39 years . . . . . . . . . . . . . . . . . 50,614 36.4 49,927 36.0 40–44 years . . . . . . . . . . . . . . . . . 12,428 8.6 12,268 8.3
345–54 years . . . . . . . . . . . . . . . . 860 0.6 738 0.5
American Indian or Alaska Native total4,5
Total2 . . . . . . . . . . . . . . . . . . . . . 49,284 64.7 47,721 63.1 10–14 years . . . . . . . . . . . . . . . . . 120 0.9 124 0.9 15–19 years . . . . . . . . . . . . . . . . . 8,925 59.0 8,261 55.0
15–17 years . . . . . . . . . . . . . . . 2,909 31.7 2,820 30.7 18–19 years . . . . . . . . . . . . . . . 6,016 101.3 5,441 93.0
20–24 years . . . . . . . . . . . . . . . . . 16,759 116.3 16,447 115.4 25–29 years . . . . . . . . . . . . . . . . . 12,420 96.4 12,198 97.8 30–34 years . . . . . . . . . . . . . . . . . 7,052 63.7 6,780 61.8 35–39 years . . . . . . . . . . . . . . . . . 3,265 29.4 3,143 28.4 40–44 years . . . . . . . . . . . . . . . . . 704 6.1 726 6.1
345–54 years . . . . . . . . . . . . . . . . 38 0.3 42 0.4
See footnotes at end of table.
8 National Vital Statistics Reports, Volume 57, Number 12, March 18, 2009
Table 2. Births and birth rates, by age and race and Hispanic origin of mother: United States, preliminary 2007—Con. [Data for 2007 are based on a continuous file of records received from the states. Figures for 2007 are based on weighted data rounded categories may not add to totals. Rates are per 1,000 women in the specified age and race and Hispanic origin group]
final 2006 and
to the nearest individual, so
2007 2006
Age and race Hispanic origin of
and mother
Number births
of Rate
Number births
of Rate
Asian or Pacific Islander total4,5
Total2 . . . . . . . . . . . . . . . . . . . . . 10–14 years . . . . . . . . . . . . . . . . . 15–19 years . . . . . . . . . . . . . . . . .
15–17 years . . . . . . . . . . . . . . . 18–19 years . . . . . . . . . . . . . . .
20–24 years . . . . . . . . . . . . . . . . . 25–29 years . . . . . . . . . . . . . . . . . 30–34 years . . . . . . . . . . . . . . . . . 35–39 years . . . . . . . . . . . . . . . . . 40–44 years . . . . . . . . . . . . . . . . .
3 45–54 years . . . . . . . . . . . . . . . .
Hispanic6
Total2 . . . . . . . . . . . . . . . . . . . . . 10–14 years . . . . . . . . . . . . . . . . . 15–19 years . . . . . . . . . . . . . . . . .
15–17 years . . . . . . . . . . . . . . . 18–19 years . . . . . . . . . . . . . . .
20–24 years . . . . . . . . . . . . . . . . . 25–29 years . . . . . . . . . . . . . . . . . 30–34 years . . . . . . . . . . . . . . . . . 35–39 years . . . . . . . . . . . . . . . . . 40–44 years . . . . . . . . . . . . . . . . .
3 45–54 years . . . . . . . . . . . . . . . .
254,734 92
8,022 2,336 5,686
32,309 71,465 86,949 46,379
8,879 639
1,061,970 2,407
148,453 53,941 94,511
305,107 287,730 201,212
95,694 20,273 1,095
71.4 0.2
17.3 8.4
30.7 66.2
117.9 125.1
66.3 14.5 1.1
102.1 1.2
81.7 47.8
137.1 178.5 155.6 110.8 56.4 13.4 0.8
241,045 73
7,812 2,438 5,374
31,860 66,913 82,885 42,394
8,549 559
1,039,077 2,456
145,669 51,990 93,679
303,454 280,615 194,594
91,568 19,700 1,021
67.5 0.2
17.0 8.8
29.5 63.2
108.4 116.9 63.0 14.1 1.0
101.5 1.3
83.0 47.9
139.7 177.0 152.4 108.5
55.6 13.3 0.8
1Includes origin not stated. 2The total number includes births to women of all ages, 10–54 years. The rate shown for all ages is the fertility rate, which is defined as the total number of births (regardless of the mother’s age) per 1,000 women aged 15–44 years. 3The total number includes births to women aged 45–54 years. The birth rate for women aged 45–49 years is computed by relating the number of births to women aged 45–54 years to women aged 45–49 years, because most of the births in this group are to women aged 45–49 years. 4Race and Hispanic origin are reported separately on birth certificates. Persons of Hispanic origin may be of any race. Race categories are consistent with the 1977 Office of Management and Budget (OMB) standards. In 2007, 27 states reported multiple-race data. The multiple-race data for these states were bridged to the single-race categories of the 1977 OMB standards for comparability with other states; see ‘‘Technical Notes.’’ Multiple-race reporting areas vary for 2006–2007; see ‘‘Technical Notes.’’ 5Data for persons of Hispanic origin are included for this race group; see ‘‘Technical Notes.’’ 6Includes all persons of Hispanic origin of any race; see ‘‘Technical Notes.’’
NOTE: For information on the relative standard errors of the data and further discussion, see reference 5.
9 National Vital Statistics Reports, Volume 57, Number 12, March 18, 2009
Table 3. Birth rates for women aged 15–19 years, by age and race and Hispanic 1991, 2005, and 2006, and preliminary 2007; and percentage of change in rates, [Data for 2007 are based on a continuous file of records received from the states. Rates are per 1,000 women in the
origin of mother: United States, final 1991–2005, 2005–2007, and 2006–2007 specified age and race and Hispanic origin group]
Age and race Hispanic origin of
and mother
Year Percent change
2007 2006 2005 1991 2006–2007 2005–2007 1991–2005
10–14 years All races and origins1 . . . . . . . . . . . . . .
Non-Hispanic white2. . . . . . . . . . . . . . . Non-Hispanic black2. . . . . . . . . . . . . . .
American Indian or Alaska Native total2,3 . . Asian or Pacific Islander total2,3. . . . . . . .
Hispanic4 . . . . . . . . . . . . . . . . . . . . .
15–19 years All races and origins1 . . . . . . . . . . . . . .
Non-Hispanic white2. . . . . . . . . . . . . . . Non-Hispanic black2. . . . . . . . . . . . . . .
American Indian or Alaska Native total2,3 . . Asian or Pacific Islander total2,3. . . . . . . .
Hispanic4 . . . . . . . . . . . . . . . . . . . . .
15–17 years All races and origins1 . . . . . . . . . . . . . .
Non-Hispanic white2. . . . . . . . . . . . . . . Non-Hispanic black2. . . . . . . . . . . . . . .
American Indian or Alaska Native total2,3 . . Asian or Pacific Islander total2,3. . . . . . . .
Hispanic4 . . . . . . . . . . . . . . . . . . . . .
18–19 years All races and origins1 . . . . . . . . . . . . . .
Non-Hispanic white2. . . . . . . . . . . . . . . Non-Hispanic black2. . . . . . . . . . . . . . .
American Indian or Alaska Native total2,3 . . Asian or Pacific Islander total2,3. . . . . . . .
Hispanic4 . . . . . . . . . . . . . . . . . . . . .
0.6 0.2 1.5 0.9 0.2 1.2
42.5 27.2 64.3 59.0 17.3 81.7
22.2 11.8 35.8 31.7
8.4 47.8
73.9 50.5
109.3 101.3
30.7 137.1
0.6 0.2 1.6 0.9 0.2 1.3
41.9 26.6 63.7 55.0 17.0 83.0
22.0 11.8 36.2 30.7
8.8 47.9
73.0 49.3
108.4 93.0 29.5
139.7
0.7 0.2 1.7 0.9 0.2 1.3
40.5 25.9 60.9 52.7 17.0 81.7
21.4 11.5 34.9 30.5
8.2 48.5
69.9 48.0
103.0 87.6 30.1
134.6
1.4 0.5 4.9 1.6 0.8 2.4
61.8 43.4
118.2 84.1 27.3
104.6
38.6 23.6 86.1 51.9 16.3 69.2
94.0 70.6
162.2 134.2
42.2 155.5
0 0
–6 0 0
–8
1 2 1 7 2
–2
1 0
–1 3
–5 0
1 2 1 9 4
–2
–14 0
–12 0 0
–8
5 5 6
12 2 0
4 3 3 4 2
–1
6 5 6
16 2 2
–50 –60 –65 –44 –75 –46
–34 –40 –48 –37 –38 –22
–45 –51 –59 –41 –50 –30
–26 –32 –36 –35 –29 –13
1Includes origin not stated. 2Race and Hispanic origin are reported separately on birth certificates. Persons of Hispanic origin may be of any race. (OMB) standards. In 2007, 27 states reported multiple-race data. The multiple-race data for these states were bridged other states; see ‘‘Technical Notes.’’ Multiple-race reporting areas vary for 2005–2007; see ‘‘Technical Notes.’’ 3Data for persons of Hispanic origin are included for this race group; see ‘‘Technical Notes.’’ 4Includes all persons of Hispanic origin of any race; see ‘‘Technical Notes.’’
NOTE: For information on the relative standard errors of the data and further discussion, see reference 5.
Race to the
categories single-race
are consistent categories of
with the the 1977
1977 OMB
Office of Management and Budget standards for comparability with
10 National Vital Statistics Reports, Volume 57, Number 12, March 18, 2009
Table 4. Live births by preliminary 2007 [Data are based on a continuous totals]
age
file of
of mother, live-birth order, and
records received from the states. Figures are
race
based
and Hispanic origin of mother: United States,
on weighted data rounded to the nearest individual, so categories may not add to
Live-birth order and Hispanic origin of
race and mother
All ages
Age of mother
Under 15 years
15–19 years
20–24 years
25–29 years
30–34 years
35–39 years
40–44 years
45–54 years
All races and origins1 . . . . . . . . . . . . . . . .
1st child . . . . . . . . . . . . . . . . . . . . . . . . 2d child . . . . . . . . . . . . . . . . . . . . . . . . 3d child . . . . . . . . . . . . . . . . . . . . . . . . 4th child and over . . . . . . . . . . . . . . . . . . Not stated . . . . . . . . . . . . . . . . . . . . . . .
Non-Hispanic white2 . . . . . . . . . . . . . . . . .
1st child . . . . . . . . . . . . . . . . . . . . . . . . 2d child . . . . . . . . . . . . . . . . . . . . . . . . 3d child . . . . . . . . . . . . . . . . . . . . . . . . 4th child and over . . . . . . . . . . . . . . . . . . Not stated . . . . . . . . . . . . . . . . . . . . . . .
Non-Hispanic black2 . . . . . . . . . . . . . . . . .
1st child . . . . . . . . . . . . . . . . . . . . . . . . 2d child . . . . . . . . . . . . . . . . . . . . . . . . 3d child . . . . . . . . . . . . . . . . . . . . . . . . 4th child and over . . . . . . . . . . . . . . . . . . Not stated . . . . . . . . . . . . . . . . . . . . . . .
American Indian or Alaska Native total2,3 . . . .
1st child . . . . . . . . . . . . . . . . . . . . . . . . 2d child . . . . . . . . . . . . . . . . . . . . . . . . 3d child . . . . . . . . . . . . . . . . . . . . . . . . 4th child and over . . . . . . . . . . . . . . . . . . Not stated . . . . . . . . . . . . . . . . . . . . . . .
Asian or Pacific Islander total2,3 . . . . . . . . . .
1st child . . . . . . . . . . . . . . . . . . . . . . . . 2d child . . . . . . . . . . . . . . . . . . . . . . . . 3d child . . . . . . . . . . . . . . . . . . . . . . . . 4th child and over . . . . . . . . . . . . . . . . . . Not stated . . . . . . . . . . . . . . . . . . . . . . .
Hispanic4 . . . . . . . . . . . . . . . . . . . . . . .
1st child . . . . . . . . . . . . . . . . . . . . . . . . 2d child . . . . . . . . . . . . . . . . . . . . . . . . 3d child . . . . . . . . . . . . . . . . . . . . . . . . 4th child and over . . . . . . . . . . . . . . . . . . Not stated . . . . . . . . . . . . . . . . . . . . . . .
4,317,119
1,726,523 1,364,048
722,883 483,766
19,897
2,312,473
967,305 760,952 364,534 210,171
9,511
627,230
243,684 177,902 107,439
93,841 4,365
49,284
17,606 13,270
8,792 9,406
211
254,734
116,225 89,426 31,617 16,372
1,093
1,061,970
377,282 319,355 209,148 152,705
3,481
6,218
6,088 99
2 1
29
1,269
1,251 14
– – 5
2,326
2,264 48
– 1
13
120
119 1 – – –
92
90 1 – – 1
2,407
2,361 35
2 – 9
445,045
357,092 73,891 10,863
1,472 1,727
173,104
144,966 24,353
2,889 316 581
106,224
83,138 18,645
3,281 538 622
8,925
6,844 1,743
266 37 34
8,022
6,509 1,232
199 30 53
148,453
115,346 27,923
4,247 550 387
1,082,837
524,240 359,732 141,942 52,063
4,861
526,943
278,691 170,681 58,493 17,048 2,029
200,273
86,025 65,267 31,938 15,700
1,343
16,759
6,538 5,690 3,075 1,392
65
32,309
19,338 8,797 2,875 1,116
183
305,107
132,872 109,057 45,437 16,745
997
1,208,504
432,011 400,000 230,640 140,490
5,364
676,599
276,142 228,865 112,351 56,656 2,585
157,173
40,096 48,480 35,608 31,867
1,123
12,420
2,559 3,468 3,068 3,269
56
71,465
38,963 21,681
6,902 3,632
286
287,730
72,881 96,688 72,342 44,842
976
962,179
270,057 334,881 201,033 151,655
4,552
566,197
175,213 210,811 109,632
68,090 2,451
97,332
20,335 28,218 22,166 25,851
762
7,052
1,058 1,632 1,586 2,743
34
86,949
35,491 35,129 10,770 5,237
322
201,212
36,730 57,956 56,467 49,374
685
499,916
112,833 163,927 114,878 105,601
2,677
301,666
74,888 105,975 67,613 51,682 1,508
50,614
9,437 13,919 11,656 15,224
377
3,265
407 627 673
1,546 12
46,379
13,343 19,265 8,870 4,704
197
95,694
14,162 23,390 25,745 32,048
350
105,071
22,322 29,721 22,220 30,175
634
62,152
14,837 19,065 12,775 15,149
325
12,428
2,214 3,140 2,642 4,315
117
704
79 103 123 390
9
8,879
2,293 3,134 1,894 1,514
44
20,273
2,760 4,111 4,676 8,653
74
7,349
1,881 1,797 1,307 2,310
54
4,544
1,317 1,190
780 1,228
28
860
175 185 147 344
8
38
3 6 1
28 –
639
198 188 107 139
7
1,095
171 196 231 493
3
– Quantity zero. 1Includes origin not stated. 2Race and Hispanic origin are reported separately on birth certificates. Persons of Hispanic origin may be of any race. (OMB) standards. In 2007, 27 states reported multiple-race data. The multiple-race data for these states were bridged other states; see ‘‘Technical Notes.’’ 3Data for persons of Hispanic origin are included for this race group; see ‘‘Technical Notes.’’ 4Includes all persons of Hispanic origin of any race; see ‘‘Technical Notes.’’
NOTE: For information on the relative standard errors of the data and further discussion, see reference 5.
Race to the
categories single-race
are consistent categories of
with the the 1977
1977 OMB
Office of Management and Budget standards for comparability with
National Vital Statistics Reports, Volume 57, Number 12, March 18, 2009 11
Table 5. Birth rates by preliminary 2007 [Data are based on a continuous
age
file of
of mother, live-birth order,
records received from the states. Rates
and race and Hispanic origin
are per 1,000 women in the specified age
of
and
mother: United States,
race and Hispanic origin group]
Live-birth order and and Hispanic origin of
race mother
15–44 1 years
Age of mother
10–14 years
15–19 years
20–24 years
25–29 years
30–34 years
35–39 years
40–44 years
45–49 2 years
All races and origins3 . . . . . . . . . . . . . . . .
1st child . . . . . . . . . . . . . . . . . . . . . . . . 2d child . . . . . . . . . . . . . . . . . . . . . . . . 3d child . . . . . . . . . . . . . . . . . . . . . . . . 4th child and over . . . . . . . . . . . . . . . . . .
Non-Hispanic white4 . . . . . . . . . . . . . . . . .
1st child . . . . . . . . . . . . . . . . . . . . . . . . 2d child . . . . . . . . . . . . . . . . . . . . . . . . 3d child . . . . . . . . . . . . . . . . . . . . . . . . 4th child and over . . . . . . . . . . . . . . . . . .
Non-Hispanic black4 . . . . . . . . . . . . . . . .
1st child . . . . . . . . . . . . . . . . . . . . . . . . 2d child . . . . . . . . . . . . . . . . . . . . . . . . 3d child . . . . . . . . . . . . . . . . . . . . . . . . 4th child and over . . . . . . . . . . . . . . . . . .
American Indian or Alaska Native total4,5. . . . .
1st child . . . . . . . . . . . . . . . . . . . . . . . . 2d child . . . . . . . . . . . . . . . . . . . . . . . . 3d child . . . . . . . . . . . . . . . . . . . . . . . . 4th child and over . . . . . . . . . . . . . . . . . .
Asian or Pacific Islander total4,5 . . . . . . . . . .
1st child . . . . . . . . . . . . . . . . . . . . . . . . 2d child . . . . . . . . . . . . . . . . . . . . . . . . 3d child . . . . . . . . . . . . . . . . . . . . . . . . 4th child and over . . . . . . . . . . . . . . . . . .
Hispanic6 . . . . . . . . . . . . . . . . . . . . . . .
1st child . . . . . . . . . . . . . . . . . . . . . . . . 2d child . . . . . . . . . . . . . . . . . . . . . . . . 3d child . . . . . . . . . . . . . . . . . . . . . . . . 4th child and over . . . . . . . . . . . . . . . . . .
69.5
27.9 22.1 11.7 7.8
60.1
25.2 19.9
9.5 5.5
71.6
28.0 20.4 12.3 10.8
64.7
23.2 17.5 11.6 12.4
71.4
32.7 25.2
8.9 4.6
102.1
36.4 30.8 20.2 14.7
0.6
0.6 0.0
* *
0.2
0.2 * * *
1.5
1.5 0.0
* *
0.9
0.9 * * *
0.2
0.2 * * *
1.2
1.2 0.0
* *
42.5
34.2 7.1 1.0 0.1
27.2
22.9 3.9 0.5 0.1
64.3
50.6 11.4 2.0 0.3
59.0
45.5 11.6 1.8 0.2
17.3
14.1 2.7 0.4 0.1
81.7
63.6 15.4 2.3 0.3
106.4
51.7 35.5 14.0
5.1
83.3
44.2 27.1
9.3 2.7
133.6
57.8 43.8 21.5 10.5
116.3
45.6 39.7 21.4
9.7
66.2
39.8 18.1
5.9 2.3
178.5
78.0 64.0 26.7
9.8
117.5
42.2 39.1 22.5 13.7
108.8
44.5 36.9 18.2
9.2
107.5
27.6 33.4 24.5 22.0
96.4
19.9 27.0 23.9 25.5
117.9
64.5 35.9 11.4 6.0
155.6
39.5 52.5 39.2 24.3
99.9
28.2 35.0 21.0 15.8
99.7
31.0 37.2 19.4 12.1
74.4
15.7 21.7 17.0 19.9
63.7
9.6 14.8 14.4 24.9
125.1
51.3 50.7 15.6
7.6
110.8
20.3 32.0 31.2 27.3
47.5
10.8 15.7 11.0 10.1
45.8
11.4 16.2 10.3 7.9
36.4
6.8 10.1
8.4 11.0
29.4
3.7 5.7 6.1
14.0
66.3
19.2 27.7 12.7
6.8
56.4
8.4 13.8 15.2 19.0
9.5
2.0 2.7 2.0 2.8
8.6
2.1 2.6 1.8 2.1
8.6
1.5 2.2 1.8 3.0
6.1
0.7 0.9 1.1 3.4
14.5
3.7 5.1 3.1 2.5
13.4
1.8 2.7 3.1 5.7
0.6
0.2 0.2 0.1 0.2
0.6
0.2 0.2 0.1 0.2
0.6
0.1 0.1 0.1 0.2
0.3
* * *
0.2
1.1
0.4 0.3 0.2 0.2
0.8
0.1 0.2 0.2 0.4
0.0 Quantity more than zero but less than 0.05. * Figure does not meet standards of reliability or precision; based on fewer than 20 births in the numerator. 1The rate shown is the fertility rate, which is defined as the total number of births, regardless of age of mother, per 1,000 women aged 15–44 years. 2The birth rate for women aged 45–49 years is computed by relating births to women aged 45–54 years to women aged 45–49 years, because most of the births in 45–49 years. 3Includes origin not stated. 4Race and Hispanic origin are reported separately on birth certificates. Persons of Hispanic origin may be of any race. Race categories are consistent with the 1977 (OMB) standards. In 2007, 27 states reported multiple-race data. The multiple-race data for these states were bridged to the single-race categories of the 1977 OMB other states; see ‘‘Technical Notes.’’ 5Data for persons of Hispanic origin are included for this race group; see ‘‘Technical Notes.’’ 6Includes all persons of Hispanic origin of any race; see ‘‘Technical Notes.’’
NOTE: For information on the relative standard errors of the data and further discussion, see reference 5.
this group are to women aged
Office of Management and Budget standards for comparability with
12 National Vital Statistics Reports, Volume 57, Number 12, March 18, 2009
Table 6. Live births by race and Hispanic origin of mother, and birth and fertility rates: United States and each state and territory, preliminary 2007 [By place of residence. Data are based on a continuous file of records received from the states. Figures are based on weighted data rounded to the nearest individual, so categories may not add to totals. Birth rates are total births per 1,000 total population; fertility rates are total births per 1,000 women aged 15–44 years]
Number of births
Asian or All races Non-Hispanic Non-Hispanic American Indian or Pacific Islander Birth rate Fertility rate
Area and origins1 white2 black2 Alaska Native total2,3 total2,3 Hispanic4 All races All races
United States5. . . . . . . . . . . . . . . . 4,317,119 2,312,473 627,230 49,284 254,734 1,061,970 14.3 69.5
Alabama . . . . . . . . . . . . . . . . . . . 64,749 38,464 19,740 189 942 5,391 14.0 68.7 Alaska . . . . . . . . . . . . . . . . . . . . 11,101 6,291 409 2,836 835 825 16.2 77.5 Arizona . . . . . . . . . . . . . . . . . . . . 102,992 42,521 3,914 6,700 3,597 46,373 16.2 81.1 Arkansas . . . . . . . . . . . . . . . . . . . 41,377 27,720 8,080 261 721 4,515 14.6 73.1 California. . . . . . . . . . . . . . . . . . . 566,352 155,930 31,777 3,626 74,292 296,942 15.5 72.5 Colorado . . . . . . . . . . . . . . . . . . . 70,805 41,853 3,122 755 2,493 22,221 14.6 69.8 Connecticut . . . . . . . . . . . . . . . . . 41,663 24,897 5,183 238 2,441 8,832 11.9 59.5 Delaware. . . . . . . . . . . . . . . . . . . 12,171 6,494 3,215 16 530 1,912 14.1 68.4 District of Columbia . . . . . . . . . . . . 8,862 2,227 4,936 2 259 1,450 15.1 60.0 Florida . . . . . . . . . . . . . . . . . . . . 239,143 107,843 51,835 805 7,988 70,833 13.1 68.4
Georgia . . . . . . . . . . . . . . . . . . . 152,021 70,735 49,278 437 5,696 24,319 15.9 73.7 Hawaii . . . . . . . . . . . . . . . . . . . . 19,137 4,557 426 77 12,958 3,007 14.9 76.0 Idaho . . . . . . . . . . . . . . . . . . . . . 25,019 20,190 139 451 416 3,870 16.7 83.4 Illinois . . . . . . . . . . . . . . . . . . . . 180,856 95,508 31,655 262 9,212 44,151 14.1 67.4 Indiana . . . . . . . . . . . . . . . . . . . . 89,847 68,907 10,229 118 1,693 8,805 14.2 69.7 Iowa . . . . . . . . . . . . . . . . . . . . . 40,885 34,521 1,804 315 1,021 3,355 13.7 70.1 Kansas . . . . . . . . . . . . . . . . . . . . 42,004 30,512 3,059 376 1,367 6,689 15.1 75.6 Kentucky . . . . . . . . . . . . . . . . . . . 59,370 49,842 5,418 114 1,018 3,092 14.0 68.6 Louisiana. . . . . . . . . . . . . . . . . . . 66,260 36,172 25,343 476 1,160 3,188 15.4 73.3 Maine. . . . . . . . . . . . . . . . . . . . . 14,120 13,186 325 125 223 209 10.7 55.6
Maryland . . . . . . . . . . . . . . . . . . . 78,096 36,128 26,198 151 5,484 10,608 13.9 65.6 Massachusetts . . . . . . . . . . . . . . . 77,962 53,274 7,262 185 6,013 10,900 12.1 57.4 Michigan . . . . . . . . . . . . . . . . . . . 125,394 85,528 22,343 765 4,337 8,441 12.4 61.5 Minnesota . . . . . . . . . . . . . . . . . . 73,745 53,856 6,615 1,673 5,412 5,939 14.2 69.7 Mississippi . . . . . . . . . . . . . . . . . . 46,501 23,068 20,894 309 475 1,708 15.9 76.9 Missouri . . . . . . . . . . . . . . . . . . . 81,928 62,211 12,610 435 1,978 4,667 13.9 68.8 Montana . . . . . . . . . . . . . . . . . . . 12,444 9,623 62 1,599 145 372 13.0 68.6 Nebraska. . . . . . . . . . . . . . . . . . . 26,923 20,008 1,794 618 754 4,068 15.2 76.2 Nevada. . . . . . . . . . . . . . . . . . . . 41,202 16,959 3,615 576 3,544 16,144 16.1 79.6 New Hampshire. . . . . . . . . . . . . . . 14,169 12,620 203 54 540 593 10.8 53.8
New Jersey . . . . . . . . . . . . . . . . . 116,060 56,139 17,863 188 11,944 30,027 13.4 66.1 New Mexico . . . . . . . . . . . . . . . . . 30,555 8,662 522 3,835 1,330 17,007 15.5 76.4 New York . . . . . . . . . . . . . . . . . . 253,458 125,632 42,738 629 24,084 60,134 13.1 62.1 North Carolina. . . . . . . . . . . . . . . . 131,016 72,416 30,635 1,772 3,988 22,113 14.5 69.6 North Dakota . . . . . . . . . . . . . . . . 8,840 7,277 129 1,012 110 278 13.8 69.8 Ohio . . . . . . . . . . . . . . . . . . . . . 150,882 115,583 24,222 320 3,291 6,611 13.2 65.5 Oklahoma . . . . . . . . . . . . . . . . . . 55,078 35,334 4,914 6,517 1,259 7,173 15.2 76.0 Oregon . . . . . . . . . . . . . . . . . . . . 49,372 34,256 1,145 955 2,712 10,133 13.2 66.1 Pennsylvania . . . . . . . . . . . . . . . . 150,731 107,818 21,281 407 6,260 13,793 12.1 61.9 Rhode Island . . . . . . . . . . . . . . . . 12,375 5,999 1,045 159 536 2,588 11.7 55.8
South Carolina . . . . . . . . . . . . . . . 62,891 34,411 20,489 274 1,159 6,215 14.3 69.9 South Dakota . . . . . . . . . . . . . . . . 12,259 9,351 212 2,158 149 471 15.4 80.0 Tennessee . . . . . . . . . . . . . . . . . . 86,707 58,588 17,768 387 2,003 8,383 14.1 68.8 Texas . . . . . . . . . . . . . . . . . . . . . 407,640 140,272 46,397 1,064 16,032 204,498 17.1 80.1 Utah . . . . . . . . . . . . . . . . . . . . . 55,131 42,844 539 768 1,761 9,042 20.8 94.4 Vermont . . . . . . . . . . . . . . . . . . . 6,513 6,178 95 14 91 78 10.5 53.2 Virginia . . . . . . . . . . . . . . . . . . . . 108,874 62,155 23,842 176 8,021 14,966 14.1 67.0 Washington . . . . . . . . . . . . . . . . . 88,958 56,299 3,812 2,492 9,303 16,881 13.8 66.9 West Virginia . . . . . . . . . . . . . . . . 21,992 20,700 778 23 181 253 12.1 63.1 Wisconsin . . . . . . . . . . . . . . . . . . 72,796 54,549 7,240 1,255 2,895 6,934 13.0 65.0 Wyoming . . . . . . . . . . . . . . . . . . . 7,893 6,361 79 333 79 969 15.1 77.7
See footnotes at end of table.
National Vital Statistics Reports, Volume 57, Number 12, March 18, 2009 13
Table 6. Live births by race and Hispanic origin of mother, and birth and fertility and territory, preliminary 2007—Con. [By place of residence. Data are based on a continuous file of records received from the states. Figures are based on categories may not add to totals. Birth rates are total births per 1,000 total population; fertility rates are total births per
rates: United States and each state
weighted data rounded to the nearest individual, so 1,000 women aged 15–44 years]
Area
Number of births
Birth rate All races
Fertility rate All races
All races and origins1
Non-Hispanic white2
Non-Hispanic American Indian or black2 Alaska Native total2,3
Asian or Pacific Islander
total2,3 Hispanic4
Puerto Rico . . . . . . . . . . . . . . . . . Virgin Islands . . . . . . . . . . . . . . . . Guam. . . . . . . . . . . . . . . . . . . . . American Samoa . . . . . . . . . . . . . . Northern Marianas . . . . . . . . . . . . .
46,636 1,674
- - 1,288 1,345
1,381 125 - - - - - -
115 - - 1,139 82
- - - - - - – - - –
- - –
- - 1,288 1,327
45,123 270 - - - - - -
11.8 15.2 - -
20.1 15.9
55.2 74.0 - -
90.5 38.8
- - - Data not available. – Quantity zero. 1Includes origin not stated. 2Race and Hispanic origin are reported separately on birth certificates. Persons of Hispanic origin may be of any race. Race categories are consistent with the 1977 Office of Management and Budget (OMB) standards. In 2007, 27 states reported multiple-race data. The multiple-race data for these states were bridged to the single-race categories of the 1977 OMB standards for comparability with other states; see ‘‘Technical Notes.’’ 3Data for persons of Hispanic origin are included for this race group; see ‘‘Technical Notes.’’ 4Includes all persons of Hispanic origin of any race; see ‘‘Technical Notes.’’ 5Excludes data for the territories.
NOTE: For information on the relative standard errors of the data and further discussion, see reference 5.
Table 7. Number and percentage of births to unmarried women, by age: United States, final 2006 and preliminary 2007 [Data for 2007 are based on a continuous file of records received from the states. Figures for 2007 are based on weighted data rounded to the nearest individual, so categories may not add to total]
Number of births Percent
Age of mother 2007 2006 2007 2006
All ages, unmarried. . . . . . . . . . . . . Under 20 years . . . . . . . . . . . . . . .
Under 15 years . . . . . . . . . . . . . 15–19 years . . . . . . . . . . . . . . .
15–17 years . . . . . . . . . . . . . . 18–19 years . . . . . . . . . . . . . .
20–24 years . . . . . . . . . . . . . . . . . 25–29 years . . . . . . . . . . . . . . . . . 30–34 years . . . . . . . . . . . . . . . . . 35–39 years . . . . . . . . . . . . . . . . . 40–54 years . . . . . . . . . . . . . . . . .
1,714,643 386,702
6,142 380,560 130,519 250,041 644,591 389,169 185,425 86,343 22,411
1,641,946 372,876
6,288 366,588 127,749 238,839 625,780 366,085 173,586 81,828 21,791
39.7 85.7 98.8 85.5 92.8 82.1 59.5 32.2 19.3 17.3 19.9
38.5 84.4 98.3 84.2 91.9 80.6 57.9 31.0 18.3 16.4 19.4
NOTE: For information on the relative standard errors of the data and further discussion, see reference 5.
14 National Vital Statistics Reports, Volume 57, Number 12, March 18, 2009
Table 8. Total births, total cesarean delivery rate, percentage of live of live births at low and very low birthweight, by race and Hispanic preliminary 2007 [Data for 2007 are based on a continuous file of records received from the states. Figures for 2007
births preterm and very preterm, and percentage origin of mother: United States, final 2006 and
are based on weighted data rounded to the nearest individual]
Preterm Low birthweight
Race and origin of
Hispanic mother
Number of births Cesarean rate1 Total2 Very
2007 2006 2007
preterm3 Total4
2007 2006
Very low birthweight5
2007 2006 2007 2006 2006 2007 2006
All races and origins6 . . . . . . . . . . .
Non-Hispanic white7 . . . . . . . . . . . . Non-Hispanic black7 . . . . . . . . . . . .
American Indian or Alaska Native total7,8 . . . . . . . . . . .
Asian or Pacific Islander total7,8 . . . . . Hispanic9. . . . . . . . . . . . . . . . . . .
4,317,119
2,312,473 627,230
49,284 254,734
1,061,970
4,265,555
2,308,640 617,247
47,721 241,045
1,039,077
31.8
32.0 33.8
27.7 31.4 30.4
31.1
31.3 33.1
27.5 30.6 29.7
12.7
11.5 18.3
13.9 10.9 12.3
12.8
11.7 18.5
14.2 10.9 12.2
2.0
1.6 4.1
2.1 1.5 1.8
2.0
1.7 4.1
2.1 1.5 1.8
8.2
7.2 13.8
7.5 8.1 6.9
8.3
7.3 14.0
7.5 8.1 7.0
1.5
1.2 3.2
1.3 1.1 1.2
1.5
1.2 3.2
1.3 1.1 1.2
1All births by cesarean delivery per 100 live births. 2Less than 37 completed weeks of gestation. 3Less than 32 completed weeks of gestation. 4Less than 2,500 grams (5lb 8oz). 5Less than 1,500 grams (3lb 4oz). 6Includes origin not stated. 7Race and Hispanic origin are reported separately on birth certificates. Persons of Hispanic origin may be of any race. Race categories are consistent with the 1977 Office of Management and Budget (OMB) standards. In 2007, 27 states reported multiple-race data. The multiple-race data for these states were bridged to the single-race categories of the 1977 OMB standards for comparability with other states; see ‘‘Technical Notes.’’ Multiple-race reporting areas vary for 2006–2007; see ‘‘Technical Notes.’’ 8Data for persons of Hispanic origin are included for this race group; see ‘‘Technical Notes.’’ 9Includes all persons of Hispanic origin of any race; see ‘‘Technical Notes.’’
NOTE: For information on the relative standard errors of the data and further discussion, see reference 5.
Table 9. Percentage of preterm births: United States, final 1990, 2000, 2005, and 2006, and preliminary 2007 [Data for 2007 are based on a continuous file of records received from the states]
Year Total preterm1 Late preterm2 32–33 weeks Less than 32 weeks
2007 . . . . . . . . . . . . . . . . .2006 . . . . . . . . . . . . . . . . .2005 . . . . . . . . . . . . . . . . .2000 . . . . . . . . . . . . . . . . .1990 . . . . . . . . . . . . . . . . .
. . . . 12.66
. . . . 12.80
. . . . 12.73
. . . . 11.64
. . . . 10.61
9.03 9.14 9.09 8.22 7.30
1.59 1.62 1.60 1.49 1.40
2.04 2.04 2.03 1.93 1.92
1Preterm is less than 37 completed weeks of gestation. 2Late preterm is 34–36 completed weeks of gestation.
NOTE: For information on the relative standard errors of the data and further discussion, see reference 5.
National Vital Statistics Reports, Volume 57, Number 12, March 18, 2009 15
Table 10. Total count of records and percent completeness of preliminary file of live births: United States, each state and territory, preliminary 2007 [By place of occurrence]
Live births
Area Counts of records Percent completeness
United States1. . . . . . . . . . . . . . . . . . . . . . . . . . . . 4,325,427 98.7
Alabama . . . . . . . . . . . . . . . . . . . . . . . . . . . . . . . 63,997 100.0 Alaska . . . . . . . . . . . . . . . . . . . . . . . . . . . . . . . . 11,004 99.7 Arizona . . . . . . . . . . . . . . . . . . . . . . . . . . . . . . . . 103,811 100.0 Arkansas . . . . . . . . . . . . . . . . . . . . . . . . . . . . . . . 40,168 100.0 California. . . . . . . . . . . . . . . . . . . . . . . . . . . . . . . 567,527 100.0 Colorado . . . . . . . . . . . . . . . . . . . . . . . . . . . . . . . 71,220 100.0 Connecticut . . . . . . . . . . . . . . . . . . . . . . . . . . . . . 42,270 100.0 Delaware. . . . . . . . . . . . . . . . . . . . . . . . . . . . . . . 12,527 99.9 District of Columbia . . . . . . . . . . . . . . . . . . . . . . . . 14,822 100.0 Florida . . . . . . . . . . . . . . . . . . . . . . . . . . . . . . . . 239,396 100.0
Georgia . . . . . . . . . . . . . . . . . . . . . . . . . . . . . . . 153,190 86.4 Hawaii . . . . . . . . . . . . . . . . . . . . . . . . . . . . . . . . 19,151 100.0 Idaho . . . . . . . . . . . . . . . . . . . . . . . . . . . . . . . . . 24,436 100.0 Illinois . . . . . . . . . . . . . . . . . . . . . . . . . . . . . . . . 177,470 100.0 Indiana . . . . . . . . . . . . . . . . . . . . . . . . . . . . . . . . 90,561 100.0 Iowa . . . . . . . . . . . . . . . . . . . . . . . . . . . . . . . . . 40,988 100.0 Kansas . . . . . . . . . . . . . . . . . . . . . . . . . . . . . . . . 42,938 100.0 Kentucky . . . . . . . . . . . . . . . . . . . . . . . . . . . . . . . 57,425 100.0 Louisiana. . . . . . . . . . . . . . . . . . . . . . . . . . . . . . . 66,328 91.4 Maine. . . . . . . . . . . . . . . . . . . . . . . . . . . . . . . . . 13,974 100.0
Maryland . . . . . . . . . . . . . . . . . . . . . . . . . . . . . . . 74,941 100.0 Massachusetts . . . . . . . . . . . . . . . . . . . . . . . . . . . 78,723 100.0 Michigan . . . . . . . . . . . . . . . . . . . . . . . . . . . . . . . 124,270 80.2 Minnesota . . . . . . . . . . . . . . . . . . . . . . . . . . . . . . 73,610 100.0 Mississippi . . . . . . . . . . . . . . . . . . . . . . . . . . . . . . 45,510 100.0 Missouri . . . . . . . . . . . . . . . . . . . . . . . . . . . . . . . 82,824 100.0 Montana . . . . . . . . . . . . . . . . . . . . . . . . . . . . . . . 12,403 100.0 Nebraska. . . . . . . . . . . . . . . . . . . . . . . . . . . . . . . 27,112 100.0 Nevada. . . . . . . . . . . . . . . . . . . . . . . . . . . . . . . . 40,784 99.7 New Hampshire. . . . . . . . . . . . . . . . . . . . . . . . . . . 13,937 100.0
New Jersey . . . . . . . . . . . . . . . . . . . . . . . . . . . . . 112,881 100.0 New Mexico . . . . . . . . . . . . . . . . . . . . . . . . . . . . . 29,901 100.0 New York . . . . . . . . . . . . . . . . . . . . . . . . . . . . . . 255,441 100.0
New York excluding New York City . . . . . . . . . . . . . . 126,469 100.0 New York City . . . . . . . . . . . . . . . . . . . . . . . . . . 128,972 100.0
North Carolina. . . . . . . . . . . . . . . . . . . . . . . . . . . . 132,188 100.0 North Dakota . . . . . . . . . . . . . . . . . . . . . . . . . . . . 10,152 100.0 Ohio . . . . . . . . . . . . . . . . . . . . . . . . . . . . . . . . . 151,353 100.0 Oklahoma . . . . . . . . . . . . . . . . . . . . . . . . . . . . . . 54,168 100.0 Oregon . . . . . . . . . . . . . . . . . . . . . . . . . . . . . . . . 49,870 100.0
Pennsylvania . . . . . . . . . . . . . . . . . . . . . . . . . . . . 150,021 100.0 Rhode Island . . . . . . . . . . . . . . . . . . . . . . . . . . . . 13,191 100.0 South Carolina . . . . . . . . . . . . . . . . . . . . . . . . . . . 60,196 100.0 South Dakota . . . . . . . . . . . . . . . . . . . . . . . . . . . . 12,815 100.0 Tennessee . . . . . . . . . . . . . . . . . . . . . . . . . . . . . . 92,050 100.0 Texas . . . . . . . . . . . . . . . . . . . . . . . . . . . . . . . . . 414,177 99.4 Utah . . . . . . . . . . . . . . . . . . . . . . . . . . . . . . . . . 56,320 100.0 Vermont . . . . . . . . . . . . . . . . . . . . . . . . . . . . . . . 6,210 100.0 Virginia . . . . . . . . . . . . . . . . . . . . . . . . . . . . . . . . 107,263 100.0 Washington . . . . . . . . . . . . . . . . . . . . . . . . . . . . . 88,937 100.0
West Virginia . . . . . . . . . . . . . . . . . . . . . . . . . . . . 21,915 100.0 Wisconsin . . . . . . . . . . . . . . . . . . . . . . . . . . . . . . 71,744 100.0 Wyoming . . . . . . . . . . . . . . . . . . . . . . . . . . . . . . . 7,317 100.0
Puerto Rico . . . . . . . . . . . . . . . . . . . . . . . . . . . . . 46,748 100.0 Virgin Islands . . . . . . . . . . . . . . . . . . . . . . . . . . . . 1,779 82.5 Guam. . . . . . . . . . . . . . . . . . . . . . . . . . . . . . . . . 3,501 71.9 American Samoa . . . . . . . . . . . . . . . . . . . . . . . . . . 1,288 99.9 Northern Marianas . . . . . . . . . . . . . . . . . . . . . . . . . 1,379 100.0
1Excludes data for the territories.
NOTE: Percent completeness = Number of records in preliminary file * 100
Count of records
16 National Vital Statistics Reports, Volume 57, Number 12, March 18, 2009
Table 11. Percentage of live births to mothers under 20 years of age: and preliminary 2007 [By place of residence. Data are based on a continuous file of records received from the states]
United States, each state and territory, final 2006
Area 2007 2006
United States1. . . . . . . . . . . . . . . . . . . . . . . . . . . .
Alabama . . . . . . . . . . . . . . . . . . . . . . . . . . . . . . . Alaska . . . . . . . . . . . . . . . . . . . . . . . . . . . . . . . . Arizona . . . . . . . . . . . . . . . . . . . . . . . . . . . . . . . . Arkansas . . . . . . . . . . . . . . . . . . . . . . . . . . . . . . . California. . . . . . . . . . . . . . . . . . . . . . . . . . . . . . . Colorado . . . . . . . . . . . . . . . . . . . . . . . . . . . . . . . Connecticut . . . . . . . . . . . . . . . . . . . . . . . . . . . . . Delaware. . . . . . . . . . . . . . . . . . . . . . . . . . . . . . . District of Columbia . . . . . . . . . . . . . . . . . . . . . . . . Florida . . . . . . . . . . . . . . . . . . . . . . . . . . . . . . . .
Georgia . . . . . . . . . . . . . . . . . . . . . . . . . . . . . . . Hawaii . . . . . . . . . . . . . . . . . . . . . . . . . . . . . . . . Idaho . . . . . . . . . . . . . . . . . . . . . . . . . . . . . . . . . Illinois . . . . . . . . . . . . . . . . . . . . . . . . . . . . . . . . Indiana . . . . . . . . . . . . . . . . . . . . . . . . . . . . . . . . Iowa . . . . . . . . . . . . . . . . . . . . . . . . . . . . . . . . . Kansas . . . . . . . . . . . . . . . . . . . . . . . . . . . . . . . . Kentucky . . . . . . . . . . . . . . . . . . . . . . . . . . . . . . . Louisiana. . . . . . . . . . . . . . . . . . . . . . . . . . . . . . . Maine. . . . . . . . . . . . . . . . . . . . . . . . . . . . . . . . .
Maryland . . . . . . . . . . . . . . . . . . . . . . . . . . . . . . . Massachusetts . . . . . . . . . . . . . . . . . . . . . . . . . . . Michigan . . . . . . . . . . . . . . . . . . . . . . . . . . . . . . . Minnesota . . . . . . . . . . . . . . . . . . . . . . . . . . . . . . Mississippi . . . . . . . . . . . . . . . . . . . . . . . . . . . . . . Missouri . . . . . . . . . . . . . . . . . . . . . . . . . . . . . . . Montana . . . . . . . . . . . . . . . . . . . . . . . . . . . . . . . Nebraska. . . . . . . . . . . . . . . . . . . . . . . . . . . . . . . Nevada. . . . . . . . . . . . . . . . . . . . . . . . . . . . . . . . New Hampshire. . . . . . . . . . . . . . . . . . . . . . . . . . .
New Jersey . . . . . . . . . . . . . . . . . . . . . . . . . . . . . New Mexico . . . . . . . . . . . . . . . . . . . . . . . . . . . . . New York . . . . . . . . . . . . . . . . . . . . . . . . . . . . . . North Carolina. . . . . . . . . . . . . . . . . . . . . . . . . . . . North Dakota . . . . . . . . . . . . . . . . . . . . . . . . . . . . Ohio . . . . . . . . . . . . . . . . . . . . . . . . . . . . . . . . . Oklahoma . . . . . . . . . . . . . . . . . . . . . . . . . . . . . . Oregon . . . . . . . . . . . . . . . . . . . . . . . . . . . . . . . . Pennsylvania . . . . . . . . . . . . . . . . . . . . . . . . . . . . Rhode Island . . . . . . . . . . . . . . . . . . . . . . . . . . . .
South Carolina . . . . . . . . . . . . . . . . . . . . . . . . . . . South Dakota . . . . . . . . . . . . . . . . . . . . . . . . . . . . Tennessee . . . . . . . . . . . . . . . . . . . . . . . . . . . . . . Texas . . . . . . . . . . . . . . . . . . . . . . . . . . . . . . . . . Utah . . . . . . . . . . . . . . . . . . . . . . . . . . . . . . . . . Vermont . . . . . . . . . . . . . . . . . . . . . . . . . . . . . . . Virginia . . . . . . . . . . . . . . . . . . . . . . . . . . . . . . . . Washington . . . . . . . . . . . . . . . . . . . . . . . . . . . . . West Virginia . . . . . . . . . . . . . . . . . . . . . . . . . . . . Wisconsin . . . . . . . . . . . . . . . . . . . . . . . . . . . . . . Wyoming . . . . . . . . . . . . . . . . . . . . . . . . . . . . . . .
Puerto Rico . . . . . . . . . . . . . . . . . . . . . . . . . . . . . Virgin Islands . . . . . . . . . . . . . . . . . . . . . . . . . . . . Guam. . . . . . . . . . . . . . . . . . . . . . . . . . . . . . . . . American Samoa . . . . . . . . . . . . . . . . . . . . . . . . . . Northern Marianas . . . . . . . . . . . . . . . . . . . . . . . . .
10.5
13.6 10.1 12.7 14.6
9.5 9.7 6.9
10.4 12.1 10.9
12.2 8.5 9.1
10.1 11.2 8.7
10.3 12.9 13.7
8.4
8.9 6.4
10.1 7.1
17.1 11.4 9.7 8.6
10.8 6.6
6.4 15.7
7.0 11.7 8.0
11.0 13.9
8.9 9.3 9.7
13.4 9.8
13.2 13.5
6.9 7.6 8.6 8.4
12.5 8.7
11.8
18.3 12.8 - - -7.4 8.5
10.4
13.8 10.1 12.7 14.8
9.5 9.7 7.0
10.7 12.0 10.9
12.1 8.6 8.9
10.0 10.9
8.7 10.2 12.9 13.9
8.1
8.8 6.2 9.8 7.0
16.5 11.4 10.3
8.0 10.9
6.1
6.3 15.7
7.1 11.7 7.4
10.7 13.6
8.9 9.3 9.2
13.4 9.5
13.0 13.5
6.6 7.2 8.6 8.3
12.5 8.4
11.2
18.4 12.7 12.9
7.7 7.5
- - - Data not available. 1Excludes data for the territories.
NOTE: For information on the relative standard errors of the data and further discussion, see reference 5.
National Vital Statistics Reports, Volume 57, Number 12, March 18, 2009 17
Table 12. Percentage of live births to unmarried mothers: United States, each state and territory, final 2006 and preliminary 2007 [By place of residence. Data are based on a continuous file of records received from the states]
Area 2007 2006
United States1. . . . . . . . . . . . . . . . . . . . . . . . . . . . 39.7 38.5
Alabama . . . . . . . . . . . . . . . . . . . . . . . . . . . . . . . 38.4 36.6 Alaska . . . . . . . . . . . . . . . . . . . . . . . . . . . . . . . . 37.2 36.8 Arizona . . . . . . . . . . . . . . . . . . . . . . . . . . . . . . . . 45.2 44.0 Arkansas . . . . . . . . . . . . . . . . . . . . . . . . . . . . . . . 43.4 41.8 California. . . . . . . . . . . . . . . . . . . . . . . . . . . . . . . 38.9 37.6 Colorado . . . . . . . . . . . . . . . . . . . . . . . . . . . . . . . 25.4 27.6 Connecticut . . . . . . . . . . . . . . . . . . . . . . . . . . . . . 35.1 34.0 Delaware. . . . . . . . . . . . . . . . . . . . . . . . . . . . . . . 46.9 45.5 District of Columbia . . . . . . . . . . . . . . . . . . . . . . . . 58.5 57.6 Florida . . . . . . . . . . . . . . . . . . . . . . . . . . . . . . . . 46.1 44.4
Georgia . . . . . . . . . . . . . . . . . . . . . . . . . . . . . . . 43.3 42.4 Hawaii . . . . . . . . . . . . . . . . . . . . . . . . . . . . . . . . 36.9 36.0 Idaho . . . . . . . . . . . . . . . . . . . . . . . . . . . . . . . . . 25.5 24.3 Illinois . . . . . . . . . . . . . . . . . . . . . . . . . . . . . . . . 40.1 38.7 Indiana . . . . . . . . . . . . . . . . . . . . . . . . . . . . . . . . 42.4 41.4 Iowa . . . . . . . . . . . . . . . . . . . . . . . . . . . . . . . . . 34.3 33.8 Kansas . . . . . . . . . . . . . . . . . . . . . . . . . . . . . . . . 36.5 35.2 Kentucky . . . . . . . . . . . . . . . . . . . . . . . . . . . . . . . 39.3 35.3 Louisiana. . . . . . . . . . . . . . . . . . . . . . . . . . . . . . . 50.9 49.8 Maine. . . . . . . . . . . . . . . . . . . . . . . . . . . . . . . . . 39.1 37.1
Maryland . . . . . . . . . . . . . . . . . . . . . . . . . . . . . . . 40.9 39.7 Massachusetts . . . . . . . . . . . . . . . . . . . . . . . . . . . 33.4 32.2 Michigan . . . . . . . . . . . . . . . . . . . . . . . . . . . . . . . 39.4 38.3 Minnesota . . . . . . . . . . . . . . . . . . . . . . . . . . . . . . 32.7 31.7 Mississippi . . . . . . . . . . . . . . . . . . . . . . . . . . . . . . 53.7 52.8 Missouri . . . . . . . . . . . . . . . . . . . . . . . . . . . . . . . 40.5 39.3 Montana . . . . . . . . . . . . . . . . . . . . . . . . . . . . . . . 35.9 36.0 Nebraska. . . . . . . . . . . . . . . . . . . . . . . . . . . . . . . 33.4 32.3 Nevada. . . . . . . . . . . . . . . . . . . . . . . . . . . . . . . . 42.0 41.3 New Hampshire. . . . . . . . . . . . . . . . . . . . . . . . . . . 31.4 29.4
New Jersey . . . . . . . . . . . . . . . . . . . . . . . . . . . . . 34.4 33.0 New Mexico . . . . . . . . . . . . . . . . . . . . . . . . . . . . . 51.8 51.2 New York . . . . . . . . . . . . . . . . . . . . . . . . . . . . . . 40.7 40.0 North Carolina. . . . . . . . . . . . . . . . . . . . . . . . . . . . 41.2 40.1 North Dakota . . . . . . . . . . . . . . . . . . . . . . . . . . . . 32.6 31.7 Ohio . . . . . . . . . . . . . . . . . . . . . . . . . . . . . . . . . 42.2 40.5 Oklahoma . . . . . . . . . . . . . . . . . . . . . . . . . . . . . . 41.3 40.9 Oregon . . . . . . . . . . . . . . . . . . . . . . . . . . . . . . . . 35.1 34.3 Pennsylvania . . . . . . . . . . . . . . . . . . . . . . . . . . . . 39.7 38.3 Rhode Island . . . . . . . . . . . . . . . . . . . . . . . . . . . . 44.0 40.5
South Carolina . . . . . . . . . . . . . . . . . . . . . . . . . . . 46.6 45.6 South Dakota . . . . . . . . . . . . . . . . . . . . . . . . . . . . 38.4 37.1 Tennessee . . . . . . . . . . . . . . . . . . . . . . . . . . . . . . 42.8 41.4 Texas . . . . . . . . . . . . . . . . . . . . . . . . . . . . . . . . . 40.7 39.4 Utah . . . . . . . . . . . . . . . . . . . . . . . . . . . . . . . . . 19.6 18.8 Vermont . . . . . . . . . . . . . . . . . . . . . . . . . . . . . . . 36.6 34.5 Virginia . . . . . . . . . . . . . . . . . . . . . . . . . . . . . . . . 35.2 33.8 Washington . . . . . . . . . . . . . . . . . . . . . . . . . . . . . 33.2 31.9 West Virginia . . . . . . . . . . . . . . . . . . . . . . . . . . . . 40.3 37.9 Wisconsin . . . . . . . . . . . . . . . . . . . . . . . . . . . . . . 35.4 34.1 Wyoming . . . . . . . . . . . . . . . . . . . . . . . . . . . . . . . 34.7 33.0
Puerto Rico . . . . . . . . . . . . . . . . . . . . . . . . . . . . . 59.3 57.8 Virgin Islands . . . . . . . . . . . . . . . . . . . . . . . . . . . . 71.5 70.8 Guam. . . . . . . . . . . . . . . . . . . . . . . . . . . . . . . . . - - - 57.7 American Samoa . . . . . . . . . . . . . . . . . . . . . . . . . . 33.0 34.7 Northern Marianas . . . . . . . . . . . . . . . . . . . . . . . . . 46.1 58.8
- - - Data not available. 1Excludes data for the territories.
NOTE: For information on the relative standard errors of the data and further discussion, see reference 5.

18 National Vital Statistics Reports, Volume 57, Number 12, March 18, 2009
Table 13. Percentage low birthweight: United States, each state and territory, final 2006 and preliminary [By place of residence. Data are based on a continuous file of records received from the states. Low birthweight is less than 2,500 grams]
2007
Area 2007 2006
United States1. . . . . . . . . . . . . . . . . . . . . . . . . . . .
Alabama . . . . . . . . . . . . . . . . . . . . . . . . . . . . . . . Alaska . . . . . . . . . . . . . . . . . . . . . . . . . . . . . . . . Arizona . . . . . . . . . . . . . . . . . . . . . . . . . . . . . . . . Arkansas . . . . . . . . . . . . . . . . . . . . . . . . . . . . . . . California. . . . . . . . . . . . . . . . . . . . . . . . . . . . . . . Colorado . . . . . . . . . . . . . . . . . . . . . . . . . . . . . . . Connecticut . . . . . . . . . . . . . . . . . . . . . . . . . . . . . Delaware. . . . . . . . . . . . . . . . . . . . . . . . . . . . . . . District of Columbia . . . . . . . . . . . . . . . . . . . . . . . . Florida . . . . . . . . . . . . . . . . . . . . . . . . . . . . . . . .
Georgia . . . . . . . . . . . . . . . . . . . . . . . . . . . . . . . Hawaii . . . . . . . . . . . . . . . . . . . . . . . . . . . . . . . . Idaho . . . . . . . . . . . . . . . . . . . . . . . . . . . . . . . . . Illinois . . . . . . . . . . . . . . . . . . . . . . . . . . . . . . . . Indiana . . . . . . . . . . . . . . . . . . . . . . . . . . . . . . . . Iowa . . . . . . . . . . . . . . . . . . . . . . . . . . . . . . . . . Kansas . . . . . . . . . . . . . . . . . . . . . . . . . . . . . . . . Kentucky . . . . . . . . . . . . . . . . . . . . . . . . . . . . . . . Louisiana. . . . . . . . . . . . . . . . . . . . . . . . . . . . . . . Maine. . . . . . . . . . . . . . . . . . . . . . . . . . . . . . . . .
Maryland . . . . . . . . . . . . . . . . . . . . . . . . . . . . . . . Massachusetts . . . . . . . . . . . . . . . . . . . . . . . . . . . Michigan . . . . . . . . . . . . . . . . . . . . . . . . . . . . . . . Minnesota . . . . . . . . . . . . . . . . . . . . . . . . . . . . . . Mississippi . . . . . . . . . . . . . . . . . . . . . . . . . . . . . . Missouri . . . . . . . . . . . . . . . . . . . . . . . . . . . . . . . Montana . . . . . . . . . . . . . . . . . . . . . . . . . . . . . . . Nebraska. . . . . . . . . . . . . . . . . . . . . . . . . . . . . . . Nevada. . . . . . . . . . . . . . . . . . . . . . . . . . . . . . . . New Hampshire. . . . . . . . . . . . . . . . . . . . . . . . . . .
New Jersey . . . . . . . . . . . . . . . . . . . . . . . . . . . . . New Mexico . . . . . . . . . . . . . . . . . . . . . . . . . . . . . New York . . . . . . . . . . . . . . . . . . . . . . . . . . . . . . North Carolina. . . . . . . . . . . . . . . . . . . . . . . . . . . . North Dakota . . . . . . . . . . . . . . . . . . . . . . . . . . . . Ohio . . . . . . . . . . . . . . . . . . . . . . . . . . . . . . . . . Oklahoma . . . . . . . . . . . . . . . . . . . . . . . . . . . . . . Oregon . . . . . . . . . . . . . . . . . . . . . . . . . . . . . . . . Pennsylvania . . . . . . . . . . . . . . . . . . . . . . . . . . . . Rhode Island . . . . . . . . . . . . . . . . . . . . . . . . . . . .
South Carolina . . . . . . . . . . . . . . . . . . . . . . . . . . . South Dakota . . . . . . . . . . . . . . . . . . . . . . . . . . . . Tennessee . . . . . . . . . . . . . . . . . . . . . . . . . . . . . . Texas . . . . . . . . . . . . . . . . . . . . . . . . . . . . . . . . . Utah . . . . . . . . . . . . . . . . . . . . . . . . . . . . . . . . . Vermont . . . . . . . . . . . . . . . . . . . . . . . . . . . . . . . Virginia . . . . . . . . . . . . . . . . . . . . . . . . . . . . . . . . Washington . . . . . . . . . . . . . . . . . . . . . . . . . . . . . West Virginia . . . . . . . . . . . . . . . . . . . . . . . . . . . . Wisconsin . . . . . . . . . . . . . . . . . . . . . . . . . . . . . . Wyoming . . . . . . . . . . . . . . . . . . . . . . . . . . . . . . .
Puerto Rico . . . . . . . . . . . . . . . . . . . . . . . . . . . . . Virgin Islands . . . . . . . . . . . . . . . . . . . . . . . . . . . . Guam. . . . . . . . . . . . . . . . . . . . . . . . . . . . . . . . . American Samoa . . . . . . . . . . . . . . . . . . . . . . . . . . Northern Marianas . . . . . . . . . . . . . . . . . . . . . . . . .
8.2
10.4 5.7 7.1 9.1 6.9 9.0 8.1 9.3
11.1 8.7
9.1 8.0 6.5 8.5 8.5 6.8 6.0 9.3
11.0 6.3
9.1 7.9 8.2 6.7
12.3 7.8 7.2 7.0 8.2 6.3
8.5 8.8 8.2 9.2 6.3 8.7 8.2 6.1 8.4 8.0
10.1 7.0 9.4 8.4 6.7 6.2 8.6 6.3 9.5 7.0 9.1
12.4 12.3 - - -3.3 7.0
8.3
10.5 6.0 7.1 9.2 6.8 8.9 8.1 9.3
11.5 8.7
9.6 8.1 6.9 8.6 8.2 6.9 7.2 9.1
11.4 6.8
9.4 7.9 8.4 6.5
12.4 8.1 7.3 7.1 8.3 6.9
8.6 8.9 8.3 9.1 6.7 8.8 8.3 6.1 8.5 8.0
10.1 7.0 9.6 8.4 6.9 6.9 8.3 6.5 9.7 6.9 8.9
13.0 10.4 7.9 2.8 8.5
- - - Data not available. 1Excludes data for the territories.
NOTE: For information on the relative standard errors of the data and further discussion, see reference 5.
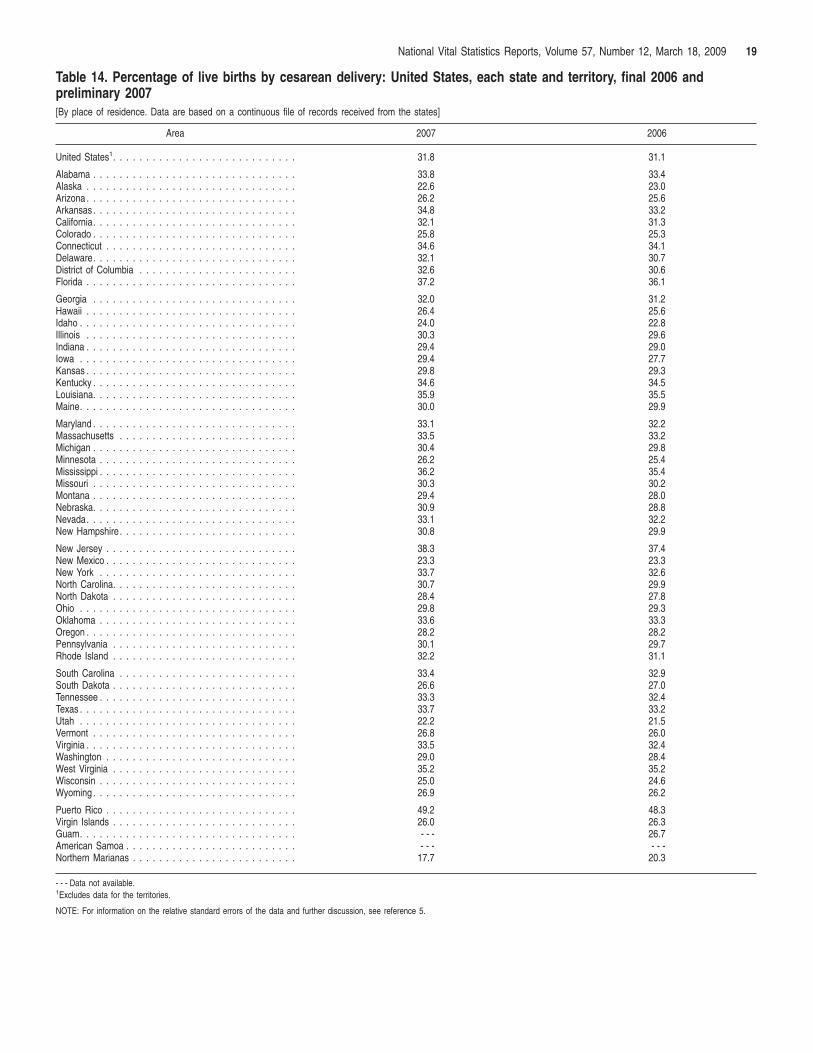
National Vital Statistics Reports, Volume 57, Number 12, March 18, 2009 19
Table 14. Percentage of live births by cesarean delivery: United States, preliminary 2007 [By place of residence. Data are based on a continuous file of records received from the states]
each state and territory, final 2006 and
Area 2007 2006
United States1. . . . . . . . . . . . . . . . . . . . . . . . . . . .
Alabama . . . . . . . . . . . . . . . . . . . . . . . . . . . . . . . Alaska . . . . . . . . . . . . . . . . . . . . . . . . . . . . . . . . Arizona . . . . . . . . . . . . . . . . . . . . . . . . . . . . . . . . Arkansas . . . . . . . . . . . . . . . . . . . . . . . . . . . . . . . California. . . . . . . . . . . . . . . . . . . . . . . . . . . . . . . Colorado . . . . . . . . . . . . . . . . . . . . . . . . . . . . . . . Connecticut . . . . . . . . . . . . . . . . . . . . . . . . . . . . . Delaware. . . . . . . . . . . . . . . . . . . . . . . . . . . . . . . District of Columbia . . . . . . . . . . . . . . . . . . . . . . . . Florida . . . . . . . . . . . . . . . . . . . . . . . . . . . . . . . .
Georgia . . . . . . . . . . . . . . . . . . . . . . . . . . . . . . . Hawaii . . . . . . . . . . . . . . . . . . . . . . . . . . . . . . . . Idaho . . . . . . . . . . . . . . . . . . . . . . . . . . . . . . . . . Illinois . . . . . . . . . . . . . . . . . . . . . . . . . . . . . . . . Indiana . . . . . . . . . . . . . . . . . . . . . . . . . . . . . . . . Iowa . . . . . . . . . . . . . . . . . . . . . . . . . . . . . . . . . Kansas . . . . . . . . . . . . . . . . . . . . . . . . . . . . . . . . Kentucky . . . . . . . . . . . . . . . . . . . . . . . . . . . . . . . Louisiana. . . . . . . . . . . . . . . . . . . . . . . . . . . . . . . Maine. . . . . . . . . . . . . . . . . . . . . . . . . . . . . . . . .
Maryland . . . . . . . . . . . . . . . . . . . . . . . . . . . . . . . Massachusetts . . . . . . . . . . . . . . . . . . . . . . . . . . . Michigan . . . . . . . . . . . . . . . . . . . . . . . . . . . . . . . Minnesota . . . . . . . . . . . . . . . . . . . . . . . . . . . . . . Mississippi . . . . . . . . . . . . . . . . . . . . . . . . . . . . . . Missouri . . . . . . . . . . . . . . . . . . . . . . . . . . . . . . . Montana . . . . . . . . . . . . . . . . . . . . . . . . . . . . . . . Nebraska. . . . . . . . . . . . . . . . . . . . . . . . . . . . . . . Nevada. . . . . . . . . . . . . . . . . . . . . . . . . . . . . . . . New Hampshire. . . . . . . . . . . . . . . . . . . . . . . . . . .
New Jersey . . . . . . . . . . . . . . . . . . . . . . . . . . . . . New Mexico . . . . . . . . . . . . . . . . . . . . . . . . . . . . . New York . . . . . . . . . . . . . . . . . . . . . . . . . . . . . . North Carolina. . . . . . . . . . . . . . . . . . . . . . . . . . . . North Dakota . . . . . . . . . . . . . . . . . . . . . . . . . . . . Ohio . . . . . . . . . . . . . . . . . . . . . . . . . . . . . . . . . Oklahoma . . . . . . . . . . . . . . . . . . . . . . . . . . . . . . Oregon . . . . . . . . . . . . . . . . . . . . . . . . . . . . . . . . Pennsylvania . . . . . . . . . . . . . . . . . . . . . . . . . . . . Rhode Island . . . . . . . . . . . . . . . . . . . . . . . . . . . .
South Carolina . . . . . . . . . . . . . . . . . . . . . . . . . . . South Dakota . . . . . . . . . . . . . . . . . . . . . . . . . . . . Tennessee . . . . . . . . . . . . . . . . . . . . . . . . . . . . . . Texas . . . . . . . . . . . . . . . . . . . . . . . . . . . . . . . . . Utah . . . . . . . . . . . . . . . . . . . . . . . . . . . . . . . . . Vermont . . . . . . . . . . . . . . . . . . . . . . . . . . . . . . . Virginia . . . . . . . . . . . . . . . . . . . . . . . . . . . . . . . . Washington . . . . . . . . . . . . . . . . . . . . . . . . . . . . . West Virginia . . . . . . . . . . . . . . . . . . . . . . . . . . . . Wisconsin . . . . . . . . . . . . . . . . . . . . . . . . . . . . . . Wyoming . . . . . . . . . . . . . . . . . . . . . . . . . . . . . . .
Puerto Rico . . . . . . . . . . . . . . . . . . . . . . . . . . . . . Virgin Islands . . . . . . . . . . . . . . . . . . . . . . . . . . . . Guam. . . . . . . . . . . . . . . . . . . . . . . . . . . . . . . . . American Samoa . . . . . . . . . . . . . . . . . . . . . . . . . . Northern Marianas . . . . . . . . . . . . . . . . . . . . . . . . .
31.8
33.8 22.6 26.2 34.8 32.1 25.8 34.6 32.1 32.6 37.2
32.0 26.4 24.0 30.3 29.4 29.4 29.8 34.6 35.9 30.0
33.1 33.5 30.4 26.2 36.2 30.3 29.4 30.9 33.1 30.8
38.3 23.3 33.7 30.7 28.4 29.8 33.6 28.2 30.1 32.2
33.4 26.6 33.3 33.7 22.2 26.8 33.5 29.0 35.2 25.0 26.9
49.2 26.0 - - -- - -
17.7
31.1
33.4 23.0 25.6 33.2 31.3 25.3 34.1 30.7 30.6 36.1
31.2 25.6 22.8 29.6 29.0 27.7 29.3 34.5 35.5 29.9
32.2 33.2 29.8 25.4 35.4 30.2 28.0 28.8 32.2 29.9
37.4 23.3 32.6 29.9 27.8 29.3 33.3 28.2 29.7 31.1
32.9 27.0 32.4 33.2 21.5 26.0 32.4 28.4 35.2 24.6 26.2
48.3 26.3 26.7 - - -
20.3
- - - Data not available. 1Excludes data for the territories.
NOTE: For information on the relative standard errors of the data and further discussion, see reference 5.
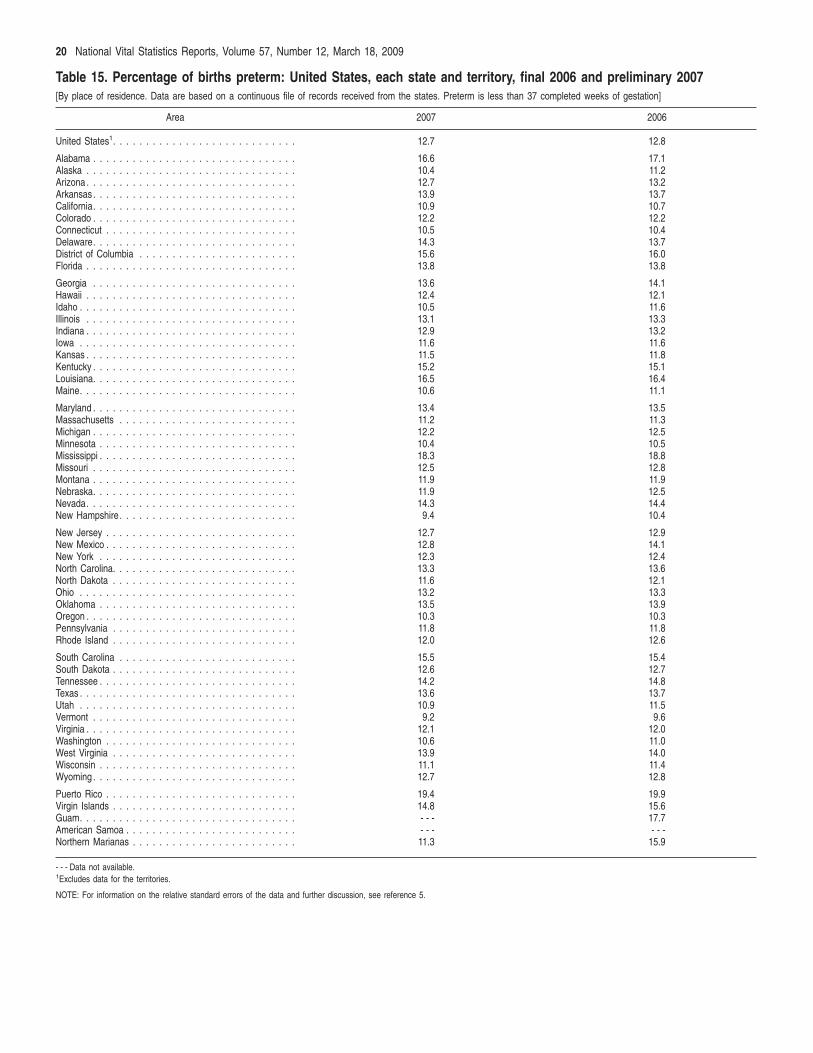
20 National Vital Statistics Reports, Volume 57, Number 12, March 18, 2009
Table 15. Percentage of births preterm: United States, each state and territory, final 2006 and preliminary [By place of residence. Data are based on a continuous file of records received from the states. Preterm is less than 37 completed weeks of gestation]
2007
Area 2007 2006
United States1. . . . . . . . . . . . . . . . . . . . . . . . . . . .
Alabama . . . . . . . . . . . . . . . . . . . . . . . . . . . . . . . Alaska . . . . . . . . . . . . . . . . . . . . . . . . . . . . . . . . Arizona . . . . . . . . . . . . . . . . . . . . . . . . . . . . . . . . Arkansas . . . . . . . . . . . . . . . . . . . . . . . . . . . . . . . California. . . . . . . . . . . . . . . . . . . . . . . . . . . . . . . Colorado . . . . . . . . . . . . . . . . . . . . . . . . . . . . . . . Connecticut . . . . . . . . . . . . . . . . . . . . . . . . . . . . . Delaware. . . . . . . . . . . . . . . . . . . . . . . . . . . . . . . District of Columbia . . . . . . . . . . . . . . . . . . . . . . . . Florida . . . . . . . . . . . . . . . . . . . . . . . . . . . . . . . .
Georgia . . . . . . . . . . . . . . . . . . . . . . . . . . . . . . . Hawaii . . . . . . . . . . . . . . . . . . . . . . . . . . . . . . . . Idaho . . . . . . . . . . . . . . . . . . . . . . . . . . . . . . . . . Illinois . . . . . . . . . . . . . . . . . . . . . . . . . . . . . . . . Indiana . . . . . . . . . . . . . . . . . . . . . . . . . . . . . . . . Iowa . . . . . . . . . . . . . . . . . . . . . . . . . . . . . . . . . Kansas . . . . . . . . . . . . . . . . . . . . . . . . . . . . . . . . Kentucky . . . . . . . . . . . . . . . . . . . . . . . . . . . . . . . Louisiana. . . . . . . . . . . . . . . . . . . . . . . . . . . . . . . Maine. . . . . . . . . . . . . . . . . . . . . . . . . . . . . . . . .
Maryland . . . . . . . . . . . . . . . . . . . . . . . . . . . . . . . Massachusetts . . . . . . . . . . . . . . . . . . . . . . . . . . . Michigan . . . . . . . . . . . . . . . . . . . . . . . . . . . . . . . Minnesota . . . . . . . . . . . . . . . . . . . . . . . . . . . . . . Mississippi . . . . . . . . . . . . . . . . . . . . . . . . . . . . . . Missouri . . . . . . . . . . . . . . . . . . . . . . . . . . . . . . . Montana . . . . . . . . . . . . . . . . . . . . . . . . . . . . . . . Nebraska. . . . . . . . . . . . . . . . . . . . . . . . . . . . . . . Nevada. . . . . . . . . . . . . . . . . . . . . . . . . . . . . . . . New Hampshire. . . . . . . . . . . . . . . . . . . . . . . . . . .
New Jersey . . . . . . . . . . . . . . . . . . . . . . . . . . . . . New Mexico . . . . . . . . . . . . . . . . . . . . . . . . . . . . . New York . . . . . . . . . . . . . . . . . . . . . . . . . . . . . . North Carolina. . . . . . . . . . . . . . . . . . . . . . . . . . . . North Dakota . . . . . . . . . . . . . . . . . . . . . . . . . . . . Ohio . . . . . . . . . . . . . . . . . . . . . . . . . . . . . . . . . Oklahoma . . . . . . . . . . . . . . . . . . . . . . . . . . . . . . Oregon . . . . . . . . . . . . . . . . . . . . . . . . . . . . . . . . Pennsylvania . . . . . . . . . . . . . . . . . . . . . . . . . . . . Rhode Island . . . . . . . . . . . . . . . . . . . . . . . . . . . .
South Carolina . . . . . . . . . . . . . . . . . . . . . . . . . . . South Dakota . . . . . . . . . . . . . . . . . . . . . . . . . . . . Tennessee . . . . . . . . . . . . . . . . . . . . . . . . . . . . . . Texas . . . . . . . . . . . . . . . . . . . . . . . . . . . . . . . . . Utah . . . . . . . . . . . . . . . . . . . . . . . . . . . . . . . . . Vermont . . . . . . . . . . . . . . . . . . . . . . . . . . . . . . . Virginia . . . . . . . . . . . . . . . . . . . . . . . . . . . . . . . . Washington . . . . . . . . . . . . . . . . . . . . . . . . . . . . . West Virginia . . . . . . . . . . . . . . . . . . . . . . . . . . . . Wisconsin . . . . . . . . . . . . . . . . . . . . . . . . . . . . . . Wyoming . . . . . . . . . . . . . . . . . . . . . . . . . . . . . . .
Puerto Rico . . . . . . . . . . . . . . . . . . . . . . . . . . . . . Virgin Islands . . . . . . . . . . . . . . . . . . . . . . . . . . . . Guam. . . . . . . . . . . . . . . . . . . . . . . . . . . . . . . . . American Samoa . . . . . . . . . . . . . . . . . . . . . . . . . . Northern Marianas . . . . . . . . . . . . . . . . . . . . . . . . .
12.7
16.6 10.4 12.7 13.9 10.9 12.2 10.5 14.3 15.6 13.8
13.6 12.4 10.5 13.1 12.9 11.6 11.5 15.2 16.5 10.6
13.4 11.2 12.2 10.4 18.3 12.5 11.9 11.9 14.3 9.4
12.7 12.8 12.3 13.3 11.6 13.2 13.5 10.3 11.8 12.0
15.5 12.6 14.2 13.6 10.9
9.2 12.1 10.6 13.9 11.1 12.7
19.4 14.8 - - -- - -11.3
12.8
17.1 11.2 13.2 13.7 10.7 12.2 10.4 13.7 16.0 13.8
14.1 12.1 11.6 13.3 13.2 11.6 11.8 15.1 16.4 11.1
13.5 11.3 12.5 10.5 18.8 12.8 11.9 12.5 14.4 10.4
12.9 14.1 12.4 13.6 12.1 13.3 13.9 10.3 11.8 12.6
15.4 12.7 14.8 13.7 11.5 9.6
12.0 11.0 14.0 11.4 12.8
19.9 15.6 17.7 - - -
15.9
- - - Data not available. 1Excludes data for the territories.
NOTE: For information on the relative standard errors of the data and further discussion, see reference 5.
ational Vital Statistics Reports, Volume 57, Number 12, March 18, 2009 21
NTechnical Notes
Nature and sources of data Preliminary data for 2007 are based on a substantial proportion
of births for that year (98.7 percent, see Table 10). For 47 of the 50 states and the District of Columbia, over 99 percent of births are included; for Louisiana, over 90 percent are included. The percent completeness for two states, Georgia and Michigan, was lower, at 86.4 and 80.2, respectively, but considered complete enough to provide reliable state-specific estimates. For information and further discussion on the criteria of reliable estimates, see Births: Preliminary Data for 2005 (5). The data for 2007 are based on a continuous receipt and processing of statistical records through July 17, 2008, by the Centers for Disease Control and Prevention’s (CDC) National Center for Health Statistics (NCHS). NCHS receives the data from the states’ vital registration systems through the Vital Statistics Cooperative Program. In this report, U.S. totals include only events occurring within the 50 states and the District of Columbia. Data for Puerto Rico, the Virgin Islands, American Samoa, and Northern Marianas are included in tables showing data by state, but are not included in U.S. totals (see Tables 6 and 11–15). Data for Guam were not available as of release of the 2007 preliminary file and are not included in this report. Detailed information on reporting completeness and imputation procedures may be found in the ‘‘Detailed technical notes— 2006—natality’’ (6).
To produce the preliminary estimates shown in this report, records in the file were weighted using independent control counts of all 2007 births by state of occurrence. Detailed information on weighting and the reliability of estimates also may be found elsewhere (5).
1989 and 2003 U.S. Standard Certificates of Live Birth
This report includes selected 2006 data on items which are collected on both the 1989 Revision of the U.S. Standard Certificate of Live Birth (unrevised) and 2003 Revision of the U.S. Standard Certificate of Live Birth (revised). The 2003 revision is described in detail elsewhere (1, 7–9). Twenty-two states (California, Colorado, Delaware, Florida, Idaho, Indiana, Iowa, Kansas, Kentucky, Nebraska, New Hampshire, New York state (excluding New York City), North Dakota, Ohio, Pennsylvania, South Carolina, South Dakota, Tennessee, Texas, Vermont, Washington, and Wyoming) and Puerto Rico implemented the revised birth certificate as of January 1, 2007. Two additional states, Georgia and Michigan, implemented the revised birth certificate in 2007, but after January 1 for Georgia, and for most, but not all, facilities for Michigan. These 24 revised states represent 60 percent of all births in 2007.
Data items exclusive to either the 1989 or the 2003 birth certificate revision are not shown in this report. A forthcoming report will present selected data exclusive to the 2003 revision from the final data file for 2007.
Hispanic origin and race
Hispanic origin
Hispanic origin and race are reported separately on the birth certificate. Data shown by race (i.e., AIAN and API) include persons of Hispanic or non-Hispanic origin, and data for Hispanic origin include all persons of Hispanic origin of any race. Data for non-Hispanic persons are shown separately according to the race of the mother because there are substantial differences in fertility and maternal and infant health characteristics between Hispanic and non-Hispanic white women. Items asking for the Hispanic origin of the mother have been included on the birth certificates of all states and the District of Columbia, the Virgin Islands, and Guam since 1993, and on the birth certificate of Puerto Rico starting in 2005 (1). American Samoa and Northern Marianas do not collect this information.
Single, multiple, and ‘bridged’ race
The 2003 revision of the U.S. Standard Certificate of Live Birth allows the reporting of more than one race (multiple races) for each parent (7) in accordance with the revised standards issued by the Office of Management and Budget (OMB) in 1997 (10,11). Information on this change is presented in several recent reports (1,11,12).
In 2007, 27 states reported multiple-race data: California, Colorado, Delaware, Florida, Georgia (for births occurring after January 1 only), Idaho, Indiana, Iowa, Kansas, Kentucky, Michigan (for births at most facilities), Nebraska, New Hampshire, New York state (excluding New York City), North Dakota, Ohio, Pennsylvania, South Carolina, South Dakota, Tennessee, Texas, Vermont, Washington, and Wyoming, which used the 2003 revision of the U.S. Standard Certificate of Live Birth, as well as Hawaii, Minnesota, and Utah, which used the 1989 revision of the U.S. Standard Certificate of Live Birth. Puerto Rico, which revised its birth certificate in 2005, reported race according to the 1989 revision of the U.S. Standard Certificate of Live Birth. The 27 states accounted for 63 percent of births in the United States in 2007. Data from the vital records of the remaining 23 states, New York City, and the District of Columbia are based on the 1989 revision of the U.S. Standard Certificate of Live Birth that follows the 1977 OMB standard, allowing only a single race to be reported (10–12).
To provide uniformity and comparability of the data during the transition period, before all or most of the data are available in the new multiple-race format, it was necessary to ‘‘bridge’’ the responses of those who reported more than one race (multiple race) to a single race. The bridging procedure for multiple-race mothers and fathers is based on the procedure used to bridge the multiple-race population estimates (see ‘‘Population denominators’’) (13,14). Information detailing the processing and tabulation of data by race is presented elsewhere (1). A recent report describes multiple-race birth data for 2003 (15).
Change in imputation of race for Hispanic women
Starting with the 2006 data year for data on the revised birth certificate, the race edit was modified slightly to take into account
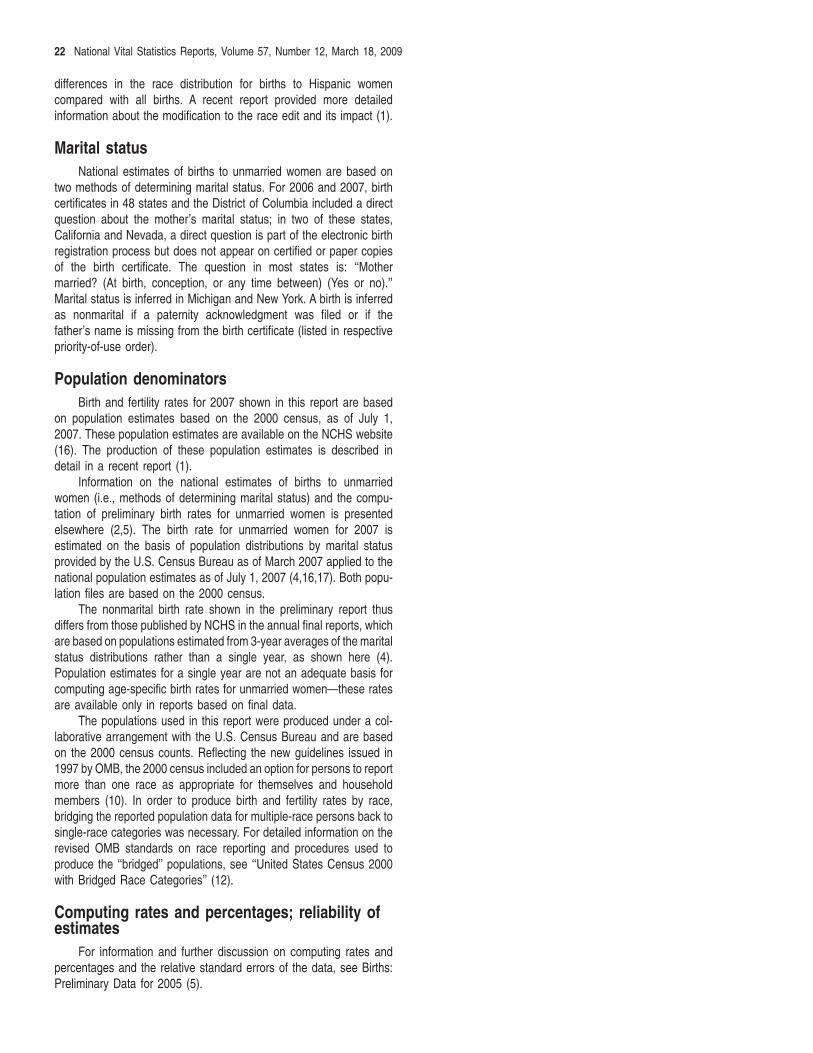
22 National Vital Statistics Reports, Volume 57, Number 12, March 18, 2009
differences in the race distribution for births to Hispanic women compared with all births. A recent report provided more detailed information about the modification to the race edit and its impact (1).
Marital statusNational estimates of births to unmarried women are based on
two methods of determining marital status. For 2006 and 2007, birth certificates in 48 states and the District of Columbia included a direct question about the mother’s marital status; in two of these states, California and Nevada, a direct question is part of the electronic birth registration process but does not appear on certified or paper copies of the birth certificate. The question in most states is: ‘‘Mother married? (At birth, conception, or any time between) (Yes or no).’’ Marital status is inferred in Michigan and New York. A birth is inferred as nonmarital if a paternity acknowledgment was filed or if the father’s name is missing from the birth certificate (listed in respective priority-of-use order).
Population denominators Birth and fertility rates for 2007 shown in this report are based
on population estimates based on the 2000 census, as of July 1, 2007. These population estimates are available on the NCHS website (16). The production of these population estimates is described in detail in a recent report (1).
Information on the national estimates of births to unmarried women (i.e., methods of determining marital status) and the computation of preliminary birth rates for unmarried women is presented elsewhere (2,5). The birth rate for unmarried women for 2007 is estimated on the basis of population distributions by marital status provided by the U.S. Census Bureau as of March 2007 applied to the national population estimates as of July 1, 2007 (4,16,17). Both population files are based on the 2000 census.
The nonmarital birth rate shown in the preliminary report thus differs from those published by NCHS in the annual final reports, which are based on populations estimated from 3-year averages of the marital status distributions rather than a single year, as shown here (4). Population estimates for a single year are not an adequate basis for computing age-specific birth rates for unmarried women—these rates are available only in reports based on final data.
The populations used in this report were produced under a collaborative arrangement with the U.S. Census Bureau and are based on the 2000 census counts. Reflecting the new guidelines issued in 1997 by OMB, the 2000 census included an option for persons to report more than one race as appropriate for themselves and household members (10). In order to produce birth and fertility rates by race, bridging the reported population data for multiple-race persons back to single-race categories was necessary. For detailed information on the revised OMB standards on race reporting and procedures used to produce the ‘‘bridged’’ populations, see ‘‘United States Census 2000 with Bridged Race Categories’’ (12).
Computing rates and percentages; reliability ofestimates
For information and further discussion on computing rates and percentages and the relative standard errors of the data, see Births: Preliminary Data for 2005 (5).
National Vital Statistics Reports, Volume 57, Number 12, March 18, 2009 23
Contents
Abstract. . . . . . . . . . . . . . . . . . . . . . . . . . . . . . . . . . . . . . . 1 Introduction . . . . . . . . . . . . . . . . . . . . . . . . . . . . . . . . . . . . 1 Results . . . . . . . . . . . . . . . . . . . . . . . . . . . . . . . . . . . . . . . 2
Births and birth rates . . . . . . . . . . . . . . . . . . . . . . . . . . . . 2 Maternal and infant health birth characteristics . . . . . . . . . . . 3
References. . . . . . . . . . . . . . . . . . . . . . . . . . . . . . . . . . . . . 4 List of Detailed Tables . . . . . . . . . . . . . . . . . . . . . . . . . . . . . 5 Technical Notes. . . . . . . . . . . . . . . . . . . . . . . . . . . . . . . . . 21
Acknowledgments
This report was prepared under the general direction of Charles J. Rothwell, Director of the Division of Vital Statistics (DVS) and Stephanie J. Ventura, Chief of the Reproductive Statistics Branch (RSB). Nicholas F. Pace, Chief of the Systems, Programming, and Statistical Resources Branch (SPSRB), and Steve Steimel, Candace Cosgrove, Annie Liu, Jordan Sacks, Manju Sharma, and Bonita Gross provided computer programming support and statistical tables. Yashodhara Patel of RSB also provided statistical tables. Steve Steimel and Candace Cosgrove of SPSRB prepared the natality file. Michelle J.K. Osterman of RSB provided content review. Staff of the Data Acquisition and Evaluation Branch carried out quality evaluation and acceptance procedures for the state data files on which this report is based. The Registration Methods staff of DVS consulted with state vital statistics offices regarding the collection of birth certificate data. This report was edited by Jane Sudol and Demarius V. Miller, CDC/CCHIS/NCHM/Division of Creative Services, Writer-Editor Services Branch, and typeset by Jacqueline M. Davis of CDC/CCHIS/NCHM/Division of Creative Services. Graphics were produced by Sarah Hinkle, CDC/CCHIS/NCHM/Division of Creative Services.
Copyright information All material appearing in this report is in the public domain and may be reproduced or copied without permission; citation as to source, however, is appreciated.
Suggested citation
Hamilton BE, Martin JA, Ventura SJ. Births: Preliminary data for 2007. National vital statistics reports, Web release; vol 57 no 12. Hyattsville, MD: National Center for Health Statistics. Released March 18, 2009.
National Center for Health Statistics Director
Edward J. Sondik, Ph.D.
Acting Co-Deputy Directors Jennifer H. Madans, Ph.D.
Michael H. Sadagursky
Division of Vital Statistics
Director, Charles J. Rothwell
CS200781B (3/2009) DHHS Publication No. (PHS) 2009–1120