Embed Size (px)
Citation preview
Selected preterm birth rates for 2014 in the text and in uly 26, 2016
National Vital Statistics Reports Volume 65, Number 3 June 2, 2016
have been corrected Tables 5, 6, and I-2--J
Births: Preliminary Data for 2015 Brady E. Hamilton, Ph.D., Joyce A. Martin, M.P.H., and Michelle J.K. Osterman, M.H.S., Division of Vital Statistics
Abstract
Objectives—This report presents preliminary 2015 data on U.S. births. Births are shown by age and race and Hispanic origin of mother. Data on marital status, cesarean delivery, preterm births, and low birthweight are also presented.
CA
NE
MT ND
SD ID
NV UT
AZ NM
OK
WY
CO KS
AK
HI
WA
OR
TX
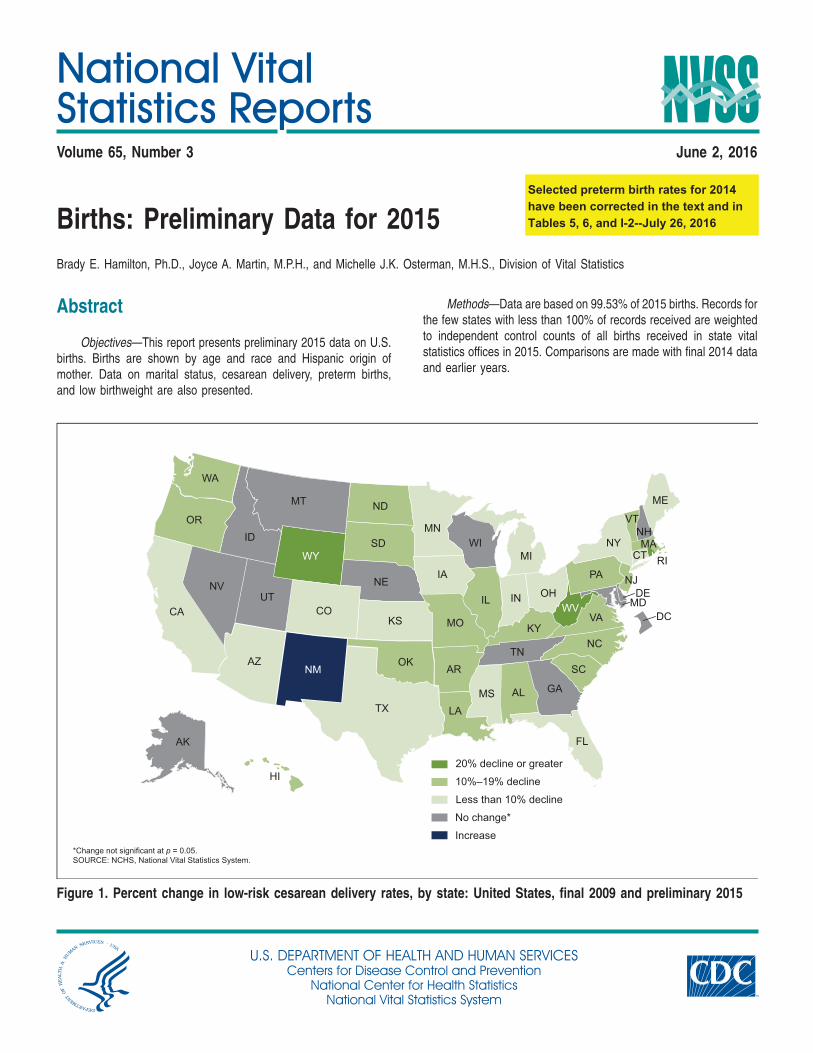
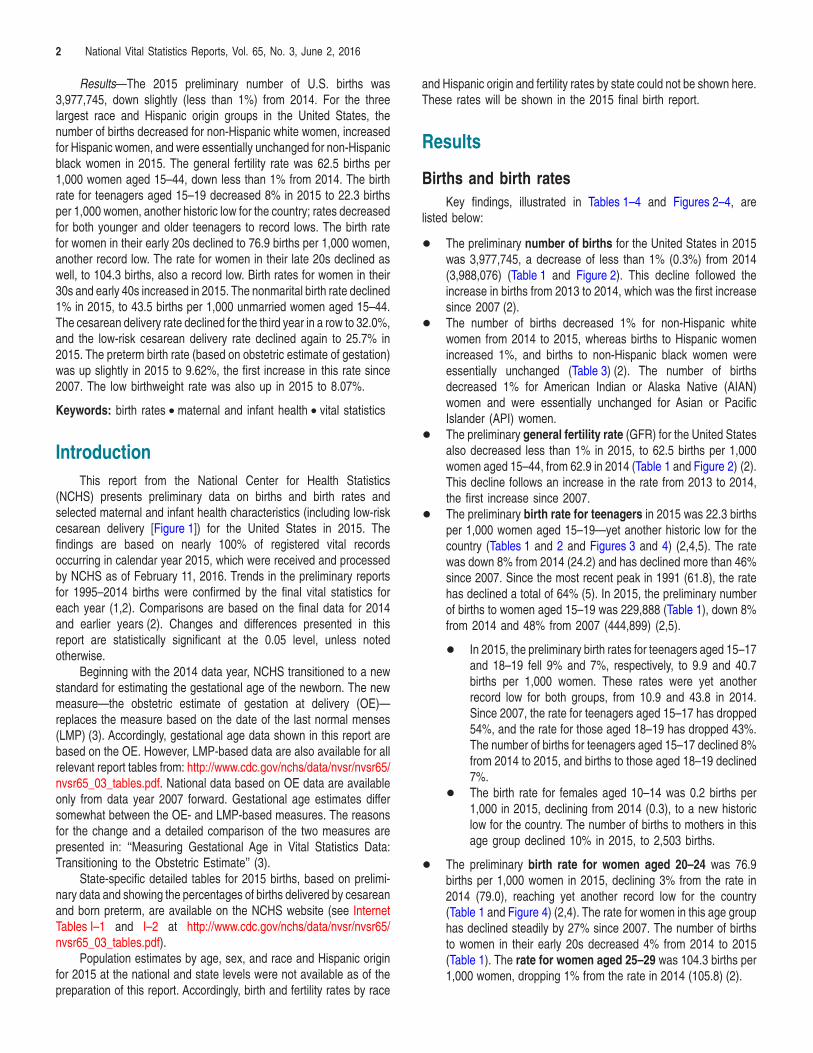
*Change not significant at p = 0.05. SOURCE: NCHS, National Vital Statistics System.
Figure 1. Percent change in low-risk cesarean delivery rates, b
U.S. DEPARTMENT OF HEALTCenters for Disease Co
National Center foNational Vital Sta
Methods—Data are based on 99.53% of 2015 births. Records for the few states with less than 100% of records received are weighted to independent control counts of all births received in state vitalstatistics offices in 2015. Comparisons are made with final 2014 data and earlier years.
IA
MN
MI
VT
ME
IN
KY
IL OH
PA
WV
SC TN
AR
MS AL
VA
NJ
NC
GA
FL
NY
MD
NH MA
DE
CT RI
MO
LA
DC
WI
10%–19% decline
No change*
Increase
20% decline or greater
Less than 10% decline
y state: United States, final 2009 and preliminary 2015
H AND HUMAN SERVICES ntrol and Preventionr Health Statisticstistics System
2 National Vital Statistics Reports, Vol. 65, No. 3, June 2, 2016
1,000 women, dropping 1% from the rate in 2014 (105.8) (2).
Results—The 2015 preliminary number of U.S. births was 3,977,745, down slightly (less than 1%) from 2014. For the three largest race and Hispanic origin groups in the United States, the number of births decreased for non-Hispanic white women, increased for Hispanic women, and were essentially unchanged for non-Hispanic black women in 2015. The general fertility rate was 62.5 births per 1,000 women aged 15–44, down less than 1% from 2014. The birth rate for teenagers aged 15–19 decreased 8% in 2015 to 22.3 births per 1,000 women, another historic low for the country; rates decreased for both younger and older teenagers to record lows. The birth rate for women in their early 20s declined to 76.9 births per 1,000 women, another record low. The rate for women in their late 20s declined as well, to 104.3 births, also a record low. Birth rates for women in their 30s and early 40s increased in 2015. The nonmarital birth rate declined 1% in 2015, to 43.5 births per 1,000 unmarried women aged 15–44. The cesarean delivery rate declined for the third year in a row to 32.0%, and the low-risk cesarean delivery rate declined again to 25.7% in 2015. The preterm birth rate (based on obstetric estimate of gestation) was up slightly in 2015 to 9.62%, the first increase in this rate since 2007. The low birthweight rate was also up in 2015 to 8.07%.
Keywords: birth rates • maternal and infant health • vital statistics
Introduction This report from the National Center for Health Statistics
(NCHS) presents preliminary data on births and birth rates and selected maternal and infant health characteristics (including low-risk cesarean delivery [Figure 1]) for the United States in 2015. The findings are based on nearly 100% of registered vital records occurring in calendar year 2015, which were received and processed by NCHS as of February 11, 2016. Trends in the preliminary reports for 1995–2014 births were confirmed by the final vital statistics for each year (1,2). Comparisons are based on the final data for 2014 and earlier years (2). Changes and differences presented in this report are statistically significant at the 0.05 level, unless noted otherwise.
Beginning with the 2014 data year, NCHS transitioned to a new standard for estimating the gestational age of the newborn. The new measure—the obstetric estimate of gestation at delivery (OE)— replaces the measure based on the date of the last normal menses (LMP) (3). Accordingly, gestational age data shown in this report are based on the OE. However, LMP-based data are also available for all relevant report tables from: http://www.cdc.gov/nchs/data/nvsr/nvsr65/ nvsr65_03_tables.pdf. National data based on OE data are available only from data year 2007 forward. Gestational age estimates differ somewhat between the OE- and LMP-based measures. The reasons for the change and a detailed comparison of the two measures are presented in: ‘‘Measuring Gestational Age in Vital Statistics Data: Transitioning to the Obstetric Estimate’’ (3).
State-specific detailed tables for 2015 births, based on preliminary data and showing the percentages of births delivered by cesarean and born preterm, are available on the NCHS website (see Internet Tables I–1 and I–2 at http://www.cdc.gov/nchs/data/nvsr/nvsr65/ nvsr65_03_tables.pdf).
Population estimates by age, sex, and race and Hispanic origin for 2015 at the national and state levels were not available as of the preparation of this report. Accordingly, birth and fertility rates by race
and Hispanic origin and fertility rates by state could not be shown here. These rates will be shown in the 2015 final birth report.
Results
Births and birth rates Key findings, illustrated in Tables 1–4 and Figures 2–4, are
listed below:
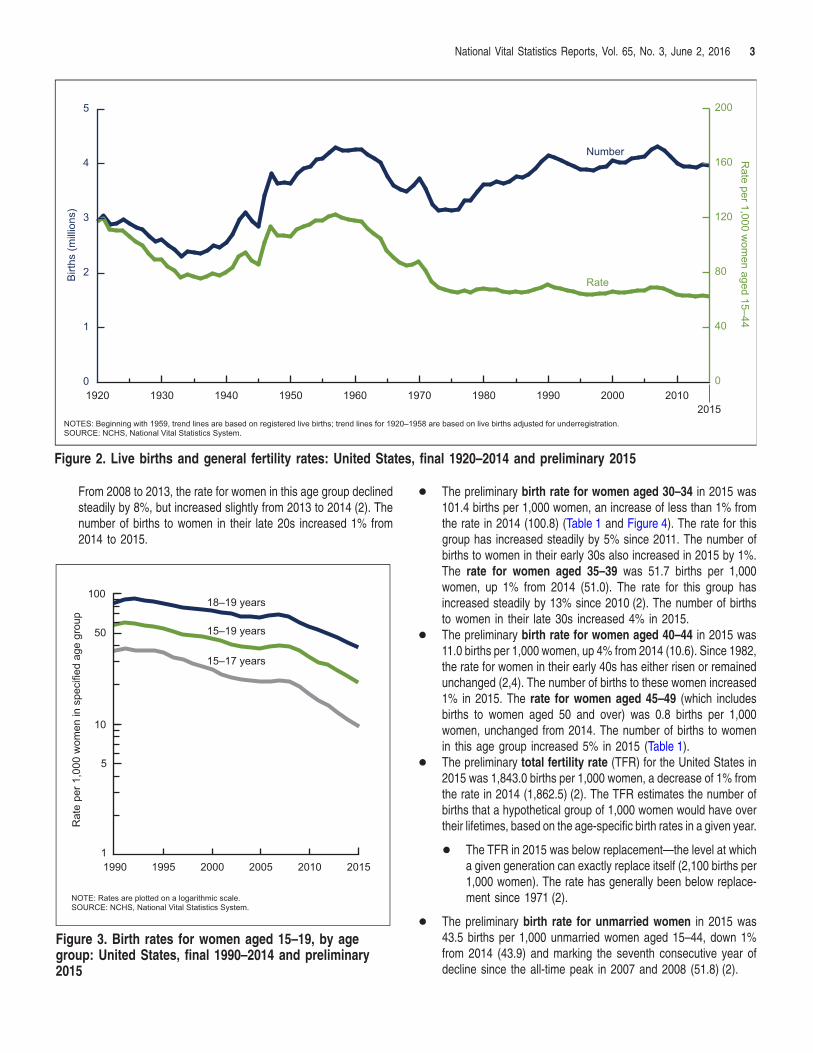
+ The preliminary number of births for the United States in 2015 was 3,977,745, a decrease of less than 1% (0.3%) from 2014 (3,988,076) (Table 1 and Figure 2). This decline followed the increase in births from 2013 to 2014, which was the first increase since 2007 (2).
+ The number of births decreased 1% for non-Hispanic white women from 2014 to 2015, whereas births to Hispanic women increased 1%, and births to non-Hispanic black women were essentially unchanged (Table 3) (2). The number of births decreased 1% for American Indian or Alaska Native (AIAN) women and were essentially unchanged for Asian or Pacific Islander (API) women.
+ The preliminary general fertility rate (GFR) for the United States also decreased less than 1% in 2015, to 62.5 births per 1,000 women aged 15–44, from 62.9 in 2014 (Table 1 and Figure 2) (2). This decline follows an increase in the rate from 2013 to 2014, the first increase since 2007.
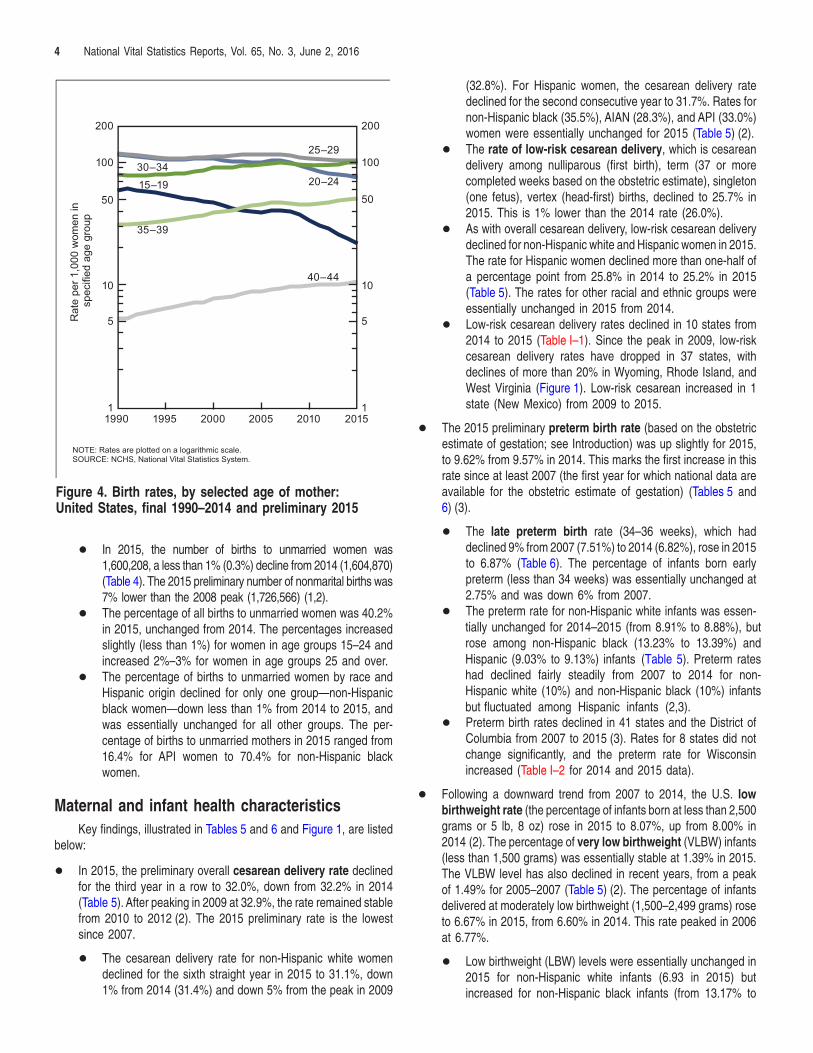
+ The preliminary birth rate for teenagers in 2015 was 22.3 births per 1,000 women aged 15–19—yet another historic low for the country (Tables 1 and 2 and Figures 3 and 4) (2,4,5). The rate was down 8% from 2014 (24.2) and has declined more than 46% since 2007. Since the most recent peak in 1991 (61.8), the rate has declined a total of 64% (5). In 2015, the preliminary number of births to women aged 15–19 was 229,888 (Table 1), down 8% from 2014 and 48% from 2007 (444,899) (2,5).
+ In 2015, the preliminary birth rates for teenagers aged 15–17 and 18–19 fell 9% and 7%, respectively, to 9.9 and 40.7 births per 1,000 women. These rates were yet another record low for both groups, from 10.9 and 43.8 in 2014. Since 2007, the rate for teenagers aged 15–17 has dropped 54%, and the rate for those aged 18–19 has dropped 43%. The number of births for teenagers aged 15–17 declined 8% from 2014 to 2015, and births to those aged 18–19 declined 7%.
+ The birth rate for females aged 10–14 was 0.2 births per 1,000 in 2015, declining from 2014 (0.3), to a new historic low for the country. The number of births to mothers in this age group declined 10% in 2015, to 2,503 births.
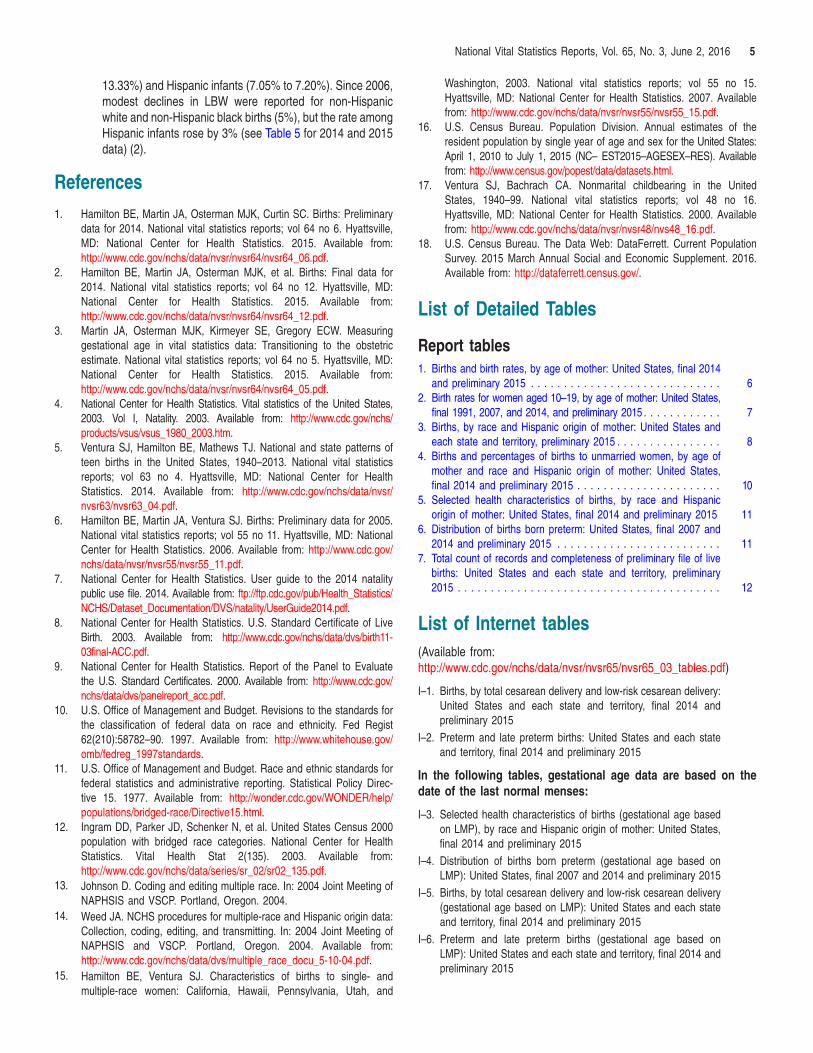
+ The preliminary birth rate for women aged 20–24 was 76.9 births per 1,000 women in 2015, declining 3% from the rate in 2014 (79.0), reaching yet another record low for the country (Table 1 and Figure 4) (2,4). The rate for women in this age group has declined steadily by 27% since 2007. The number of births to women in their early 20s decreased 4% from 2014 to 2015 (Table 1). The rate for women aged 25–29 was 104.3 births per
3 National Vital Statistics Reports, Vol. 65, No. 3, June 2, 2016
0
1
2
3
4
5
2015 2010200019901980197019601950194019301920
0
40
80
120
160
200
Birt
hs (m
illio
ns)
Rate per 1,000 w
omen aged 15–44
NOTES: Beginning with 1959, trend lines are based on registered live births; trend lines for 1920–1958 are based on live births adjusted for underregistration. SOURCE: NCHS, National Vital Statistics System.
Rate
Number
Figure 2. Live births and general fertility rates: United States, final 1920–2014 and preliminary 2015
From 2008 to 2013, the rate for women in this age group declined steadily by 8%, but increased slightly from 2013 to 2014 (2). The number of births to women in their late 20s increased 1% from 2014 to 2015.
Rat
e pe
r 1,0
00 w
omen
in s
peci
fied
age
grou
p
18–19 years
15–19 years
15–17 years
1990 1995 2000 2005 2010 2015 1
10
50
5
100
NOTE: Rates are plotted on a logarithmic scale. SOURCE: NCHS, National Vital Statistics System.
Figure 3. Birth rates for women aged 15–19, by age group: United States, final 1990–2014 and preliminary 2015
+ The preliminary birth rate for women aged 30–34 in 2015 was 101.4 births per 1,000 women, an increase of less than 1% from the rate in 2014 (100.8) (Table 1 and Figure 4). The rate for this group has increased steadily by 5% since 2011. The number of births to women in their early 30s also increased in 2015 by 1%. The rate for women aged 35–39 was 51.7 births per 1,000 women, up 1% from 2014 (51.0). The rate for this group has increased steadily by 13% since 2010 (2). The number of births to women in their late 30s increased 4% in 2015.
+ The preliminary birth rate for women aged 40–44 in 2015 was 11.0 births per 1,000 women, up 4% from 2014 (10.6). Since 1982, the rate for women in their early 40s has either risen or remained unchanged (2,4). The number of births to these women increased 1% in 2015. The rate for women aged 45–49 (which includes births to women aged 50 and over) was 0.8 births per 1,000 women, unchanged from 2014. The number of births to women in this age group increased 5% in 2015 (Table 1).
+ The preliminary total fertility rate (TFR) for the United States in 2015 was 1,843.0 births per 1,000 women, a decrease of 1% from the rate in 2014 (1,862.5) (2). The TFR estimates the number of births that a hypothetical group of 1,000 women would have over their lifetimes, based on the age-specific birth rates in a given year.
+ The TFR in 2015 was below replacement—the level at which a given generation can exactly replace itself (2,100 births per 1,000 women). The rate has generally been below replacement since 1971 (2).
+ The preliminary birth rate for unmarried women in 2015 was 43.5 births per 1,000 unmarried women aged 15–44, down 1% from 2014 (43.9) and marking the seventh consecutive year of decline since the all-time peak in 2007 and 2008 (51.8) (2).
4 National Vital Statistics Reports, Vol. 65, No. 3, June 2, 2016
Rat
e pe
r 1,0
00 w
omen
insp
ecifi
ed a
ge g
roup
1990 1995 2000 2005 2010 2015
15–19 20–24
25–29 30–34
35–39
40–44
1
10
50
5
100
200
1
10
100
50
5
200
NOTE: Rates are plotted on a logarithmic scale. SOURCE: NCHS, National Vital Statistics System.
Figure 4. Birth rates, by selected age of mother: United States, final 1990–2014 and preliminary 2015
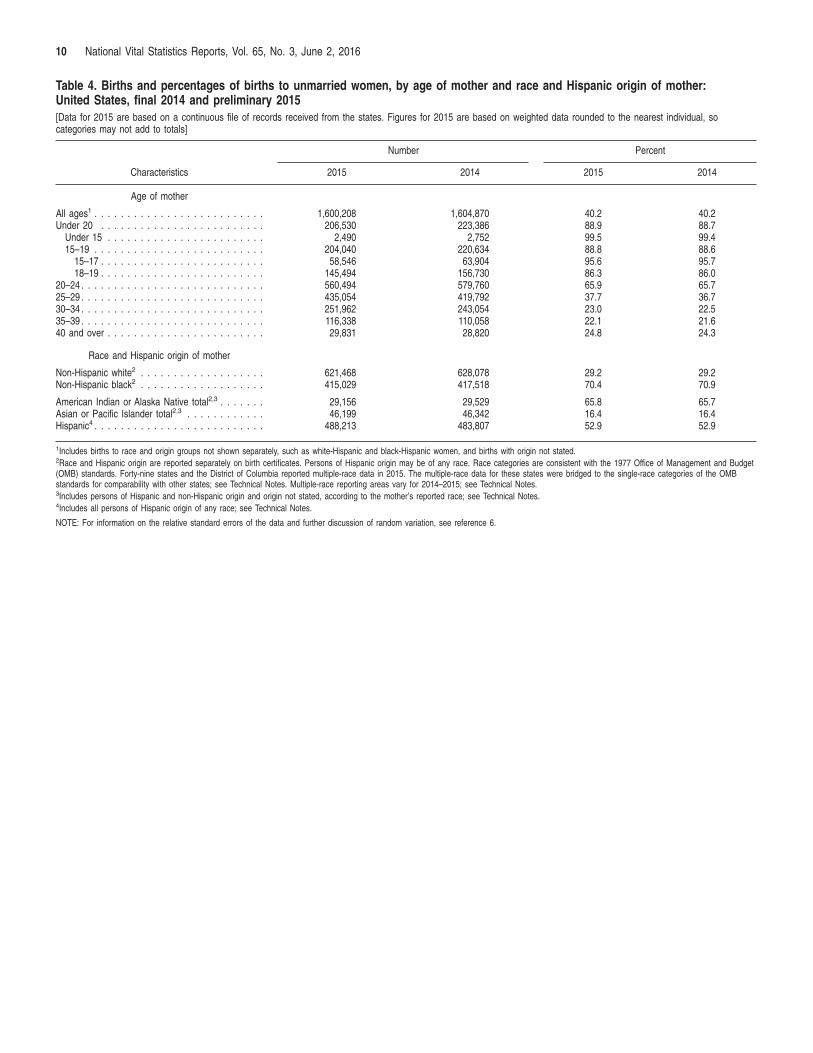
+ In 2015, the number of births to unmarried women was 1,600,208, a less than 1% (0.3%) decline from 2014 (1,604,870) (Table 4). The 2015 preliminary number of nonmarital births was 7% lower than the 2008 peak (1,726,566) (1,2).
+ The percentage of all births to unmarried women was 40.2% in 2015, unchanged from 2014. The percentages increased slightly (less than 1%) for women in age groups 15–24 and increased 2%–3% for women in age groups 25 and over.
+ The percentage of births to unmarried women by race and Hispanic origin declined for only one group—non-Hispanic black women—down less than 1% from 2014 to 2015, and was essentially unchanged for all other groups. The percentage of births to unmarried mothers in 2015 ranged from 16.4% for API women to 70.4% for non-Hispanic black women.
Maternal and infant health characteristics Key findings, illustrated in Tables 5 and 6 and Figure 1, are listed
below:
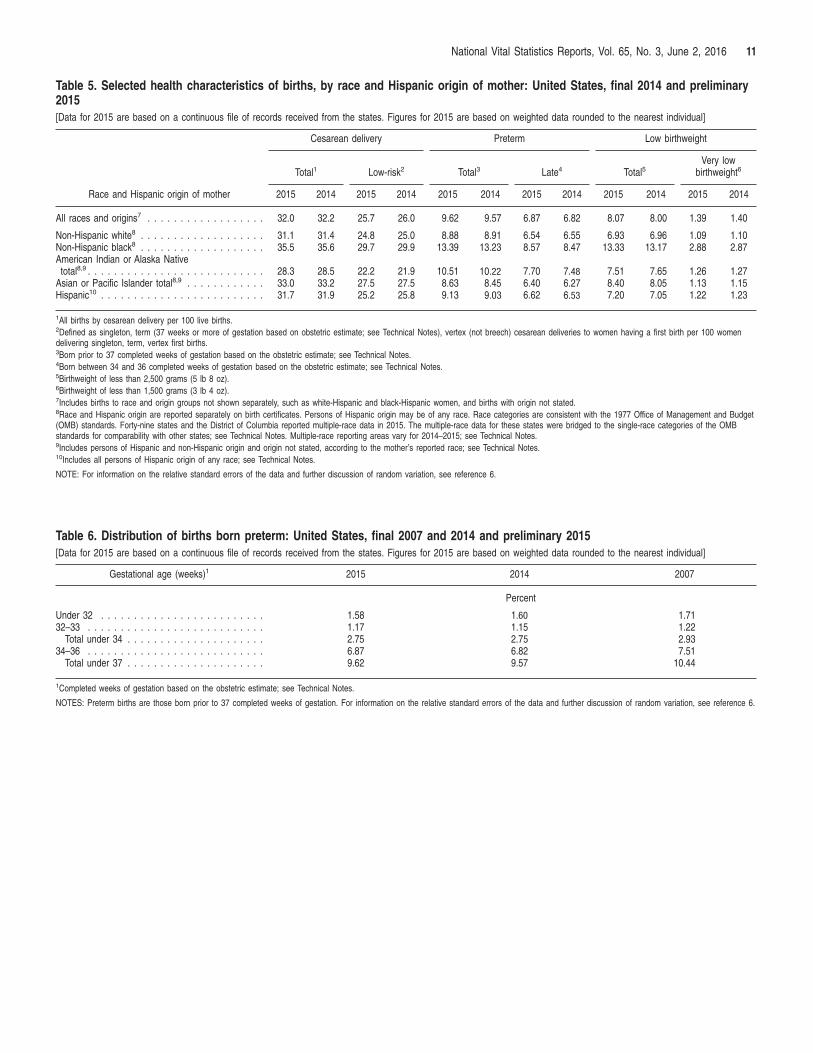
+ In 2015, the preliminary overall cesarean delivery rate declined for the third year in a row to 32.0%, down from 32.2% in 2014 (Table 5). After peaking in 2009 at 32.9%, the rate remained stable from 2010 to 2012 (2). The 2015 preliminary rate is the lowest since 2007.
+ The cesarean delivery rate for non-Hispanic white women declined for the sixth straight year in 2015 to 31.1%, down 1% from 2014 (31.4%) and down 5% from the peak in 2009
(32.8%). For Hispanic women, the cesarean delivery rate declined for the second consecutive year to 31.7%. Rates for non-Hispanic black (35.5%), AIAN (28.3%), and API (33.0%) women were essentially unchanged for 2015 (Table 5) (2).
+ The rate of low-risk cesarean delivery, which is cesarean delivery among nulliparous (first birth), term (37 or more completed weeks based on the obstetric estimate), singleton (one fetus), vertex (head-first) births, declined to 25.7% in 2015. This is 1% lower than the 2014 rate (26.0%).
+ As with overall cesarean delivery, low-risk cesarean delivery declined for non-Hispanic white and Hispanic women in 2015. The rate for Hispanic women declined more than one-half of a percentage point from 25.8% in 2014 to 25.2% in 2015 (Table 5). The rates for other racial and ethnic groups were essentially unchanged in 2015 from 2014.
+ Low-risk cesarean delivery rates declined in 10 states from 2014 to 2015 (Table I–1). Since the peak in 2009, low-risk cesarean delivery rates have dropped in 37 states, with declines of more than 20% in Wyoming, Rhode Island, and West Virginia (Figure 1). Low-risk cesarean increased in 1 state (New Mexico) from 2009 to 2015.
+ The 2015 preliminary preterm birth rate (based on the obstetric estimate of gestation; see Introduction) was up slightly for 2015, to 9.62% from 9.57% in 2014. This marks the first increase in this rate since at least 2007 (the first year for which national data are available for the obstetric estimate of gestation) (Tables 5 and 6) (3).
+ The late preterm birth rate (34–36 weeks), which had declined 9% from 2007 (7.51%) to 2014 (6.82%), rose in 2015 to 6.87% (Table 6). The percentage of infants born early preterm (less than 34 weeks) was essentially unchanged at 2.75% and was down 6% from 2007.
+ The preterm rate for non-Hispanic white infants was essentially unchanged for 2014–2015 (from 8.91% to 8.88%), but rose among non-Hispanic black (13.23% to 13.39%) and Hispanic (9.03% to 9.13%) infants (Table 5). Preterm rates had declined fairly steadily from 2007 to 2014 for non-Hispanic white (10%) and non-Hispanic black (10%) infants but fluctuated among Hispanic infants (2,3).
+ Preterm birth rates declined in 41 states and the District of Columbia from 2007 to 2015 (3). Rates for 8 states did not change significantly, and the preterm rate for Wisconsin increased (Table I–2 for 2014 and 2015 data).
+ Following a downward trend from 2007 to 2014, the U.S. low birthweight rate (the percentage of infants born at less than 2,500 grams or 5 lb, 8 oz) rose in 2015 to 8.07%, up from 8.00% in 2014 (2). The percentage of very low birthweight (VLBW) infants (less than 1,500 grams) was essentially stable at 1.39% in 2015. The VLBW level has also declined in recent years, from a peak of 1.49% for 2005–2007 (Table 5) (2). The percentage of infants delivered at moderately low birthweight (1,500–2,499 grams) rose to 6.67% in 2015, from 6.60% in 2014. This rate peaked in 2006 at 6.77%.
+ Low birthweight (LBW) levels were essentially unchanged in 2015 for non-Hispanic white infants (6.93 in 2015) but increased for non-Hispanic black infants (from 13.17% to
5 National Vital Statistics Reports, Vol. 65, No. 3, June 2, 2016
13.33%) and Hispanic infants (7.05% to 7.20%). Since 2006, modest declines in LBW were reported for non-Hispanic white and non-Hispanic black births (5%), but the rate among Hispanic infants rose by 3% (see Table 5 for 2014 and 2015 data) (2).
References
1. Hamilton BE, Martin JA, Osterman MJK, Curtin SC. Births: Preliminary data for 2014. National vital statistics reports; vol 64 no 6. Hyattsville, MD: National Center for Health Statistics. 2015. Available from: http://www.cdc.gov/nchs/data/nvsr/nvsr64/nvsr64_06.pdf.
2. Hamilton BE, Martin JA, Osterman MJK, et al. Births: Final data for 2014. National vital statistics reports; vol 64 no 12. Hyattsville, MD: National Center for Health Statistics. 2015. Available from: http://www.cdc.gov/nchs/data/nvsr/nvsr64/nvsr64_12.pdf.
3. Martin JA, Osterman MJK, Kirmeyer SE, Gregory ECW. Measuring gestational age in vital statistics data: Transitioning to the obstetric estimate. National vital statistics reports; vol 64 no 5. Hyattsville, MD: National Center for Health Statistics. 2015. Available from: http://www.cdc.gov/nchs/data/nvsr/nvsr64/nvsr64_05.pdf.
4. National Center for Health Statistics. Vital statistics of the United States, 2003. Vol I, Natality. 2003. Available from: http://www.cdc.gov/nchs/ products/vsus/vsus_1980_2003.htm.
5. Ventura SJ, Hamilton BE, Mathews TJ. National and state patterns of teen births in the United States, 1940–2013. National vital statistics reports; vol 63 no 4. Hyattsville, MD: National Center for Health Statistics. 2014. Available from: http://www.cdc.gov/nchs/data/nvsr/ nvsr63/nvsr63_04.pdf.
6. Hamilton BE, Martin JA, Ventura SJ. Births: Preliminary data for 2005. National vital statistics reports; vol 55 no 11. Hyattsville, MD: National Center for Health Statistics. 2006. Available from: http://www.cdc.gov/ nchs/data/nvsr/nvsr55/nvsr55_11.pdf.
7. National Center for Health Statistics. User guide to the 2014 natality public use file. 2014. Available from: ftp://ftp.cdc.gov/pub/Health_Statistics/ NCHS/Dataset_Documentation/DVS/natality/UserGuide2014.pdf.
8. National Center for Health Statistics. U.S. Standard Certificate of Live Birth. 2003. Available from: http://www.cdc.gov/nchs/data/dvs/birth1103final-ACC.pdf.
9. National Center for Health Statistics. Report of the Panel to Evaluate the U.S. Standard Certificates. 2000. Available from: http://www.cdc.gov/ nchs/data/dvs/panelreport_acc.pdf.
10. U.S. Office of Management and Budget. Revisions to the standards for the classification of federal data on race and ethnicity. Fed Regist 62(210):58782–90. 1997. Available from: http://www.whitehouse.gov/ omb/fedreg_1997standards.
11. U.S. Office of Management and Budget. Race and ethnic standards for federal statistics and administrative reporting. Statistical Policy Directive 15. 1977. Available from: http://wonder.cdc.gov/WONDER/help/ populations/bridged-race/Directive15.html.
12. Ingram DD, Parker JD, Schenker N, et al. United States Census 2000 population with bridged race categories. National Center for Health Statistics. Vital Health Stat 2(135). 2003. Available from: http://www.cdc.gov/nchs/data/series/sr_02/sr02_135.pdf.
13. Johnson D. Coding and editing multiple race. In: 2004 Joint Meeting of NAPHSIS and VSCP. Portland, Oregon. 2004.
14. Weed JA. NCHS procedures for multiple-race and Hispanic origin data: Collection, coding, editing, and transmitting. In: 2004 Joint Meeting of NAPHSIS and VSCP. Portland, Oregon. 2004. Available from: http://www.cdc.gov/nchs/data/dvs/multiple_race_docu_5-10-04.pdf.
15. Hamilton BE, Ventura SJ. Characteristics of births to single- and multiple-race women: California, Hawaii, Pennsylvania, Utah, and
Washington, 2003. National vital statistics reports; vol 55 no 15. Hyattsville, MD: National Center for Health Statistics. 2007. Available from: http://www.cdc.gov/nchs/data/nvsr/nvsr55/nvsr55_15.pdf.
16. U.S. Census Bureau. Population Division. Annual estimates of the resident population by single year of age and sex for the United States: April 1, 2010 to July 1, 2015 (NC– EST2015–AGESEX–RES). Available from: http://www.census.gov/popest/data/datasets.html.
17. Ventura SJ, Bachrach CA. Nonmarital childbearing in the United States, 1940–99. National vital statistics reports; vol 48 no 16. Hyattsville, MD: National Center for Health Statistics. 2000. Available from: http://www.cdc.gov/nchs/data/nvsr/nvsr48/nvs48_16.pdf.
18. U.S. Census Bureau. The Data Web: DataFerrett. Current Population Survey. 2015 March Annual Social and Economic Supplement. 2016. Available from: http://dataferrett.census.gov/.
List of Detailed Tables
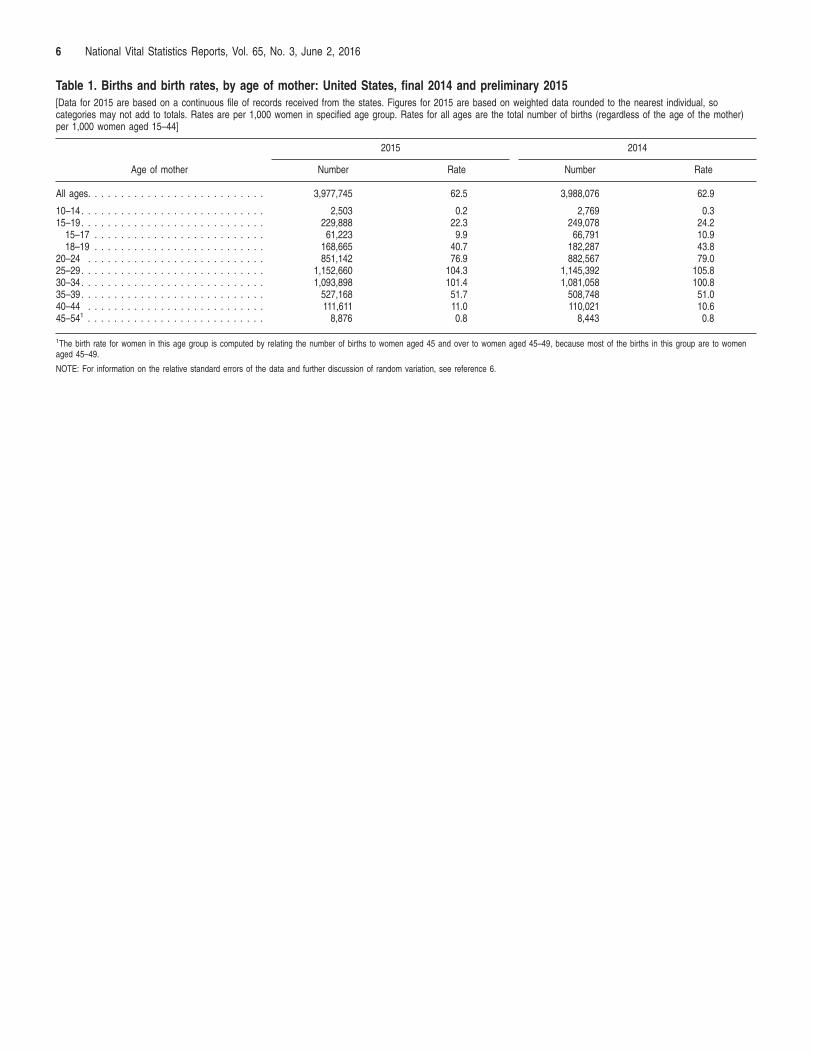
Report tables 1. Births and birth rates, by age of mother: United States, final 2014
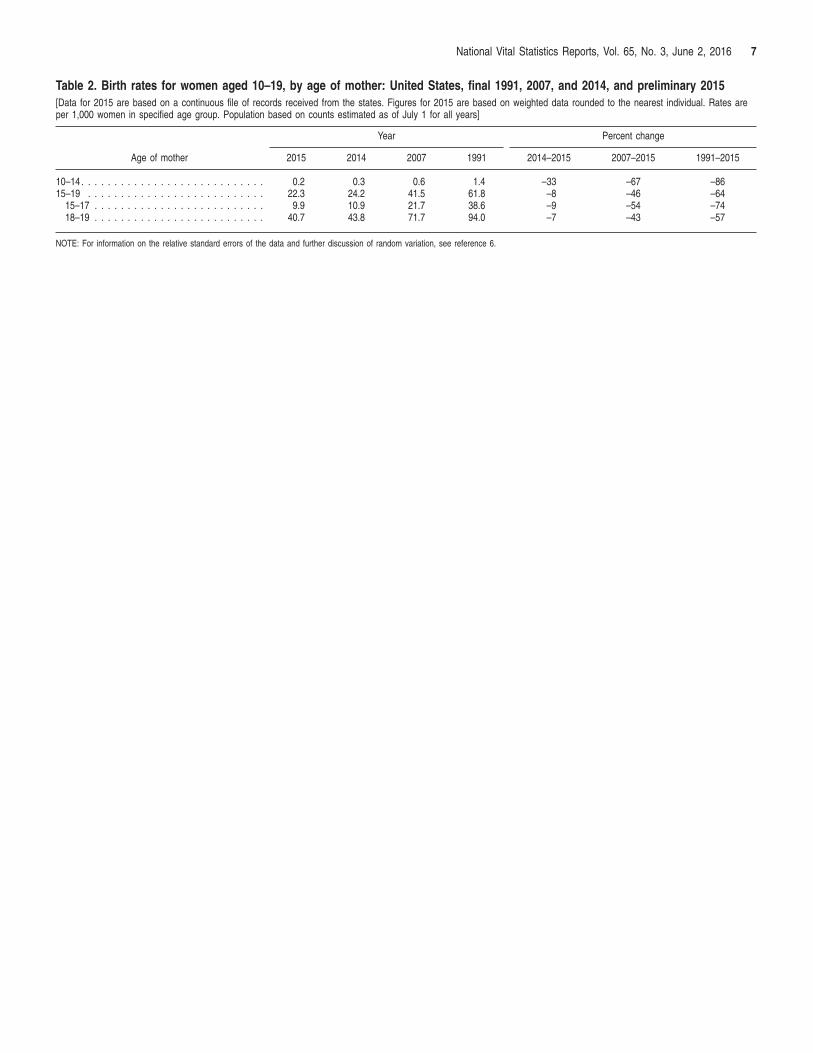
and preliminary 2015 . . . . . . . . . . . . . . . . . . . . . . . . . . . . . 6 2. Birth rates for women aged 10–19, by age of mother: United States,
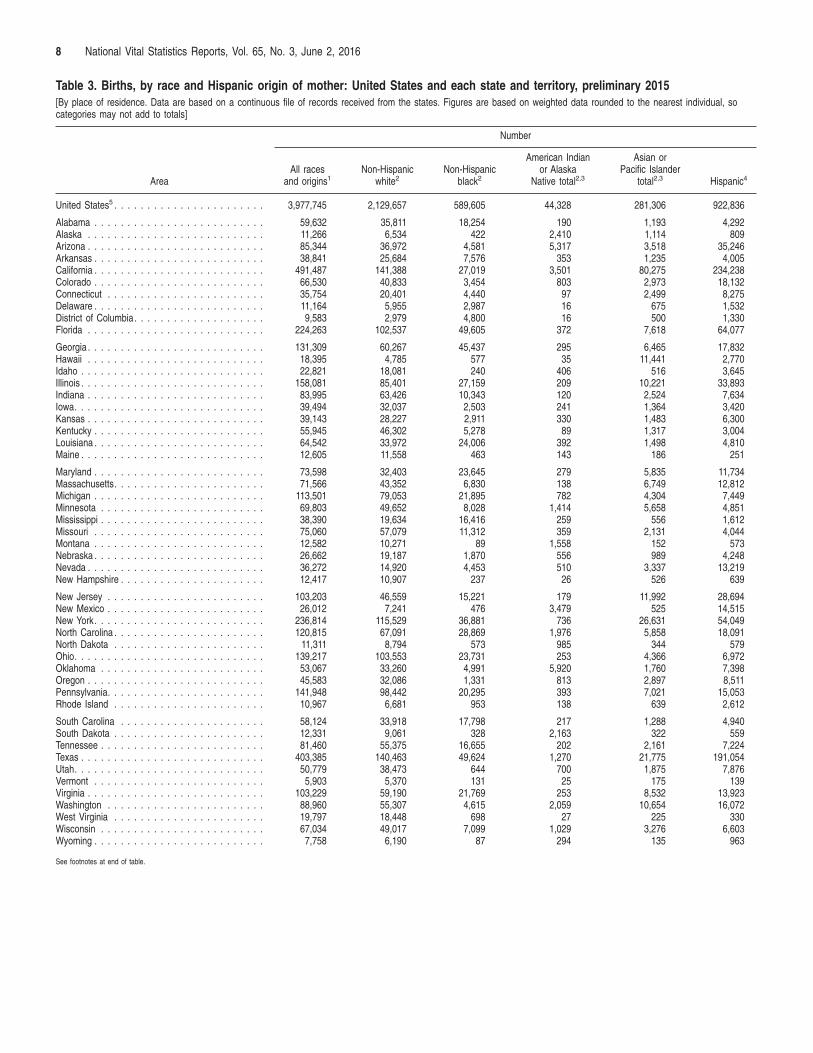
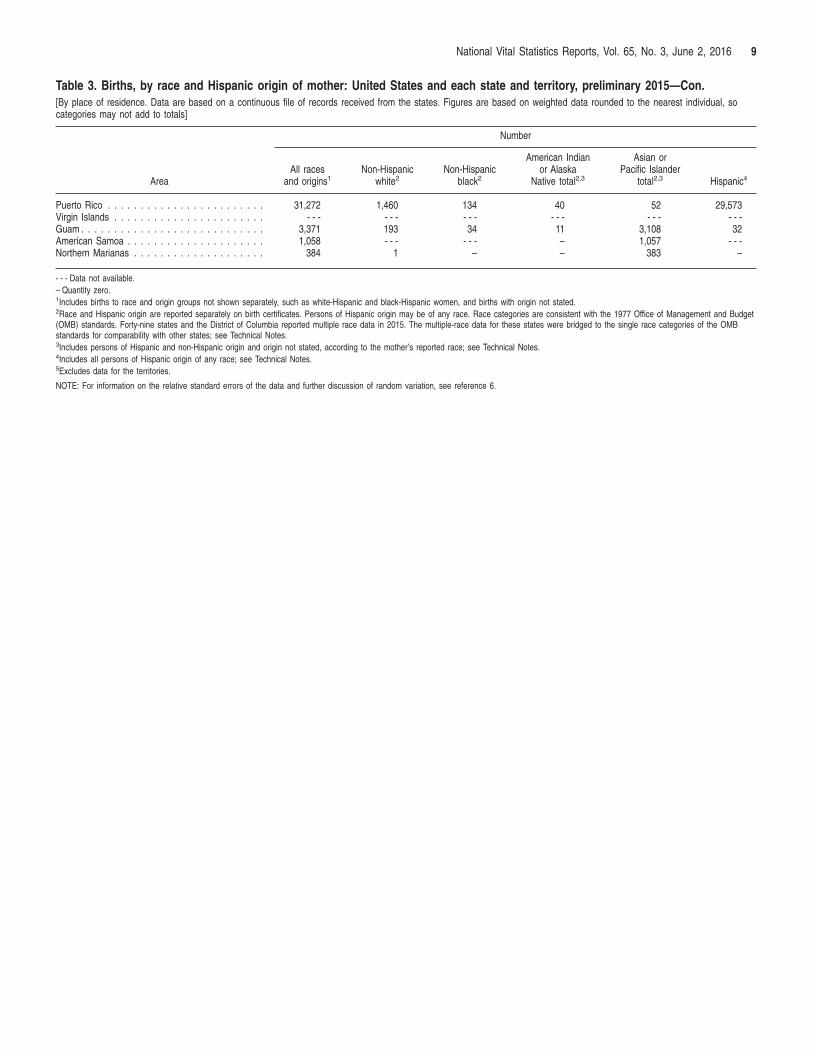
final 1991, 2007, and 2014, and preliminary 2015 . . . . . . . . . . . . 7 3. Births, by race and Hispanic origin of mother: United States and
each state and territory, preliminary 2015 . . . . . . . . . . . . . . . . 8 4. Births and percentages of births to unmarried women, by age of
mother and race and Hispanic origin of mother: United States, final 2014 and preliminary 2015 . . . . . . . . . . . . . . . . . . . . . . 10
5. Selected health characteristics of births, by race and Hispanic origin of mother: United States, final 2014 and preliminary 2015 11
6. Distribution of births born preterm: United States, final 2007 and 2014 and preliminary 2015 . . . . . . . . . . . . . . . . . . . . . . . . . 11
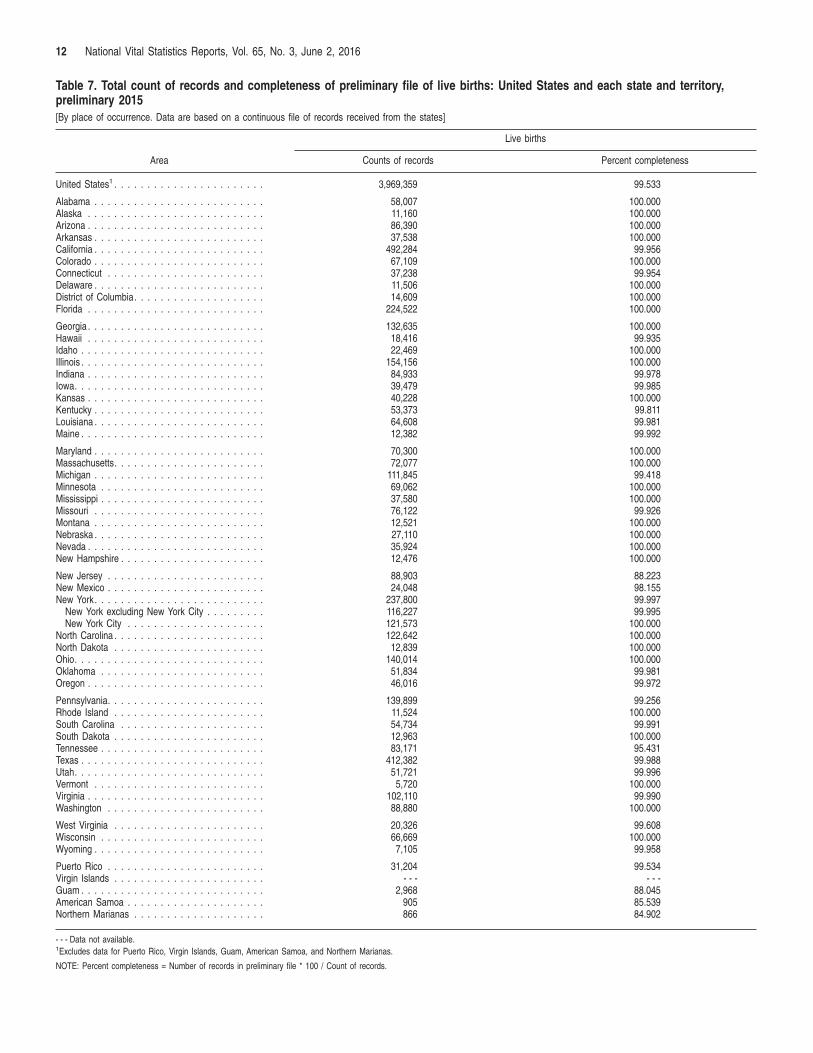
7. Total count of records and completeness of preliminary file of live births: United States and each state and territory, preliminary 2015 . . . . . . . . . . . . . . . . . . . . . . . . . . . . . . . . . . . . . . . . 12
List of Internet tables (Available from: http://www.cdc.gov/nchs/data/nvsr/nvsr65/nvsr65_03_tables.pdf)
I–1. Births, by total cesarean delivery and low-risk cesarean delivery: United States and each state and territory, final 2014 and preliminary 2015
I–2. Preterm and late preterm births: United States and each state and territory, final 2014 and preliminary 2015
In the following tables, gestational age data are based on the date of the last normal menses:
I–3. Selected health characteristics of births (gestational age based on LMP), by race and Hispanic origin of mother: United States, final 2014 and preliminary 2015
I–4. Distribution of births born preterm (gestational age based on LMP): United States, final 2007 and 2014 and preliminary 2015
I–5. Births, by total cesarean delivery and low-risk cesarean delivery (gestational age based on LMP): United States and each state and territory, final 2014 and preliminary 2015
I–6. Preterm and late preterm births (gestational age based on LMP): United States and each state and territory, final 2014 and preliminary 2015
6 National Vital Statistics Reports, Vol. 65, No. 3, June 2, 2016
Table 1. Births and birth rates, by age of mother: United States, final 2014 and preliminary 2015 [Data for 2015 are based on a continuous file of records received from the states. Figures for 2015 are based on weighted data rounded to the nearest individual, so categories may not add to totals. Rates are per 1,000 women in specified age group. Rates for all ages are the total number of births (regardless of the age of the mother) per 1,000 women aged 15–44]
2015 2014
Age of mother Number Rate Number Rate
All ages. . . . . . . . . . . . . . . . . . . . . . . . . . . 3,977,745 62.5 3,988,076 62.9
10–14 . . . . . . . . . . . . . . . . . . . . . . . . . . . . 2,503 0.2 2,769 0.3 15–19 . . . . . . . . . . . . . . . . . . . . . . . . . . . . 229,888 22.3 249,078 24.2
15–17 . . . . . . . . . . . . . . . . . . . . . . . . . . 61,223 9.9 66,791 10.9 18–19 . . . . . . . . . . . . . . . . . . . . . . . . . . 168,665 40.7 182,287 43.8
20–24 . . . . . . . . . . . . . . . . . . . . . . . . . . . 851,142 76.9 882,567 79.0 25–29 . . . . . . . . . . . . . . . . . . . . . . . . . . . . 1,152,660 104.3 1,145,392 105.8 30–34 . . . . . . . . . . . . . . . . . . . . . . . . . . . . 1,093,898 101.4 1,081,058 100.8 35–39 . . . . . . . . . . . . . . . . . . . . . . . . . . . . 527,168 51.7 508,748 51.0 40–44 . . . . . . . . . . . . . . . . . . . . . . . . . . . 111,611 11.0 110,021 10.6 45–541 . . . . . . . . . . . . . . . . . . . . . . . . . . . 8,876 0.8 8,443 0.8
1The birth rate for women in this age group is computed by relating the number of births to women aged 45 and over to women aged 45–49, because most of the births in this group are to women aged 45–49.
NOTE: For information on the relative standard errors of the data and further discussion of random variation, see reference 6.
7 National Vital Statistics Reports, Vol. 65, No. 3, June 2, 2016
Table 2. Birth rates for women aged 10–19, by age of mother: United States, final 1991, 2007, and 2014, and preliminary 2015 [Data for 2015 are based on a continuous file of records received from the states. Figures for 2015 are based on weighted data rounded to the nearest individual. Rates are per 1,000 women in specified age group. Population based on counts estimated as of July 1 for all years]
Year Percent change
Age of mother 2015 2014 2007 1991 2014–2015 2007–2015 1991–2015
10–14 . . . . . . . . . . . . . . . . . . . . . . . . . . . . 0.2 0.3 0.6 1.4 –33 –67 –86 15–19 . . . . . . . . . . . . . . . . . . . . . . . . . . . 22.3 24.2 41.5 61.8 –8 –46 –64
15–17 . . . . . . . . . . . . . . . . . . . . . . . . . . 9.9 10.9 21.7 38.6 –9 –54 –74 18–19 . . . . . . . . . . . . . . . . . . . . . . . . . . 40.7 43.8 71.7 94.0 –7 –43 –57
NOTE: For information on the relative standard errors of the data and further discussion of random variation, see reference 6.
8 National Vital Statistics Reports, Vol. 65, No. 3, June 2, 2016
Table 3. Births, by race and Hispanic origin of mother: United States and each state and territory, preliminary 2015 [By place of residence. Data are based on a continuous file of records received from the states. Figures are based on weighted data rounded to the nearest individual, so categories may not add to totals]
Number
American Indian Asian or All races Non-Hispanic Non-Hispanic or Alaska Pacific Islander
Area and origins1 white2 black2 Native total2,3 total2,3 Hispanic4
United States5 . . . . . . . . . . . . . . . . . . . . . . . 3,977,745 2,129,657 589,605 44,328 281,306 922,836
Alabama . . . . . . . . . . . . . . . . . . . . . . . . . . 59,632 35,811 18,254 190 1,193 4,292 Alaska . . . . . . . . . . . . . . . . . . . . . . . . . . . 11,266 6,534 422 2,410 1,114 809 Arizona . . . . . . . . . . . . . . . . . . . . . . . . . . . 85,344 36,972 4,581 5,317 3,518 35,246 Arkansas . . . . . . . . . . . . . . . . . . . . . . . . . . 38,841 25,684 7,576 353 1,235 4,005 California . . . . . . . . . . . . . . . . . . . . . . . . . . 491,487 141,388 27,019 3,501 80,275 234,238 Colorado . . . . . . . . . . . . . . . . . . . . . . . . . . 66,530 40,833 3,454 803 2,973 18,132 Connecticut . . . . . . . . . . . . . . . . . . . . . . . . 35,754 20,401 4,440 97 2,499 8,275 Delaware . . . . . . . . . . . . . . . . . . . . . . . . . . 11,164 5,955 2,987 16 675 1,532 District of Columbia . . . . . . . . . . . . . . . . . . . . 9,583 2,979 4,800 16 500 1,330 Florida . . . . . . . . . . . . . . . . . . . . . . . . . . . 224,263 102,537 49,605 372 7,618 64,077
Georgia . . . . . . . . . . . . . . . . . . . . . . . . . . . 131,309 60,267 45,437 295 6,465 17,832 Hawaii . . . . . . . . . . . . . . . . . . . . . . . . . . . 18,395 4,785 577 35 11,441 2,770 Idaho . . . . . . . . . . . . . . . . . . . . . . . . . . . . 22,821 18,081 240 406 516 3,645 Illinois . . . . . . . . . . . . . . . . . . . . . . . . . . . . 158,081 85,401 27,159 209 10,221 33,893 Indiana . . . . . . . . . . . . . . . . . . . . . . . . . . . 83,995 63,426 10,343 120 2,524 7,634 Iowa. . . . . . . . . . . . . . . . . . . . . . . . . . . . . 39,494 32,037 2,503 241 1,364 3,420 Kansas . . . . . . . . . . . . . . . . . . . . . . . . . . . 39,143 28,227 2,911 330 1,483 6,300 Kentucky . . . . . . . . . . . . . . . . . . . . . . . . . . 55,945 46,302 5,278 89 1,317 3,004 Louisiana . . . . . . . . . . . . . . . . . . . . . . . . . . 64,542 33,972 24,006 392 1,498 4,810 Maine . . . . . . . . . . . . . . . . . . . . . . . . . . . . 12,605 11,558 463 143 186 251
Maryland . . . . . . . . . . . . . . . . . . . . . . . . . . 73,598 32,403 23,645 279 5,835 11,734 Massachusetts . . . . . . . . . . . . . . . . . . . . . . . 71,566 43,352 6,830 138 6,749 12,812 Michigan . . . . . . . . . . . . . . . . . . . . . . . . . . 113,501 79,053 21,895 782 4,304 7,449 Minnesota . . . . . . . . . . . . . . . . . . . . . . . . . 69,803 49,652 8,028 1,414 5,658 4,851 Mississippi . . . . . . . . . . . . . . . . . . . . . . . . . 38,390 19,634 16,416 259 556 1,612 Missouri . . . . . . . . . . . . . . . . . . . . . . . . . . 75,060 57,079 11,312 359 2,131 4,044 Montana . . . . . . . . . . . . . . . . . . . . . . . . . . 12,582 10,271 89 1,558 152 573 Nebraska . . . . . . . . . . . . . . . . . . . . . . . . . . 26,662 19,187 1,870 556 989 4,248 Nevada . . . . . . . . . . . . . . . . . . . . . . . . . . . 36,272 14,920 4,453 510 3,337 13,219 New Hampshire . . . . . . . . . . . . . . . . . . . . . . 12,417 10,907 237 26 526 639
New Jersey . . . . . . . . . . . . . . . . . . . . . . . . 103,203 46,559 15,221 179 11,992 28,694 New Mexico . . . . . . . . . . . . . . . . . . . . . . . . 26,012 7,241 476 3,479 525 14,515 New York. . . . . . . . . . . . . . . . . . . . . . . . . . 236,814 115,529 36,881 736 26,631 54,049 North Carolina . . . . . . . . . . . . . . . . . . . . . . . 120,815 67,091 28,869 1,976 5,858 18,091 North Dakota . . . . . . . . . . . . . . . . . . . . . . . 11,311 8,794 573 985 344 579 Ohio. . . . . . . . . . . . . . . . . . . . . . . . . . . . . 139,217 103,553 23,731 253 4,366 6,972 Oklahoma . . . . . . . . . . . . . . . . . . . . . . . . . 53,067 33,260 4,991 5,920 1,760 7,398 Oregon . . . . . . . . . . . . . . . . . . . . . . . . . . . 45,583 32,086 1,331 813 2,897 8,511 Pennsylvania. . . . . . . . . . . . . . . . . . . . . . . . 141,948 98,442 20,295 393 7,021 15,053 Rhode Island . . . . . . . . . . . . . . . . . . . . . . . 10,967 6,681 953 138 639 2,612
South Carolina . . . . . . . . . . . . . . . . . . . . . . 58,124 33,918 17,798 217 1,288 4,940 South Dakota . . . . . . . . . . . . . . . . . . . . . . . 12,331 9,061 328 2,163 322 559 Tennessee . . . . . . . . . . . . . . . . . . . . . . . . . 81,460 55,375 16,655 202 2,161 7,224 Texas . . . . . . . . . . . . . . . . . . . . . . . . . . . . 403,385 140,463 49,624 1,270 21,775 191,054 Utah. . . . . . . . . . . . . . . . . . . . . . . . . . . . . 50,779 38,473 644 700 1,875 7,876 Vermont . . . . . . . . . . . . . . . . . . . . . . . . . . 5,903 5,370 131 25 175 139 Virginia . . . . . . . . . . . . . . . . . . . . . . . . . . . 103,229 59,190 21,769 253 8,532 13,923 Washington . . . . . . . . . . . . . . . . . . . . . . . . 88,960 55,307 4,615 2,059 10,654 16,072 West Virginia . . . . . . . . . . . . . . . . . . . . . . . 19,797 18,448 698 27 225 330 Wisconsin . . . . . . . . . . . . . . . . . . . . . . . . . 67,034 49,017 7,099 1,029 3,276 6,603 Wyoming . . . . . . . . . . . . . . . . . . . . . . . . . . 7,758 6,190 87 294 135 963
See footnotes at end of table.
9 National Vital Statistics Reports, Vol. 65, No. 3, June 2, 2016
Table 3. Births, by race and Hispanic origin of mother: United States and each state and territory, preliminary 2015—Con. [By place of residence. Data are based on a continuous file of records received from the states. Figures are based on weighted data rounded to the nearest individual, so categories may not add to totals]
Number
American Indian Asian or All races Non-Hispanic Non-Hispanic or Alaska Pacific Islander
Area and origins1 white2 black2 Native total2,3 total2,3 Hispanic4
Puerto Rico . . . . . . . . . . . . . . . . . . . . . . . . 31,272 1,460 134 40 52 29,573 Virgin Islands . . . . . . . . . . . . . . . . . . . . . . . - - - - - - - - - - - - Guam . . . . . . . . . . . . . . . . . . . . . . . . . . . . 3,371 193 34 11 3,108 32 American Samoa . . . . . . . . . . . . . . . . . . . . . 1,058 - - - - – 1,057 - - Northern Marianas . . . . . . . . . . . . . . . . . . . . 384 1 – – 383 –
- - - Data not available. – Quantity zero. 1Includes births to race and origin groups not shown separately, such as white-Hispanic and black-Hispanic women, and births with origin not stated. 2Race and Hispanic origin are reported separately on birth certificates. Persons of Hispanic origin may be of any race. Race categories are consistent with the 1977 Office of Management and Budget (OMB) standards. Forty-nine states and the District of Columbia reported multiple race data in 2015. The multiple-race data for these states were bridged to the single race categories of the OMB standards for comparability with other states; see Technical Notes. 3Includes persons of Hispanic and non-Hispanic origin and origin not stated, according to the mother’s reported race; see Technical Notes. 4Includes all persons of Hispanic origin of any race; see Technical Notes. 5Excludes data for the territories.
NOTE: For information on the relative standard errors of the data and further discussion of random variation, see reference 6.
10 National Vital Statistics Reports, Vol. 65, No. 3, June 2, 2016
Table 4. Births and percentages of births to unmarried women, by age of mother and race and Hispanic origin of mother: United States, final 2014 and preliminary 2015 [Data for 2015 are based on a continuous file of records received from the states. Figures for 2015 are based on weighted data rounded to the nearest individual, so categories may not add to totals]
Number Percent
Characteristics 2015 2014 2015 2014
Age of mother
All ages1 . . . . . . . . . . . . . . . . . . . . . . . . . . 1,600,208 1,604,870 40.2 40.2 Under 20 . . . . . . . . . . . . . . . . . . . . . . . . . 206,530 223,386 88.9 88.7
Under 15 . . . . . . . . . . . . . . . . . . . . . . . . 2,490 2,752 99.5 99.4 15–19 . . . . . . . . . . . . . . . . . . . . . . . . . . 204,040 220,634 88.8 88.6
15–17 . . . . . . . . . . . . . . . . . . . . . . . . . 58,546 63,904 95.6 95.7 18–19 . . . . . . . . . . . . . . . . . . . . . . . . . 145,494 156,730 86.3 86.0
20–24 . . . . . . . . . . . . . . . . . . . . . . . . . . . . 560,494 579,760 65.9 65.7 25–29 . . . . . . . . . . . . . . . . . . . . . . . . . . . . 435,054 419,792 37.7 36.7 30–34 . . . . . . . . . . . . . . . . . . . . . . . . . . . . 251,962 243,054 23.0 22.5 35–39 . . . . . . . . . . . . . . . . . . . . . . . . . . . . 116,338 110,058 22.1 21.6 40 and over . . . . . . . . . . . . . . . . . . . . . . . . 29,831 28,820 24.8 24.3
Race and Hispanic origin of mother
Non-Hispanic white2 . . . . . . . . . . . . . . . . . . . 621,468 628,078 29.2 29.2 Non-Hispanic black2 . . . . . . . . . . . . . . . . . . . 415,029 417,518 70.4 70.9
American Indian or Alaska Native total2,3 . . . . . . . 29,156 29,529 65.8 65.7 Asian or Pacific Islander total2,3 . . . . . . . . . . . . 46,199 46,342 16.4 16.4 Hispanic4 . . . . . . . . . . . . . . . . . . . . . . . . . . 488,213 483,807 52.9 52.9
1Includes births to race and origin groups not shown separately, such as white-Hispanic and black-Hispanic women, and births with origin not stated. 2Race and Hispanic origin are reported separately on birth certificates. Persons of Hispanic origin may be of any race. Race categories are consistent with the 1977 Office of Management and Budget (OMB) standards. Forty-nine states and the District of Columbia reported multiple-race data in 2015. The multiple-race data for these states were bridged to the single-race categories of the OMB standards for comparability with other states; see Technical Notes. Multiple-race reporting areas vary for 2014–2015; see Technical Notes. 3Includes persons of Hispanic and non-Hispanic origin and origin not stated, according to the mother’s reported race; see Technical Notes. 4Includes all persons of Hispanic origin of any race; see Technical Notes.
NOTE: For information on the relative standard errors of the data and further discussion of random variation, see reference 6.
National Vital Statistics Reports, Vol. 65, No. 3, June 2, 2016 11
Table 5. Selected health characteristics of births, by race and Hispanic origin of mother: United States, final 2014 and preliminary 2015 [Data for 2015 are based on a continuous file of records received from the states. Figures for 2015 are based on weighted data rounded to the nearest individual]
Cesarean delivery Preterm Low birthweight
Total1 Low-risk2 Total3 Late4 Total5 Very low
birthweight6
Race and Hispanic origin of mother 2015 2014 2015 2014 2015 2014 2015 2014 2015 2014 2015 2014
All races and origins7 . . . . . . . . . . . . . . . . . . 32.0 32.2 25.7 26.0 9.62 9.57 6.87 6.82 8.07 8.00 1.39 1.40
Non-Hispanic white8 . . . . . . . . . . . . . . . . . . . Non-Hispanic black8 . . . . . . . . . . . . . . . . . . . American Indian or Alaska Native
total8,9 . . . . . . . . . . . . . . . . . . . . . . . . . . . Asian or Pacific Islander total8,9 . . . . . . . . . . . . Hispanic10 . . . . . . . . . . . . . . . . . . . . . . . . .
31.1 35.5
28.3 33.0 31.7
31.4 35.6
28.5 33.2 31.9
24.8 29.7
22.2 27.5 25.2
25.0 29.9
21.9 27.5 25.8
8.88 13.39
10.51 8.63 9.13
8.91 13.23
10.22 8.45 9.03
6.54 8.57
7.70 6.40 6.62
6.55 8.47
7.48 6.27 6.53
6.93 13.33
7.51 8.40 7.20
6.96 13.17
7.65 8.05 7.05
1.09 2.88
1.26 1.13 1.22
1.10 2.87
1.27 1.15 1.23
1All births by cesarean delivery per 100 live births. 2Defined as singleton, term (37 weeks or more of gestation based on obstetric estimate; see Technical Notes), vertex (not breech) cesarean deliveries to women having a first birth per 100 women delivering singleton, term, vertex first births. 3Born prior to 37 completed weeks of gestation based on the obstetric estimate; see Technical Notes. 4Born between 34 and 36 completed weeks of gestation based on the obstetric estimate; see Technical Notes. 5Birthweight of less than 2,500 grams (5 lb 8 oz). 6Birthweight of less than 1,500 grams (3 lb 4 oz). 7Includes births to race and origin groups not shown separately, such as white-Hispanic and black-Hispanic women, and births with origin not stated. 8Race and Hispanic origin are reported separately on birth certificates. Persons of Hispanic origin may be of any race. Race categories are consistent with the 1977 Office of Management and Budget (OMB) standards. Forty-nine states and the District of Columbia reported multiple-race data in 2015. The multiple-race data for these states were bridged to the single-race categories of the OMB standards for comparability with other states; see Technical Notes. Multiple-race reporting areas vary for 2014–2015; see Technical Notes. 9Includes persons of Hispanic and non-Hispanic origin and origin not stated, according to the mother’s reported race; see Technical Notes. 10Includes all persons of Hispanic origin of any race; see Technical Notes.
NOTE: For information on the relative standard errors of the data and further discussion of random variation, see reference 6.
Table 6. Distribution of births born preterm: United States, final 2007 and 2014 and preliminary 2015 [Data for 2015 are based on a continuous file of records received from the states. Figures for 2015 are based on weighted data rounded to the nearest individual]
Gestational age (weeks)1 2015 2014 2007
Percent
Under 32 . . . . . . . . . . . . . . . . . . . . . . . . . 1.58 1.60 1.71 32–33 . . . . . . . . . . . . . . . . . . . . . . . . . . . 1.17 1.15 1.22
Total under 34 . . . . . . . . . . . . . . . . . . . . . 2.75 2.75 2.93 34–36 . . . . . . . . . . . . . . . . . . . . . . . . . . . 6.87 6.82 7.51
Total under 37 . . . . . . . . . . . . . . . . . . . . . 9.62 9.57 10.44
1Completed weeks of gestation based on the obstetric estimate; see Technical Notes.
NOTES: Preterm births are those born prior to 37 completed weeks of gestation. For information on the relative standard errors of the data and further discussion of random variation, see reference 6.
12 National Vital Statistics Reports, Vol. 65, No. 3, June 2, 2016
Table 7. Total count of records and completeness of preliminary file of live births: United States and each state and territory, preliminary 2015 [By place of occurrence. Data are based on a continuous file of records received from the states]
Live births
Area Counts of records Percent completeness
United States1 . . . . . . . . . . . . . . . . . . . . . . . 3,969,359 99.533
Alabama . . . . . . . . . . . . . . . . . . . . . . . . . . 58,007 100.000 Alaska . . . . . . . . . . . . . . . . . . . . . . . . . . . 11,160 100.000 Arizona . . . . . . . . . . . . . . . . . . . . . . . . . . . 86,390 100.000 Arkansas . . . . . . . . . . . . . . . . . . . . . . . . . . 37,538 100.000 California . . . . . . . . . . . . . . . . . . . . . . . . . . 492,284 99.956 Colorado . . . . . . . . . . . . . . . . . . . . . . . . . . 67,109 100.000 Connecticut . . . . . . . . . . . . . . . . . . . . . . . . 37,238 99.954 Delaware . . . . . . . . . . . . . . . . . . . . . . . . . . 11,506 100.000 District of Columbia. . . . . . . . . . . . . . . . . . . . 14,609 100.000 Florida . . . . . . . . . . . . . . . . . . . . . . . . . . . 224,522 100.000
Georgia . . . . . . . . . . . . . . . . . . . . . . . . . . . 132,635 100.000 Hawaii . . . . . . . . . . . . . . . . . . . . . . . . . . . 18,416 99.935 Idaho . . . . . . . . . . . . . . . . . . . . . . . . . . . . 22,469 100.000 Illinois . . . . . . . . . . . . . . . . . . . . . . . . . . . . 154,156 100.000 Indiana . . . . . . . . . . . . . . . . . . . . . . . . . . . 84,933 99.978 Iowa. . . . . . . . . . . . . . . . . . . . . . . . . . . . . 39,479 99.985 Kansas . . . . . . . . . . . . . . . . . . . . . . . . . . . 40,228 100.000 Kentucky . . . . . . . . . . . . . . . . . . . . . . . . . . 53,373 99.811 Louisiana . . . . . . . . . . . . . . . . . . . . . . . . . . 64,608 99.981 Maine . . . . . . . . . . . . . . . . . . . . . . . . . . . . 12,382 99.992
Maryland . . . . . . . . . . . . . . . . . . . . . . . . . . 70,300 100.000 Massachusetts. . . . . . . . . . . . . . . . . . . . . . . 72,077 100.000 Michigan . . . . . . . . . . . . . . . . . . . . . . . . . . 111,845 99.418 Minnesota . . . . . . . . . . . . . . . . . . . . . . . . . 69,062 100.000 Mississippi . . . . . . . . . . . . . . . . . . . . . . . . . 37,580 100.000 Missouri . . . . . . . . . . . . . . . . . . . . . . . . . . 76,122 99.926 Montana . . . . . . . . . . . . . . . . . . . . . . . . . . 12,521 100.000 Nebraska . . . . . . . . . . . . . . . . . . . . . . . . . . 27,110 100.000 Nevada . . . . . . . . . . . . . . . . . . . . . . . . . . . 35,924 100.000 New Hampshire . . . . . . . . . . . . . . . . . . . . . . 12,476 100.000
New Jersey . . . . . . . . . . . . . . . . . . . . . . . . 88,903 88.223 New Mexico . . . . . . . . . . . . . . . . . . . . . . . . 24,048 98.155 New York. . . . . . . . . . . . . . . . . . . . . . . . . . 237,800 99.997
New York excluding New York City . . . . . . . . . 116,227 99.995 New York City . . . . . . . . . . . . . . . . . . . . . 121,573 100.000
North Carolina . . . . . . . . . . . . . . . . . . . . . . . 122,642 100.000 North Dakota . . . . . . . . . . . . . . . . . . . . . . . 12,839 100.000 Ohio. . . . . . . . . . . . . . . . . . . . . . . . . . . . . 140,014 100.000 Oklahoma . . . . . . . . . . . . . . . . . . . . . . . . . 51,834 99.981 Oregon . . . . . . . . . . . . . . . . . . . . . . . . . . . 46,016 99.972
Pennsylvania. . . . . . . . . . . . . . . . . . . . . . . . 139,899 99.256 Rhode Island . . . . . . . . . . . . . . . . . . . . . . . 11,524 100.000 South Carolina . . . . . . . . . . . . . . . . . . . . . . 54,734 99.991 South Dakota . . . . . . . . . . . . . . . . . . . . . . . 12,963 100.000 Tennessee . . . . . . . . . . . . . . . . . . . . . . . . . 83,171 95.431 Texas . . . . . . . . . . . . . . . . . . . . . . . . . . . . 412,382 99.988 Utah. . . . . . . . . . . . . . . . . . . . . . . . . . . . . 51,721 99.996 Vermont . . . . . . . . . . . . . . . . . . . . . . . . . . 5,720 100.000 Virginia . . . . . . . . . . . . . . . . . . . . . . . . . . . 102,110 99.990 Washington . . . . . . . . . . . . . . . . . . . . . . . . 88,880 100.000
West Virginia . . . . . . . . . . . . . . . . . . . . . . . 20,326 99.608 Wisconsin . . . . . . . . . . . . . . . . . . . . . . . . . 66,669 100.000 Wyoming . . . . . . . . . . . . . . . . . . . . . . . . . . 7,105 99.958
Puerto Rico . . . . . . . . . . . . . . . . . . . . . . . . 31,204 99.534 Virgin Islands . . . . . . . . . . . . . . . . . . . . . . . - - - - - -Guam . . . . . . . . . . . . . . . . . . . . . . . . . . . . 2,968 88.045 American Samoa . . . . . . . . . . . . . . . . . . . . . 905 85.539 Northern Marianas . . . . . . . . . . . . . . . . . . . . 866 84.902
- - - Data not available. 1Excludes data for Puerto Rico, Virgin Islands, Guam, American Samoa, and Northern Marianas.
NOTE: Percent completeness = Number of records in preliminary file * 100 / Count of records.
National Vital Statistics Reports, Vol. 65, No. 3, June 2, 2016 13
Technical Notes
Nature and sources of data Preliminary data for 2015 are based on nearly all births for that
year (99.53%) (Table 7), with levels for 27 states and the District of Columbia at 100%. Preliminary 2015 data are based on the continuous receipt and processing of statistical records through February 11, 2016, by the National Center for Health Statistics (NCHS). NCHS receives the data from the state’s vital registration systems through the Vital Statistics Cooperative Program. In this report, U.S. totals include only events occurring within the 50 states and the District of Columbia. Data for Puerto Rico, Guam, American Samoa, and Northern Marianas are included in tables showing data by state, but are not included in U.S. totals (Tables 3 and 7, and see state-specific Internet tables at http://www.cdc.gov/nchs/data/nvsr/nvsr65/nvsr65_ 03_tables.pdf). Data for the Virgin Islands were not available as of the release of the 2015 preliminary file. Accordingly, data for this territory are not included in this report. (NOTE: For releases of preliminary birth data prior to 2014, a criterion of at least 75% of a state’s records for the year was used (6). Starting with the release of the 2014 preliminary birth data, a criterion of at least 85% of a state’s records for the year was used.) Detailed information on reporting completeness and imputation procedures may be found in ‘‘User Guide to the 2014 Natality Public Use File’’ (7).
To produce the preliminary estimates shown in this report, records in the file were weighted using independent control counts of all 2014 births by state of occurrence. Detailed information on weighting and the reliability of estimates is also available elsewhere (6).
1989 and 2003 U.S. Standard Certificates of Live Birth
This report includes selected 2015 data on items that are collected on both the 1989 revision of the U.S. Standard Certificate of Live Birth (unrevised) and the 2003 revision of the U.S. Standard Certificate of Live Birth (revised). The 2003 revision is described in detail elsewhere (2,7–9). Forty-eight states (Alabama, Alaska, Arizona, Arkansas, California, Colorado, Delaware, Florida, Georgia, Hawaii, Idaho, Illinois, Indiana, Iowa, Kansas, Kentucky, Louisiana, Maine, Maryland, Massachusetts, Michigan, Minnesota, Mississippi, Missouri, Montana, Nebraska, Nevada, New Hampshire, New Mexico, New York, North Carolina, North Dakota, Ohio, Oklahoma, Oregon, Pennsylvania, Rhode Island, South Carolina, South Dakota, Tennessee, Texas, Utah, Vermont, Virginia, Washington, West Virginia, Wisconsin, and Wyoming); the District of Columbia; Guam; Puerto Rico; and Northern Marianas had implemented the revised birth certificate as of January 1, 2015. One additional state, New Jersey, which implemented the revised birth certificate starting in 2014, but after January 1 (in July) and only for selected facilities, had not completed the implementation of the revised birth certificate as of January 1, 2015. The 48 revised states and the District of Columbia that implemented the revision as of January 1, 2015, represent 96.5% of all births in 2015.
Data items exclusive to either the 1989 or the 2003 birth certificate revisions are not shown in this report. A forthcoming report and data release based on 2015 final data will present selected data exclusive to the 2003 revised certificate.
Age of mother For information on and discussion of age of mother, see ‘‘User
Guide to the 2014 Natality Public Use File’’ (7).
Hispanic origin and race
Hispanic origin
Hispanic origin and race are reported separately on the birth certificate. Data shown by race (i.e., American Indian or Alaska Native and Asian or Pacific Islander) include persons of Hispanic or non-Hispanic origin, and data for Hispanic origin include all persons of Hispanic origin of any race. Data for non-Hispanic persons are shown separately for white mothers and black mothers, given the substantial differences in fertility and maternal and infant health characteristics between Hispanic and non-Hispanic white women and Hispanic and non-Hispanic black women. Items asking for the Hispanic origin of the mother have been included on the birth certificates of all states and the District of Columbia, the Virgin Islands, and Guam since 1993, on the birth certificate of Puerto Rico starting in 2005, and on the birth certificate of Northern Marianas starting in 2010 (7). American Samoa does not collect this information.
Single, multiple, and ‘‘bridged’’ race
The 2003 revision of the U.S. Standard Certificate of Live Birth allows the reporting of more than one race (multiple races) for each parent (8), in accordance with the revised standards issued by the Office of Management and Budget (OMB) in 1997 (10). Information on this change is presented elsewhere (8,11–14).
In 2015, the multiple-race reporting areas were the 48 fully revised states (see ‘‘1989 and 2003 U.S. Standard Certificates of Live Birth’’ section above) and the District of Columbia, as well as New Jersey, which was not fully revised as of January 1, 2015. Puerto Rico, which revised its birth certificate in 2005, began to report race according to the 2003 revision in 2015. The 49 states and the District of Columbia accounted for 99.1% of U.S. births in 2015. Data from the vital records of the remaining 2 areas, Connecticut (which has not implemented the revised birth certificate) and unrevised parts of New Jersey, are based on the 1989 revision of the certificate that follows the 1977 OMB standard, allowing only a single race to be reported (11,12).
To provide uniformity and comparability of the data during the transition period, before all or most of the data are available in the new multiple-race format, it was necessary to ‘‘bridge’’ the responses of those who reported more than one race (multiple races) to one single race. The bridging procedure for multiple-race mothers and fathers is based on the procedure used to bridge the multiple-race population estimates (12–14). Information detailing the processing and tabulation of data by race is presented elsewhere (7). A previous report describes multiple-race birth data for 2003 (15).
Marital status For information on and discussion of marital status, see ‘‘User
Guide to the 2014 Natality Public Use File’’ (7).
14 National Vital Statistics Reports, Vol. 65, No. 3, June 2, 2016
Method of delivery, gestation, and birthweight For information on and discussion of method of delivery and
birthweight, see ‘‘User Guide to the 2014 Natality Public Use File’’ (7). Beginning with the 2014 data year, NCHS transitioned to a new
standard for estimating the gestational age of the newborn. The new measure—the obstetric estimate of gestation at delivery (OE)— replaces the measure based on the date of the last normal menses (LMP) (3). Accordingly, gestational age data shown in this report are based on the OE. However, LMP-based data are also available for all relevant report tables from: http://www.cdc.gov/nchs/data/nvsr/ nvsr65/nvsr65_03_tables.pdf. National data based on OE data are available only from data year 2007 forward. Gestational age estimates differ somewhat between the OE- and LMP-based measures. For example, the 2015 OE-based preterm birth rate for the United States is 9.62%, compared with the LMP-based rate of 11.29%. In general, both measures show similar trends in the rate of preterm birth from 2007 to 2014. Information on and discussion of the reasons for the change, and a detailed comparison of the two measures, are presented elsewhere (3).
Population denominators U.S. national birth and fertility rates for 2015 shown in this report
are based on population estimates derived from the 2010 census as of July 1, 2015 (16).
Information on the national estimates of births to unmarried women (i.e., methods of determining marital status) and the computation of preliminary birth rates for unmarried women is presented elsewhere (2,7,17). The birth rate for unmarried women for 2015 is estimated based on the population distributions by marital status, derived from the 2015 March (Annual Social and Economic) Supplement of the U.S. Census Bureau, and applied to the national population estimates as of July 1, 2015, which are derived from the 2010 census (16–18).
Postcensal population estimates by age, sex, and race and Hispanic origin for 2015 at the national and state levels were not available as of the preparation of this report. Accordingly, birth and fertility rates by race and Hispanic origin and fertility rates by state could not be shown in this report. These rates will be shown in the 2015 final birth report.
Computing rates and percentages and reliabilityof estimates
For information on and further discussion of computing rates and percentages and the relative standard errors of the data, see ‘‘Births: Preliminary Data for 2005’’ (6).
U.S. DEPARTMENT OF HEALTH & HUMAN SERVICES
Centers for Disease Control and Prevention National Center for Health Statistics 3311 Toledo Road, Room 5419 Hyattsville, MD 20782–2064
FIRST CLASS MAIL POSTAGE & FEES PAID
CDC/NCHS PERMIT NO. G-284
OFFICIAL BUSINESS PENALTY FOR PRIVATE USE, $300
For more NCHS NVSRs, visit: http://www.cdc.gov/nchs/products/nvsr.htm.
National Vital Statistics Reports, Vol. 65, No. 3, June 2, 2016
Contents
Abstract . . . . . . . . . . . . . . . . . . . . . . . . . . . . . . . . . . . . . . . . . . . . 1 Introduction . . . . . . . . . . . . . . . . . . . . . . . . . . . . . . . . . . . . . . . . . . 2 Results . . . . . . . . . . . . . . . . . . . . . . . . . . . . . . . . . . . . . . . . . . . . . 2
Births and birth rates . . . . . . . . . . . . . . . . . . . . . . . . . . . . . . . . . . . 2 Maternal and infant health characteristics . . . . . . . . . . . . . . . . . . . . . . . 4
References . . . . . . . . . . . . . . . . . . . . . . . . . . . . . . . . . . . . . . . . . . 5 List of Detailed Tables . . . . . . . . . . . . . . . . . . . . . . . . . . . . . . . . . . . . 5 List of Internet Tables . . . . . . . . . . . . . . . . . . . . . . . . . . . . . . . . . . . . 5 Technical Notes . . . . . . . . . . . . . . . . . . . . . . . . . . . . . . . . . . . . . . . 13
Acknowledgments
This report was prepared under the general direction of Delton Atkinson, Director of the Division of Vital Statistics (DVS) and Amy M. Branum, Chief of the Reproductive Statistics Branch (RSB). Rajesh Virkar, Chief of the Information Technology Branch (ITB); and Steve J. Steimel, Annie S. Liu, and Li Lu of ITB provided computer programming and analysis support. Sharon E. Kirmeyer of RSB provided content review. Staff of the Data Acquisition, Classification, and Evaluation Branch carried out quality evaluation and acceptance procedures for the state data files on which this report is based. The Registration Methods staff of DVS consulted with state vital statistics offices regarding the collection of birth certificate data. This report was edited and produced by NCHS Office of Information Services, Information Design and Publishing Staff: Danielle Woods edited the report; typesetting was done by Jacqueline M. Davis; and graphics were produced by Erik Richardson (contractor).
Suggested citation
Hamilton BE, Martin JA, Osterman MJK. Births: Preliminary data for 2015. National vital statistics reports; vol 65 no 3. Hyattsville, MD: National Center for Health Statistics. 2016.
Copyright information
All material appearing in this report is in the public domain and may be reproduced or copied without permission; citation as to source, however, is appreciated.
National Center for Health Statistics
Charles J. Rothwell, M.S., M.B.A., Director Jennifer H. Madans, Ph.D., Associate Director
for Science
Division of Vital Statistics
Delton Atkinson, M.P.H., M.P.H., P.M.P., Director Hanyu Ni, Ph.D., M.P.H., Associate Director
for Science
For e-mail updates on NCHS publication releases, subscribe online at: http://www.cdc.gov/nchs/govdelivery.htm. For questions or general information about NCHS: Tel: 1–800–CDC–INFO (1–800–232–4636) • TTY: 1–888–232–6348
Internet: http://www.cdc.gov/nchs • Online request form: http://www.cdc.gov/info
DHHS Publication No. 2016–1120 • CS265283